Article

Ammonia and Nitrous Oxide Emissions from Dairy Cows on Straw-Based Litter Systems

by
João G. R. Almeida
1,
Elise Lorinquer
2,
Paul Robin
3,
Henrique M. N. Ribeiro-Filho
1 and
Nadège Edouard
4,*
1
Departamento de Producao Animal e Alimentos CAV, Universidade do Estado de Santa Catarina, Lages 88520-000, Brazil
2
Institut de l’Elevage, 149 Rue de Bercy, 75012 Paris, France
3
INRAE, SAS, Institut Agro-Rennes-Angers, 35000 Rennes, France
4
PEGASE, INRAE, Institut Agro, 35590 Saint Gilles, France
*
Author to whom correspondence should be addressed.
Submission received: 27 January 2022 / Accepted: 2 February 2022 / Published: 8 February 2022

Abstract

:
Increasing concerns regarding environmental impacts of animal production require a better understanding of the factors that influence nitrogen (N) excretion by animals and the processes that influence N volatilization into ammonia (NH3) and nitrous oxide (N2O) from manure. The objective of this study was to evaluate the influence of diet characteristics and climatic factors on manure composition, as well as the resulting NH3 and N2O emissions in the barn and during storage of a straw-based litter system. Two groups of three dairy cows were housed in mechanically ventilated rooms and fed with a grass-based diet (GD) or a total mixed diet (MD). The resulting solid manures were stored in ventilated tunnels. The experiment was conducted in autumn (AUT) and spring (SPR). NH3 and N2O emissions were recorded continuously (28 days in the barn, 85 days for storage). NH3–N emissions in the barn were higher for GD-AUT than for MD-AUT, which was consistent with the larger and unbalanced amount of crude and degradable protein in GD, and corroborated by higher milk urea N contents. More than 80% of the NH3–N volatilization occurred during the first week of manure storage, when the temperature of the manure heap peaked. N2O–N emissions were negligible in the barn. During storage, N2O–N emissions peaked immediately after the first week. Higher N2O–N emissions were related to higher rainfall, which may have increased the moisture content and decreased the temperature of the manure heap, thus generating the conditions necessary for nitrification and denitrification processes.

1. Introduction

Animal production systems must address the environmental impacts caused by their practices. Nitrogen (N) deposition in the terrestrial ecosystem has increased in recent decades, which is a subject of significant concern. Effects of excess N include soil acidification, water eutrophication, and greenhouse gas emissions. The main N gases involved in these processes are ammonia (NH3) and nitrous oxide (N2O), which partly originate from animal excreta. Therefore, factors that influence the amount of N excreted by animals, processes that influence N volatilization from manure, as well as the emission factors of these gases, must be better understood and predicted in a variety of production systems.
In deep-litter systems, which still represent a large proportion of housing systems in France, the UK, and Eastern Europe [1], manure is mixed with the litter and accumulates under the animals for a few weeks. In addition, the oxygen level decreases as depth increases. The solid organic compound that results from combining the substrate used as bedding (e.g., wood shavings, straw) with feces and urine excreted by the animals in the barn can undergo several processes, such as aerobic/anaerobic degradation of organic matter, urea hydrolysis, nitrification–denitrification, and N immobilization [2]. These processes depend on animal behavior and use of space, temperature, moisture content, the carbon (C):N ratio, pH, oxygen level, and the physical structure of the organic substrate. In the literature, conflicting results are reported, as solid manure is described to emit less NH3–N than liquid manure at the barn level [3,4,5] or more [6,7]. However, all of these studies were conducted in contrasting environmental conditions, herd sizes, diets, methodological approaches, and manure management practices. These complex interactions among microbial, biochemical, and physical processes lead to highly variable NH3 and N2O emissions (e.g., 30 ± 20 g NH3–N d–1 animal place–1 and 2 ± 2 g N2O–N d–1 animal place–1 [6]).
The resulting solid manure is removed from the barn, usually stored for a few weeks or months, and then used to fertilize soils. During storage, the organic N is degraded into ammonium by microorganisms, including bacteria and fungi. Part of this N is lost as NH3 by volatilization or is converted into gases, such as N2O or N2 via nitrification and denitrification [8]. The percentage of initial N present in a manure heap lost through these gases varies significantly, with NH3 volatilization ranging from 4–77% and N2O volatilization ranging from 0.2–9.9%, depending on the livestock production system and manure treatment practice [9,10,11]. These losses are usually influenced by factors that increase the initial N content, as well as physical and chemical factors related to the storage phase [6,12].
Measurements of NH3 and N2O emissions from solid livestock manure remain rare in the literature and vary in their associated management characteristics (e.g., frequency and amount of substrate added to the bedding, accumulation time, animal type, feeding system). In particular, changes in the nature (e.g., type of forage, amount of concentrate) and composition (e.g., dry matter (DM) and N content) of the diets provided to ruminants can influence excreta composition, which has a major influence on the physical and chemical processes that occur in deep-litter systems, both in the barn and during storage. These changes have been shown to influence N gas emissions directly in the barn: Urinary urea-N excretion for a high-N diet (18% crude protein (CP)) was 3 times as high for a low-N diet (12% CP), while NH3–N emissions from the straw-based deep litter accumulated over 4 weeks were 4.5 times as high [13]. Similarly, N gas loss from deep-litter manure stored for 7 weeks decreased from 10.6% to less than 1% of the initial N when the diet CP was reduced from 17.5% to 15.0%, respectively [12].
The objective of this study was to evaluate the influence of dairy cattle diet on manure composition, as well as the resulting NH3 and N2O emissions in the barn and during storage of straw-based deep litter. To emphasize the influence of varying manure moisture and N contents, cows were fed with contrasting, although typical, diets: A grass-based diet or a total mixed diet composed of maize silage and concentrate. Since climatic factors strongly influence N gas emissions from manure [14,15], the experiment was conducted in two contrasting seasons: Housing in autumn and storage in winter vs. housing in spring and storage in summer. Since the season also influences the quality of grass and the cow lactation stage, the resulting diet–season combinations were considered as four different treatments, with no ability to isolate the effects of diet or season. Nonetheless, this study provides new insights into NH3 and N2O emissions from solid manure management in contrasting situations.

2. Materials and Methods

The experiment was conducted at the National Research Institute for Agriculture, Food and Environment INRAE experimental dairy farm in Méjusseaume (Le Rheu, Britany, France). Measurements were taken during two periods: Autumn–winter 2014 (AUT) and spring–summer 2015 (SPR). In each period, the first experimental phase consisted of measuring gas emissions from a straw-based deep-litter system that accumulated for 4 weeks under lactating dairy cattle fed with contrasting diets. The second experimental phase involved measuring gas emissions during storage of the resulting solid manure.

2.1. Ammonia and Nitrous Oxide Emissions in the Barn from Dairy Cows on Straw-Based Deep Litter

The first experimental phase was performed from 20 October to 17 November 2014 (AUT) and from 13 April to 11 May 2015 (SPR). In both seasons, two closed and mechanically ventilated experimental rooms with negative air pressure and a controlled air-conditioning system (temperature maintained at ca. 16 °C) were prepared to house two groups of three cows on straw-based deep litter (Figure 1). Cows were milked in the rooms twice per day (07:00 and 17:00) and weighed on the first and last day of each 4-week period. In both rooms, the three cows could move freely within a 40 m2 area. Straw was spread evenly on the floor each day (80 kg on the first day, 40 kg/d thereafter, representative of French standard conditions), and litter accumulated below the animals for 4 weeks. Liquids were collected continuously in the 1% sloping central gutter below the deep litter (Figure 1). The solid manure was removed from the rooms after 4 weeks to immediately begin the second phase of the experiment.

2.1.1. Animals and Treatments

For each season, six Holstein dairy cows (not the same cows in AUT and SPR) were divided into two homogeneous groups of three based on their body weight (AUT: 566 ± 41 kg body weight; SPR: 588 ± 19 kg body weight) and lactation characteristics. The cows were on their 1st (7 cows), 2nd (4 cows) or 3rd (1 cow) lactation. In addition, the cows used in AUT were in late lactation (days in milk = 348 ± 38), while those used in SPR were in mid-lactation (days in milk = 208 ± 18).
In each season, one group received a grass-based diet (GD), while the other group received a total mixed diet composed of maize silage and concentrate (MD), without inversion. The GD diet in autumn (GD-AUT) consisted of a 70:30 mixture of fresh grass and grass hay (lower grass growth due to poor weather conditions prevented the offering of 100% fresh grass). Fresh grass was cut in the pasture in the morning and given to the cows at the trough in the room in six meals per day (6:30, 08:30, 10:30, 12:30, 14:30, 16:30). Hay was given once per day at 18:00. The GD diet in spring (GD-SPR) consisted of 100% fresh grass cut from the pasture in the morning and given in seven meals per day (6:30, 08:30, 10:30, 12:30, 14:30, 16:30, 18:00). The MD diet in both seasons (AUT and SPR) consisted of a 75:25 mixture of maize silage and concentrate and was given to the cows twice per day (08:00 and 17:00). All of the diets were offered ad libitum (constant access to the trough, with refusal maintained at 5–10% of the feed offered). In addition, the cows were given continuous access to water2.1.2. Animal, Diet, and Litter Measurements.
The offered and refused feed were weighed precisely and sampled each day to determine the DM content (80 °C for 48 h) to assess the cow DM intake. The mean daily DM intake was calculated at the group level since all of the three cows had access to the three troughs. The average samples of feeds were analyzed for organic matter concentration (ashing at 500 °C for 6 h), total N concentration (Dumas method), and NDF, ADF, and ADL (Van Soest method) (Table 1). The daily water intake was recorded at the group level by mechanical water meters. Dietary contents of PDIE and PDIN (true protein absorbable in the small intestine when rumen-fermentable energy or N, respectively, is limiting in the rumen) and net energy for lactation were calculated based on INRAE recommendations [16] (Table 1).
The individual milk yield was monitored each day throughout the experiment. Morning and evening milk samples were collected 3 days per week to analyze protein and fat contents via infrared analysis. Milk total N (Dumas method) and urea (colorimetric enzymatic reaction) contents were assessed for each cow once per week (both milk samples were pooled).
The temperature of the deep litter was measured at a depth of 10 cm once per week using a stick temperature probe (HI 935005, Hana Instruments, Tanneries, France). For this, the litter surface was visually divided into six equal zones, three measurements were taken in each, and the 18 temperature measurements were averaged to obtain one mean temperature per week.

2.1.2. Gas Emission Measurements

Gas emissions, temperature, and humidity in the rooms were continuously measured throughout all of the periods. Air samples were continuously collected in each isolated room at the air entrance (1 sampling point per inlet per room) and extraction ducts (1 sampling point per outlet per room, see Figure 1) to calculate a gradient. An infrared photoacoustic analyzer (INNOVA 1412, Air Tech Instruments, Ballerup, Denmark) was coupled with a sampler-doser (INNOVA 1303, Air Tech Instruments, Ballerup, Denmark) to measure the concentrations of NH3, CO2, CH4, N2O, H2O, and ethanol (C2H6O). This configuration was chosen to compensate for the interferences between NH3 and other volatile molecules (e.g., C2H6O; [17]). The instrument was internally corrected for signal interferences from the gases measured (optical filter/detection limit: NH3 979/0.5 ppm; CO2 982/1.5 ppm; CH4 969/0.4 ppm; N2O 985/0.03 ppm). It was calibrated once by the manufacturer prior to the Autumn measurements. The air samples were extracted from the experimental rooms into the analyzer through 3 mm PTFE (Teflon®, Dutscher, Brussels, Belgium) sampling lines (20 m long for the farthest sampling points) that were protected with dust filters, insulated, and heated to avoid water condensation, following the methodology described in Hassouna et al. [18]. The analyzer sampled the air and measured gas concentrations at 2-min intervals (1 min for measurement, 1 min for flushing the sampling tubes and measurement chamber). Each location (inlet and outlet of each room) was successively analyzed for 15 min, the first two measurements were excluded to address the potential pollution from one location to the next (N = 5 concentration measurements per hour per location, averaged to express as the mean values per hour).
The extraction duct continuously extracted air at a constant rate that did not fluctuate as a function of ambient temperature. The flow rate (Q, in m3 h–1 cow–1) in each experimental room was determined in a previous experiment [13] using the tracer ratio method (SF6) and the constant-dosing approach (not performed when measuring gas concentrations since it required another INNOVA analyzer with the suitable configuration of filters to measure SF6 concentrations) [19]. The flow rate was calculated as a function of time (t) from the rate of tracer release (φT, in m3 h–1) and the indoor tracer concentrations (CT inside, in mg m–3) after correction for the background concentration of the tracer (CT outside, in mg m–3) [20]:
Qt = φTt/(CT insidet – CT outsidet)
The ventilation rate was 702 ± 65 and 763 ± 80 m3 h–1 per cow in the room with the GD or MD treatment, respectively. Flow rates and gas concentrations were expressed as mean values per hour. Gas emissions were calculated by multiplying the ventilation rate by gas concentration gradients (corrected from the basal concentrations in the room without animals, in mg m-3) and were expressed as cumulative gas emissions per cow per day. Emissions were reported as NH3–N and N2O–N and were validated based on element mass balances [18]. Water, carbon, and nitrogen mass balances (output/input in %) were all comprised between 80% and 120%.

2.2. Ammonia and Nitrous Oxide Emissions during Storage of the Solid Manure

The second experimental phase was performed from 17 November 2014 to 09 February 2015 (AUT) and from 11 May to 03 August 2015 (SPR). Immediately after the end of the first phase of the experiment, the accumulated straw and manure were removed from the barns, weighed, and deposited at a storage site (Figure 2 and Figure 3). Two storage areas had been prepared (flattened and covered with sand) and protected with a plastic canvas (commonly used to cover maize silage) to avoid direct contact between the manure and soil. Areas for the solid manure heaps were enclosed with wooden beams to contain the percolating liquid. Due to the natural slope of the soil, liquids were directed toward the front of the heap and continuously collected through PVC pipes down to storage tanks (Figure 2).
The same system described by Lorinquer et al. [21] was used to monitor gas emissions: A greenhouse structure 6.4 m wide × 8.0 m long that was used to create a ventilated tunnel to measure gas emissions, according to Hassouna and Eglin [18]. The greenhouse structures were covered with a plastic canvas during the measurement periods (Figure 3). The manure heaps remained covered in the ventilated tunnels throughout the first week. After the first week, the manure heaps were covered only for 48 h at weekly intervals, for 14 weeks of collection. The remainder of the time, the heaps were uncovered to experience the influence of normal weather conditions. For each manure heap, air composition was measured at the entrance and exit of the tunnel when covered. The gases analyzed were the same as those in the first experimental phase (NH3, CO2, CH4, N2O, H2O, and C2H6O), using the same analyzer (INNOVA 1412, Air Tech Instruments, Ballerup, Denmark) coupled with a sampler-doser (INNOVA 1303, Air Tech Instruments, Ballerup, Denmark) and the same configuration.
The gas concentration gradient was calculated as the concentration at the exit of the tunnel minus the concentration at the entrance. Each tunnel was equipped with an air exhaust fan (FANCOM AT, M, 35–56, Panningen, The Netherlands) to maintain a constant flow in the tunnel. Airflow stability was verified using hot-wire anemometers (TSI 8470, TH-Industrie, Paris, France) placed in the suction window of the column that contained the air exhaust fan. The airflow was progressively decreased (from ca. 3000 to 700 m3 h–1) to maintain an observable concentration gradient, given the decrease in gas emissions over time. Therefore, the incoming air velocity progressively decreased, but always exceeded 1 m s–1.
The gas concentration gradient was multiplied by the airflow rate of the fans, which was frequently verified using hot-wire anemometers (TSI 8470, TH-industrie, Paris, France), to obtain the emission rates. This procedure was used to calculate emissions when the heaps remained covered. Emissions were measured every 24 h during these days. For days without measurements (uncovered heaps), daily emission rates were estimated using linear interpolation between pre- and post-48 h means. These values were used to calculate cumulative gas emissions over the entire period.
The temperature of the manure heaps was monitored via continuous measurements using three thermocouples placed at three heights (30, 60, and 90 cm above the ground level) that were connected to a data-acquisition center (CR3000, Campbell Scientific, Montrouge, France).

2.3. Data Analysis

At the barn level, daily individual performance data were averaged over the 4 weeks of straw-litter accumulation for each treatment. At both the barn and storage levels, gas emissions and environmental data were graphically analyzed as daily dynamics and cumulative emissions over the period concerned (28 days in the barn, 85 days for storage).

3. Results

3.1. Animal Production

The DM intake was higher in cows fed with MD than those fed with GD (20.0 vs. 14.4 kg cow–1 day–1, respectively), as was energy intake (142.2 vs. 93.2 MJ cow–1 day–1, respectively) (Table 2). The water intake was lower for grass-based diets (Table 2) in relation with their lower DM content (Table 1). For N intake (488 vs. 428 g cow–1 day–1, respectively), the difference between MD and GD was smaller due to the higher CP content of the GD diet (Table 1).
Milk production and milk N production from cows fed with GD were nearly half from the cows fed with MD in AUT, but were similar for both diets (mean of 27.2 kg cow–1 day–1 and 144 g cow–1 day–1, respectively) in SPR (Table 2). Milk urea N content of the GD-AUT treatment was twice as high as those of the other treatments. N-use efficiency was ca. 31% for all of the treatments, except for GD-AUT (20.5%; Table 2).

3.2. Manure Production and Storage Conditions

After 4 weeks of accumulation, the amount of litter produced (i.e., before storage) was higher for GD than for MD, for fresh matter and, to a lesser extent, DM (Table 3). This difference was due in part to the lower DM content in GD (23%) than in MD (27%). The higher moisture content of GD litter also resulted in a large amount of liquid collected during the accumulation period: 277 and 49 kg for MD-AUT and MD-SPR, respectively, vs. 692 and 1054 kg for GD-AUT and GD-SPR, respectively. The initial N content was similar for the four treatments, while the initial C content was highest for GD-AUT (517 vs. 400–450 g kg DM–1).
During storage, the temperature of the solid manure was higher in SPR than in AUT, in agreement with the mean outside temperatures (Table 3, Figure 4). The temperature increased significantly in the first week, reaching ca. 50 °C in AUT and up to 70 °C for MD-SPR. The cumulative rainfall during storage was more than twice as high in AUT as in SPR. Rainfall events were more frequent in AUT than in SPR, when they were less frequent and sometimes more intense (Figure 4).

3.3. Ammonia Emissions in the Barn and Storage Phases

The mean cumulative NH3–N emissions in the barn were 390 g cow–1 period–1 and were 27% lower in SPR than in AUT (Table 4). NH3–N emissions increased over the 28 days of litter accumulation, especially during the first week. This pattern was the most distinct for GD-AUT (Figure 5). During storage, the mean cumulative NH3–N emissions were twice as high as those in the barn: 736 g cow–1 period–1. However, these emissions varied significantly among the treatments, from less than 500 g for MD-AUT to nearly 1000 g for GD-AUT. Nearly all of the NH3–N emissions were emitted during the first 2 weeks, with the first week representing 87% of cumulative emissions (Figure 6). In AUT, these emissions were 50% lower for MD litter than for GD litter, while in SPR, they were 40% higher for MD litter than for GD litter. Total NH3–N emissions represented 6–12% of N intake (Table 4).

3.4. Nitrous Oxide Emissions in the Barn and Storage Phases

N2O–N emissions in the barn were too low to measure, since they usually remained near the detection limit (Table 5). Mean N2O–N emissions were also low during storage: 112 g cow–1 period–1. N2O–N was emitted throughout the entire storage period, with a peak observed after 1 week in AUT, but not in SPR (Figure 7). In both seasons, most of the N2O–N emissions were emitted during the first 3 weeks. For GD-SPR, a small peak was observed from days 30–40, which corresponded to an intense rainfall event (Figure 4). Total N2O–N emissions represented less than 1% of N intake, except for GD-SPR, for which they increased to 1.3% (Table 5).

4. Discussion

In deep-litter systems, the interaction among the N excreted, litter characteristics and climatic factors is known to influence the volatilization of N gases [22]. In the present study, N excretion was regulated by the diet fed to the cows (maize-silage-based vs. grass-based), while climatic variations were associated with the season, especially during storage of the mixture of solid manure and straw litter accumulated in the barn.

4.1. Ammonia Emissions Associated with N Excretion in the Barn and Temperature during Storage

In general, the level of ammonia emissions measured in this study is comparable to the level reported in the Webb synthesis (30 ± 20 g NH3–N d–1 animal place–1 [6], but lower than those recently reported in naturally ventilated buildings (40–60 g NH3–N d–1 LU–1, LU: Livestock Unit [4]; 60–100 g NH3–N d–1 LU–1 [7]). In addition to the different measurement methods for gas concentrations and ventilation rates, bedding management practices (e.g., straw added every 2 days, accumulation under the animals for 3 months in Witkowska et al. [7]) may explain these contrasting results.
The higher NH3–N emissions from cows in GD-AUT than in MD-AUT were consistent with the greater and unbalanced amount of CP and degradable protein available in the GD diet per unit of energy. Despite similar diet characteristics, NH3–N emissions for GD-AUT were also higher than those for GD-SPR. This may have been due to the lower milk production of cows in GD-AUT, due to the less DM intake. These cows exported less N in their milk, probably due to excreting more excess N in the urine. This hypothesis is corroborated by the higher milk urea N content for GD-AUT, which is known to reflect the blood urea N content [23], which is correlated with urinary N excretion [24]. In AUT, the milk urea N content increased over the 4 weeks of litter accumulation (10.8 ± 1.3, 16.9 ± 2.7, 19.0 ± 1.5, and 23.4 ± 0.6 mg dl–1 from weeks 1–4, respectively) at the same time as the CP content of the grass (144, 177, 189, and 206 g kg DM–1, respectively). This increase agrees with the dynamics of NH3–N emissions (Figure 5). This increase in milk urea N and NH3–N emissions over time was not observed for GD-SPR, for which the CP content linearly decreased from 227 to 142 g kg DM–1 from weeks 1 to 4, respectively, due to the aging of the grass.
Despite the difference in N input between the two diets and their subsequent influence on excretion (especially for GD-AUT), the initial N content of the manure removed from the barn did not differ significantly, since it depended on the N excretion and N gas emissions over the 4 weeks of litter accumulation. In other words, the excess N excreted by the cows fed with GD-AUT was lost mainly through NH3–N emissions in the barn. Nonetheless, NH3–N emissions were still higher for GD-AUT during storage, and almost as high for MD-SPR, suggesting that factors in addition to the initial N content influenced these losses. Manure temperature is known to influence N losses from manure [25]. NH3–N emissions from urine come mainly from its urea content, with some contribution from other organic N compounds, while fecal emissions are usually considered insignificant. However, at higher temperatures, the degradation of organic N compounds in the urine and mineralization of fecal N have become large sources of NH3–N emissions [2,26]. The differences in manure temperature observed between the two periods are logically related to the season, with higher temperatures in SPR than in AUT. However, within the periods, manure temperature was higher for GD than for MD in AUT, but higher for MD than for GD in SPR, which agrees with the NH3–N emissions observed for each treatment during storage. Approximately 87% of the N–NH3 volatilization occurred during the first week of manure storage, with emissions peaking rapidly after litter stacking and a rapid decrease up to day 7, which agrees with the observations of Sommer [27] and Aguerre et al. [28]. Manure heaps reached elevated temperatures at this time, especially for GD-AUT (despite the low outside temperature), GD-SPR, and MD-AUT (up to 70 °C), which were similar to those found in compacted deep-litter manure [27] or composted manure [9].

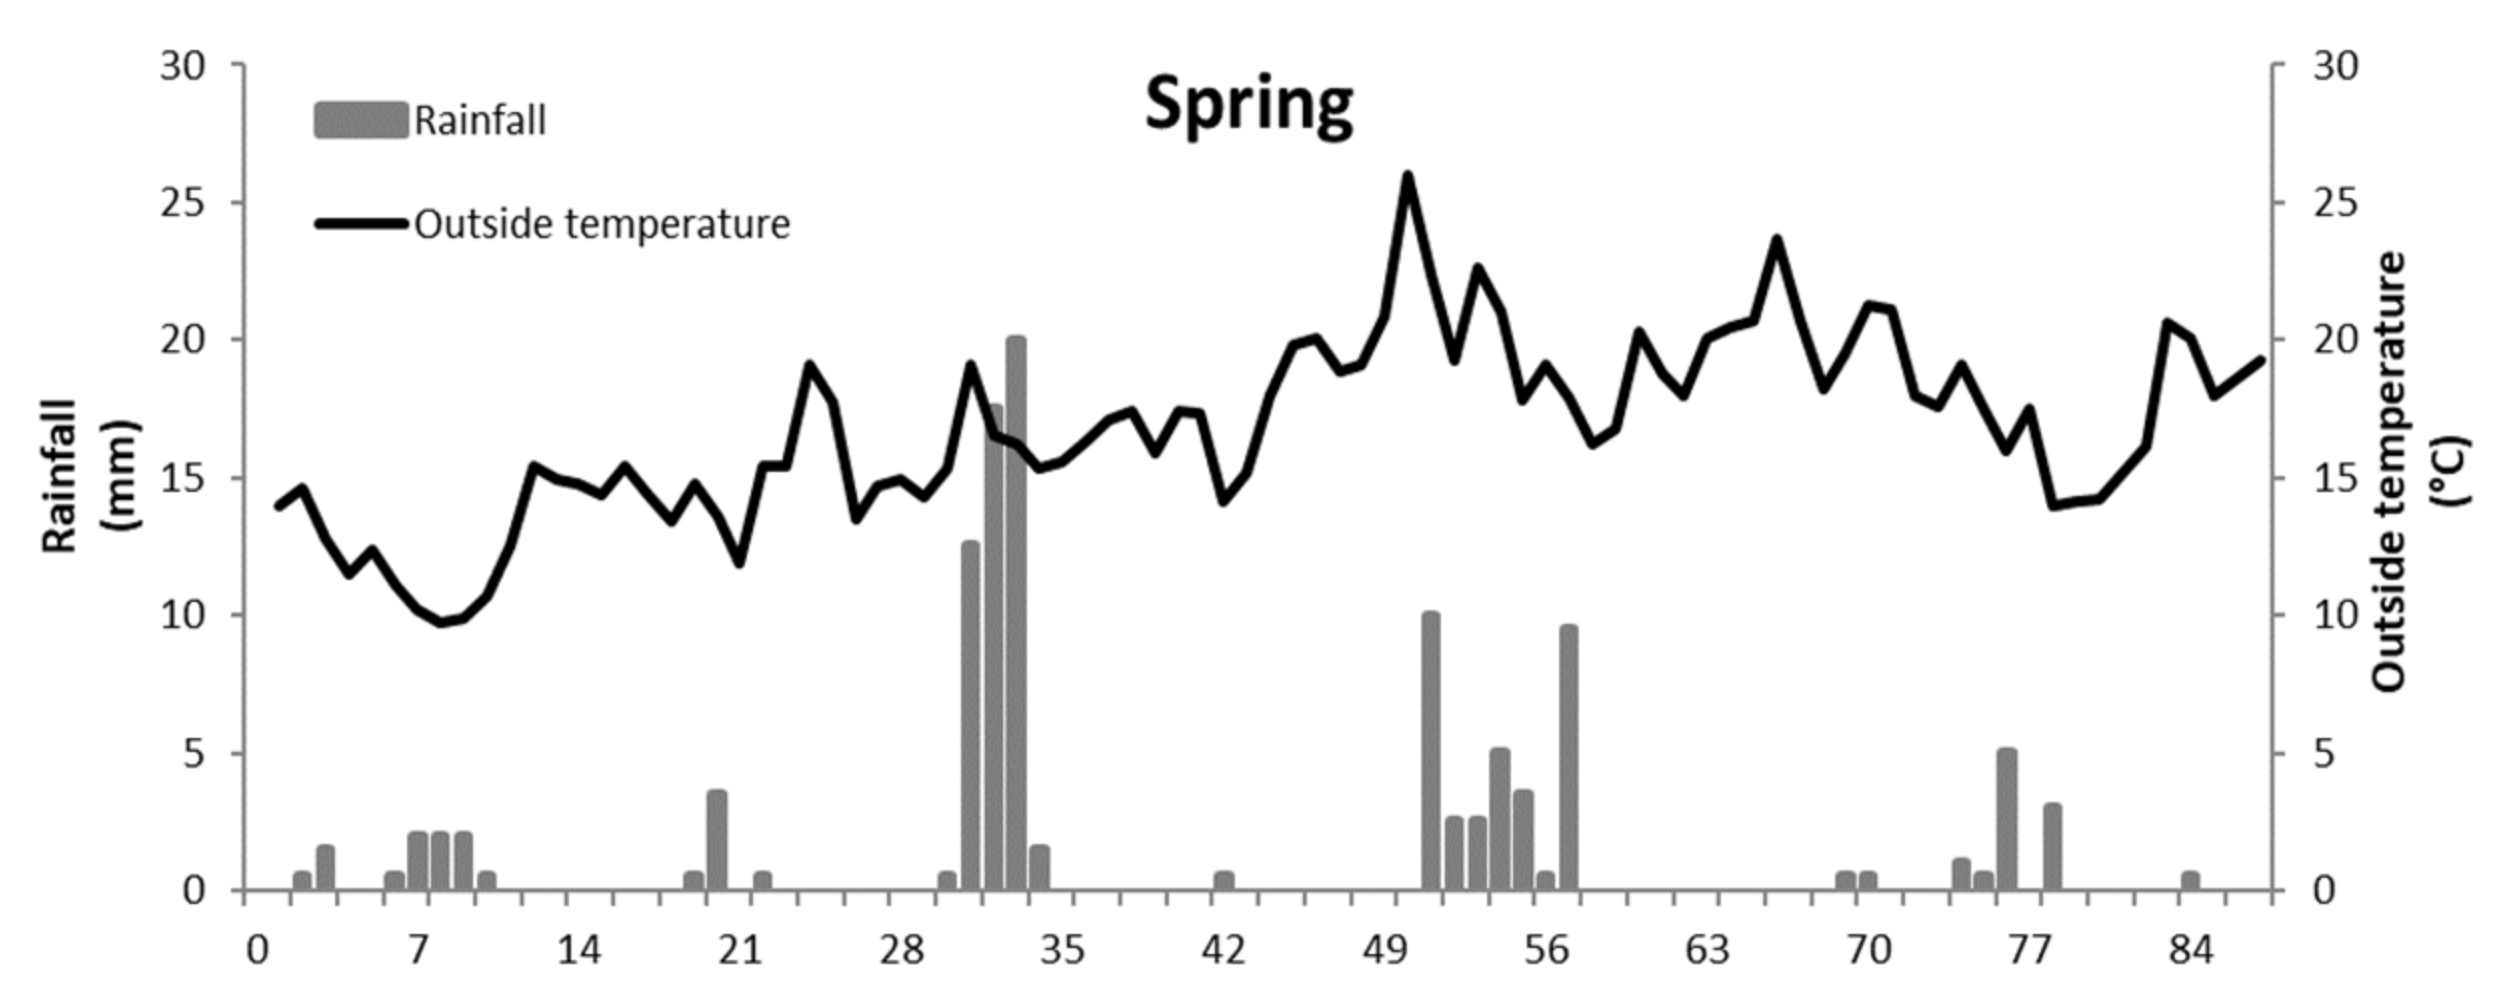
4.2. Nitrous Oxide Emissions Were Negligible in the Barn and Were Influenced by Temperature and Rainfall during Storage

The ratio of cumulative NH3–N and N2O–N emissions was 20:1, while the amplitude of peak emission was 100 times higher for NH3–N, similar to the observations of [29]. These results agree with those of Webb et al. [6] and Mazur et al. [4], in which N2O–N emissions were insignificant in the barn and low during storage compared to NH3–N emissions.
N2O–N emissions during storage generally varied a little, ranging from 0 to nearly 2 g N cow–1 day–1 and representing less than 1% of total N intake. The higher N2O–N emissions for GD-SPR may have been due to factors related to urea hydrolysis and NH3–N volatilization (e.g., lower temperature and higher moisture content), generating more residual reactive N in the manure heap, which would have increased the substrate available for N2O–N emissions.
For all of the treatments, N2O–N emissions peaked during the first week, with a slight shift compared to peak NH3–N emissions. This result conflicts with the literature, in which N2O–N emissions generally increase in the manure heap after 3–4 weeks [10,12,30]. However, Paillat et al. [29] reported that the time required to reach the emission peak and its amplitude can vary in relation to the initial amount of microbial flora provided by the manure and C biodegradability.
In AUT, the season with the highest rainfall, emissions peaked around day 5 and then stabilized after the first 2 weeks [1]. In SPR, the season with the lowest rainfall, emissions peaked on day 1, similar to the observations of Paillat et al. [29]. N2O–N emissions had a lower peak in SPR and did not plateau as they did in AUT, and they gradually decreased over the first 3 weeks. These dynamics may have been due to the higher temperature in the manure heap in AUT than in SPR, which exceeded 60 °C in the first week. Manure temperatures above 40 °C could have decreased nitrification and denitrification processes, thus inhibiting N2O–N emissions, since the microorganisms involved in these processes are not thermophilic [27,29]. In Spring, the outside temperature when manure storage started experienced a drop from 15 to 10 °C in a few days (Figure 4). This could partly explain why the peak was less clear. Another explanation could be the lower rainfall and relative humidity in the first weeks of SPR, which increases the amount of oxygen in the system, thus decreasing nitrification and denitrification processes, which usually occur under anaerobic conditions [8]. Conversely, heavy rainfall in week 5 may have increased the moisture content and decreased the temperature of the manure heap, thus creating the conditions necessary for nitrification and denitrification processes and causing a new emission peak on day 37 of storage.

5. Conclusions

This study highlights the importance of restricting excess N, especially degradable protein in the rumen, in the diets of dairy cows. This prevents the excretion of large amounts of urinary urea, which are known to conduct to subsequent N gas emissions. On the contrary, the excess nitrogen offered by spring grass can lead to important ammonia emissions both in the barn and during manure storage. Nitrous oxide emissions remain negligible in the barn. During storage, the majority of N gas emissions occur during the first few days. Nitrous oxide losses are very sensitive to environmental conditions, including the temperature within the heap and rainfall, which can strongly stimulate emissions.

Author Contributions

Conceptualization, E.L., P.R., and N.E.; methodology, E.L., P.R., and N.E.; software, J.G.R.A. and P.R.; validation, E.L., P.R., and N.E.; formal analysis, J.G.R.A.; investigation, J.G.R.A., E.L., P.R., and N.E.; resources, E.L., P.R., and N.E.; data curation, J.G.R.A., E.L., and P.R.; writing—original draft preparation, J.G.R.A., and N.E.; writing—review and editing, N.E., and H.M.N.R.-F.; visualization, N.E.; supervision, N.E., and H.M.N.R.-F.; project administration, E.L., and N.E.; funding acquisition, E.L., and J.G.R.A. All authors have read and agreed to the published version of the manuscript.

Funding

This research was funded by ADEME (CORTEA program, contract no. 1360C0032, France). The fellowship of J.G.R. Almeida was financed by CAPES Foundation (Brazil).

Institutional Review Board Statement

The study complies with the national legislation applicable at the time of the experiment. Ethical review and approval were waived for this study due to failures in the authorization procedures of the ethics committee at the time of project design.

Data Availability Statement

Not applicable.

Acknowledgments

We are grateful to the staff of the INRAE unit PEGASE, both at the experimental dairy farm (Le Rheu, France), for care of the animals, and at the laboratory (Saint-Gilles, France), for sample analyses.

Conflicts of Interest

The authors declare no conflict of interest. The funders had no role in the design of the study, in the collection, analyses, or interpretation of data, in the writing of the manuscript, or in the decision to publish the results.

References

  1. Steinfeld, H.; Mooney, H.A.; Schneider, F.; Neville, L.E. Livestock in a Changing Landscape. Volume 1: Drivers, Consequences, and Responses; Island Press: Washington, DC, USA, 2010. [Google Scholar]
  2. Jeppsson, K.-H. Volatilization of Ammonia in Deep-litter Systems with Different Bedding Materials for Young Cattle. J. Agric. Eng. Res. 1999, 73, 49–57. [Google Scholar] [CrossRef]
  3. Gac, A.; Béline, F.; Bioteau, T.; Maguet, K. A French inventory of gaseous emissions (CH4, N2O, NH3) from livestock manure management using a mass-flow approach. Livest. Sci. 2007, 112, 252–260. [Google Scholar] [CrossRef]
  4. Mazur, K.; Roman, K.; Wardal, W.J.; Borek, K.; Barwicki, J.; Kierończyk, M. Emission of harmful gases from animal production in Poland. Environ. Monit. Assess. 2021, 193, 1–9. [Google Scholar] [CrossRef] [PubMed]
  5. Schrade, S.; Keck, M. Emissions d’Ammoniac dans les Stabulations Libres de Vaches Laitières avec aire d’Exercice Extérieure: Moins de Pertes en Hiver. 2011. Available online: https://api.open-ressources.fr/files/aHR0cHM6Ly9hcGkuem90ZXJvLm9yZy9ncm91cHMvMzM2MTk3L2l0ZW1zLzhFVUFXVFRLL2ZpbGUvdmlldw==/YXBwbGljYXRpb24vcGRm (accessed on 26 January 2022).
  6. Webb, J.; Sommer, S.G.; Kupper, T.; Groenestein, K.; Hutchings, N.J.; Eurich-Menden, B.; Rodhe, L.; Misselbrook, T.H.; Amon, B. Emissions of Ammonia, Nitrous Oxide and Methane During the Management of Solid Manures. 2011. Available online: https://0-link-springer-com.brum.beds.ac.uk/chapter/10.1007/978-94-007-1905-7_4 (accessed on 26 January 2022). [CrossRef]
  7. Witkowska, D.; Korczyński, M.; Koziel, J.A.; Sowińska, J.; Chojnowski, B. The Effect of Dairy Cattle Housing Systems on the Concentrations and Emissions of Gaseous Mixtures in Barns Determined by Fourier-Transform Infrared Spectroscopy. Ann. Anim. Sci. 2020, 20, 1487–1507. [Google Scholar] [CrossRef]
  8. Petersen, S.; Blanchard, M.; Chadwick, D.; del Prado, A.; Edouard, N.; Mosquera, J.; Sommer, S.G. Manure management for greenhouse gas mitigation. Animal 2013, 7, 266–282. [Google Scholar] [CrossRef] [PubMed] [Green Version]
  9. Maeda, K.; Hanajima, D.; Toyoda, S.; Yoshida, N.; Morioka, R.; Osada, T. Microbiology of nitrogen cycle in animal manure compost. Microb. Biotechnol. 2011, 4, 700–709. [Google Scholar] [CrossRef]
  10. Petersen, S.O.; Lind, A.-M.; Sommer, S.G. Nitrogen and organic matter losses during storage of cattle and pig manure. J. Agric. Sci. 1998, 130, 69–79. [Google Scholar] [CrossRef]
  11. Shan, N.; Li, H.; Li, J.-Z.; Ng, E.L.; Ma, Y.; Wang, L.-G.; Chen, Q. A major pathway for carbon and nitrogen losses — Gas emissions during storage of solid pig manure in China. J. Integr. Agric. 2019, 18, 190–200. [Google Scholar] [CrossRef] [Green Version]
  12. Külling, D.R.; Menzi, H.; Kröber, T.F.; Neftel, A.; Sutter, F.; Lischer, P.; Kreuzer, M. Emissions of ammonia, nitrous oxide and methane from different types of dairy manure during storage as affected by dietary protein content. J. Agric. Sci. 2001, 137, 235–250. [Google Scholar] [CrossRef]
  13. Edouard, N.; Charpiot, A.; Robin, P.; Lorinquer, E.; Dollé, J.-B.; Faverdin, P. Influence of diet and manure management on ammonia and greenhouse gas emissions from dairy barns. Animal 2019, 13, 2903–2912. [Google Scholar] [CrossRef] [PubMed]
  14. Qu, Q.; Groot, J.C.; Zhang, K.; Schulte, R.P. Effects of housing system, measurement methods and environmental factors on estimating ammonia and methane emission rates in dairy barns: A meta-analysis. Biosyst. Eng. 2021, 205, 64–75. [Google Scholar] [CrossRef]
  15. Sanchis, E.; Calvet, S.; del Prado, A.; Estellés, F. A meta-analysis of environmental factor effects on ammonia emissions from dairy cattle houses. Biosyst. Eng. 2018, 178, 176–183. [Google Scholar] [CrossRef]
  16. Agabriel, J. Alimentation des Bovins, Ovins et Caprins—Besoins des Animaux—Valeur des Aliments—Tables INRA 2007; Editions Quae: Paris, France, 2007; Available online: http://www.civamad53.org/wp-content/uploads/2020/12/Tables-INRA.pdf (accessed on 26 January 2022).
  17. Hassouna, M.; Robin, P.; Charpiot, A.; Edouard, N.; Méda, B. Infrared photoacoustic spectroscopy in animal houses: Effect of non-compensated interferences on ammonia, nitrous oxide and methane air concentrations. Biosyst. Eng. 2013, 114, 318–326. [Google Scholar] [CrossRef]
  18. Hassouna, M.; Eglin, T.; Cellier, P.; Colomb, V.; Cohan, J.-P.; Decuq, C.; Delabuis, M.; Edouard, N.; Espagnol, S.; Eugene, M.; et al. Measuring Emissions from Livestock Farming: Greenhouse Gases, Ammonia and Nitrogen Oxides; INRA-ADEME: Paris, France, 2016; Available online: https://hal.archives-ouvertes.fr/hal-01567208/document (accessed on 26 January 2022).
  19. Baptista, F.; Bailey, B.; Randall, J.; Meneses, J. Greenhouse Ventilation Rate: Theory and Measurement with Tracer Gas Techniques. J. Agric. Eng. Res. 1999, 72, 363–374. [Google Scholar] [CrossRef] [Green Version]
  20. Demmers, T.G.M.; Phillips, V.R.; Short, L.S.; Burgess, L.R.; Hoxey, R.P.; Wathes, C.M. Validation of ventilation rate measurement methods and the ammonia emission from naturally ventilated dairy and beef buildings in the United Kingdom. J. Agric. Eng. Res. 2001, 79, 107–116. [Google Scholar] [CrossRef]
  21. Lorinquer, E.; Charpiot, A.; Raynal, J.; Dollé, J.B.; Robin, P.; Hassouna, M.; Oudart, D.; Planchais, J.; Guiziou, F.; Loyon, L.; et al. Ammonia and Greenhouse Gas Emissions from Cattle Farm Yard Manure; ADEME: Angers, France, 2015; Available online: https://www.ademe.fr/sites/default/files/assets/documents/ges-fumiers-bovins-rapport-201512.pdf (accessed on 26 January 2022).
  22. Pereira, J.; Misselbrook, T.H.; Chadwick, D.R.; Coutinho, J.; Trindade, H. Effects of temperature and dairy cattle excreta characteristics on potential ammonia and greenhouse gas emissions from housing: A laboratory study. Biosyst. Eng. 2012, 112, 138–150. [Google Scholar] [CrossRef]
  23. Gustafsson, A.; Palmquist, D. Diurnal Variation of Rumen Ammonia, Serum Urea, and Milk Urea in Dairy Cows at High and Low Yields. J. Dairy Sci. 1993, 76, 475–484. [Google Scholar] [CrossRef]
  24. Burgos, S.; Fadel, J.G.; Depeters, E.J. Prediction of Ammonia Emission from Dairy Cattle Manure Based on Milk Urea Nitrogen: Relation of Milk Urea Nitrogen to Urine Urea Nitrogen Excretion. J. Dairy Sci. 2007, 90, 5499–5508. [Google Scholar] [CrossRef] [PubMed]
  25. Mathot, M.; Lambert, R.; Stilmant, D.; Decruyenaere, V. Carbon, nitrogen, phosphorus and potassium flows and losses from solid and semi-solid manures produced by beef cattle in deep litter barns and tied stalls. Agric. Syst. 2019, 178, 102735. [Google Scholar] [CrossRef]
  26. Bussink, D.; Oenema, O. Ammonia volatilization from dairy farming systems in temperate areas: A review. Nutr. Cycl. Agroecosyst. 1998, 51, 19–33. [Google Scholar] [CrossRef]
  27. Sommer, S. Effect of composting on nutrient loss and nitrogen availability of cattle deep litter. Eur. J. Agron. 2001, 14, 123–133. [Google Scholar] [CrossRef]
  28. Aguerre, M.; Wattiaux, M.; Hunt, T.; Lobos, N. Effect of nitrogen content and additional straw on changes in chemical composition, volatile losses, and ammonia emissions from dairy manure during long-term storage. J. Dairy Sci. 2012, 95, 3454–3466. [Google Scholar] [CrossRef] [PubMed] [Green Version]
  29. Paillat, J.-M.; Robin, P.; Hassouna, M.; Leterme, P. Predicting ammonia and carbon dioxide emissions from carbon and nitrogen biodegradability during animal waste composting. Atmos. Environ. 2005, 39, 6833–6842. [Google Scholar] [CrossRef] [Green Version]
  30. Mathot, M.; Decruyenaere, V.; Lambert, R.; Stilmant, D. Deep litter removal frequency rate influences on greenhouse gas emissions from barns for beef heifers and from manure stores. Agric. Ecosyst. Environ. 2016, 233, 94–105. [Google Scholar] [CrossRef]
Figure 1. Overhead (left) and side (right) views of one of the experimental rooms that housed three dairy cows (diagrams are not to scale).
Atmosphere 13 00283 g001
Figure 2. Overhead (left), front (upper right), and side (lower right) views of the experimental storage site (diagrams are not to scale).
Atmosphere 13 00283 g002
Figure 3. Photographs of the storage greenhouse, uncovered (left) and covered (right).
Atmosphere 13 00283 g003
Figure 4. Rainfall and outside temperature over the 85 days of storage in autumn and spring.
Atmosphere 13 00283 g004aAtmosphere 13 00283 g004b
Figure 5. Dynamics of ammonia (NH3–N) emissions (g cow–1 day–1) over the 28 d of litter accumulation in the barn in the autumn and spring as a function of diet (a maize-silage-based diet (MD) or a grass-based diet (GD)).
Atmosphere 13 00283 g005
Figure 6. Dynamics of ammonia (NH3–N) emissions (g cow–1 day–1) over the 85 d of storage in the autumn and spring as a function of diet (a maize-silage-based diet (MD) or a grass-based diet (GD)).
Atmosphere 13 00283 g006
Figure 7. Dynamics of nitrous oxide (N2O–N) emissions (g d–1 cow-1) over the 85 d of storage in the autumn and spring as a function of diet (a maize-silage-based diet (MD) or a grass-based diet (GD)).
Atmosphere 13 00283 g007
Table 1. Composition of diets (maize-silage-based (MD) or grass-based (GD)) offered to dairy cows housed on a straw-based deep-litter system in autumn and spring.
AutumnSpring
MDGDMDGD
Ingredients (g kg–1 DM)
Fresh forage6601000
Hay340
Maize silage715731
Mix concentrate 17086
Soybean meal205172
Minerals1011
Nutrients
DM (g k–1)370 ± 18202 ± 53402164
NDF (g kg–1 DM)453 ± 2551 ± 25362507
CP (g kg–1 DM)153 ± 5179 ± 24149178
Nutritive value
PDIN (g kg–1 DM) 210311799116
PDIE (g kg–1 DM) 397979799
NEL (MJ kg–1 DM) 46.766.337.116.61
(PDIN–PDIE) NEL–10.893.160.282.57
1 Mix concentrate composition: 20% wheat, 20% maize, 20% barley, 20% beet pulp, 15% wheat bran, 3% molasses, 1% vegetable oil, and 1% NaCl. 2 PDIN: True protein absorbable in the small intestine when rumen-fermentable N is limiting in the rumen, based on the INRAE feeding system [16]. 3 PDIE: True protein absorbable in the small intestine when rumen-fermentable energy is limiting in the rumen, based on the INRAE feeding system [16]. 4 NEL: Net energy for lactation.
Table 2. Intake, production, and nitrogen (N)-use efficiency (mean ± SD) of dairy cows fed with a maize-silage-based diet (MD) or a grass-based diet (GD) and housed on a straw-based deep-litter system.
AutumnSpring
MDGDMDGD
Intake
DM (kg cow–1 day–1)19.9 ± 1.913.1 ± 1.420.0 ± 1.715.7 ± 2.2
Water (L cow–1 day–1)69.4 ± 7.940.5 ± 15.683.1 ± 9.143.5 ± 14.7
N (g cow–1 day–1)495 ± 43410 ± 79482 ± 32446 ± 88
PDIN (g cow–1 day–1) 12045 ± 1881532 ± 2771979 ± 1381803 ± 362
PDIE (g cow–1 day–1) 21925 ± 1761275 ± 1541938 ± 1511545 ± 222
NEL (MJ cow–1 day–1) 3141.5 ± 12.882.5 ± 9.2142.3 ± 12.1103.8 ± 14.9
Production
Milk (kg cow–1 day–1)23.4 ± 2.113.4 ± 1.828.4 ± 5.626.0 ± 3.5
Milk N (g–1 cow–1 day–1)151 ± 1180 ± 6155 ± 11132 ± 13
Milk urea N (mg dL–1)8.8 ± 1.517.6 ± 4.97.6 ± 1.78.1 ± 1.4
NUE, % 430.9 ± 5.820.5 ± 4.932.2 ± 1.530.6 ± 6.5
1 PDIN: True protein absorbable in the small intestine when rumen-fermentable N is limiting in the rumen, based on the INRA feeding system [16]. 2 PDIE: True protein absorbable in the small intestine when rumen-fermentable energy is limiting in the rumen, based on the INRA feeding system [16]. 3 NEL: Net energy for lactation. 4 NUE: N-use efficiency (kg N in milk kg N intake–1).
Table 3. Initial composition, solid manure temperature, and weather conditions (mean ± SD) during the storage phase of the straw-based deep litter produced by dairy cows fed with a maize-silage-based diet (MD) or a grass-based diet (GD) in autumn or spring.
AutumnSpring
MDGDMDGD
Initial amount (kg fresh matter cow–1)1443198316802360
Initial amount (kg DM cow–1)383472464548
Initial composition (g kg DM–1)
Organic matter900875890834
Carbon450517420400
Nitrogen17.218.319.419.1
Solid manure temperature
Entire storage period (°C)29.9 ± 11.937.9 ± 15.557.2 ± 10.153.4 ± 7.6
First week of storage (°C)46.6 ± 12.454.3 ± 11.875.4 ± 4.361.0 ± 8.3
Weather conditions
Mean temperature (°C)6.6 ± 3.516.9 ± 3.2
Mean relative humidity (%)87.1 ± 5.971.2 ± 6.1
Cumulative rainfall (mm)262111
Table 4. Ammonia (NH3–N) cumulative emissions from straw-based deep litter produced by dairy cows fed with a maize-silage-based diet (MD) or a grass-based diet (GD) in autumn or spring.
AutumnSpring
NH3–NMDGDMDGD
g cow–1 period–1
Barn, 28 days410489340318
Storage, 85 days498964869614
Total, 113 days90814531209932
% of N intake 1
Barn3.04.22.52.5
Storage3.68.46.44.9
Total6.612.68.97.4
1 Calculated as NH3–N emissions (g cow–1 period–1) divided by N intake over the 28-day housing period (g cow–1 period–1, Table 2) multiplied by 100.
Table 5. Nitrous oxide (N2O–N) cumulative emissions from the straw-based deep litter produced by dairy cows fed with a maize-silage-based diet (MD) or a grass-based diet (GD) in autumn or spring.
AutumnSpring
N2O–NMDGDMDGD
g cow–1 period–1
Barn, 28 days
Storage, 85 days9210099157
Total, 113 days9210099157
% of N intake 1
Barn
Storage0.660.870.731.26
Total0.660.870.731.26
1 Calculated as N2O–N emissions (g cow–1 period–1) divided by N intake over the 28-day housing period (g cow–1 period–1, Table 2) multiplied by 100. —: Too low to measure.
Publisher’s Note: MDPI stays neutral with regard to jurisdictional claims in published maps and institutional affiliations.

