
Continuous Measurement of Ammonia at an Intensive Pig Farm in Wuhan, China

State Environmental Protection Key Laboratory of Soil Health and Green Remediation, College of Resources and Environment, Huazhong Agricultural University, Wuhan 430070, China
*
Author to whom correspondence should be addressed.
Atmosphere 2022, 13(3), 442; https://0-doi-org.brum.beds.ac.uk/10.3390/atmos13030442
Submission received: 17 February 2022
/
Revised: 3 March 2022
/
Accepted: 7 March 2022
/
Published: 9 March 2022
(This article belongs to the Special Issue Ammonia in a Changing Atmosphere)
Abstract
:Measurements with high time resolution are necessary to capture variation patterns and to facilitate the estimation of uncertainty in ammonia inventories. Continuous real-time monitoring of ammonia was carried out in a naturally ventilated nursery pig house during two periods in winter and summer, respectively. A higher ventilation rate of about 73,799 ± 39,655 m3/h was obtained during the summer period in comparison with 1646 ± 604 m3/h in the winter. Correspondingly, ammonia level observed in summer (0.25 ± 0.10 mg/m3) was lower than that in winter (1.28 ± 0.74 mg/m3). Spatial variation of ammonia concentration was observed during the winter monitoring period. The mean ammonia emission factor was about 0.3221 ± 0.2921 g d−1 pig−1 in summer and 0.1039 ± 0.0550 g d−1 pig−1 in winter, ranging from 0.0094 to 1.9422 g d−1 pig−1 and 0.0046 to 0.2899 g d−1 pig−1, respectively. Significant correlation was found between ammonia emission and indoor temperature and relative humidity during the winter period. For the summer measurement, effects of ventilation rate and ammonia concentration on ammonia emission were significant. Prominent diurnal pattern existed for both ammonia concentration and emission, with higher emission rates during daytime. The results confirmed the existence of considerable uncertainty associated with the ammonia emission factor, acquired by snapshot measurements.
1. Introduction
Ammonia (NH3) emissions have wider implications for the ecosystem and human health. When deposited from the atmosphere, NH3 can lead to eutrophication in water bodies and acidification of the soil due to the release of H+ during nitrification [1,2]. Moreover, NH3 plays an important role in atmospheric chemistry and contributes to the haze event in various regions of the world [3,4]. With relatively high emissions in China, NH3 can significantly promote nitrous acid (HONO) formation and enhance the atmospheric oxidizing capacity, causing severe secondary aerosol pollution [5]. Studies conducted in Europe and the United States also revealed that aerosol formed with NH3 contributes a high share to the total mass of PM2.5 and PM10 [6,7].
Various sources including vehicular exhausts, chemical industry, and biomass burning contribute to the NH3 inventory [8]. However, unlike other air pollutants, NH3 originates mostly from agricultural activities, including livestock farming and fertilizer application. As a large agricultural country, China produces a huge amount of NH3 emission. It has been reported that NH3 emissions in China exceeded the sum of those in the European Union and the United States [9]. Among them, livestock emission contributed solely about 43% of the national total NH3 budget [8]. Following the continuous population growth and rising incomes, livestock products are expected to increase further. However, control of NH3 emission is imperative in order to achieve the sustainable development of livestock farming. In fact, immense mitigation potential exists in the livestock sector. A recent study revealed that the relative NH3 mitigation potential in China is twice that in Europe. Among them, mitigation potential of livestock production is around 2.1–3.6 Tg N year−1, and the pig industry in China has the largest NH3 mitigation potential at 838–1408 Gg N [10].
In order to fulfill the NH3 mitigation potential and to provide source profiles for air quality modeling, accurate knowledge of NH3 emissions from livestock buildings is essential. Extensive studies have investigated NH3 concentrations, spatial distribution, emissions, and related influencing factors in livestock farms in China to provide a useful database for inventory compilation, air-quality modeling, and reduction strategy design [11,12,13,14,15,16,17]. Great variations on ammonia concentrations and emissions were found in these studies, illustrating the existence of large uncertainties in livestock ammonia emissions. In addition, significant seasonal and diurnal variations in ammonia concentrations and emissions in pig-fattening houses were found. Monitoring instruments with low temporal resolution (i.e., measurements integrated over a few hours to a day) are not able to capture the details of ammonia dynamic behavior [18]. In this sense, measuring concentrations continuously or in real time is advantageous. A broad range of techniques have been applied to measure NH3 concentration in real time, such as differential optical absorption spectroscopy, photoacoustic absorption spectroscopy, conversion of NH3 to NO with subsequent chemiluminescence detection, laser absorption spectroscopy, and cavity ring-down spectroscopy. For example, high frequency online measurements of ammonia concentrations were obtained in Madrid using cavity-enhanced laser absorption spectroscopy to identify the NH3 sources [19]. Recently, a highly sensitive and fast online method was developed for the simultaneous determination of gaseous NH3 and particulate NH4+ in ambient air. In this method, NH3 is sampled in a cylindrical wet diffusion denuder and analyzed online by a continuous flow system with a fluorescence detector [20].
Studies with highly time resolved concentration or emission monitoring are currently scant in China. Therefore, the continuous monitoring of ammonia concentrations was conducted in a pig farm in this study, and the hourly emission rates were estimated. Since previous work focused mainly on pig fattening facilities, this study aims to explore the ammonia concentration level and the emission characteristics within a pig barn for weaned piglets. It is expected that this work will provide some insights into the uncertainty associated with ammonia inventory estimation and will contribute to ammonia abatement strategy development.
2. Materials and Methods
2.1. The Pig Farm
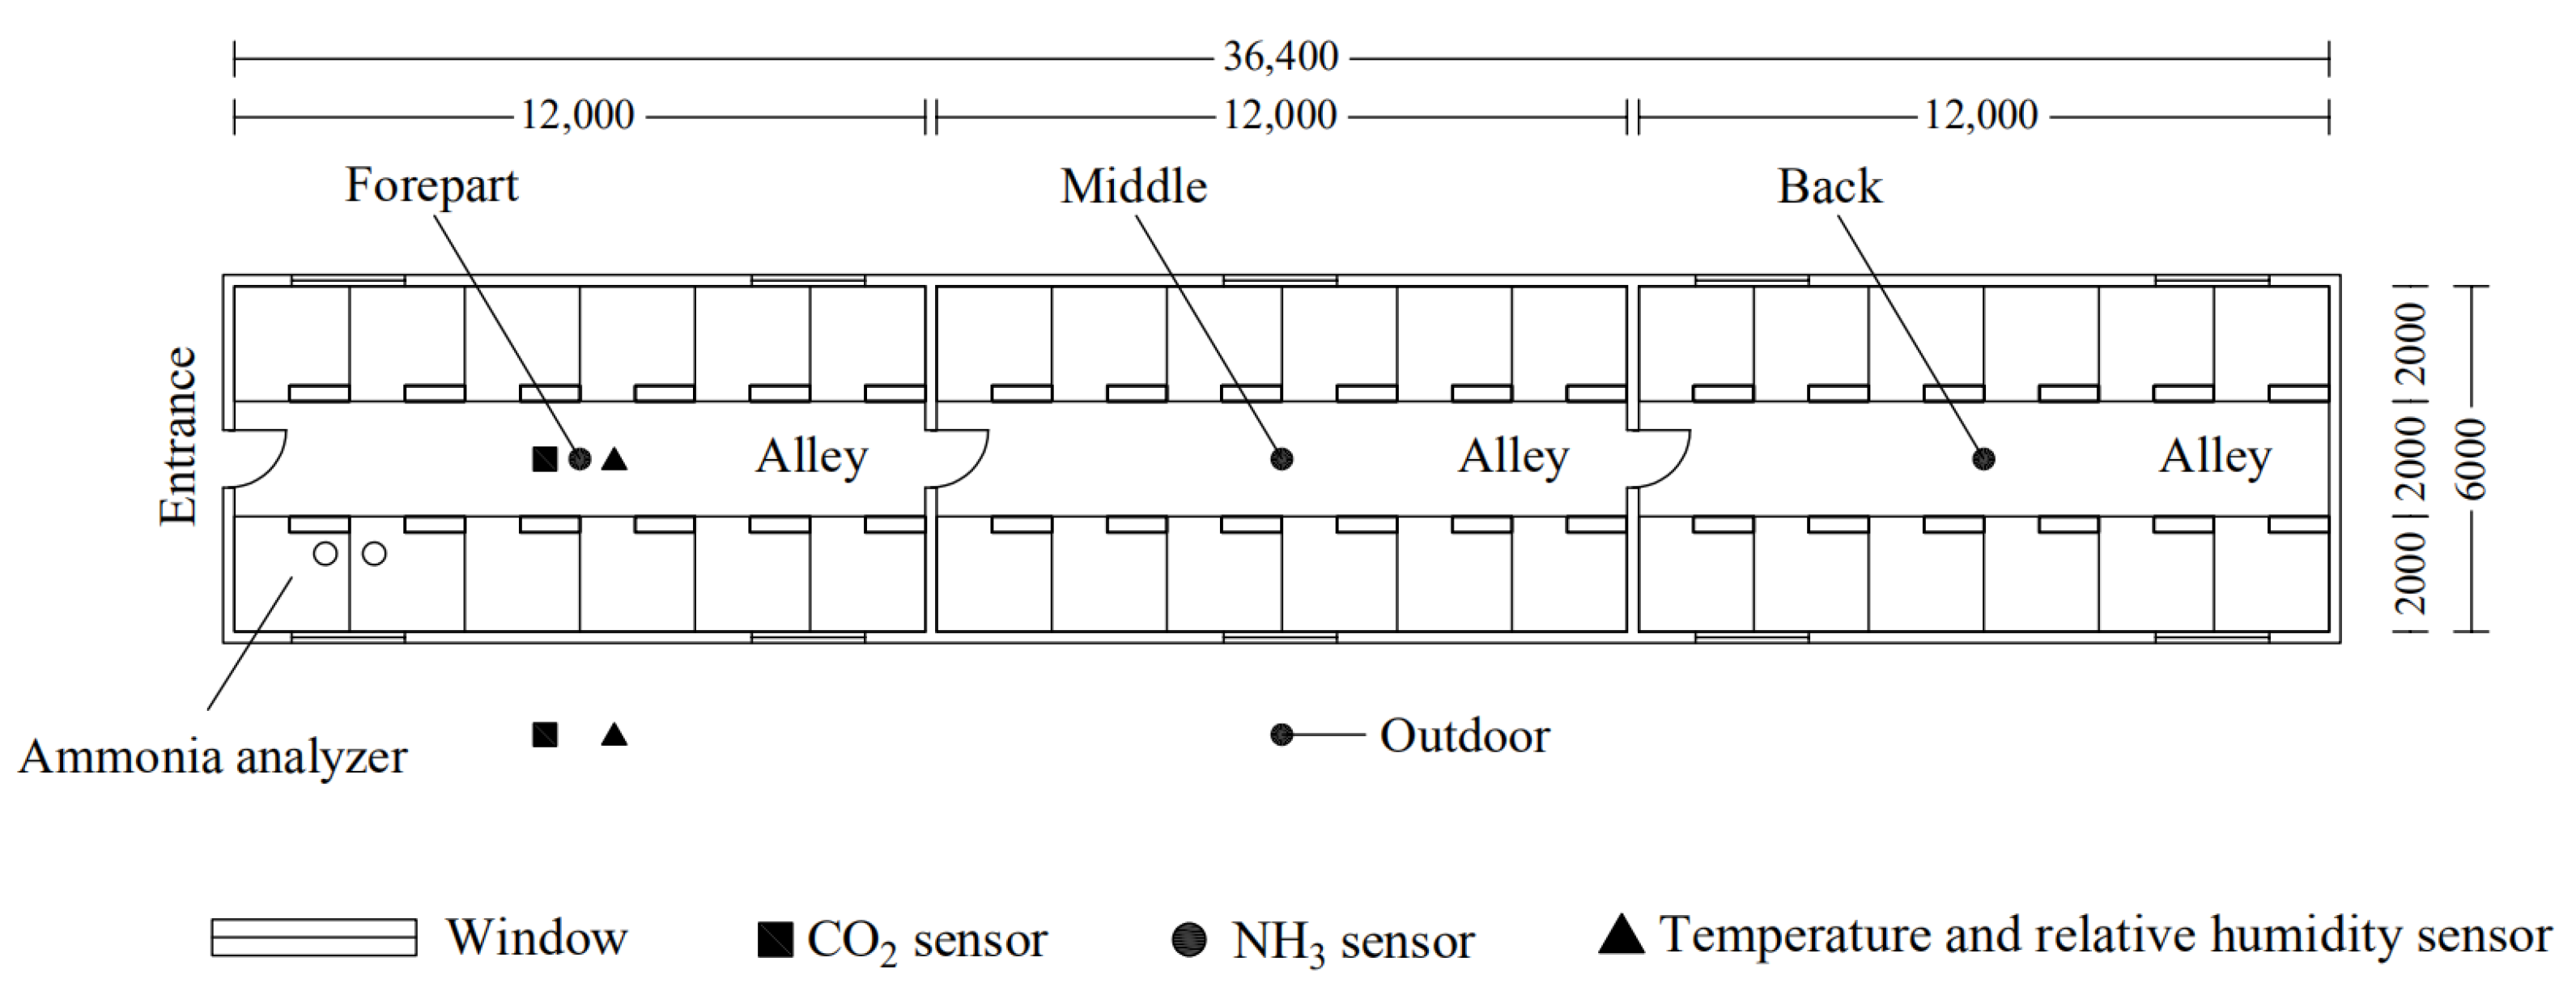
The experiment was conducted in a commercial swine farm located in the Jiangxia district, which is one of 13 districts of Wuhan, the capital of Hubei province, China. The farm occupies an area of 8250 m2 and has an annual production capacity of about 8500 pigs. All the pig houses in this farm are oriented east–west. According to the negotiation with the farm owner, and in order not to interfere with the daily management, a nursery pig house with plastic slatted floor was selected for the investigation. The gap width of the slatted floor was around 12 mm. The floor was cleaned at least once at around 7:00. The house was approximately 36 m long and 6 m wide and was divided evenly into three compartments. In each compartment, there were 6 pens with open partitions on either side of a 2-m-wide central alley. Each pen had the capacity of 15 nursery pigs, giving an available floor area of about 0.27 m2 pig−1. The detailed layout of experimental housing is shown in Figure 1. The pigs were moved to the nursery house at the age of 3 weeks with an average body weight of about 7 kg, and the final weight was around 28 kg in average. The pigs were fed ad libitum through the feeding trough. The trough was filled twice a day. Crude protein, lysine, and crude fiber contents were 17–19%, 1.1–1.3%, and 3.5–4%, respectively.
The nursery pig house was naturally ventilated through windows and roof chimneys (unpowered roof draught fan). In winter, the windows were open for only 2 h around noon to induce air exchange and were fully closed for the remaining hours. In summer, on the other hand, windows were fully open.
2.2. Measurement Setup
A 24-h continuous monitoring of ammonia was performed daily from 13 to 21 January 2017 and from 24 July to 18 August 2018. Environmental parameters such as temperature and relative humidity were simultaneously measured. In addition, concentration of CO2 was determined during the 2018 campaign to estimate the ventilation rate. With the multiport sampling unit, gas samples were taken sequentially into an ammonia analyzer with Teflon tubes from 3 points inside the house and 1 point outside. Three inside sampling locations were near to the entrance, in the middle, and in the far end of the house, respectively (Figure 1). The sampling height was around 1.6 m measured from the floor. Each sampling at one location consisted of 8 consecutive measurements with a 100 s time interval. To reduce measurement uncertainties caused by possible delay effects, only the last five measurements were taken into account.
NH3 was measured using an economic ammonia analyzer (Model 907-0016, Los Gatos Research Inc., San Jose, CA, USA) which utilizes a unique laser absorption technology called off-axis integrated cavity output spectroscopy. The analyzer had a precision of 0.2 ppb at a 100 s average and a maximum drift of 0.2 ppb over 24 h. The response time of the analyzer was 10 s.
Small portable sensors (S500-EX, Huato Ltd., Shenzhen, China) were utilized to determine the temperature and relative humidity inside and outside the nursery pig house. The data were logged every 5 min. CO2 concentrations were measured and recorded by a real-time sensing device (S653, Huato Ltd., Shenzhen, China) every 10 min. All analyzers were calibrated by the manufacturer.
2.3. Calculation of Emission Rate
The emissions rates of NH3 in the nursery pig house were estimated by a mass balance according to:
where EF is the emission rate expressed on a per pig base, mg h−1 pig−1; Ci is the average concentration of ammonia measured at three inside sampling positions, mg m−3; Co is the concentration outside the pig house, mg m−3; n is the number of pigs in the nursery house; and V is the ventilation rate, m3 h−1.
Prior to calculate the NH3 emission rate, ventilation rate must be firstly determined. CIGR (International Commission of Agricultural Engineering) proposed three balance equations, namely heat balance, moisture balance, and the CO2 balance method, to estimate the ventilation flow of a naturally ventilated livestock house. According to the comparable study by Pedersen et al. [21], the carbon dioxide method is recommended for uninsulated buildings due to the difficulties in estimating the heat transmission loss from the building, and either method is applicable for insulated buildings under conditions of relatively large differences between indoor and outdoor temperatures, absolute humidity and carbon dioxide concentration. In this study, ventilation rates were obtained by using heat balance equations in the winter campaign, and the CO2 balance method was employed for the summer measurements. The detailed description of methods can be accessed elsewhere [22,23].
2.4. Data Analysis
Differences among ammonia concentrations measured at different indoor positions were evaluated with Tukey’s multiple comparison test. Pearson correlation analysis was performed to explore the association between ammonia emission and environmental parameters in the pig house. In addition, a multiple linear regression model was used to quantitatively describe the relationships between NH3 emission and the influencing factors. All these analyses were achieved with R, an open-source statistical programming language.
3. Results and Discussion
3.1. Environmental Parameters
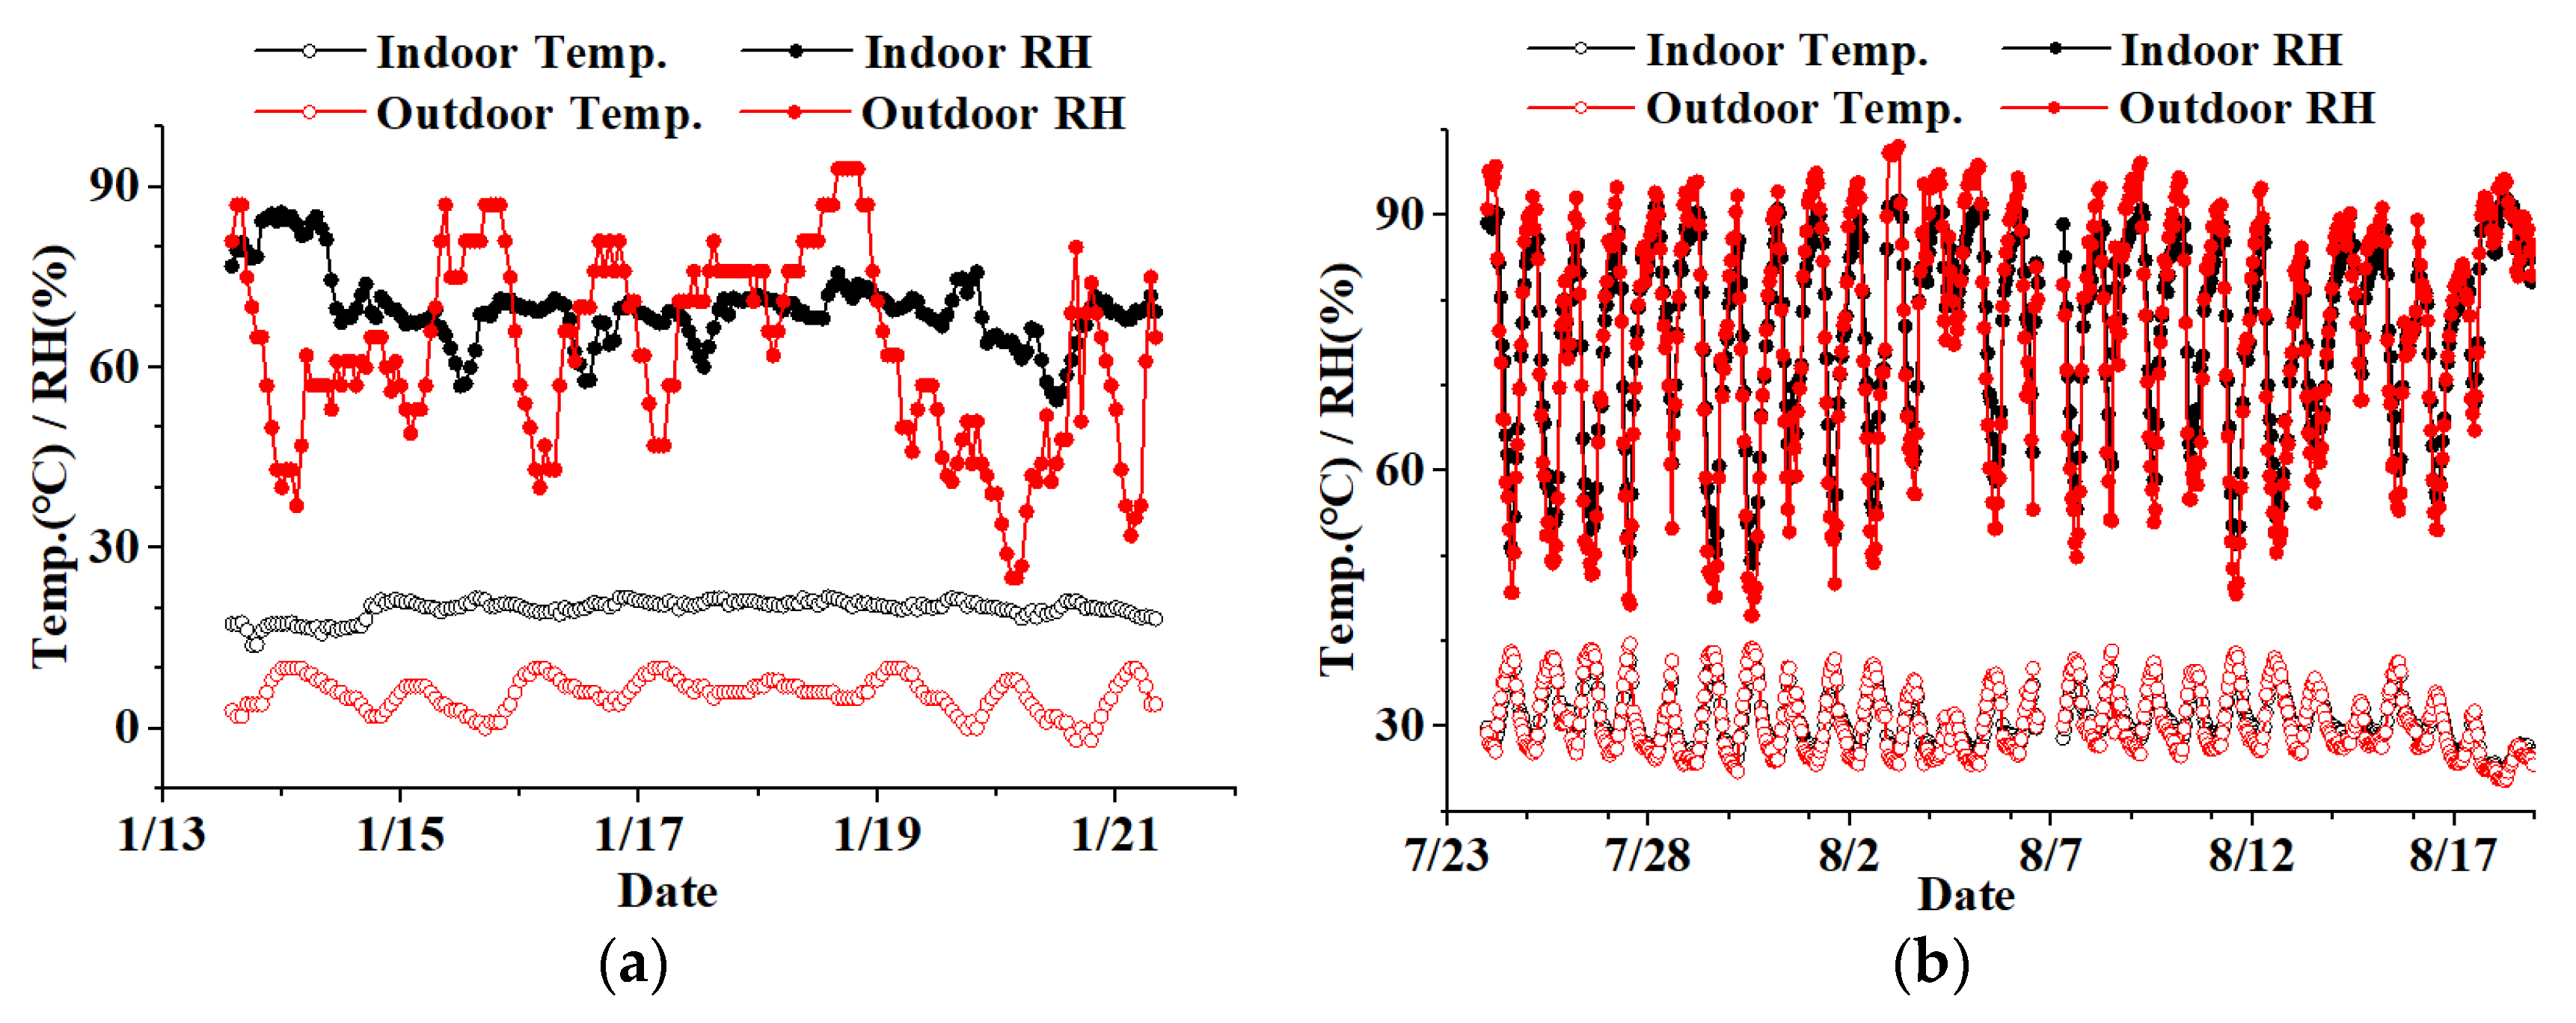
Due to the completely closed windows during the monitoring period in winter, significant differences existed between the indoor and outdoor temperature, which were 19.9 ± 1.5 °C and 5.6 ± 2.9 °C, on average. On the other hand, the indoor relative humidity of 69.7 ± 6.0% was comparable to the outdoor level of 62.6 ± 16.0%. In the summer campaign, the average outside temperature of 30.0 ± 3.9 °C was quite close to the inside temperature of 30.3 ± 2.9 °C. This was rational since the fully opened windows facilitated the exchange of indoor and outdoor air. Very similar average relative humidities of 75.6 ± 11.1% and 75.4 ± 14.3% were recorded for the indoor and outdoor environment, respectively.
Temporal variations in both temperature and humidity were obvious. Outdoor temperature and humidity fluctuated significantly during both winter and summer periods. Due to the adequate ventilation, similar variation trends as for outdoors were observed for indoor temperature and humidity during the summer campaign (Figure 2b). By contrast, environmental parameters inside the nursery house showed only marginal variation in winter, being less influenced by the outdoor air (Figure 2a).
3.2. Ventilation Rates
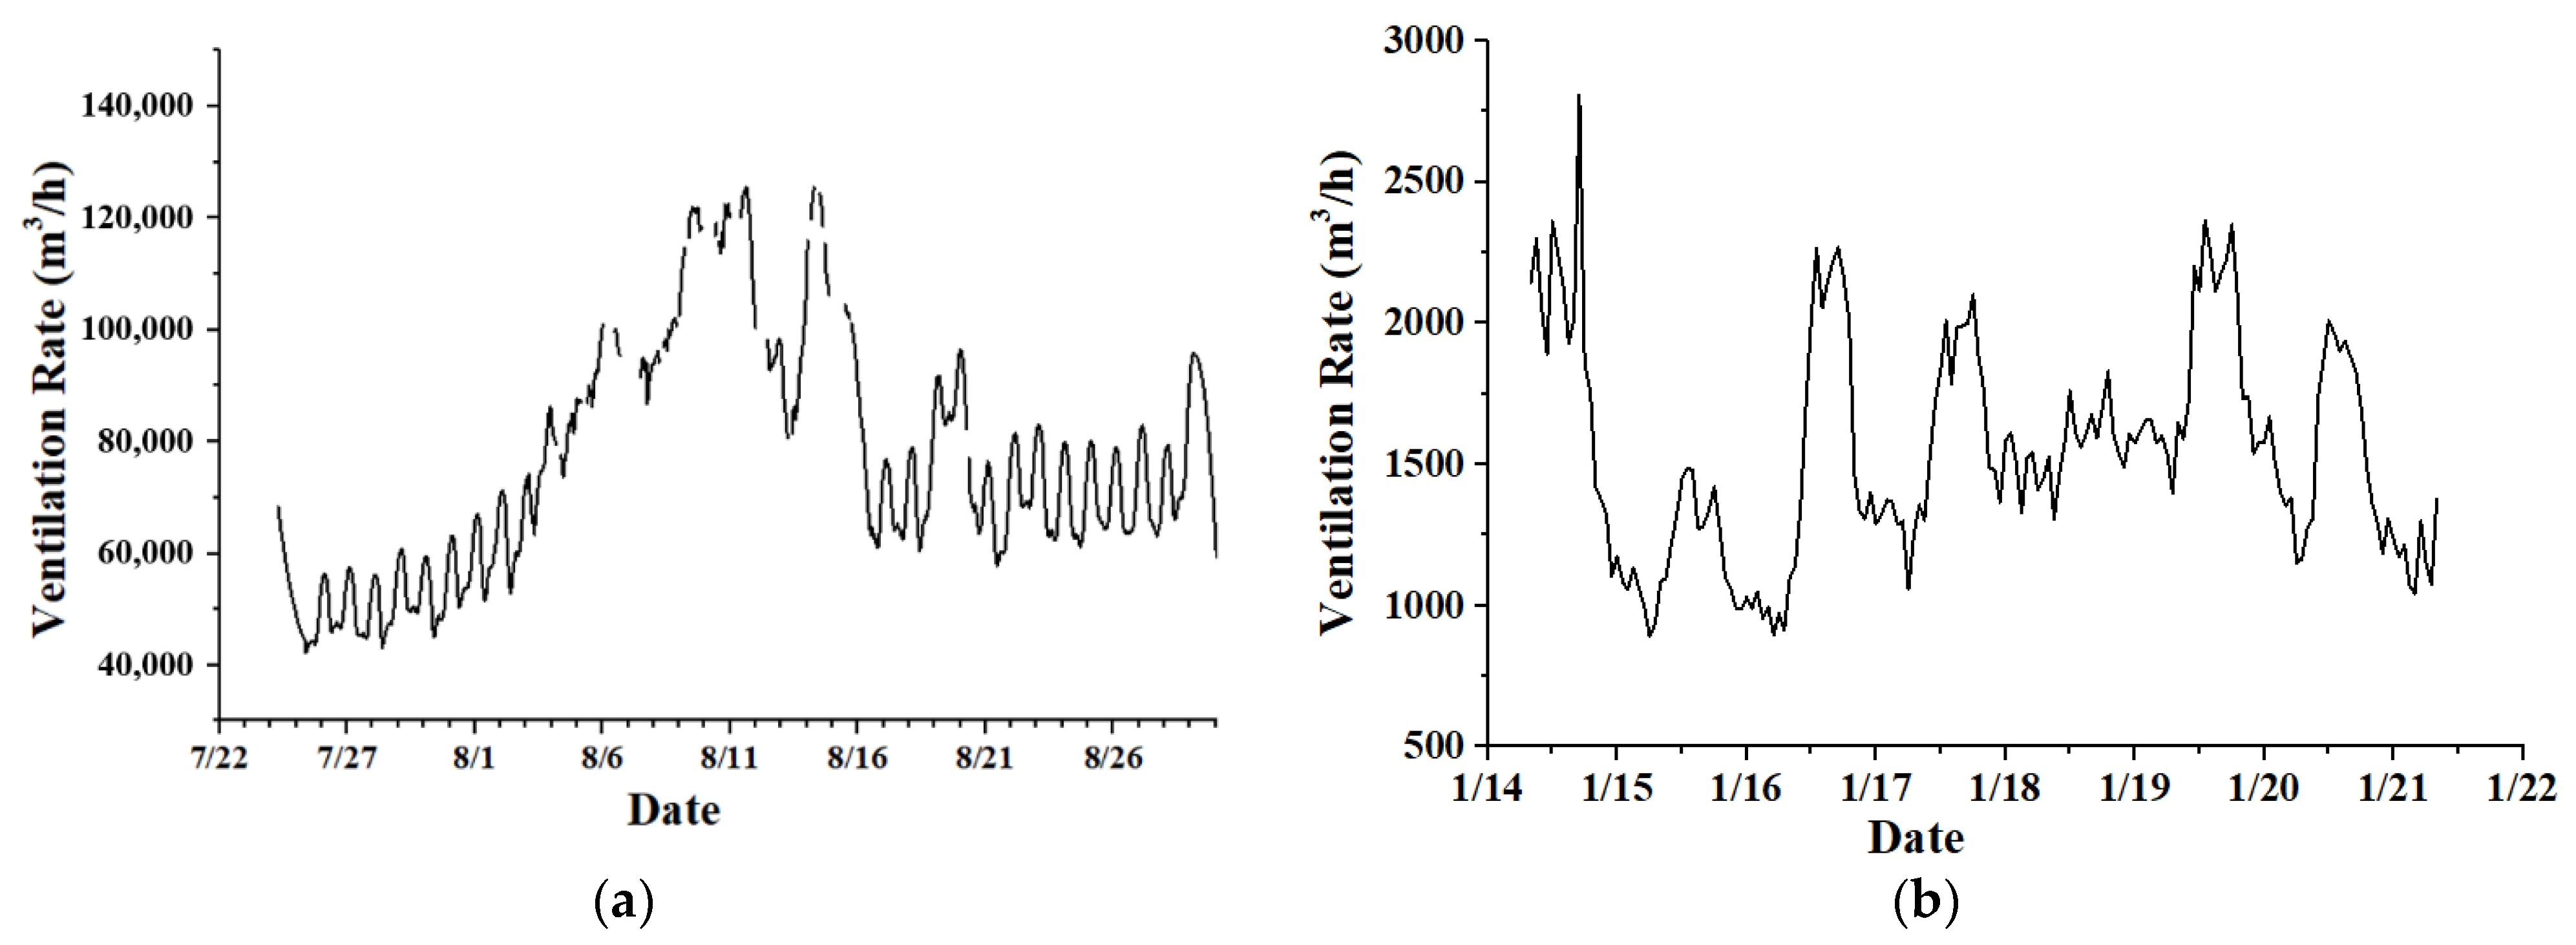
Ventilation rate is one of the key variables in the animal buildings and is closely related to the indoor temperature, internal air flow, aerial pollutant emission and concentration. Insufficient ventilation hinders the dispersion of air pollutants and leads to high indoor pollution levels, which poses health threats to animals and workers. On the other hand, enhanced internal air flow due to the high ventilation favors the ammonia volatilization from manure. The daily average ventilation rates estimated using CIGR balance methods are shown in Figure 3. As expected, much better ventilation was observed in the summer period than in winter. On average, ventilation rate was 73,799 ± 39,655 m3/h in summer and 1646 ± 604 m3/h in winter. Both the seasonal trend and the magnitude of the ventilation flow were consistent with those reported by Xu et al. [14] for a naturally ventilated pig house in China, also using the CIGR method.
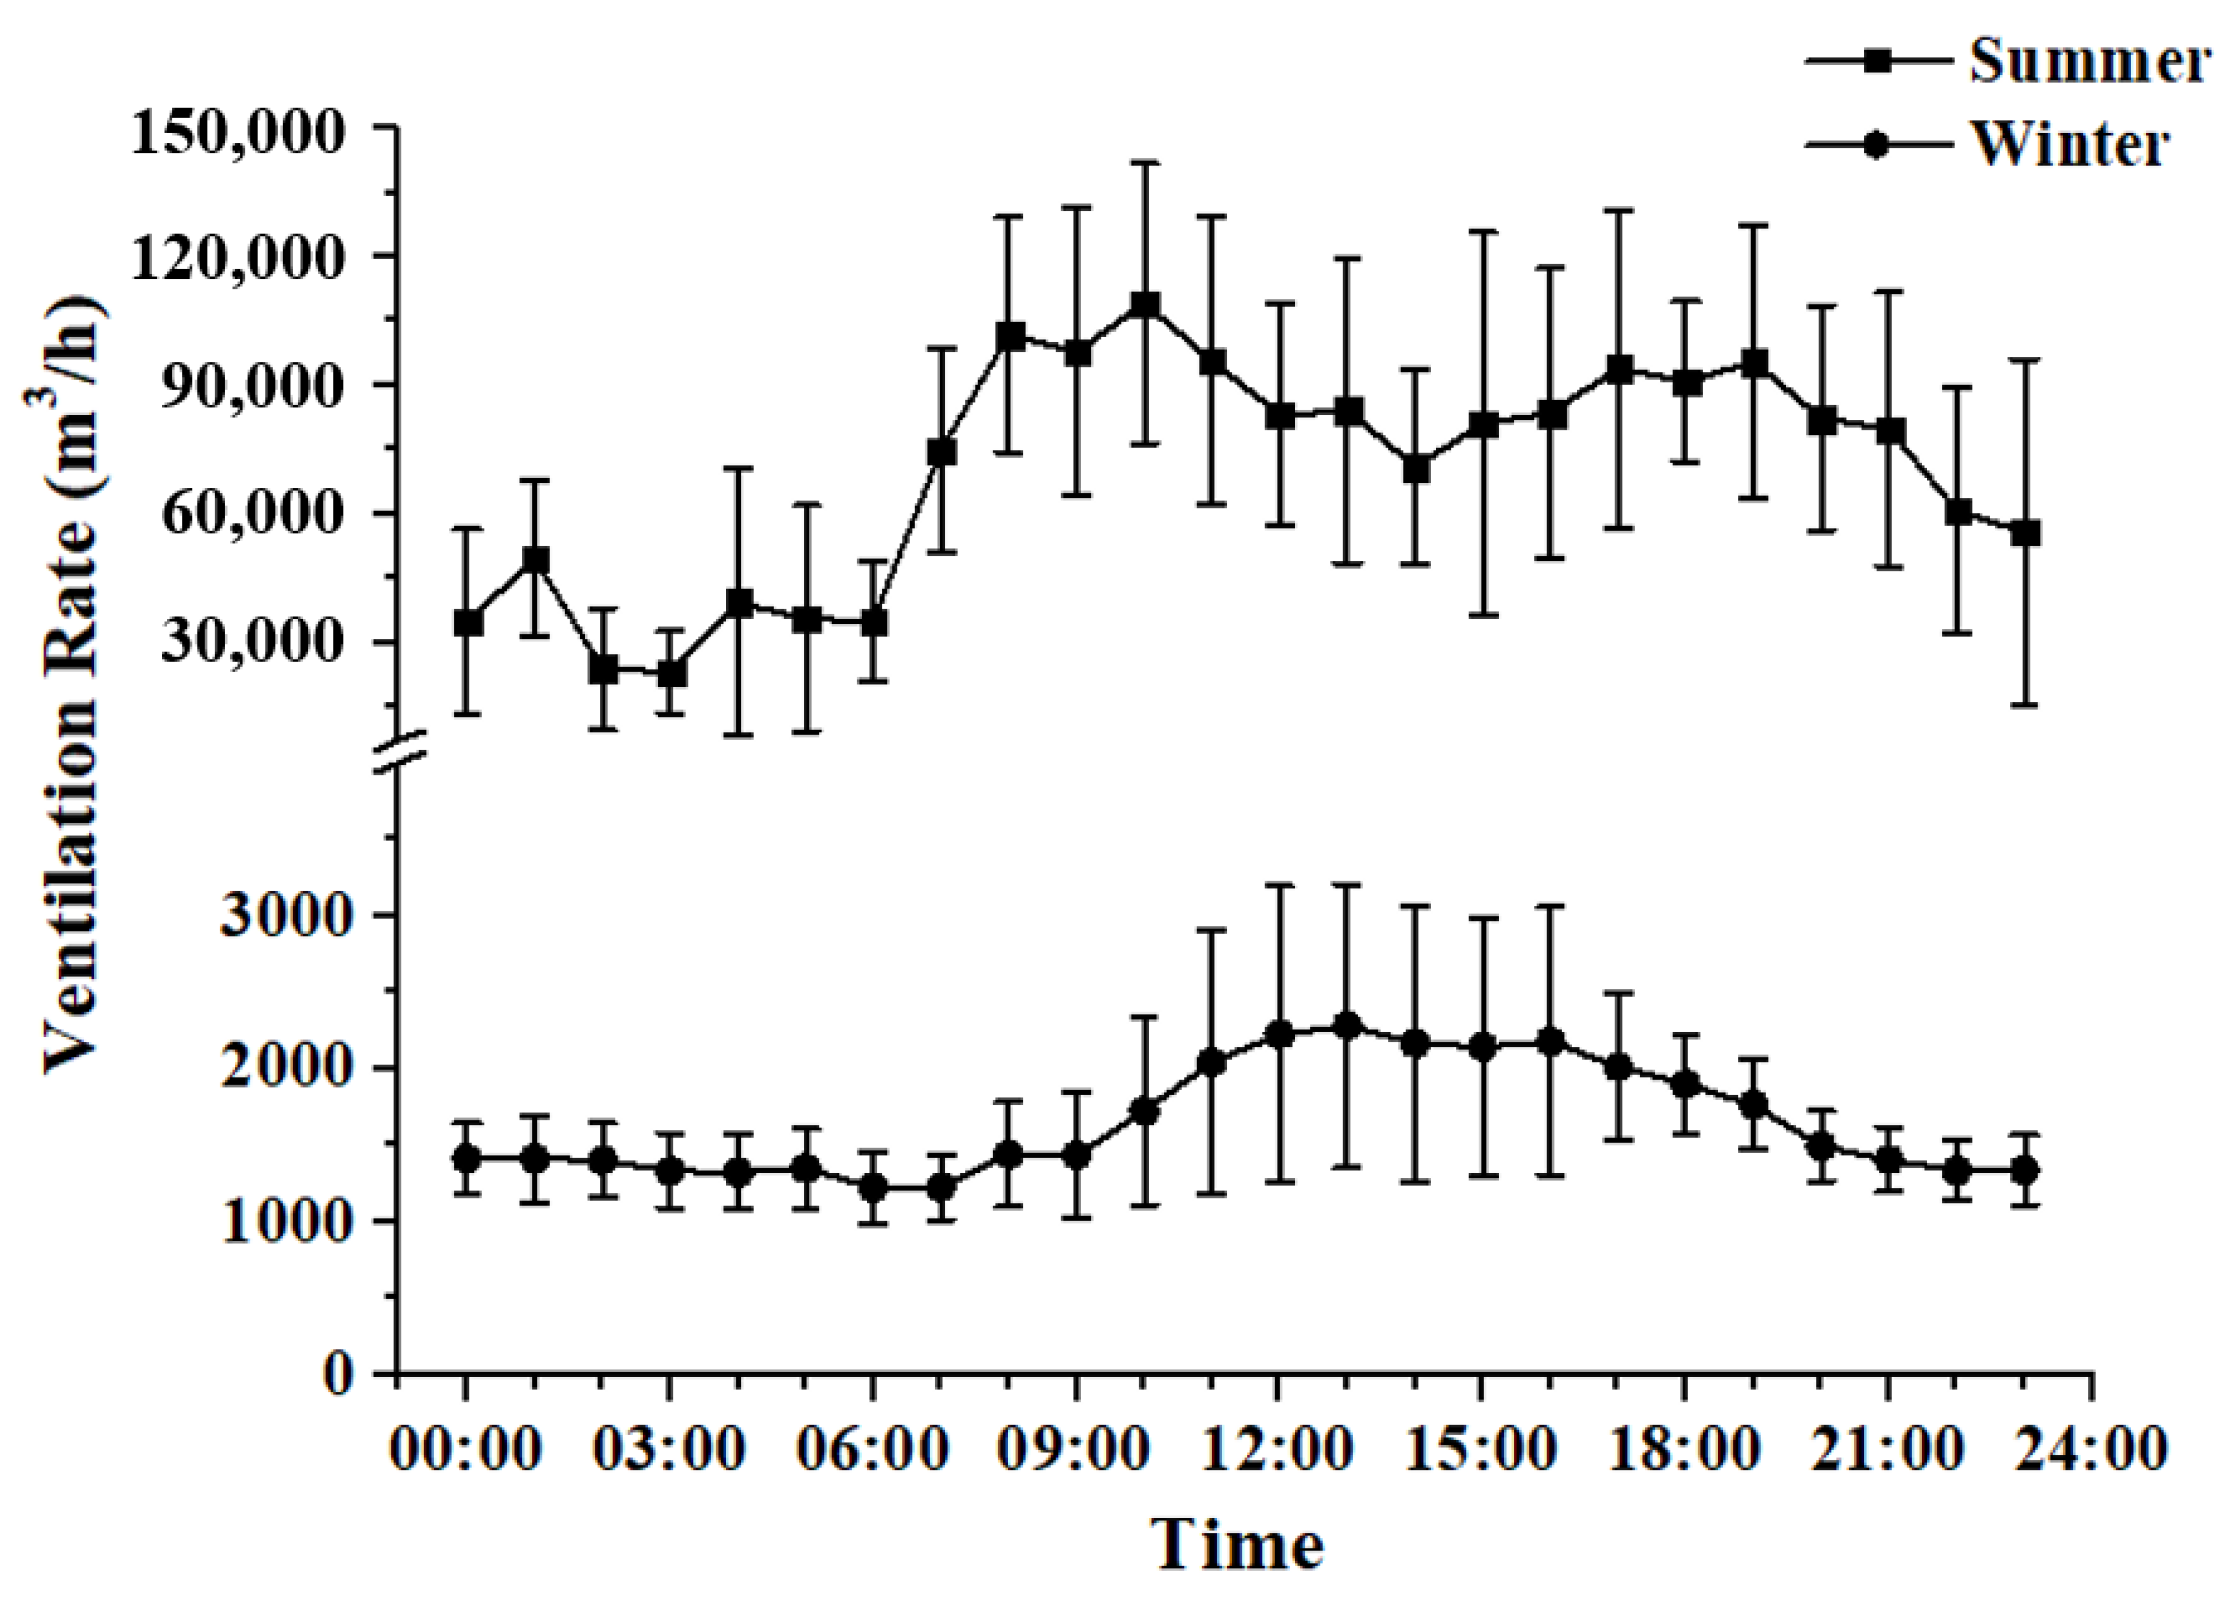
Hourly mean ventilation rates over the two monitoring periods were calculated and are plotted in Figure 4. It can be seen that the ventilation rates were generally higher during daytime as compared to the nighttime. According to the pig farm management in winter, windows were open for about 2 h around noon, which corresponded to the occurring time of high-level ventilation rates in Figure 4. This probably explained the apparent diurnal pattern of ventilation flow in winter. Although there was no difference in window openings between day and night in summer, variations in ambient environment condition such as wind speed and wind direction could lead to a fluctuation in ventilation between day and night.
3.3. Ammonia Concentration
Overall average ammonia concentrations were 1.28 ± 0.74 mg m−3 and 0.25 ± 0.10 mg m−3 for the winter and summer monitoring period, respectively. According to Environmental Parameters and Environmental Managements for Intensive Pig Farms in China (GB/T 17824.3-2008), the NH3 concentration in commercial pig farms should not exceed 25 mg m−3. The results of this study, although only measured continuously for a limited number of days during the two periods, indicated that the average NH3 concentration in the nursery pig house was far below the thresholds of the Chinese standard.
Table 1 summarizes the NH3 concentrations at different monitoring points. Due to the excellent air exchange with outdoor air in summer, indoor NH3 concentrations were remarkably lower than those measured during the winter period. In addition, ammonia concentrations at three indoor sampling positions were close to each other in summer. Tukey’s multiple comparison test gave the p value of 0.368 and 0.058 for the comparison of forepart and middle with the back monitoring positions, suggesting there were no statistically significant differences. This is because substantial air movement in summer favored the mix and dispersion of ammonia. Thus, concentrations measured at a limited number of positions were possible to represent the overall pollution level inside the livestock buildings. On the other hand, significant variations in ammonia concentrations were found among the three measuring positions during the winter period (p < 0.05). This was not surprising since less air flow existed within the nursery house. The highest concentration appeared at the position furthest from the entrance door, where the air movement was the smallest. Ammonia level was the lowest at the middle sampling position near to the windows. Although the windows were closed for most of the time, more air movements were possible at this position due to the window opening around noon and the window leakage. This might be the reason for the observed low ammonia level.
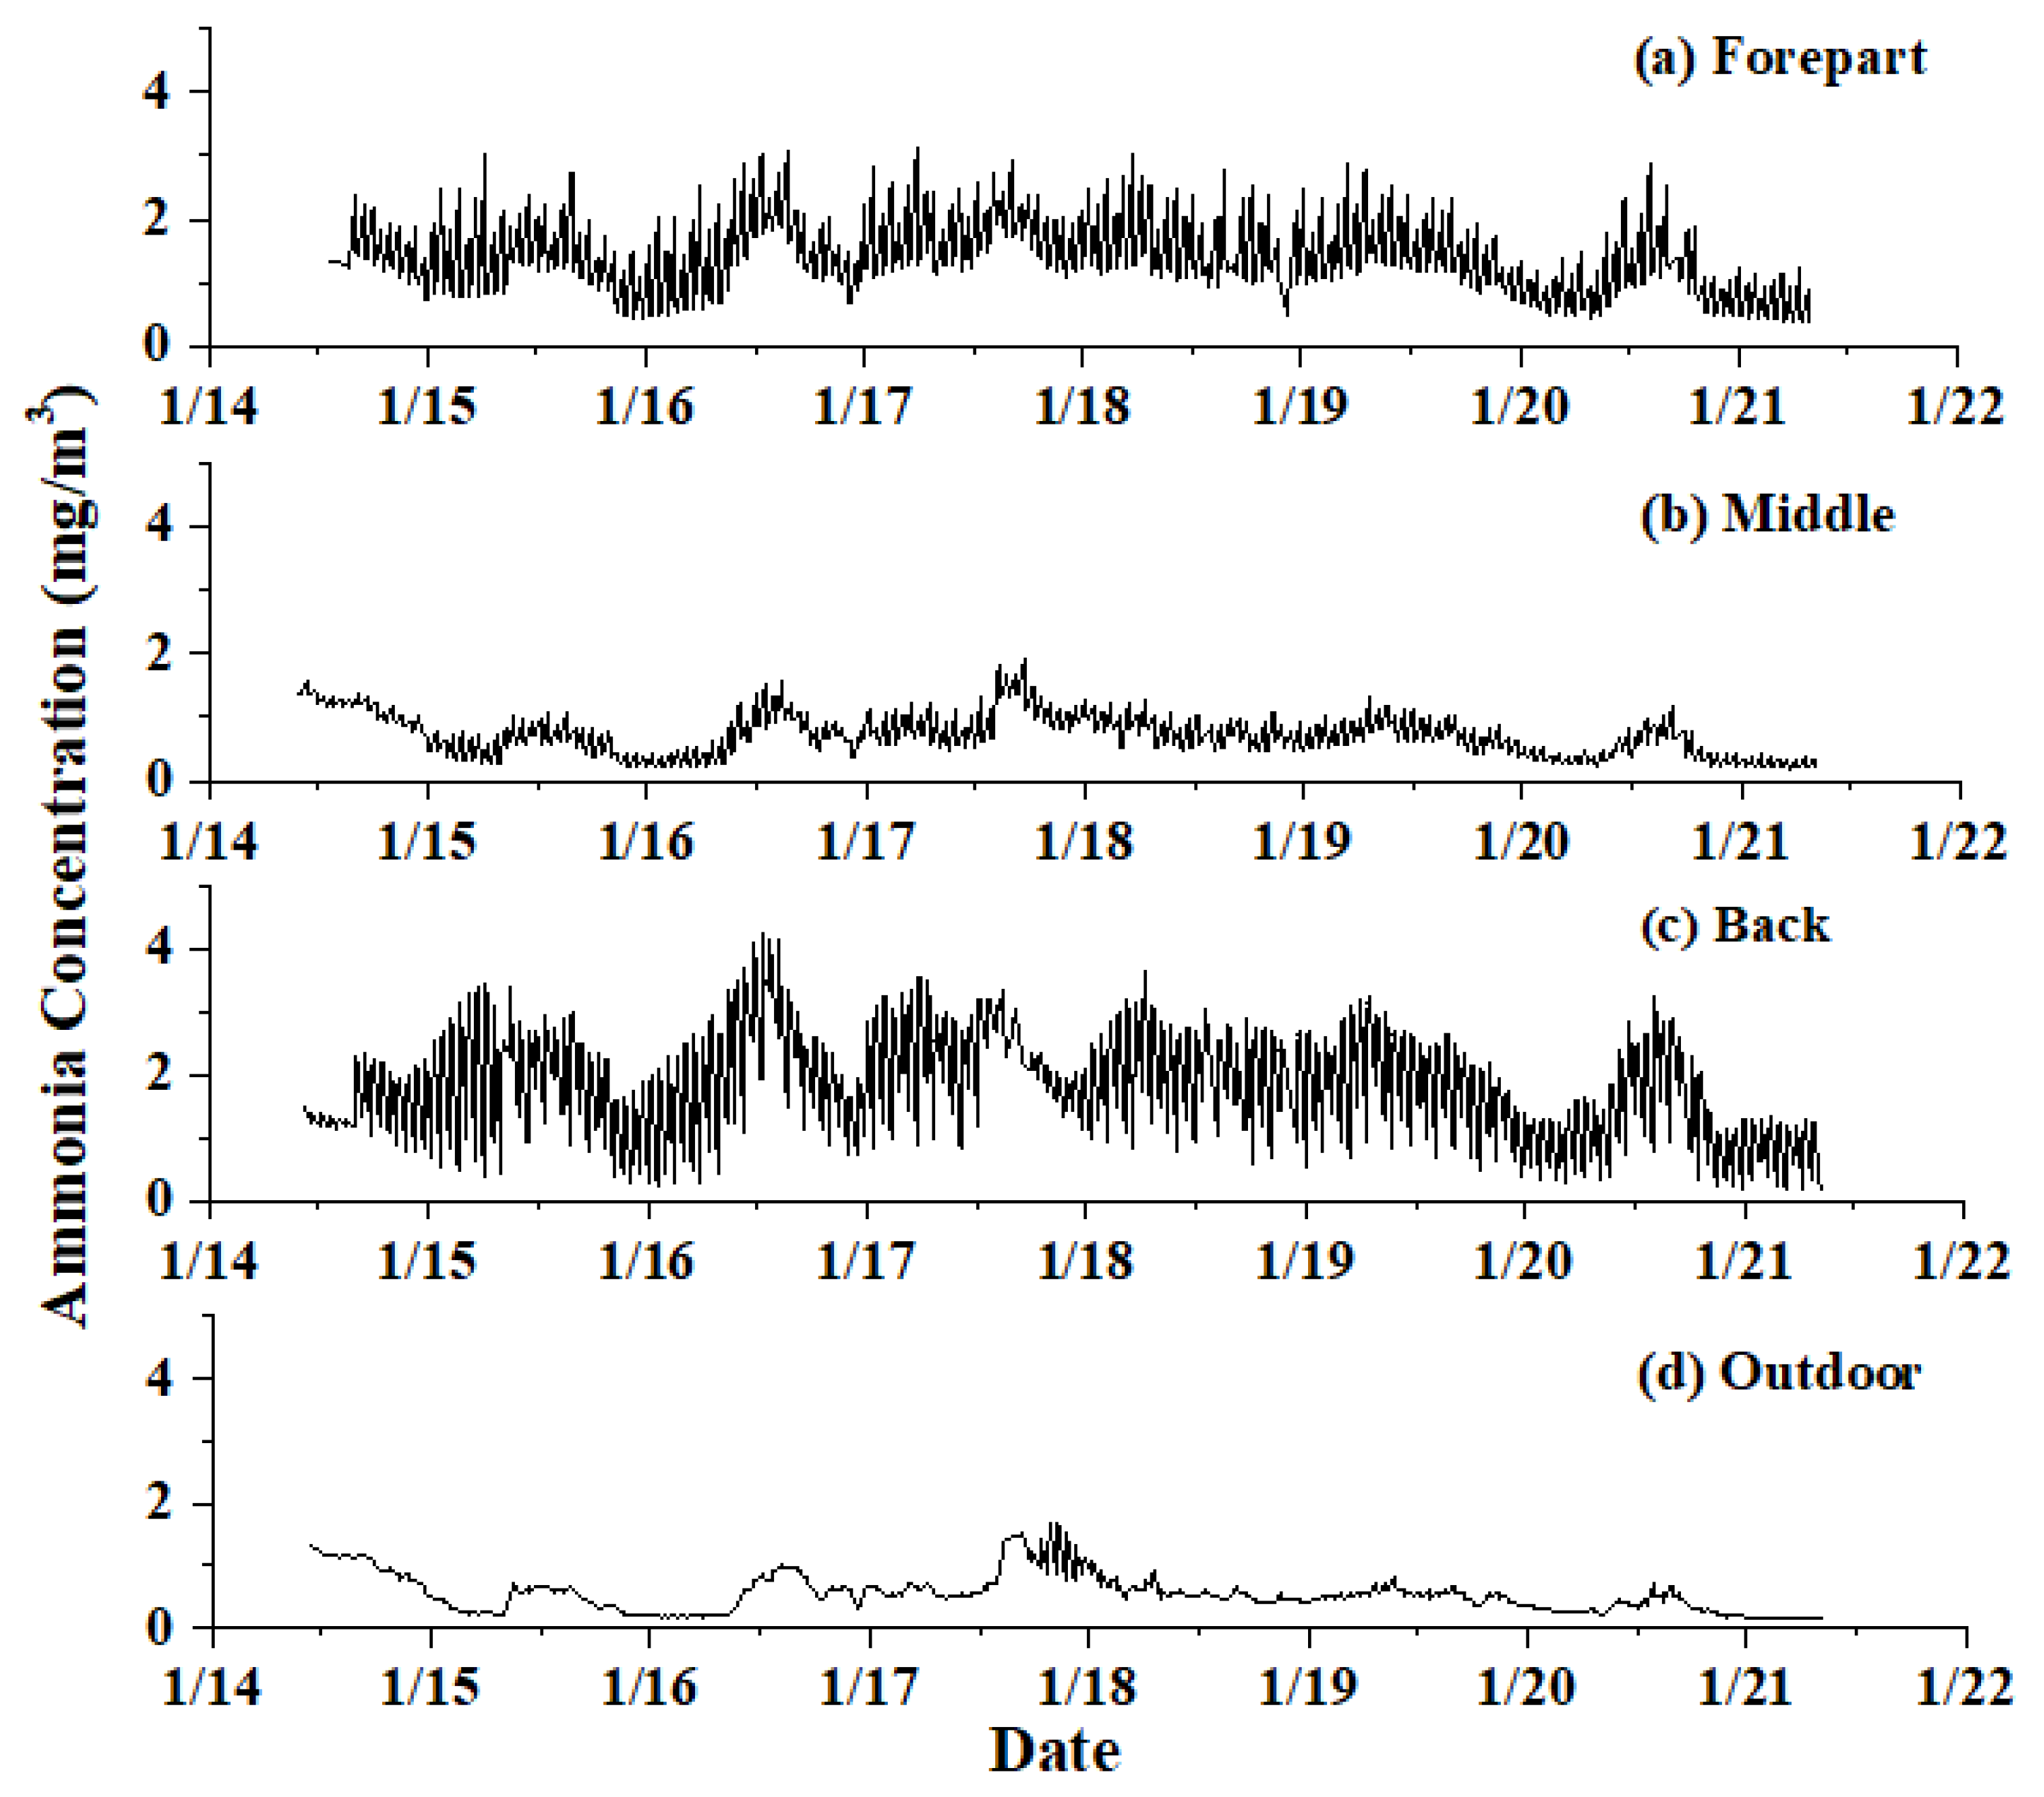
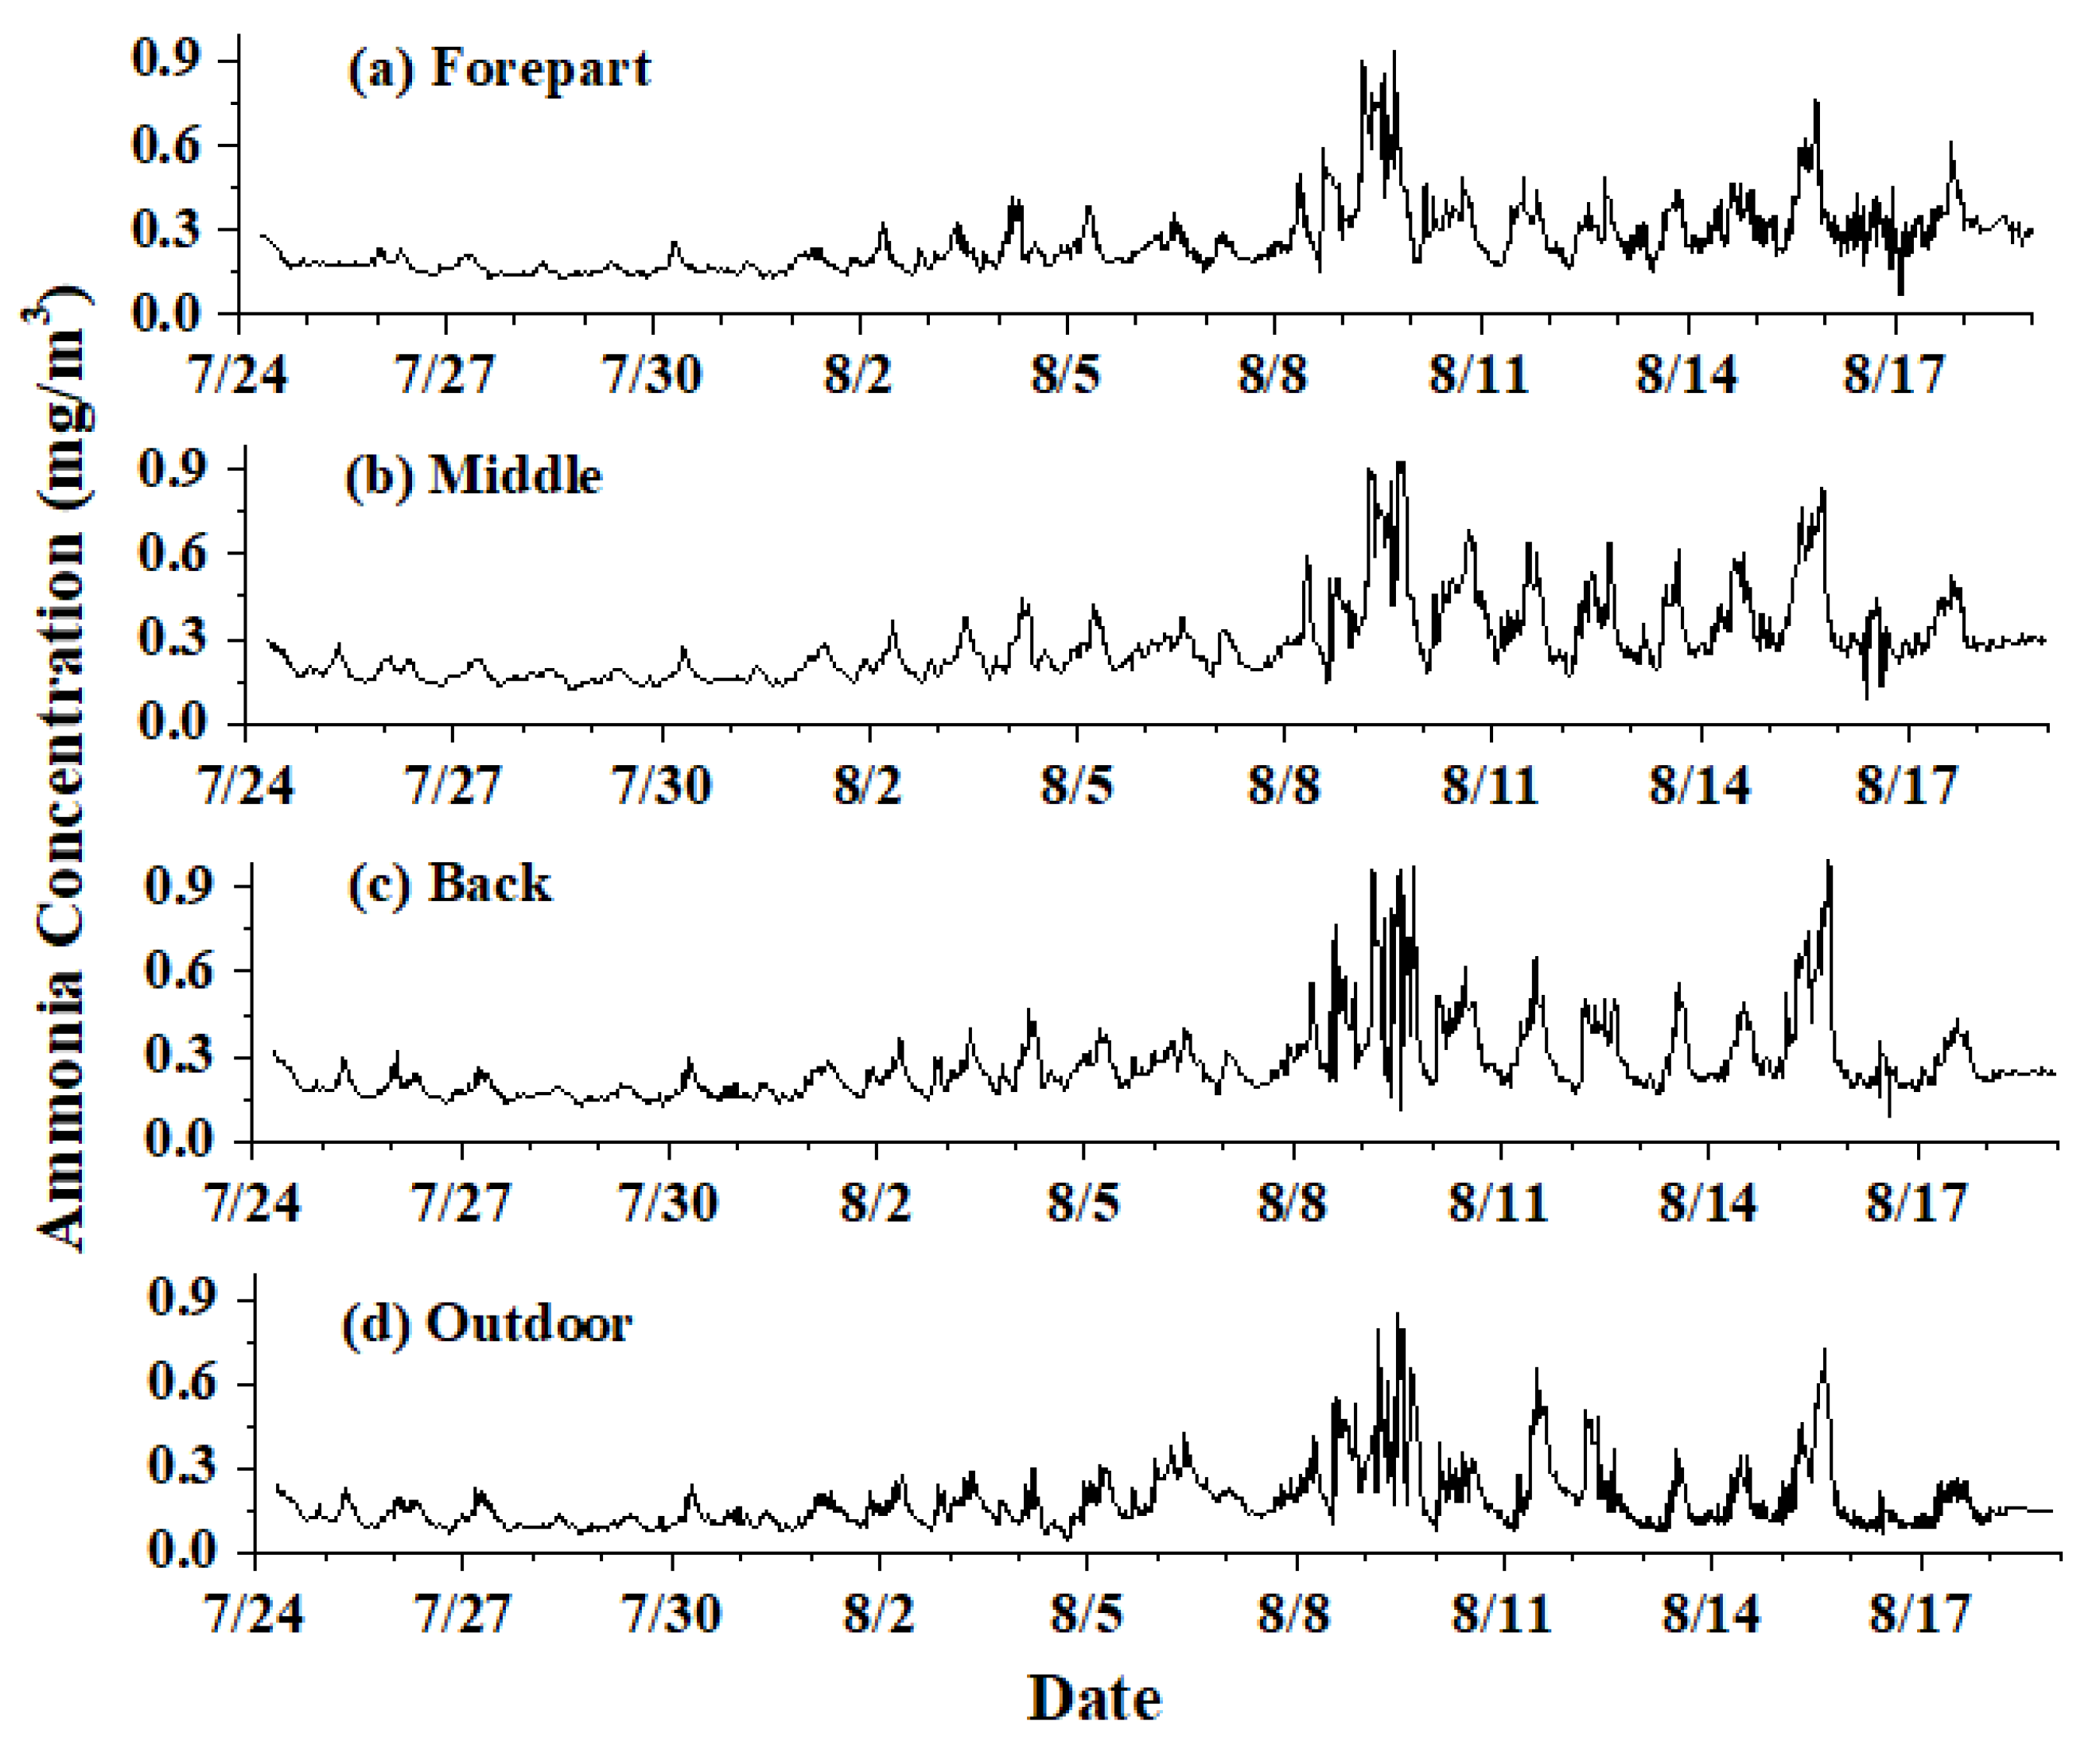
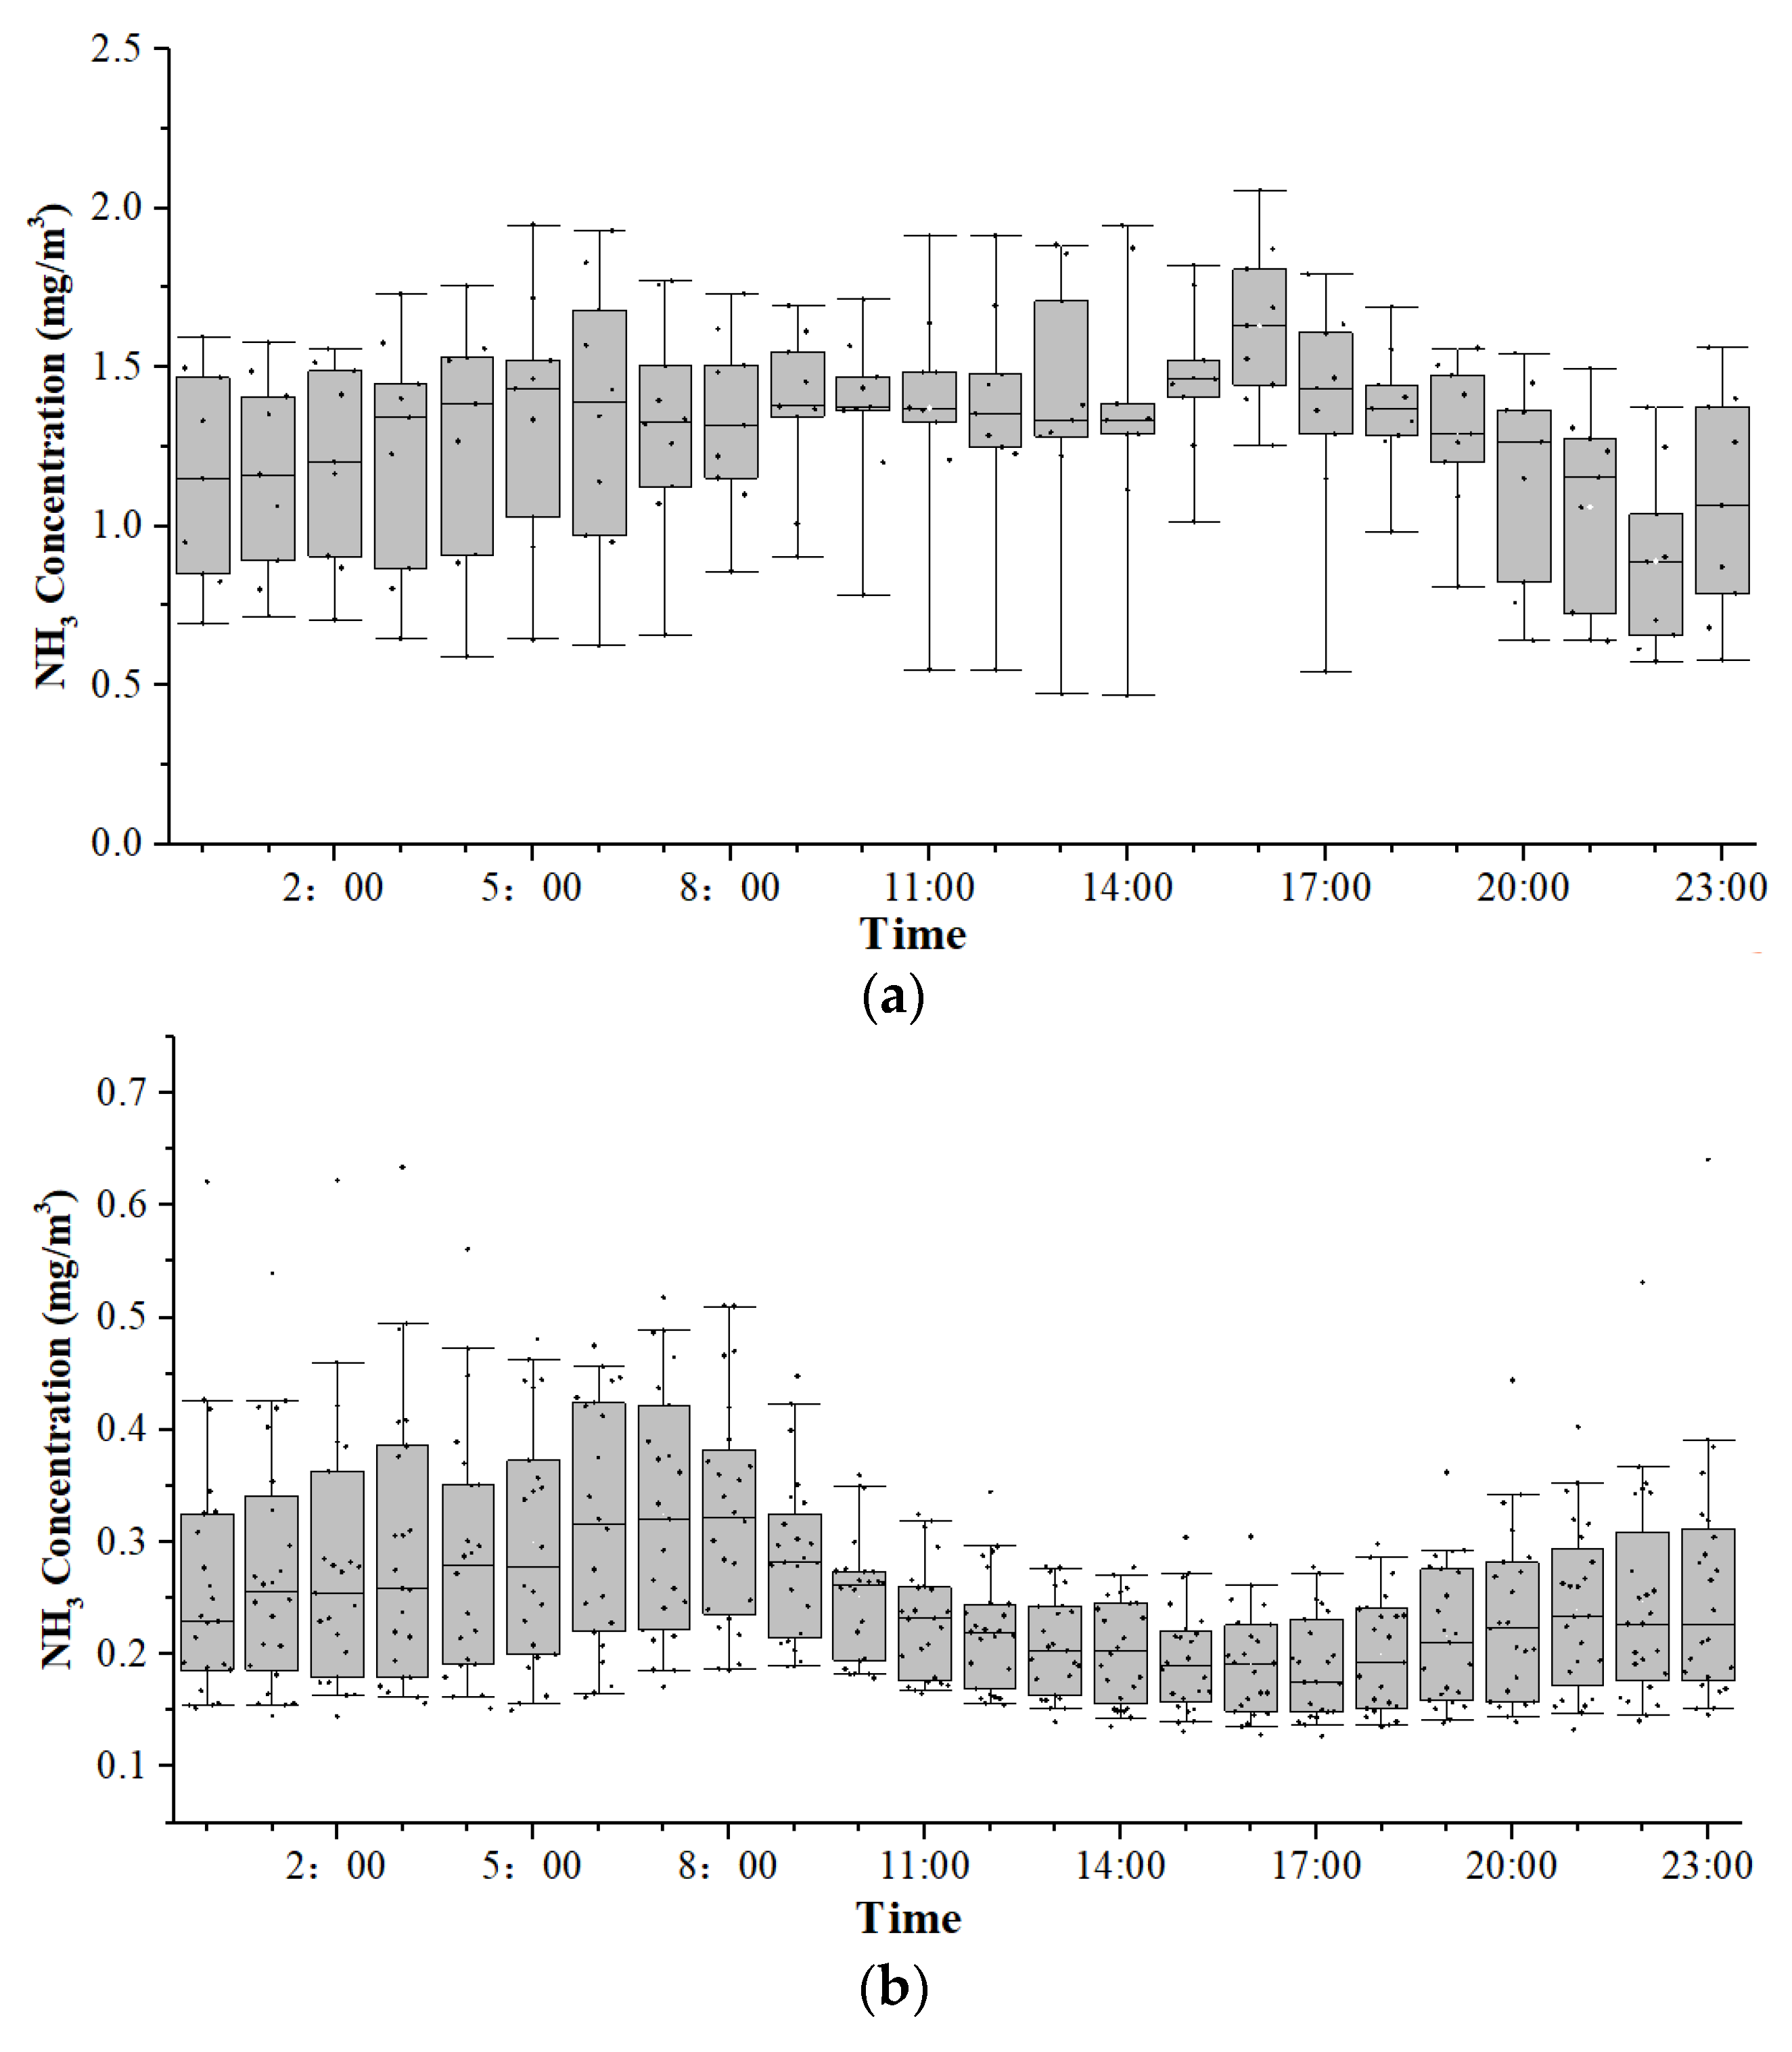
Figure 5 and Figure 6 show the time series of ammonia concentrations measured continuously during winter and summer, respectively. Pronounced oscillation in indoor ammonia concentrations can be seen in Figure 5, and the fluctuation patterns in the three indoor measuring positions were consistent (Figure 5a–c). By contrast, the outdoor concentration curve was relatively flat. As for the summer campaign, concentration variations with time were less notable. Because the windows were fully open in summer, the outdoor concentration exhibited a similar pattern to the indoor concentrations. Both Figure 5 and Figure 6 suggest that the variations in ammonia concentration happened probably more within a day than between days. Therefore, Figure 7 was prepared to illustrate the hourly average concentrations for all measurement days in winter and summer. It can be seen that the diurnal pattern was more obvious in summer than in winter. In summer, a clear peak appeared around 7:00 (Figure 7b). After that, ammonia concentration dropped significantly, probably due to the routine removal of manure under the slatted floor with flushing water. The lowest concentration was observed at around 18:00. After that, ammonia concentrations increased again. At night from 20:00 to 6:00, the fluctuation of ammonia concentration was relatively small. This trend was quite similar to those observed in another pig farm by Xu et al. [14] in August, though their measurement was not continuous. From Figure 7a, a small increase in ammonia concentration until noon can be identified in winter, corresponding possibly to the increase in temperature.
3.4. Ammonia Emission
Based on the ventilation rates and ammonia concentrations within and outside the pig house, hourly resolved ammonia emission factors were obtained for the two monitoring periods. Overall, the average emission rates of ammonia were 0.3221 ± 0.2921 pig−1 and 0.1039 ± 0.0550 g d−1 pig−1 for the summer and winter periods, respectively. The mean emission rate observed during summer period was almost three times that of the winter period, which was in contrast to the seasonal trend of ammonia concentration. This is not surprising since the NH3 volatilization from the urine and feces was more notable at high temperatures in summer. High temperature favors the urea hydrolysis and increases the enzyme activity for the manure decomposition. On the other hand, the higher air flow efficiently diluted and transported the ammonia to the outdoor air, which led to lower concentrations than those in winter.
Although the seasonal trend in emission was consistent with those observed in other pig production buildings in China [11,14,24], the magnitude of emission rate from this study was relatively smaller. Other studies were carried out in fattening pig houses. However, this study took place in a nursery house and the smaller amount of excretion from the nursery pigs of light weight can partially explain the differences in ammonia emission rates. Furthermore, the routine flushing of the manure under the slatted floor kept the NH3 emissions at lower level. Research on the emission rate from nursery pigs is relatively scarce. Cabaraux et al. [25] evaluated the emission rate from the weaned pigs of body weight ranging from 7 kg to 23 kg with different floor systems. The observed mean NH3 emission rate of 0.40 g d−1 pig−1 for a fully slatted floor is in good agreement with our result of 0.3221 g d−1 pig−1.
To promote the development of an ammonia emission inventory, China issued technical guidelines for an ammonia emission inventory in 2014. Based on the guidelines, ammonia emission factors were estimated and compared with those derived from the current study in Table 2. Temperature and age of pigs were also included in the table. The emission factors obtained from this study in winter varied from 0.0046 to 0.2899 g d−1 pig−1 with an average of 0.1039 ± 0.0550 g d−1 pig−1. In summer, values ranging from 0.0094 to 1.9422 g d−1 pig−1 were observed, resulting in an average of 0.3221 ± 0.2921 g d−1 pig−1. Apparently, emission rates derived from this study were much lower than those from the Chinese guideline. The estimates from the guideline are based on the general environmental factors and production practices popular in China. Lower emission factors obtained in the present study could be related to different environmental factors and production practices, including temperature, air flow, age of pigs, feeding strategy, and manure management, etc. Therefore, to reduce the uncertainty in emission inventory, it is better to use farm-specific emission rates whenever possible. Field measurements of emission such as this study can provide valuable information for assessing uncertainty when default values given in the guideline are used.
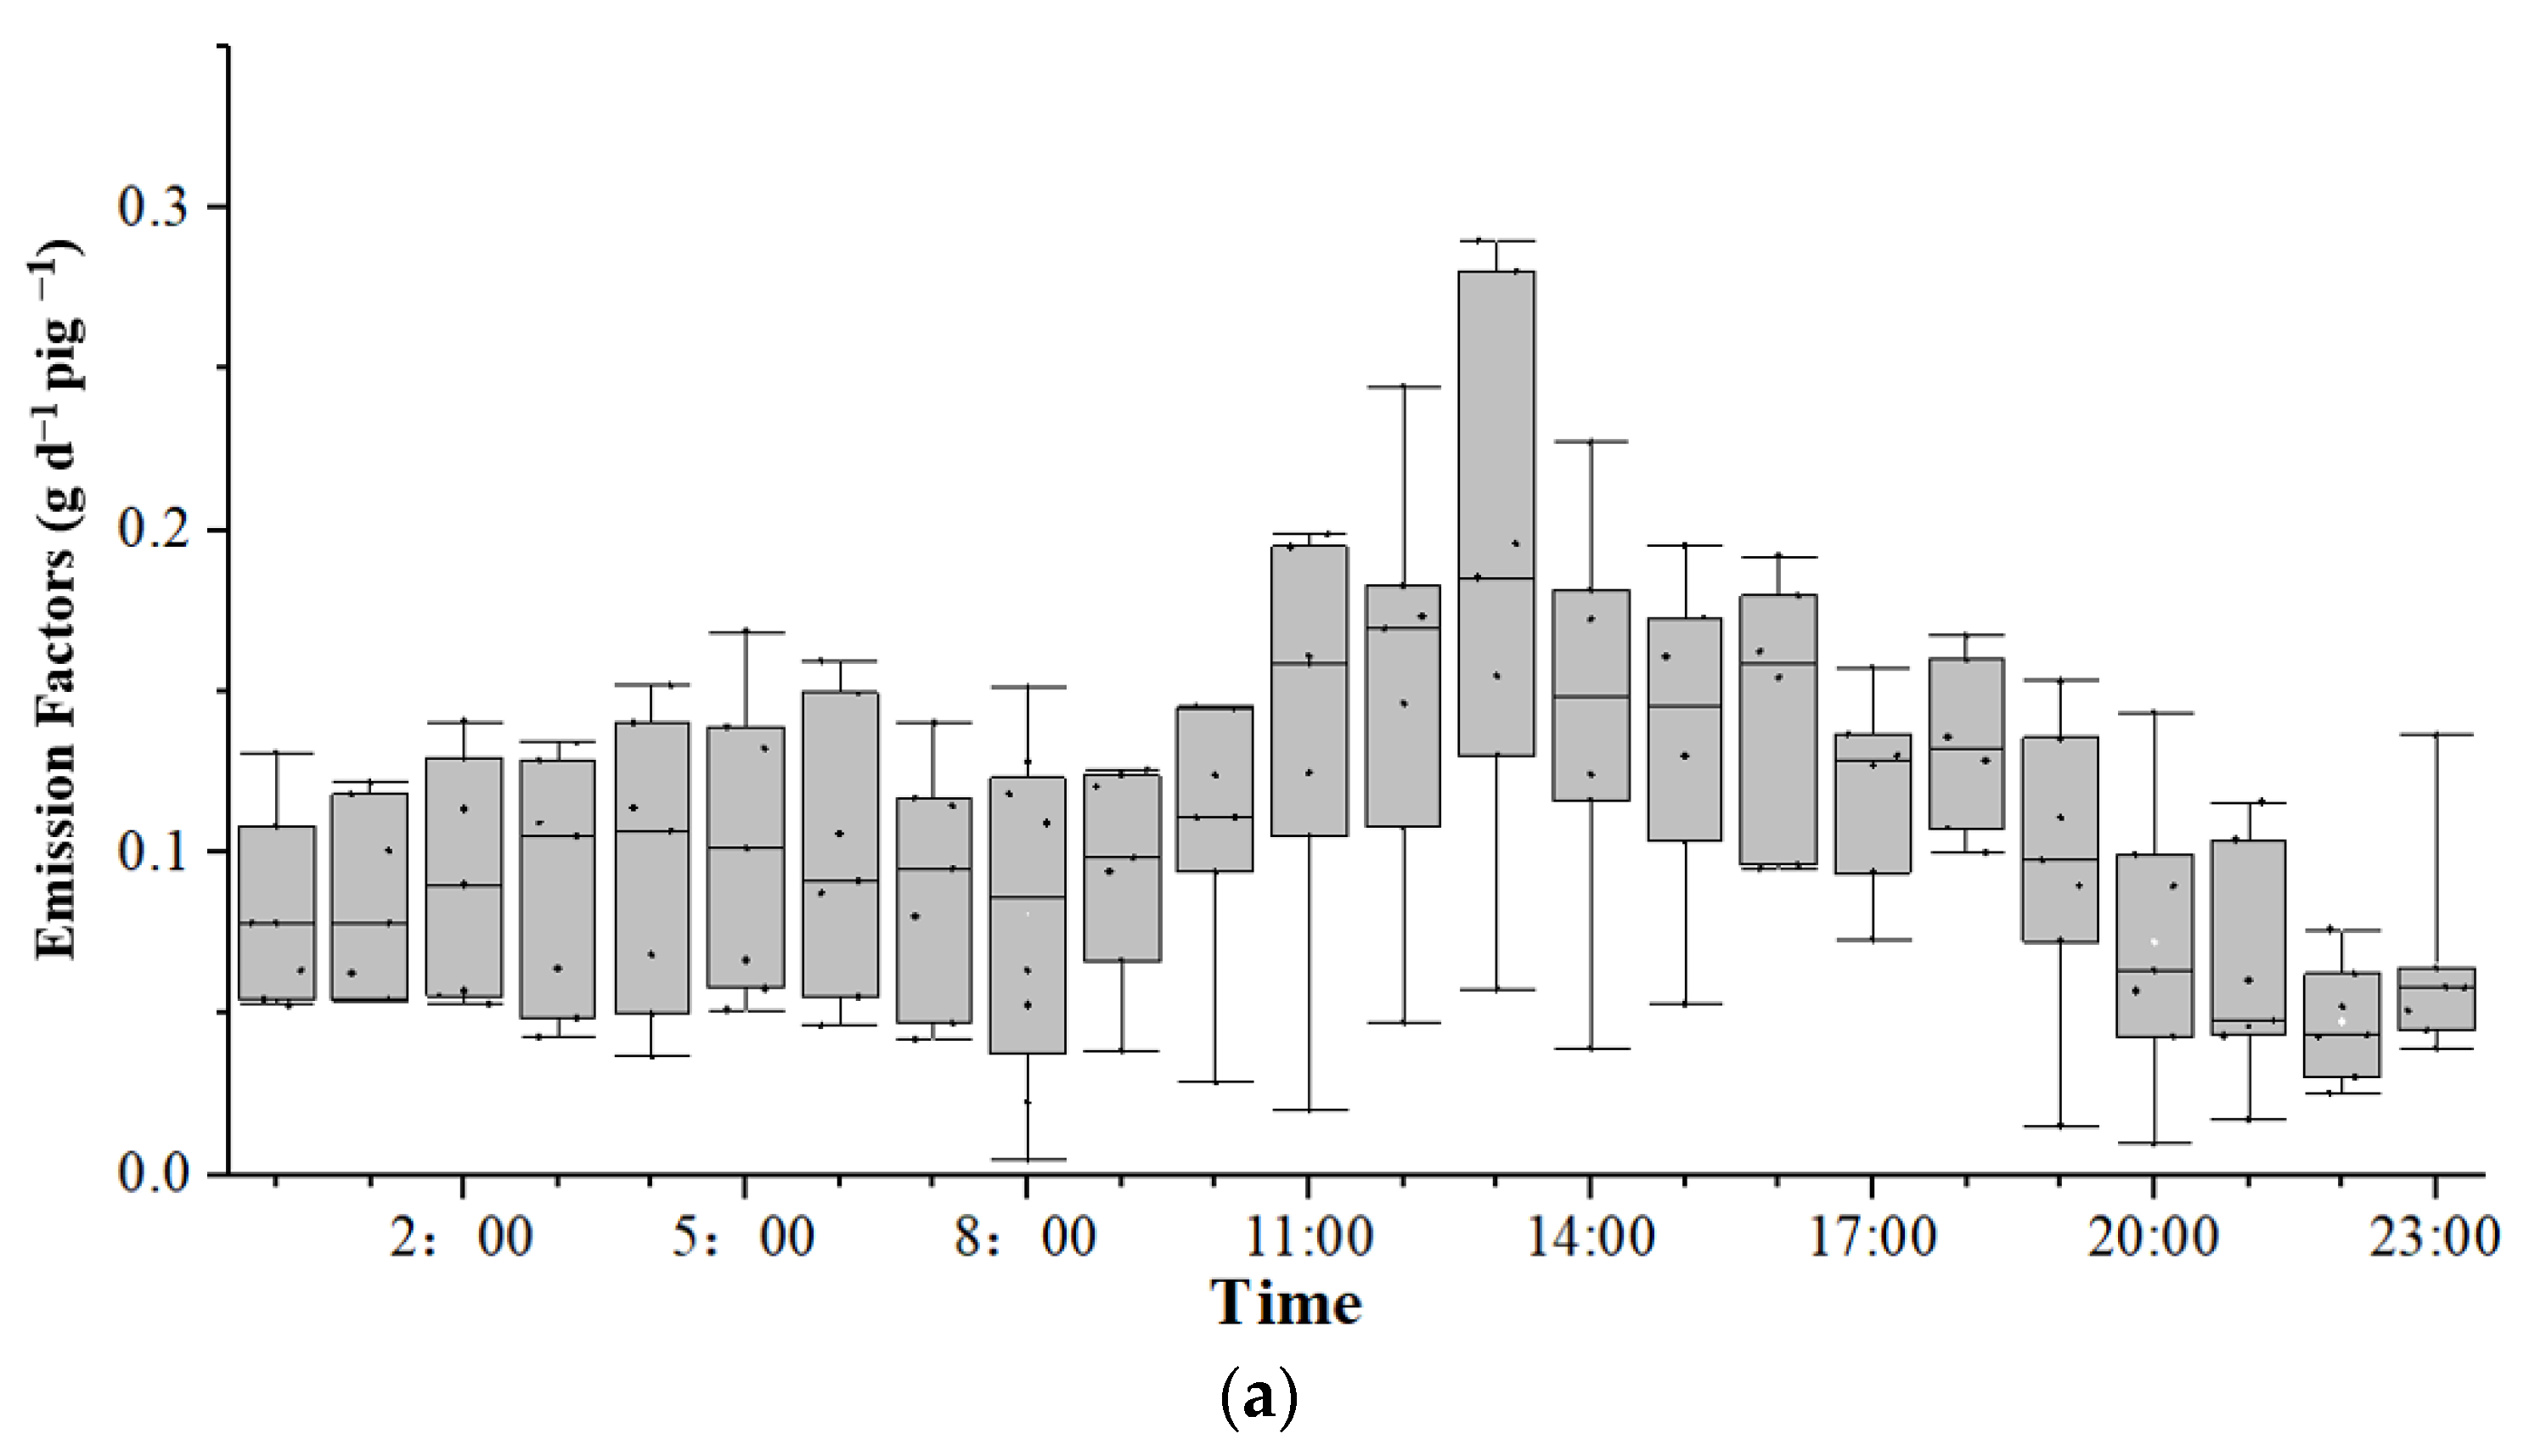
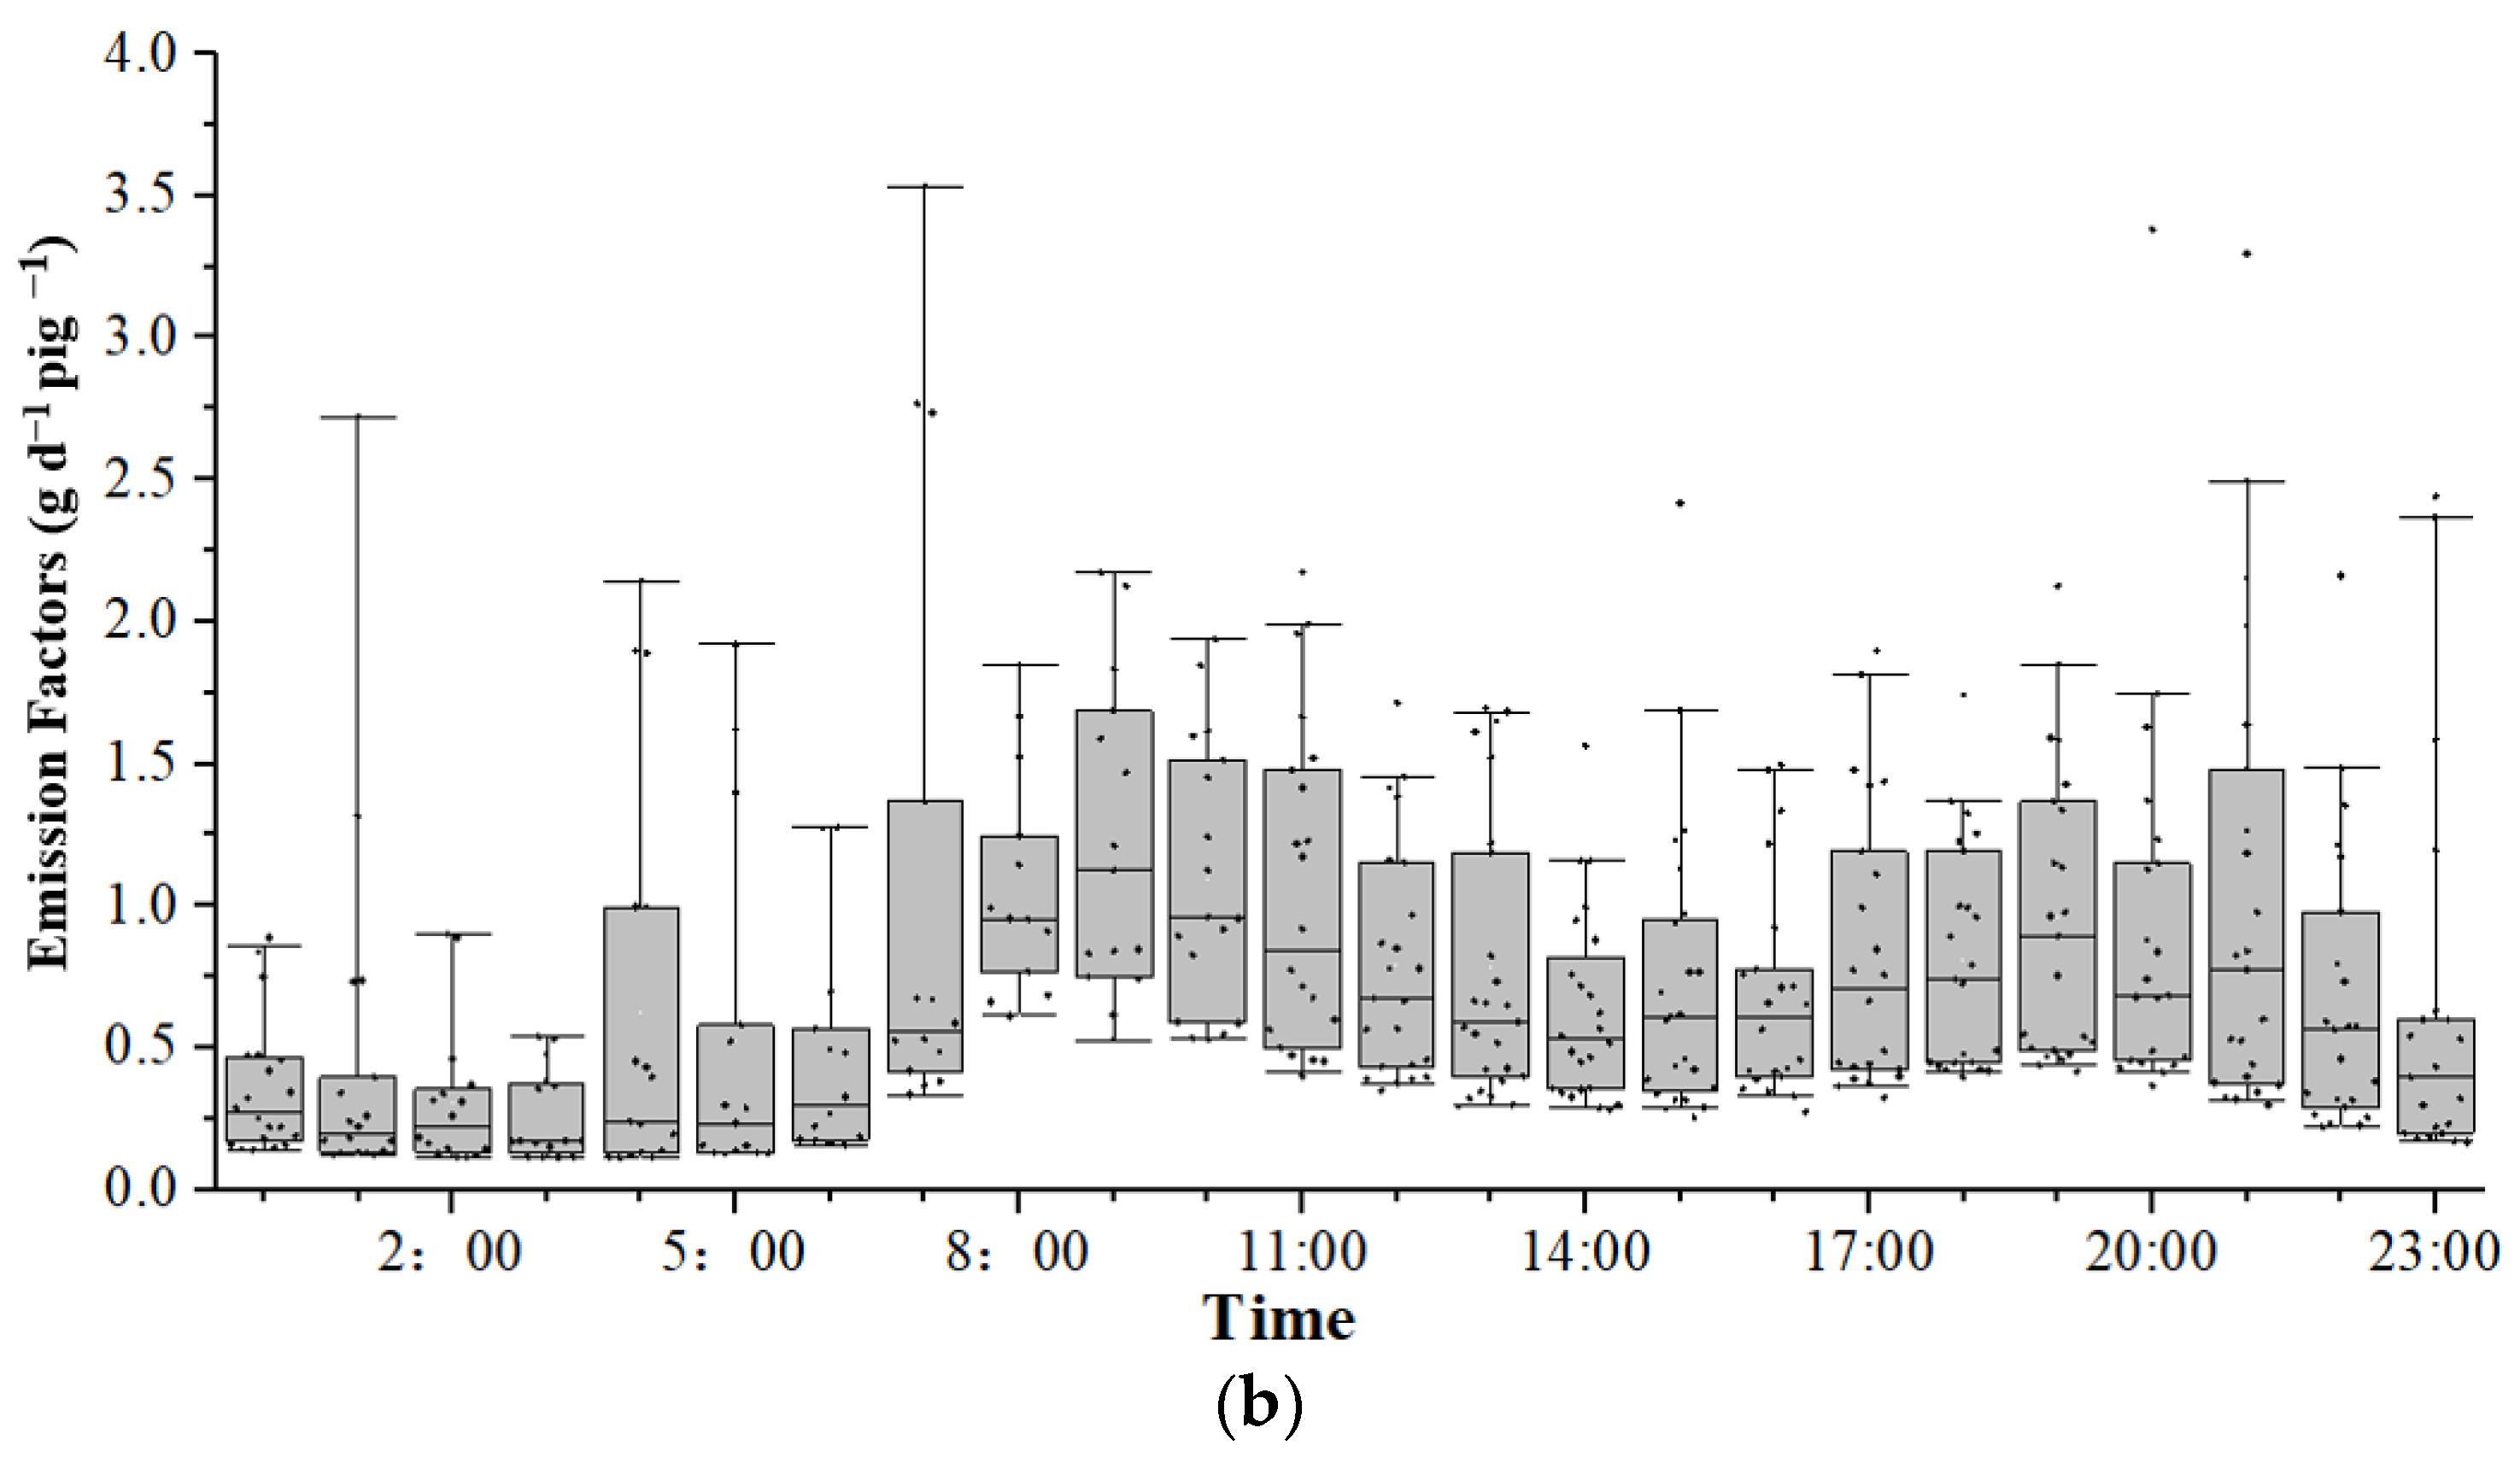
Hourly averaged ammonia emission rates were given in Figure 8. It was shown that the emission rates varied significantly within one day. From both measurements in winter and summer, higher emissions during daytime were observed. In summer, the peak value occurred around 9:00 and the troughs appeared at around 2:00. In winter, the highest emission was observed at 13:00 and the lowest at around 22:00. The diurnal pattern of being high in daytime and low at night has also been discussed by Ulens et al. [26] when evaluating the sampling strategy for the estimation of ammonia emission factors in pig-fattening facilities. It is imperative to take into consideration the existence of these large hour-to-hour differences in ammonia emission when designing a sampling protocol. Higher temperature, increased urination behavior of the pigs, and higher air movements over the floor during daytime were possible reasons for the diurnal variations.
3.5. Relation of Environmental Parameters with Ammonia Emission
The statistical correlations between environmental parameters and NH3 emissions are given in Table 3. Because the exchange with outdoor air was quite limited during the winter measurement period (Figure 3), the relationship of ventilation rate with NH3 emission was only significant at the 0.05 level. On the other hand, the indoor temperature and relative humidity showed statistically significant effects on ammonia emission rates (p < 0.01). This is consistent with the result of Bluteau et al. [27] in dairy cattle buildings. High relative humidity usually hinders the air pollutants dispersion [28]. Consequently, negative correlation coefficients between NH3 emission and humidity were obtained in both the winter and summer periods. With the fully opened windows in summer, more influence of ventilation and ammonia concentration on NH3 emissions were suggested (Table 3) than of indoor temperature and humidity. Both ventilation rate (r = 0.80, p < 0.01) and ammonia concentration (r = 0.58, p < 0.01) were positively related to NH3 emissions. A strong correlation between NH3 emission and body weight was observed for the summer period (r = 0.67, p < 0.01), but not for the winter period, which might be explained by the wide range of body weights resulting from relatively longer monitoring durations in summer. Vranken et al. [28] also demonstrated that ventilation rate and body weight of the fattening pigs had a strong correlation with ammonia emission.
The quantitative relationship between ammonia emissions and environmental variables can be established to understand the effects of these variables [13,29,30,31]. Based on the hourly averaged emission rates and the corresponding environmental variables, multiple linear regression models Equations (2) and (3) were proposed to describe their relationships in winter and summer, respectively. In the analysis, 80% of datasets were randomly selected for model development and the remaining 20% were used for model evaluation.
where EF is the emission rate, g h−1 pig−1; Ci is the average indoor ammonia concentration, mg m−3; V is the ventilation rate, m3 h−1; W represents the body weight, kg; T and H stand for indoor temperature, °C, and relative humidity, %.
The coefficient and the significance of each variable are given in Table 4. Except for the ventilation rate in winter (p > 0.05), all other variables were shown to have a statistically significant influence on ammonia emission. During the winter measurement, the ventilation rates were low and spanned a relatively narrow range. Thus, its impact was not strong.
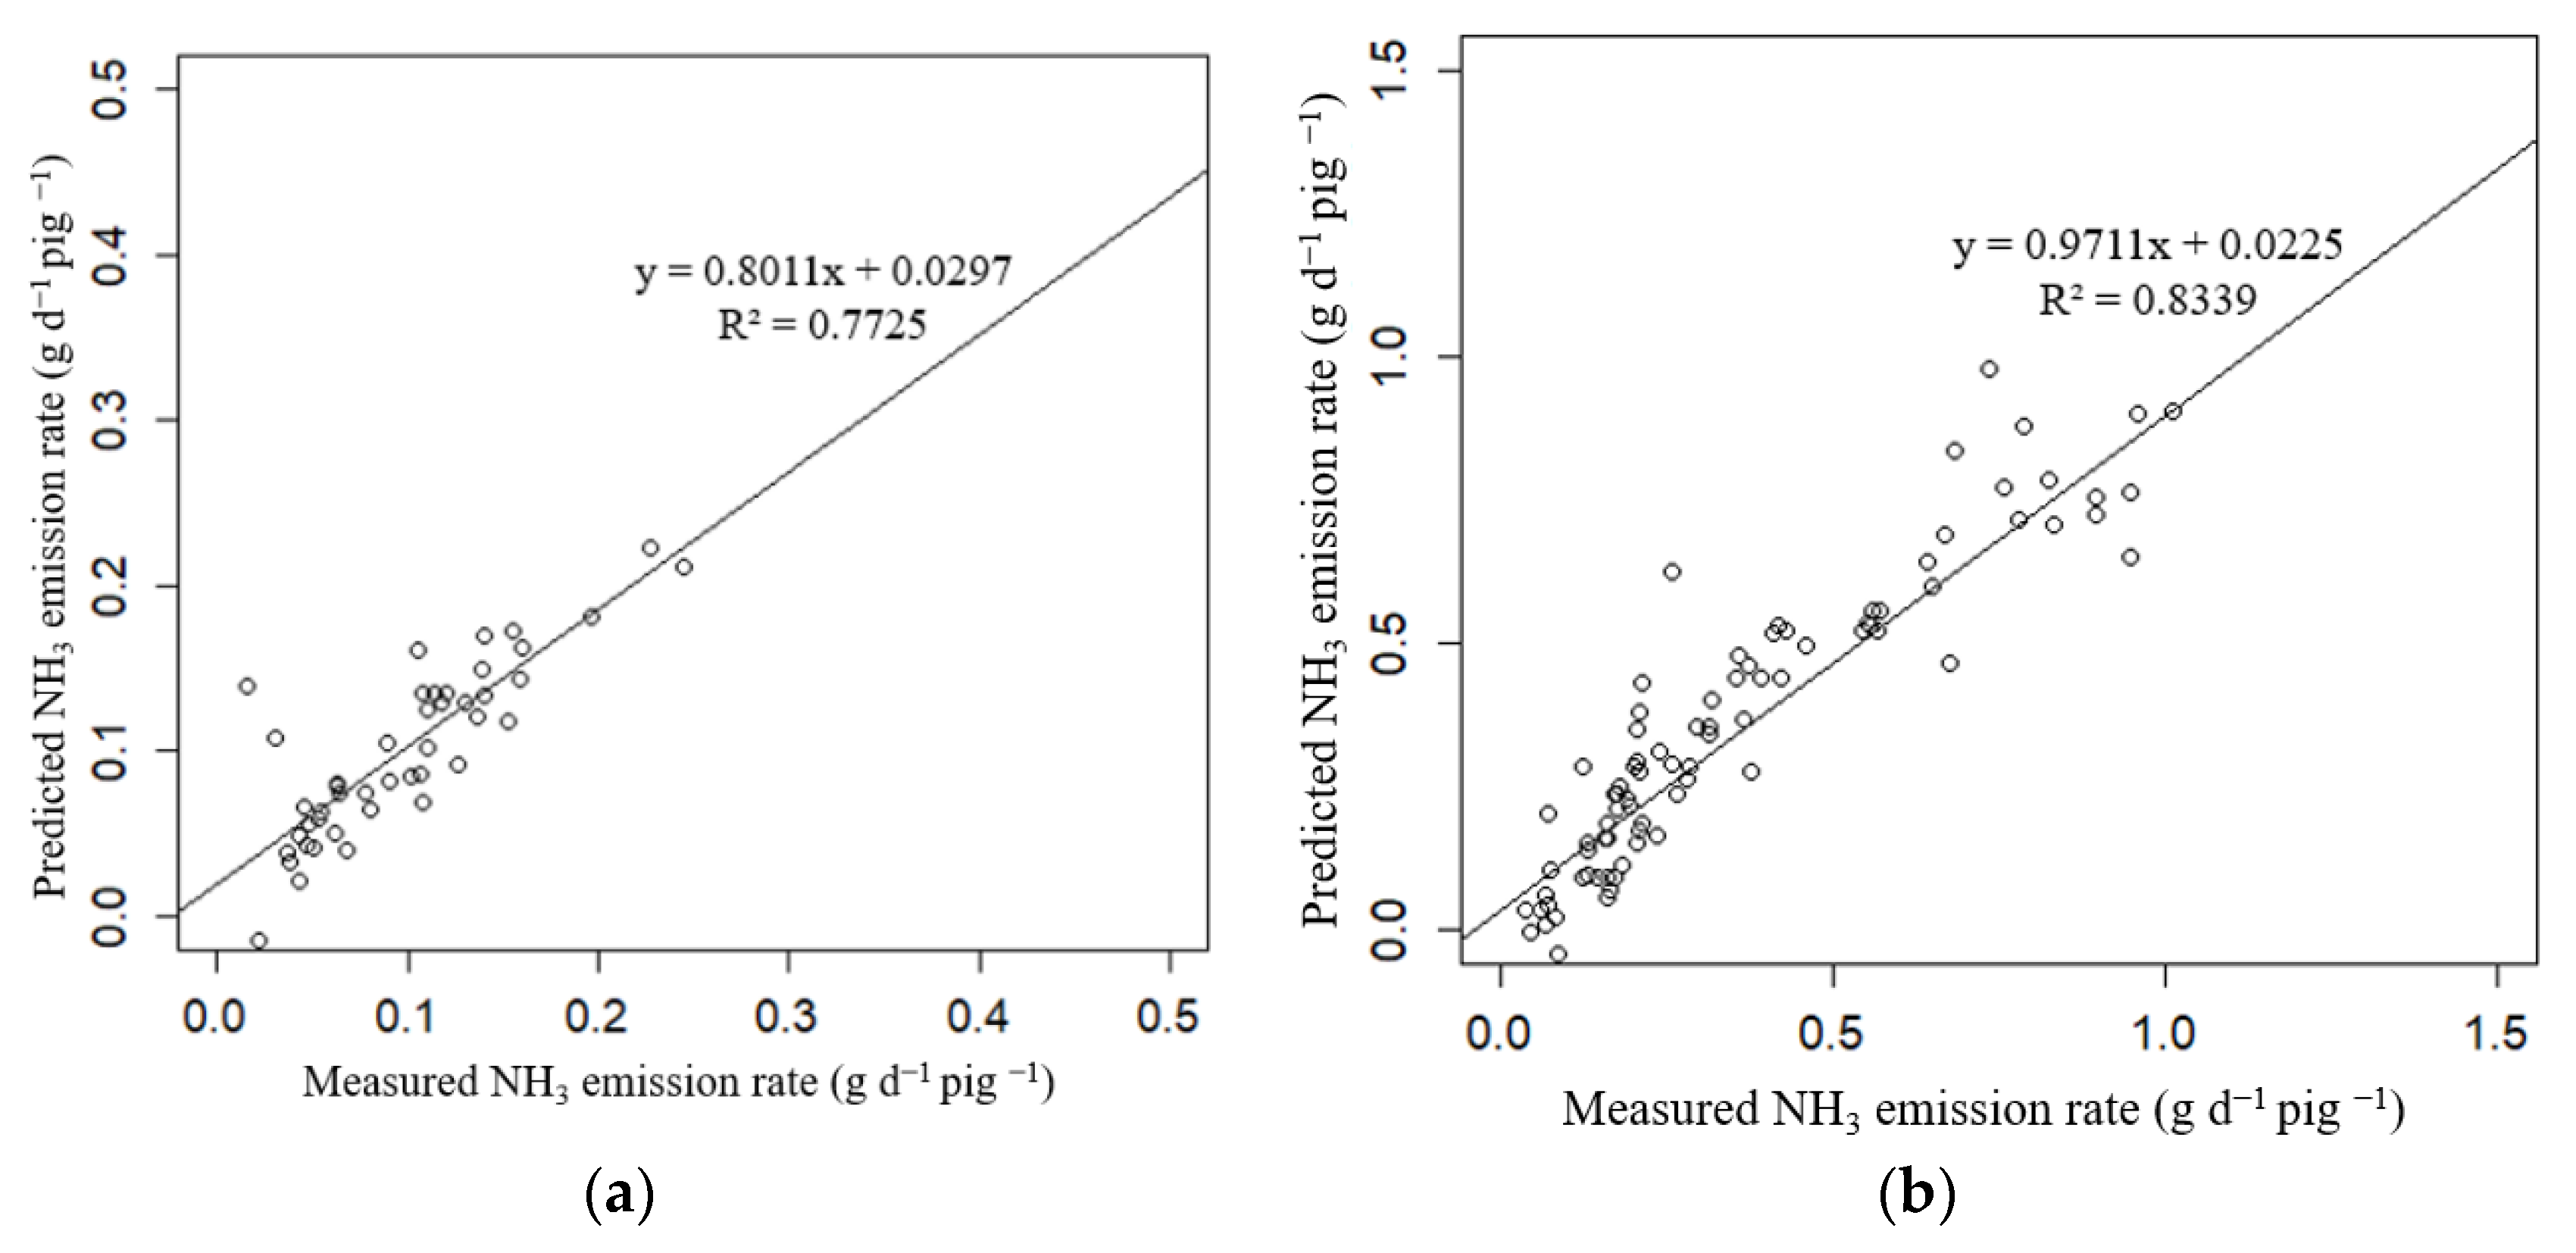
In order to evaluate the performance of Equations (2) and (3), scatter plots of predicted values versus respective observed values are illustrated in Figure 9. It can be seen that the predicted NH3 emission rates were in good agreement with measured counterparts for both winter and summer measurements. Nevertheless, the resulting equations are specific for the current nursery pig houses because ammonia emission depends upon a great variety of variables, such as: building design, floor system, manure management, ventilation rate, body weight, indoor temperature, relative humidity, airflow pattern, and many others. In fact, different variables were involved in equations proposed from various studies [13,29,31], highlighting the different effects of individual variables for specific livestock facilities.
4. Conclusions
Ammonia concentrations within the pig nursery house were continuously monitored during the two periods in winter and summer and the ammonia emission factors were subsequently calculated. Ammonia concentration was higher in winter (1.28 ± 0.74 mg/m3) than in summer (0.25 ± 0.10 mg/m3). On the other hand, a higher mean emission rate of 0.3221 g d−1 pig−1 was obtained during the summer measuring period than during winter (0.1039 g d−1 pig−1). Through multiple regression analysis, the ammonia emission rates could be related to the indoor temperature, humidity, ventilation rates, and body weights. Spatial variation of ammonia concentration existed when the air flow within the house was weak in winter, suggesting multi-point monitoring is necessary to obtain the representative concentration. Higher emission rates during daytime in both the winter and summer measuring periods were found, with different peaking times in summer and in winter. The results indicate that the snapshot measurements of ammonia over a few minutes or hours might lead to considerable biases in quantifying ammonia emission.
Author Contributions
Conceptualization, R.X.; formal analysis, R.X.; funding acquisition, R.X.; investigation, K.F. and Y.W.; visualization, K.F. and Y.W.; writing—original draft, K.F. and Y.W.; writing—review and editing, R.H. and R.X. All authors have read and agreed to the published version of the manuscript.
Funding
This work was supported by the Fundamental Research Funds for the Central Universities of China, grant number 2662017JC039.
Data Availability Statement
Data is contained within the article.
Conflicts of Interest
The authors declare no conflict of interest.
References
- Liu, X.J.; Zhang, Y.; Han, W.X.; Tang, A.H.; Shen, J.L.; Cui, Z.L.; Vitousek, P.; Erisman, J.W.; Goulding, K.; Christie, P.; et al. Enhanced nitrogen deposition over China. Nature 2013, 494, 459–462. [Google Scholar] [CrossRef]
- Sutton, M.A.; Oenema, O.; Erisman, J.W.; Leip, A.; van Grinsven, H.; Winiwarter, W. Too much of a good thing. Nature 2011, 472, 159–161. [Google Scholar] [CrossRef] [Green Version]
- Cheng, Y.; Zheng, G.; Wei, C.; Mu, Q.; Zheng, B.; Wang, Z.; Gao, M.; Zhang, Q.; He, K.B.; Carmichael, G.; et al. Reactive nitrogen chemistry in aerosol water as a source of sulfate during haze events in China. Sci. Adv. 2016, 2, e1601530. [Google Scholar] [CrossRef] [Green Version]
- Plautz, J. Piercing the haze. Science 2018, 361, 1060–1063. [Google Scholar] [CrossRef]
- Ge, S.; Wang, G.; Zhang, S.; Li, D.; Xie, Y.; Wu, C.; Yuan, Q.; Chen, J.; Zhang, H. Abundant NH3 in China enhances atmospheric HONO production by promoting the heterogeneous reaction of SO2 with NO2. Environ. Sci. Technol. 2019, 53, 14339–14347. [Google Scholar] [CrossRef] [PubMed]
- Hristov, A.N. Contribution of ammonia emitted from livestock to atmospheric fine particulate matter (PM2.5) in the United States. J. Dairy Sci. 2011, 94, 3130–3136. [Google Scholar] [CrossRef]
- Werner, M.; Kryza, M.; Dore, A.J. Differences in the spatial distribution and chemical Composition of PM10 between the UK and Poland. Environ. Model. Assess. 2014, 19, 179–192. [Google Scholar] [CrossRef] [Green Version]
- Zhang, X.; Wu, Y.; Liu, X.; Reis, S.; Jin, J.; Dragosits, U.; Damme, M.V.; Clarisse, L.; Whitburn, S.; Coheur, P.F.; et al. Ammonia emissions may be substantially underestimated in China. Environ. Sci. Technol. 2017, 51, 12089–12096. [Google Scholar] [CrossRef]
- Liu, M.X.; Huang, X.; Song, Y.; Tang, J.; Cao, J.J.; Zhang, X.Y.; Zhang, Q.; Wang, S.; Xu, T.; Kang, L.; et al. Ammonia emission control in China would mitigate haze pollution and nitrogen deposition, but worsen acid rain. Proc. Natl. Acad. Sci. USA 2019, 116, 7760–7765. [Google Scholar] [CrossRef] [PubMed] [Green Version]
- Zhang, X.; Gu, B.; Grinsven, H.V.; Lam, S.K.; Liang, X.; Bai, M.; Chen, D. Societal benefits of halving agricultural ammonia emissions in China far exceed the abatement costs. Nat. Commun. 2020, 11, 4357. [Google Scholar] [CrossRef]
- Zhu, Z.P.; Dong, H.M.; Shang, B.; Kang, G.H.; Zhu, H.S.; Tao, X.P.; Shi, Y. Measurement of ammonia concentration and estimation on emission flux of finishing pig in pig house. J. Agro-Environ. Sci. 2006, 25, 1076–1080. (In Chinese) [Google Scholar]
- Dong, H.; Kang, G.; Zhu, Z.; Tao, X.; Chen, Y.; Xin, H.; Harmon, J.D. Ammonia, methane, and carbon dioxide concentrations and emissions of a hoop grower–finisher swine barn. Trans. ASABE 2009, 52, 1714–1747. [Google Scholar] [CrossRef]
- Wang, K.; Wei, B.; Zhu, S.; Ye, Z. Ammonia and odour emitted from deep litter and fully slatted floor systems for growing-finishing pigs. Biosyst. Eng. 2011, 109, 203–210. [Google Scholar] [CrossRef]
- Xu, W.; Zheng, K.; Liu, X.; Meng, L.; Huaitalla, R.M.; Shen, J. Atmospheric NH3 dynamics at a typical pig farm in China and their implications. Atmos. Pollut. Res. 2014, 5, 455–463. [Google Scholar] [CrossRef] [Green Version]
- Shen, D.; Wu, S.; Dai, P.Y.; Li, Y.S.; Li, M.C. Distribution of particulate matter and ammonia and physicochemical properties of fine particulate matter in a layer house. Poult. Sci. 2018, 97, 4137–4149. [Google Scholar] [CrossRef]
- Dai, C.; Huang, S.; Zhou, Y.; Xu, B.; Peng, H.; Qin, P.; Wu, G. Concentrations and emissions of particulate matter and ammonia from extensive livestock farm in South China. Environ. Sci. Pollut. Res. 2019, 26, 1871–1879. [Google Scholar] [CrossRef]
- Pu, S.; Rong, X.; Zhu, J.; Zeng, Y.; Yue, J.; Lim, T.; Long, D. Short-term aerial pollutant concentrations in a Southwestern China pig-fattening house. Atmosphere 2021, 12, 103. [Google Scholar] [CrossRef]
- Mosquera, J.; Edouard, N.; Guiziou, F.; Melse, R.W.; Riis, A.L.; Sommer, S.; Brusselman, E. Decision Document on the Revision of the VERA Protocol on Air Cleaning Technologies: Measuring Techniques for the Determination of the Removal Efficiency for Ammonia; Report 767; Livestock Research, Wageningen UR: Wageningen, The Netherlands, 2014. [Google Scholar]
- Artinano, B.; Pujadas, M.; Alonso-Blanco, E.; Becerril-Valle, M.; Coz, E.; Gomez-Moreno, F.J.; Salvador, P.; Nunez, L.; Palacios, M.; Diaz, E. Real-time monitoring of atmospheric ammonia during a pollution episode in Madrid (Spain). Atmos. Environ. 2018, 189, 80–88. [Google Scholar] [CrossRef]
- Alexa, L.; Mikuška, P. Simultaneous determination of ammonia and particulate ammonium in ambient air using a cylindrical wet effluent diffusion denuder and a continuous aerosol sampler. Anal. Chem. 2020, 92, 15827–15836. [Google Scholar] [CrossRef]
- Pedersen, S.; Takai, H.; Johnsen, J.O.; Metz, J.H.M.; Koerkamp, P.W.G.G.; Uenk, G.H. A comparison of three balance methods for calculating ventilation rates in livestock buildings. J. Agric. Eng. Res. 1998, 70, 25–37. [Google Scholar] [CrossRef] [Green Version]
- CIGR (Commission Internationale du Genie Rural). Report of Working Group on Climatization of Animal Houses; Scottaspress Publishers Limited: Aberdeen, UK, 1984; ISBN 09-02433-33-4. [Google Scholar]
- CIGR (Commission Internationale du Genie Rural). 4th Report of Working Group on Climatization of Animal Houses, Heat and Moisture Production at Animal and House Level; Danish Institute of Agricultural Sciences: Horsens, Denmark, 2002; ISBN 87-88976-60-2. [Google Scholar]
- Liu, Y.; Shang, B.; Dong, H.M.; Tao, X.P.; Xu, W.Q.; Yang, P.Y. Ammonia production and emissions from a mechanically ventilated fattening swine confinement building. J. Agro-Environ. Sci. 2020, 39, 2058–2065. (In Chinese) [Google Scholar] [CrossRef]
- Cabaraux, J.F.; Philippe, F.X.; Laitat, M.; Canart, B.; Vandenheede, M.; Nicks, B. Gaseous emissions from weaned pigs raised on different floor systems. Agric. Ecosyst. Environ. 2009, 130, 86–92. [Google Scholar] [CrossRef]
- Ulens, T.; Daelman, M.R.J.; Mosquera, J.; Millet, S.; van Loosdrecht, M.C.M.; Volcke, E.I.P.; Van Langenhove, H.; Demeyer, P. Evaluation of sampling strategies for estimating ammonia emission factors for pig fattening facilities. Biosyst. Eng. 2015, 140, 79–90. [Google Scholar] [CrossRef]
- Bluteau, C.V.; Masse, D.I.; Leduc, R. Ammonia emission rates from dairy livestock buildings in Eastern Canada. Biosyst. Eng. 2009, 103, 480–488. [Google Scholar] [CrossRef]
- Yin, Z.; Zhang, Y. Climate anomalies contributed to the rebound of PM2.5 in winter 2018 under intensified regional air pollution preventions. Sci. Total Environ. 2020, 726, 138514. [Google Scholar] [CrossRef] [PubMed]
- Vranken, E.; Claes, S.; Hendriks, J.; Darius, P.; Berckmans, D. Intermittent measurements to determine ammonia emissions from livestock buildings. Biosyst. Eng. 2004, 88, 351–358. [Google Scholar] [CrossRef]
- Sun, G.; Hoff, S.J.; Zelle, B.C.; Nelson, M.A. Development and comparison of backpropagation and generalized regression neural network models to predict diurnal and seasonal gas and PM10 concentrations and emissions from swine buildings. Trans. ASABE 2008, 51, 685–694. [Google Scholar] [CrossRef]
- Wu, W.; Zhang, G.; Kai, P. Ammonia and methane emissions from two naturally ventilated dairy cattle buildings and the influence of climatic factors on ammonia emission. Atmos. Environ. 2012, 61, 232–243. [Google Scholar] [CrossRef]
Figure 1.
Structure of pig house and distribution of monitoring points.

Figure 2.
Temporal variation of air temperature and relative humidity inside and outside the nursery house. (a) Winter; (b) Summer.
Figure 2.
Temporal variation of air temperature and relative humidity inside and outside the nursery house. (a) Winter; (b) Summer.

Figure 3.
Daily variation of ventilation rates in pig house. (a) Summer; (b) Winter.

Figure 4.
Diurnal variation of ventilation rate in pig house.

Figure 5.
Variation of ammonia concentration in the pig house in winter. (a) Forepart; (b) Middle; (c) Back; (d) Outdoor.
Figure 5.
Variation of ammonia concentration in the pig house in winter. (a) Forepart; (b) Middle; (c) Back; (d) Outdoor.

Figure 6.
Variation of ammonia concentration in the pig house in summer. (a) Forepart; (b) Middle; (c) Back; (d) Outdoor.
Figure 6.
Variation of ammonia concentration in the pig house in summer. (a) Forepart; (b) Middle; (c) Back; (d) Outdoor.

Figure 7.
Box plot of hourly average concentrations of NH3 inside the pig house. (a) Winter; (b) Summer.
Figure 7.
Box plot of hourly average concentrations of NH3 inside the pig house. (a) Winter; (b) Summer.

Figure 8.
Diurnal variation of NH3 emission inside the pig house. (a) Winter; (b) Summer.


Figure 9.
Predicted by multiple linear equation versus the measured NH3 emission rates. (a) Winter; (b) Summer.
Figure 9.
Predicted by multiple linear equation versus the measured NH3 emission rates. (a) Winter; (b) Summer.


Table 1.
Ammonia concentration at different monitoring positions (mg/m3).
| Monitoring Period | Sampling Position | Mean | Standard Deviation |
|---|---|---|---|
| Winter | Forepart | 1.1632 | 0.3830 |
| Middle | 0.6956 | 0.2912 | |
| Back | 1.9844 | 0.7568 | |
| Outdoor | 0.6292 | 0.4332 | |
| Summer | Forepart | 0.2397 | 0.0873 |
| Middle | 0.2622 | 0.1115 | |
| Back | 0.2485 | 0.0941 | |
| Outdoor | 0.1575 | 0.0656 |
Table 2.
Emission factors from this study and guideline for inventory.
| Temperature (°C) | Age of Pigs (d) | Emission Rate (g d−1 pig−1) | |
|---|---|---|---|
| Estimated from guideline | <10 | <75 | 0.5248 |
| >20 | <75 | 1.1986 | |
| This study | −2.3~10.5 | 40~49 | 0.0046~0.2899 |
| 24.6~37.7 | 25~50 | 0.0094~1.9422 |
Table 3.
Correlations between ammonia emission and environmental parameters.
| NH3 Emission Rate | ||
|---|---|---|
| Winter | Summer | |
| Tin | 0.28 ** | 0.15 |
| RH | −0.34 ** | −0.13 |
| Ventilation rate | 0.19 * | 0.80 ** |
| Body weight | 0.1 | 0.67 ** |
| NH3 concentration | 0.77* | 0.58 ** |
Notes: ** means correlation is significant at the 0.01 level (2-tailed) and * means correlation is significant at the 0.05 level (2-tailed).
Table 4.
Statistics of multiple regression analysis for ammonia emission.
| Variables | Winter | Summer | ||||
|---|---|---|---|---|---|---|
| Coefficient | SD | p Value | Coefficient | SD | p Value | |
| Intercept | −0.2393 | 0.0705 | 0.00093 | 0.7475 | 0.3667 | 0.04220 |
| NH3 concentration | 0.1018 | 0.0072 | <2 × 10⁻¹⁶ | 1.0226 | 0.1543 | 1.2 × 10⁻¹⁰ |
| Ventilation rate | 0.0297 | 0.0173 | 0.08795 | 0.0177 | 0.0008 | <2 × 10⁻¹⁶ |
| Body weight | 0.0143 | 0.0023 | 1.42 × 10⁻⁸ | 0.0185 | 0.0030 | 2.6 × 10⁻⁹ |
| Temperature | 0.0067 | 0.0026 | 0.00974 | −0.0236 | 0.0071 | 0.00103 |
| Relative humidity | −0.0016 | 0.0005 | 0.00148 | −0.0076 | 0.0020 | 0.00011 |
Publisher’s Note: MDPI stays neutral with regard to jurisdictional claims in published maps and institutional affiliations. |
© 2022 by the authors. Licensee MDPI, Basel, Switzerland. This article is an open access article distributed under the terms and conditions of the Creative Commons Attribution (CC BY) license (https://creativecommons.org/licenses/by/4.0/).
Share and Cite
MDPI and ACS Style
Feng, K.; Wang, Y.; Hu, R.; Xiang, R. Continuous Measurement of Ammonia at an Intensive Pig Farm in Wuhan, China. Atmosphere 2022, 13, 442. https://0-doi-org.brum.beds.ac.uk/10.3390/atmos13030442
AMA Style
Feng K, Wang Y, Hu R, Xiang R. Continuous Measurement of Ammonia at an Intensive Pig Farm in Wuhan, China. Atmosphere. 2022; 13(3):442. https://0-doi-org.brum.beds.ac.uk/10.3390/atmos13030442
Chicago/Turabian StyleFeng, Kun, Yan Wang, Ronggui Hu, and Rongbiao Xiang. 2022. "Continuous Measurement of Ammonia at an Intensive Pig Farm in Wuhan, China" Atmosphere 13, no. 3: 442. https://0-doi-org.brum.beds.ac.uk/10.3390/atmos13030442
Note that from the first issue of 2016, this journal uses article numbers instead of page numbers. See further details here.