Article

Association between Ambient Air Pollutants and Pneumonia in Wuhan, China, 2014–2017

1
School of Public Health, Wuhan University, Wuhan 430071, China
2
School of Public Health, Lanzhou University, Lanzhou 730000, China
3
Department of Nutrition and Food Hygiene, School of Public Health, Medical College, Wuhan University of Science and Technology, Wuhan 430081, China
4
Vanke School of Public Health, Tsinghua University, Beijing 100084, China
5
Institute for Health China, Tsinghua University, Beijing 100084, China
*
Authors to whom correspondence should be addressed.
These authors contributed equally to this work.
Submission received: 23 February 2022 / Revised: 26 March 2022 / Accepted: 31 March 2022 / Published: 3 April 2022

Abstract

:
Objectives: To assess associations between short-time air pollution exposure and outpatient visits for pneumonia by the distributed lag nonlinear model (DLNM). Methods: Daily outpatient visits for pneumonia and air pollutant data were collected from Wuhan Basic Medical Insurance Database in China and 10 national air quality monitoring stations in Wuhan from 2014 to 2017, respectively. Taking the first percentile of the concentration as the reference, DLNM was used to estimate the impact of moderate (50th) and high levels (99th) of pollutants on pneumonia. Results: A total of 133,882 outpatient visits were identified during the period of the study. Moderate-level (P50) fine particulate matter (PM2.5) or sulfur dioxide (SO2) and high-level nitrogen dioxide (NO2) (P99) can increase the risk of pneumonia. The maximum RR was 1.198 (95% CI: 1.094–1.311) at lag0-11, 1.304 (95% CI: 1.166–1.458) at lag0-13, and 1.286 (95% CI: 1.060–1.561) at lag0-14, respectively. Females and children had greater risks. Conclusions: Short-time PM2.5, SO2, and NO2 exposure were associated with outpatient visits for pneumonia in Wuhan, China.

1. Introduction

Pneumonia is a common acute lower respiratory tract infection (LRTI) caused by altered alveolar and distal airway microbiota and immune responses [1,2]. The most common symptoms of pneumonia are cough, dyspnea, chest pain, sputum production, and multiple complications, which can lead to death in severe cases [3,4]. In 2016, the incidence of LRTI was 45.5 per 1000 people, causing nearly 2.38 million deaths worldwide, and it was one of the five main causes of global life loss [5]. In China, LRTIs were the 12th leading cause of years of life lost (YLLs). YLL per 100,000 population was 302 (95% uncertainty interval: 282 to 356), and deaths per 100,000 population was 13 (95% UI: 12 to 16) in 2017 [6].
Pollution is one of the main risk factors for lower respiratory tract infections [7,8]. Nonlinear relationships between pollution and respiratory system diseases have already been reported, and pollution not only affects human health on the day of exposure, but also continues to cause harm for a period of time in the future [9,10,11]. Even though extreme weather is relatively rare, the lagged hazards it creates are evident [12,13]. A lot of studies have demonstrated that increased concentrations of pollution were associated with an increased risk of pneumonia [14,15,16]. There were significant positive associations between fine particulate matter (PM2.5) and emergency room visit for pneumonia, hospitalization for severe pneumonia, mortality, and health care costs for the elderly in Utah [17]. A 10 μg/m3 increase in PM2.5 concentrations increased the number of pneumonia hospitalizations by 0.79% at lag 0–2 days in Beijing [18]. Interquartile increases in PM2.5, sulfur dioxide (SO2), and nitrogen dioxide (NO2) were associated with an increase of 14.0%, 4.5%, and 14.1% odds of pediatric pneumonia for children in Taiwan [19]. However, most of these focused on more sensitive populations such as the elderly, children, and hospitalized patients with more severe clinical manifestations. In addition, hospitalization, emergency room, etc., as outcomes were used in previous studies, which may lead to underestimation of the short-term hazards of pollutants due to the time required for the disease to develop from the initial stage to a more severe stage. Furthermore, regarding differences in pollutant levels, pollutant sources, geographical conditions, and population composition, the extrapolation of research results is limited. In terms of statistical models, most of the studies use generalized linear models (GLM), generalized additive models (GAM), etc. Compared with them, the distributed lag nonlinear model (DLNM) [20] applies the idea of cross-base to fit the two dimensions of pollutant exposure response and lag response, which is more suitable for the complex interdependent relationship of environmental factors.
The distributed lag nonlinear model was used to analyze the association between air pollution and pneumonia outpatient visits in the whole population. We not only discussed the impact of medium-level pollutants on pneumonia, but also focused on the harm of extremely high concentrations of pollutants on pneumonia.

2. Materials and Methods

2.1. Study Area

Wuhan (29°58′–31°22′ N, 113°41′–115°05′ E), Hubei Province, is an important transportation hub in China. The permanent resident population of Wuhan was 10.77 million at the end of 2017, with a population density of 1256 person/sq.km. The city belongs to the northern subtropical monsoon (humid) climate, with abundant rainfall throughout the year, cold in winter and hot in summer, and four distinct seasons.

2.2. Outpatient Visits for Pneumonia Cases

The data of outpatient visits for pneumonia cases were obtained from Wuhan Basic Medical Insurance Database in Hubei Province. The database includes urban-staff-insured persons and urban-resident-insured persons. According to the agreed sampling strategy, we randomly sampled 1% based on the ID number. Then, we sampled according to the Chinese diagnosis and the corresponding International Classification of Diseases 10th version (ICD-10) codes (the classification includes 18 diseases such as “lower respiratory tract infection”, “pneumonia”, “bronchitis”, “pulmonary tuberculosis”, “asthma”, etc.), with a total of 3,892,270 outpatient visits to form a disease database. Finally, based on the principal diagnosis (J12–J18), we excluded nonpneumonia cases to form the final sample database from 1 January 2014 to 31 December 2017, including a total of 133,882 patient cases. The information included basic demographic characteristics, disease diagnosis, date of diagnosis, hospital, etc.

2.3. Air Pollution and Meteorological Data

Air pollution data were collected from 10 national air quality monitoring stations in Wuhan. We averaged the measurements from all valid monitoring sites. The air pollution data included the daily (24 h) mean concentrations of PM2.5, SO2, and NO2 in Wuhan from January 2014 to December 2017. The daily (24 h) mean meteorological data included temperature (°C), relative humidity (%), wind speed (m/s), and precipitation (mm/h), all of which were obtained from the Hubei Meteorological Bureau.

2.4. Statistical Analysis

The daily outpatient visits for pneumonia cases were subjected to Poisson distribution, and air pollution had a nonlinear and lagged effect on pneumonia according to previous reports. Therefore, we applied the distributed lag nonlinear model (DLNM) with Poisson regression to explore the exposure–lag-response relationship between outpatient visits for pneumonia cases and ambient air pollution. The model was built as follows:
log [ E ( Y t ) ] = α + c b ( P , d f 1 , l a g , d f 2 ) + n s ( X i , d f 3 ) + n s ( T i m e , d f 4 ) + f a c t o r ( D O W )
where E ( Y t ) was the expected number of outpatient visits for pneumonia cases on day t; α was the intercept; c b   referred to the cross-basis function, combining functions for both exposure and lag dimensions, which included natural cubic spline for air pollutants and a polynomial function for lag; P was a pollutant (PM2.5, SO2, and NO2), and d f 1 of the pollutant was 4 and d f 2 of the lag dimension was 3. Because the incubation period of pneumonia [21] and the fact that the most commonly selected lag times in the related research of pneumonia are 6, 7, and 14 days, the maximum lag time was 14 days in this study [22,23]. n s ( X i , d f 3 ) represented the natural cubic spline function of meteorological factors, including temperature, relative humidity, wind speed, and precipitation, and d f 3 were all three. T i m e and D O W   (day of the week) were indicator variables that represented adjustments to seasonal and long-term trends and the influence of the day of the week, respectively. According to the results of Akaike Information Criterion (AIC), d f 4 was 11.
In our study, all daily average concentrations (N = 1461) were arranged in ascending order from the minimum to the maximum. P1 represented the first percentile concentration, P50 represented the 50th percentile concentration, and P99 represented the 99th percentile concentration. After confirming the parameters in the model, the first percentile’s concentration of air pollutants with the lowest risk of pneumonia was obtained as the reference value through model prediction. We calculated the relative risks (RR) and 95% confidence intervals (CI) of pneumonia cases at moderate levels (P50, 50th percentile of concentration) and high levels (P99, 99th percentile of concentration). We calculated single-day lag effects (such as lag0, lag1, lag2, and lag3) and cumulative lag effects (such as lag01, lag02, and lag03) to effectively characterize the association between air pollutants and outpatient visits for pneumonia cases. Furthermore, effects across age groups (0–14 years, 15–64 years, and >64 years) and genders were examined to identify a susceptible subpopulation. The divisions of age groups were similar to previous studies [24,25]. Additionally, a sensitivity analysis was applied to test the robustness of the models. We tested the reliability of the results by altering the df of the long-term trend.

2.5. Statistical Software
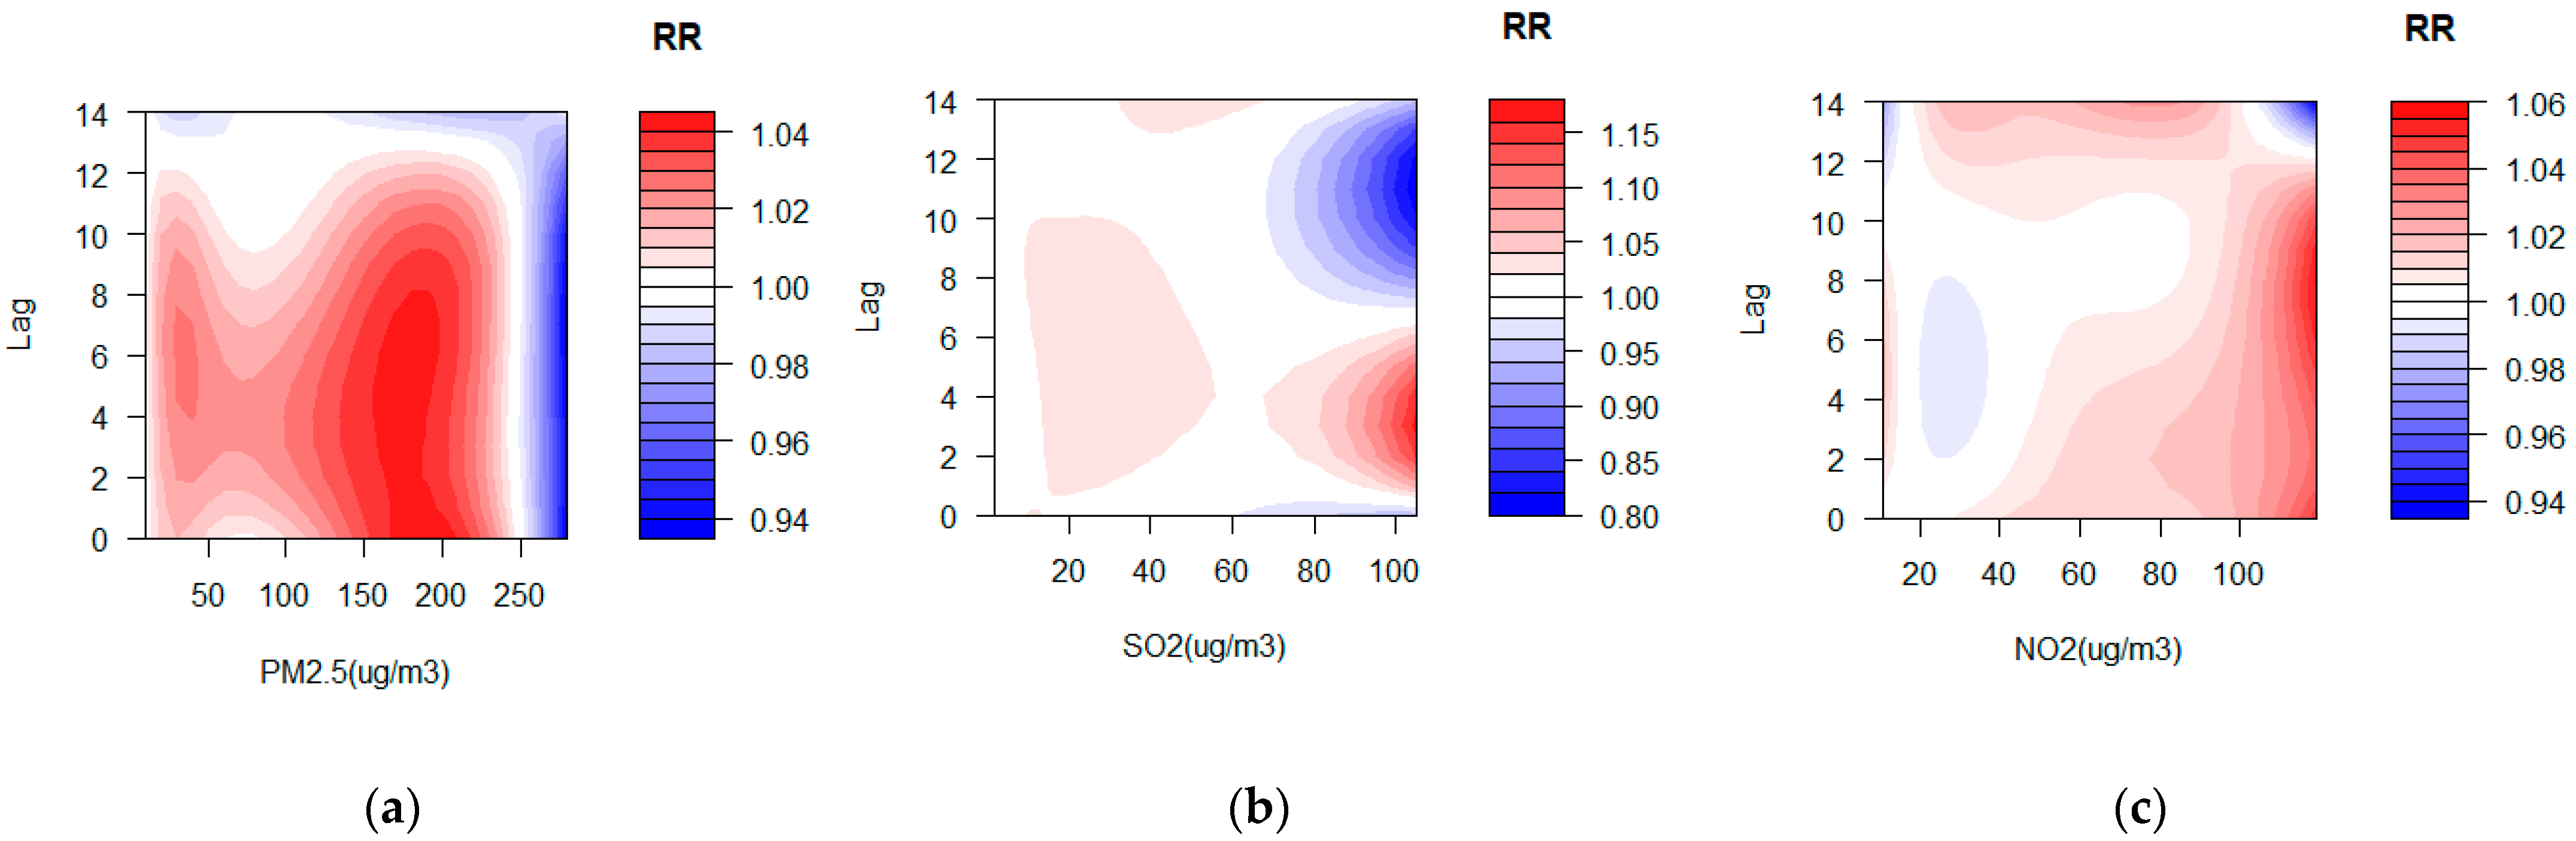
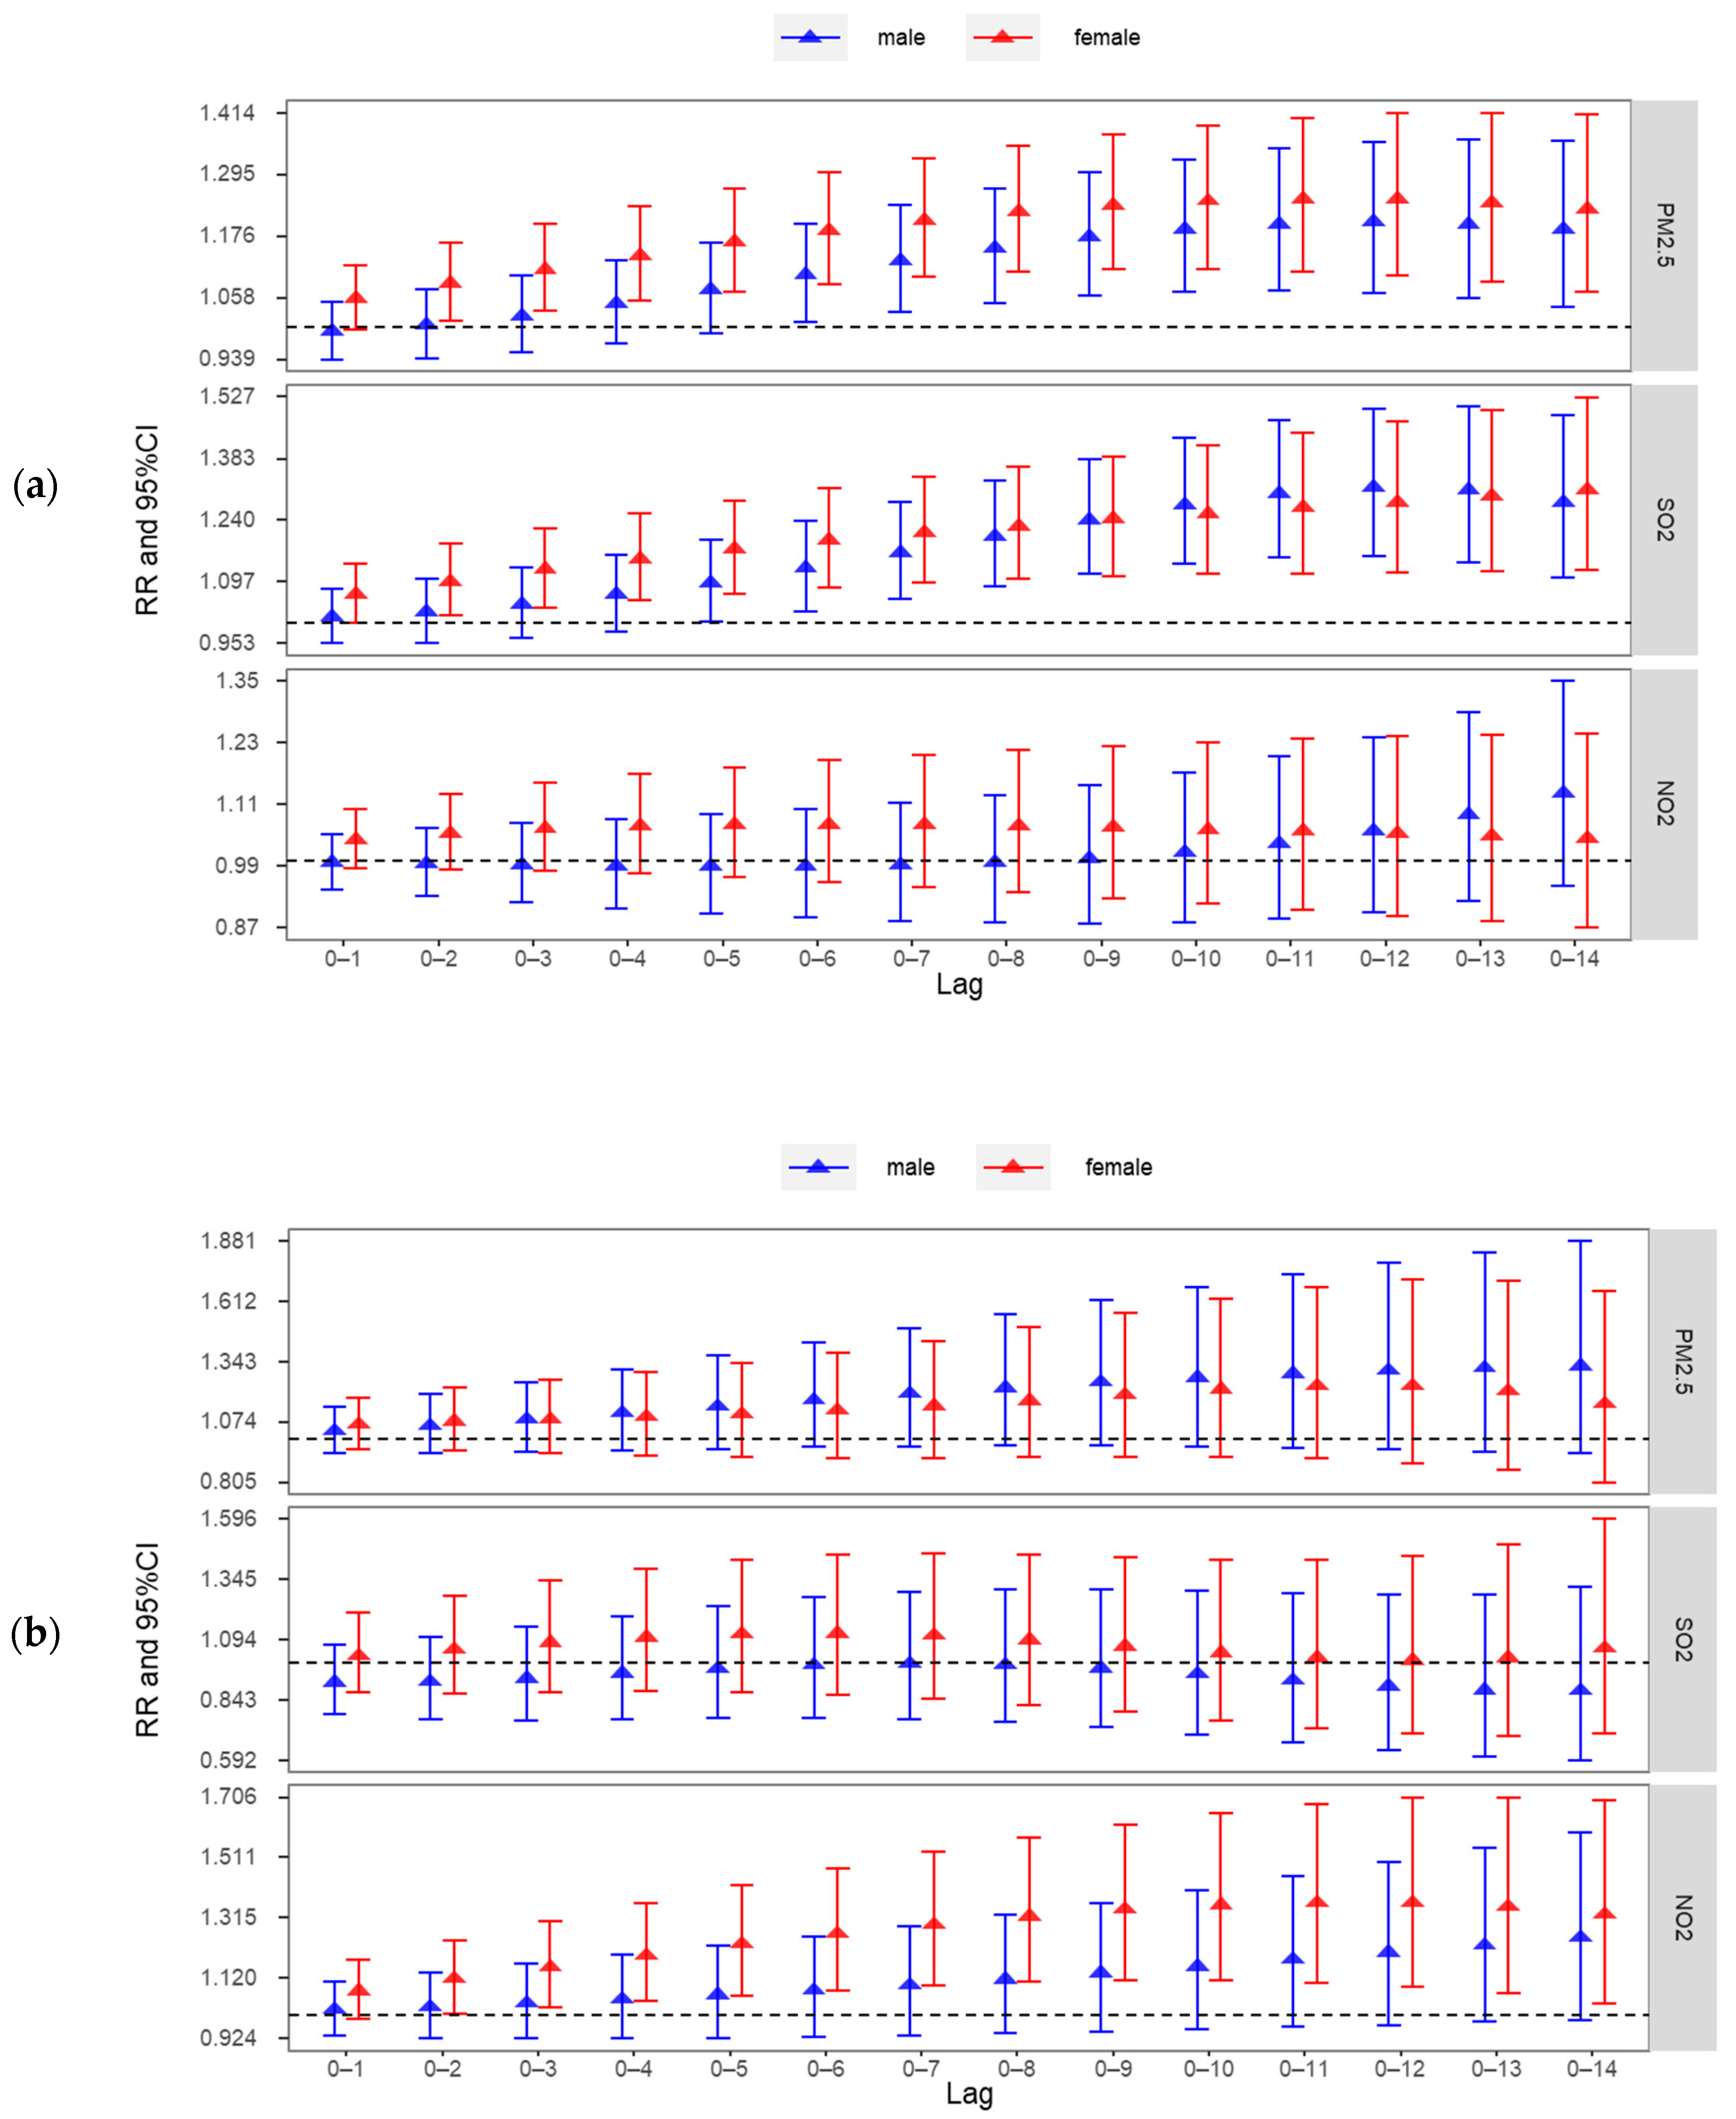
Microsoft Excel software was used for data collation, and the DLNM package in R software (version 3.6.1) was used for statistical analysis of the nonlinear exposure–lag effects.

3. Results

There was a total of 133,882 cases of outpatient visits for pneumonia in Wuhan, with an average of 92 people per day from 1 January 2014 to 31 December 2017 (shown in Table 1). The daily outpatient visits of people aged 0–14, 15–64, and over 64 years accounted for 57.70%, 25.10%, and 17.20%, respectively. Of the patients, 51.80% were male. The 50th percentile of concentration values for PM2.5, NO2, and SO2 were 54.00 μg/m3, 44.00 μg/m3, and 14.00 μg/m3, and the 99th percentile of concentration values for PM2.5, NO2, and SO2 were 229.40 μg/m3, 102.40 μg/m3, and 69.00 μg/m3, respectively. The daily temperature, relative humidity, precipitation, and wind speed were 17.24 °C, 78.81%, 0.16 mm/h, and 1.64 m/s.
Contour plots of the exposure–lag-response effects comprehensively illustrated that air pollutants (PM2.5, SO2, and NO2) and outpatient visits for pneumonia were nonlinear associations with lag effects (Figure 1). Lag patterns varied at different concentration levels. The two peaks of risk for pneumonia visits appeared when the PM2.5 concentration was around 30 μg/m3 and 190 μg/m3, the lag time duration was 0–12 d, and when the RR value was the highest (at 4–6 days). When the SO2 concentration was within a range of 10–50 μg/m3, the lag effects on pneumonia were observed. High concentration of NO2 was a risk factor for pneumonia outpatient visits, and the lag time lasted from the day of exposure to about 12 days.
The single-day lag effects and cumulative lag effects of moderate- and high-level air pollutants on pneumonia under various lag days are shown in Table 2. The cumulative lag effects of air pollutants showed higher estimates than single-day effects. At the moderate-level PM2.5, single lag effects appeared at lag2–lag9, and RR reached the maximum at lag4 (RR: 1.022, 95% CI: 1.009–1.036). Compared with 9 μg/m3 (P1), the moderate levels (54 μg/m3) of PM2.5 increased the maximum cumulative risk of pneumonia by 19.8% at lag0–11. The single lag effects for moderate-level SO2 were detected at lag1–lag11, manifesting as acute effects. Compared with 3 μg/m3 (P1), the moderate level (14 μg/m3) of SO2 increased the maximum cumulative risk of pneumonia by 30.4% at lag0–13. Under high-levels of NO2 exposure, the single lag effect was the highest at lag2 (RR: 1.022, 95% CI: 1.001–1.044), and the lag effect continued to decrease, lasting for 7 days. Compared with 17 μg/m3 (P1), the high level (102.4 μg/m3) of NO2 increased the maximum cumulative risk of pneumonia by 28.6% at lag0–14.
The cumulative lag effects of moderate and high levels of air pollutants on pneumonia for subgroups are presented in Figure 2 and Figure 3. We found that females were more susceptible to moderate levels of PM2.5, SO2, and high levels of NO2. Compared with the males, the cumulative lag effects were earlier and lasted longer for females. The influence of moderate and high levels of PM2.5 and the moderate level of SO2 were stronger in children than in adults and old men. When exposed to high levels of NO2, the risk of pneumonia was slightly higher before lag0–12 in adults than in children.
We changed the df of the long-term trend (8 to 11 df) to test the stability of the model, and found that the estimated value was stable and the shape of the effect diagram does not change (Figure A1 in Appendix A).

4. Discussion

In this study, we found nonlinear lag effects between PM2.5, SO2, NO2, and outpatient visits for pneumonia cases. Pollutants with different exposure levels presented different lag effects. Moderate levels of PM2.5 and SO2, and high levels of NO2 could increase the risk of pneumonia. Females and children had a stronger risk for pneumonia. Furthermore, the lag effects of gaseous pollutants (SO2 and NO2) on pneumonia were greater than particulate matter (PM2.5).
Due to the nonlinear relationship between pollutants and pneumonia, we analyzed the exposure risk of moderate- and high-concentration pollutants to pneumonia, respectively. The present study found moderate-level PM2.5 and SO2 were positive associations with the pneumonia of outpatient visits in the short term, with the first percentile concentration of air pollutants as the reference. However, we had not found a significant result in high-level PM2.5 and SO2. Previous studies are consistent with this finding [26,27]. A time-series analysis in 184 cities in China from 2014–2017 showed that compared to higher concentrations, the risk of pneumonia admission was greater at lower concentrations of PM2.5 (below 75 μg/m3) and PM10 (below 100 μg/m3) [28]. Another study about daily outpatient visits for respiratory diseases in Lanzhou [29] found that when the concentration of PM2.5 was less than 50 μg/m3, outpatient volume increased rapidly, but when concentration exceeded 100 μg/m3, this effect gradually weakened. On the one hand, this phenomenon could be due to the “harvest effect”, because people may have been sick already and diagnosed before the air-pollutant concentration reached a high level. On the other hand, people could have taken some protective measures (such as wearing masks) under severely polluted weather conditions [28]. In terms of SO2, we did not find significant effects at high levels, which may be due to relatively low emission in our area. However, it still had a clear impact on phenomena at moderate levels, other and studies showed similar conclusions [30,31]. On the contrary, NO2 showed obvious nonlinear lag effects at high-level exposure, while it did not cause significant effects at moderate levels. In a study about adult pneumonia outpatient visits in Qingdao, the results of DLNM also showed that the 50th and 75th percentiles of NO2 concentrations did not cause lag effects, while the 90th and 95th percentiles of NO2 concentrations were significantly associated [22]. A meta-analysis dividing NO2 into outdoor sources and higher-concentration traffic sources showed the latter had significantly stronger impacts on chronic obstructive pulmonary diseases (RR:1.017 vs. 1.178). The above studies all suggest that high concentrations of NO2 have more considerable effects on health [32], which is a noteworthy problem. Lots of studies reported NO2 may exacerbate underlying respiratory diseases [26,33,34]. It reduced CD62 expression, leading to inhibition of neutrophil-mediated inflammatory clearance mechanisms, thereby prolonging recovery time from diseases [35].
Diverse lag patterns were presented for different pollutants [36,37,38]. The maximum single lag effects of PM2.5 and SO2 at moderate levels appeared at lag4 and lag7, and the highest cumulative lag effects appeared at lag0–11 and lag0–13, respectively. Under high levels of exposure, NO2 reached the maximum single lag effect at lag2 and cumulative lag effect at lag0–14. A prospective cohort of 433,032 participants showed that the risk of pneumonia hospitalizations reached the maximum at lag4 weeks for SO2 [23]. Furthermore, Yan Tao [39] found the maximum lag effect of hospital admissions for pneumonia due to NO2 appeared at lag2 in Lanzhou, with a lag of 1–4 days. The reason for the different specific lag times may be due to research design, statistical models, air pollution components, population susceptibility, etc. [16,26]. Compared with hospital admissions in previous studies, outpatient data may be more timelier, and sensitively reflect the short-term effects of air pollution on pneumonia in our study. Furthermore, this study found that gaseous pollutants’ (SO2 and NO2) effects on pneumonia were greater than effects from particulate matter (PM2.5). Previous studies had similar findings [24,26,40]. Pollutants often came from the same source and were exposed at the same time [41]. SO2 and NO2 could adhere to particulate matter [42], leading to the idea that the observed harmful effects of SO2 and NO2 may actually be due to fine particulate matter.
The results of subgroups showed that females and children were more susceptible to pneumonia, which was in line with other studies [43,44,45]. After excluding gynecological and reproductive diseases, females remained more alert and experienced physical symptoms more intensely than males due to biological differences and social roles [46]. In addition, air pollutants may cause greater impacts on nonsmokers than smokers [47,48]. Males made up the majority of smokers in China [49]. Due to the dominant harmful impacts of smoking for males, additional effects of air pollutants may not be fully captured, limited by physiological upper bounds [50]. We also found an interesting phenomenon that children had greater impacts under moderate-level NO2, while adults had greater impacts under high-level NO2. Medical measures may have been taken before exposure to high levels of NO2 due to the undeveloped immune system and respiratory system in children. An experiment with pulmonary function testing in 163 school-aged children showed a clear, acute effect on children’s lung functions even when NO2 levels were below European limits [51]. Compared with children, adults were more frequently exposed to high-level NO2. Because NO2 mainly comes from traffic pollution in Wuhan [52,53], and its concentration was negatively correlated with the distance from the highway [54]. In addition, our results did not find a significant effect on the elderly. The elderly generally suffered from underlying diseases and multiple comorbidities. Compared with children and adults, pneumonia symptoms were mostly atypical [55], so it was easy to delay medical treatment, resulting in severer symptoms, higher hospitalization rates, and higher mortality [56,57].
The data of this study came from the Basic Medical Insurance Database, which was accurate and realistic, and the risk of pneumonia caused by air pollution could be timely and sensitively reflected by outpatient data. In addition, we also discussed the relationship between pollutants and pneumonia at different levels in order to understand the impact of pollutants on human health in detail. However, this study also had some limitations. First of all, exposure measurement bias in ecological studies was unavoidable, and air pollution concentrations from air quality monitoring stations may overestimate individual exposure levels. Secondly, we were unable to finely control for individual-level confounders due to data limitations. In future research, it is necessary to precisely measure individual exposure levels and adjust individual characteristics to reflect the impact of air pollution exposure on human health.

5. Conclusions

In summary, our study demonstrated significant associations between air pollutants and outpatient visits for pneumonia cases in a short time, especially under moderate-level PM2.5, SO2, and high-level NO2. In addition to females and children being susceptible groups, the effects of high concentrations of NO2 on adults are also worthy of attention.

Author Contributions

Conceptualization, S.L.; Data curation, Y.L.; Formal analysis, H.Z. and Q.D.; Methodology, S.L. and L.M.; Project administration, Z.H. and F.T.; Resources, L.M.; Supervision, L.M.; Writing—original draft, H.Z. and S.L.; Writing—review & editing, H.Z., C.L. and J.L. All authors have read and agreed to the published version of the manuscript.

Funding

This research received no external funding.

Institutional Review Board Statement

Not applicable.

Informed Consent Statement

Not applicable.

Data Availability Statement

Not available.

Conflicts of Interest

The authors declare no conflict of interest.

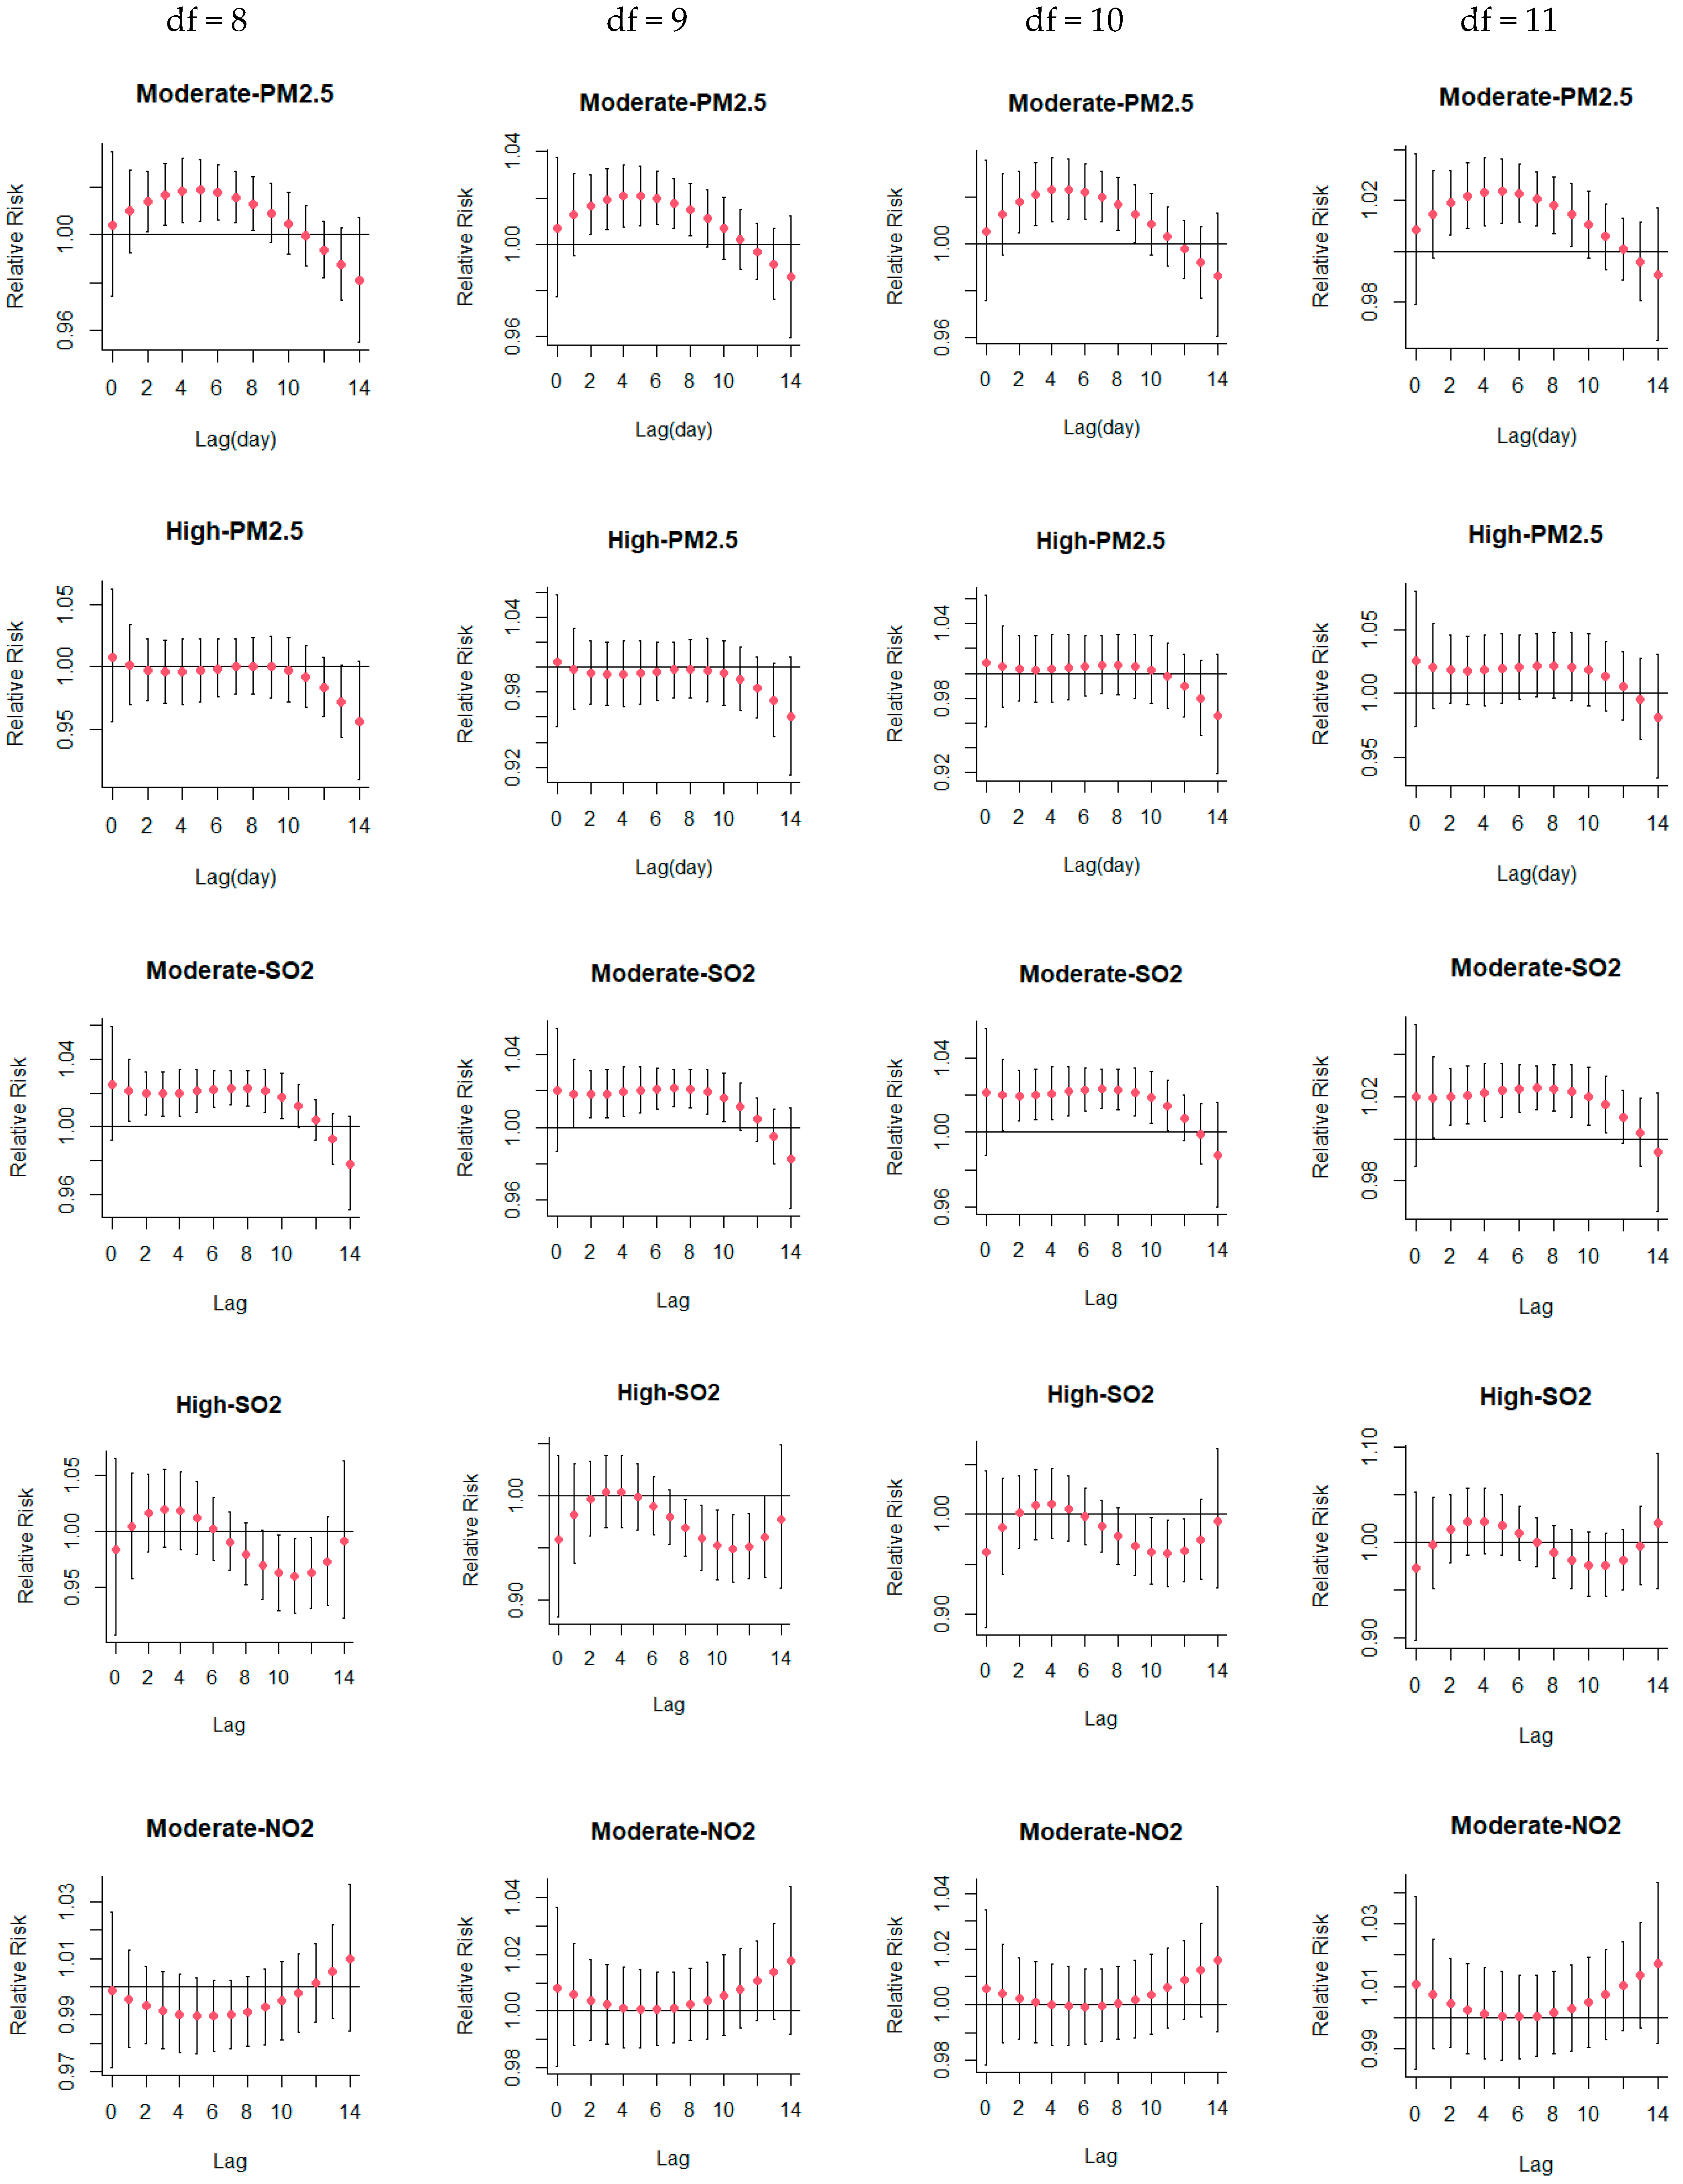
Appendix A. Sensitivity Analysis

Figure A1. Single-day lag of PM2.5, SO2, and NO2, with time-trend degrees of freedom from 8 to 11.
Atmosphere 13 00578 g0a1aAtmosphere 13 00578 g0a1b

References

  1. Torres, A.; Cilloniz, C.; Niederman, M.S.; Menendez, R.; Chalmers, J.D.; Wunderink, R.G.; van der Poll, T. Pneumonia. Nat. Rev. Dis. Primers 2021, 7, 25. [Google Scholar] [CrossRef] [PubMed]
  2. Quinton, L.J.; Walkey, A.J.; Mizgerd, J.P. Integrative Physiology of Pneumonia. Physiol. Rev. 2018, 98, 1417–1464. [Google Scholar] [CrossRef] [PubMed]
  3. Lanks, C.W.; Musani, A.I.; Hsia, D.W. Community-acquired Pneumonia and Hospital-acquired Pneumonia. Med. Clin. N. Am. 2019, 103, 487–501. [Google Scholar] [CrossRef] [PubMed]
  4. Corrales-Medina, V.F.; Musher, D.M.; Shachkina, S.; Chirinos, J.A. Acute pneumonia and the cardiovascular system. Lancet 2013, 381, 496–505. [Google Scholar] [CrossRef]
  5. Naghavi, M.; Abajobir, A.A.; Abbafati, C.; Abbas, K.M.; Abd-Allah, F.; Abera, S.F.; Aboyans, V.; Adetokunboh, O.; Afshin, A.; Agrawal, A.; et al. Global, regional, and national age-sex specific mortality for 264 causes of death, 1980–2016: A systematic analysis for the Global Burden of Disease Study 2016. Lancet 2017, 390, 1151–1210. [Google Scholar] [CrossRef] [Green Version]
  6. Zhou, M.; Wang, H.; Zeng, X.; Yin, P.; Zhu, J.; Chen, W.; Li, X.; Wang, L.; Wang, L.; Liu, Y.; et al. Mortality, morbidity, and risk factors in China and its provinces, 1990–2017: A systematic analysis for the Global Burden of Disease Study 2017. Lancet 2019, 394, 1145–1158. [Google Scholar] [CrossRef] [Green Version]
  7. Cohen, A.J.; Ross Anderson, H.; Ostro, B.; Pandey, K.D.; Krzyzanowski, M.; Kunzli, N.; Gutschmidt, K.; Pope, A.; Romieu, I.; Samet, J.M.; et al. The global burden of disease due to outdoor air pollution. J. Toxicol. Environ. Health A 2005, 68, 1301–1307. [Google Scholar] [CrossRef]
  8. Zhuang, J.; Bai, H.; Sun, J.; Zhang, T.; Li, J.; Chen, Y.; Zhang, H.; Sun, Q. The association between fine particulate matter and acute lower respiratory infections in Yancheng City, China. Environ. Sci. Pollut. Res. Int. 2021, 28, 61723–61731. [Google Scholar] [CrossRef]
  9. Slama, A.; Sliwczynski, A.; Woznica, J.; Zdrolik, M.; Wisnicki, B.; Kubajek, J.; Turzanska-Wieczorek, O.; Gozdowski, D.; Wierzba, W.; Franek, E. Impact of air pollution on hospital admissions with a focus on respiratory diseases: A time-series multi-city analysis. Environ. Sci. Pollut. Res. Int. 2019, 26, 16998–17009. [Google Scholar] [CrossRef] [Green Version]
  10. Wang, S.; Li, Y.; Niu, A.; Liu, Y.; Su, L.; Song, W.; Liu, J.; Liu, Y.; Li, H. The impact of outdoor air pollutants on outpatient visits for respiratory diseases during 2012–2016 in Jinan, China. Respir. Res. 2018, 19, 246. [Google Scholar] [CrossRef]
  11. Cai, Y.; Shao, Y.; Wang, C. The association of air pollution with the patients’ visits to the department of respiratory diseases. J. Clin. Med. Res. 2015, 7, 551–555. [Google Scholar] [CrossRef] [PubMed] [Green Version]
  12. Vanos, J.K.; Cakmak, S.; Kalkstein, L.S.; Yagouti, A. Association of weather and air pollution interactions on daily mortality in 12 Canadian cities. Air Qual. Atmos. Health 2015, 8, 307–320. [Google Scholar] [CrossRef] [PubMed] [Green Version]
  13. Xu, M.; Hu, P.; Chen, R.; Liu, B.; Chen, H.; Hou, J.; Ke, L.; Huang, J.; Ren, H.; Hu, H. Association of long-term exposure to ambient air pollution with the number of tuberculosis cases notified: A time-series study in Hong Kong. Environ. Sci. Pollut. Res. Int. 2022, 29, 21621–21633. [Google Scholar] [CrossRef] [PubMed]
  14. Li, D.; Wang, J.B.; Zhang, Z.Y.; Shen, P.; Zheng, P.W.; Jin, M.J.; Lu, H.C.; Lin, H.B.; Chen, K. Effects of air pollution on hospital visits for pneumonia in children: A two-year analysis from China. Environ. Sci. Pollut. Res. Int. 2018, 25, 10049–10057. [Google Scholar] [CrossRef]
  15. Neupane, B.; Jerrett, M.; Burnett, R.T.; Marrie, T.; Arain, A.; Loeb, M. Long-term exposure to ambient air pollution and risk of hospitalization with community-acquired pneumonia in older adults. Am. J. Respir. Crit. Care Med. 2010, 181, 47–53. [Google Scholar] [CrossRef]
  16. Yee, J.; Cho, Y.A.; Yoo, H.J.; Yun, H.; Gwak, H.S. Short-term exposure to air pollution and hospital admission for pneumonia: A systematic review and meta-analysis. Environ. Health 2021, 20, 6. [Google Scholar] [CrossRef]
  17. Pirozzi, C.S.; Jones, B.E.; VanDerslice, J.A.; Zhang, Y.; Paine, R., 3rd; Dean, N.C. Short-Term Air Pollution and Incident Pneumonia. A Case-Crossover Study. Ann. Am. Thorac. Soc. 2018, 15, 449–459. [Google Scholar] [CrossRef]
  18. Wu, J.; Wu, Y.; Tian, Y.; Wu, Y.; Wang, M.; Wang, X.; Wang, Z.; Hu, Y. Association between ambient fine particulate matter and adult hospital admissions for pneumonia in Beijing, China. Atmos. Environ. 2020, 231, 117497. [Google Scholar] [CrossRef]
  19. Cheng, C.Y.; Cheng, S.Y.; Chen, C.C.; Pan, H.Y.; Wu, K.H.; Cheng, F.J. Ambient air pollution is associated with pediatric pneumonia: A time-stratified case-crossover study in an urban area. Environ. Health 2019, 18, 77. [Google Scholar] [CrossRef] [Green Version]
  20. Gasparrini, A.; Armstrong, B.; Kenward, M.G. Distributed lag non-linear models. Stat. Med. 2010, 29, 2224–2234. [Google Scholar] [CrossRef] [Green Version]
  21. Self, W.H.; Williams, D.J.; Zhu, Y.; Ampofo, K.; Pavia, A.T.; Chappell, J.D.; Hymas, W.C.; Stockmann, C.; Bramley, A.M.; Schneider, E.; et al. Respiratory Viral Detection in Children and Adults: Comparing Asymptomatic Controls and Patients With Community-Acquired Pneumonia. J. Infect. Dis. 2016, 213, 584–591. [Google Scholar] [CrossRef] [PubMed] [Green Version]
  22. Yang, L.; Yang, J.; Liu, M.; Sun, X.; Li, T.; Guo, Y.; Hu, K.; Bell, M.L.; Cheng, Q.; Kan, H.; et al. Nonlinear effect of air pollution on adult pneumonia hospital visits in the coastal city of Qingdao, China: A time-series analysis. Environ. Res. 2022, 209, 112754. [Google Scholar] [CrossRef] [PubMed]
  23. Wang, H.T.; Zhang, H.; Xue, F.Z.; Zhao, L.; Cao, W.C. Associations of air pollutants with pneumonia hospital admissions in Qingdao, China: A prospective cohort study. Environ. Sci. Pollut. Res. Int. 2022, 34981381. [Google Scholar] [CrossRef] [PubMed]
  24. Chen, G.; Zhang, Y.; Zhang, W.; Li, S.; Williams, G.; Marks, G.B.; Jalaludin, B.; Abramson, M.J.; Luo, F.; Yang, D.; et al. Attributable risks of emergency hospital visits due to air pollutants in China: A multi-city study. Environ. Pollut. 2017, 228, 43–49. [Google Scholar] [CrossRef]
  25. Wang, K.Y.; Chau, T.T. An association between air pollution and daily outpatient visits for respiratory disease in a heavy industry area. PLoS ONE 2013, 8, e75220. [Google Scholar] [CrossRef] [Green Version]
  26. Yang, H.; Yan, C.; Li, M.; Zhao, L.; Long, Z.; Fan, Y.; Zhang, Z.; Chen, R.; Huang, Y.; Lu, C.; et al. Short term effects of air pollutants on hospital admissions for respiratory diseases among children: A multi-city time-series study in China. Int. J. Hyg. Environ. Health 2021, 231, 113638. [Google Scholar] [CrossRef]
  27. Chen, R.; Yin, P.; Meng, X.; Liu, C.; Wang, L.; Xu, X.; Ross, J.A.; Tse, L.A.; Zhao, Z.; Kan, H.; et al. Fine Particulate Air Pollution and Daily Mortality. A Nationwide Analysis in 272 Chinese Cities. Am. J. Respir. Crit. Care Med. 2017, 196, 73–81. [Google Scholar] [CrossRef]
  28. Tian, Y.; Liu, H.; Wu, Y.; Si, Y.; Li, M.; Wu, Y.; Wang, X.; Wang, M.; Chen, L.; Wei, C.; et al. Ambient particulate matter pollution and adult hospital admissions for pneumonia in urban China: A national time series analysis for 2014 through 2017. PLoS Med. 2019, 16, e1003010. [Google Scholar] [CrossRef] [Green Version]
  29. Chai, G.; He, H.; Sha, Y.; Zhai, G.; Zong, S. Effect of PM2.5 on daily outpatient visits for respiratory diseases in Lanzhou, China. Sci. Total Environ. 2019, 649, 1563–1572. [Google Scholar] [CrossRef]
  30. Zhang, F.; Zhang, H.; Wu, C.; Zhang, M.; Feng, H.; Li, D.; Zhu, W. Acute effects of ambient air pollution on clinic visits of college students for upper respiratory tract infection in Wuhan, China. Environ. Sci. Pollut. Res. Int. 2021, 28, 29820–29830. [Google Scholar] [CrossRef]
  31. Yan, Y.; She, L.; Guo, Y.; Zhao, Y.; Zhang, P.; Xiang, B.; Zeng, J.; Yang, M.; Wang, L. Association between ambient air pollution and mortality from chronic obstructive pulmonary disease in Wuhan, China: A population-based time-series study. Environ. Sci. Pollut. Res. Int. 2021, 28, 33698–33706. [Google Scholar] [CrossRef] [PubMed]
  32. Zhang, Z.; Wang, J.; Lu, W. Exposure to nitrogen dioxide and chronic obstructive pulmonary disease (COPD) in adults: A systematic review and meta-analysis. Environ. Sci. Pollut. Res. Int. 2018, 25, 15133–15145. [Google Scholar] [CrossRef] [PubMed]
  33. Frampton, M.W.; Boscia, J.; Roberts, N.J., Jr.; Azadniv, M.; Torres, A.; Cox, C.; Morrow, P.E.; Nichols, J.; Chalupa, D.; Frasier, L.M. Nitrogen dioxide exposure: Effects on airway and blood cells. Am. J. Physiol.-Lung Cell. Mol. Physiol. 2002, 282, L155–L165. [Google Scholar] [CrossRef] [PubMed]
  34. Pathmanathan, S.; Krishna, M.T.; Blomberg, A.; Helleday, R.; Kelly, F.J.; Sandström, T.; Holgate, S.T.; Wilson, S.J.; Frew, A.J. Repeated daily exposure to 2 ppm nitrogen dioxide upregulates the expression of IL-5, IL-10, IL-13, and ICAM-1 in the bronchial epithelium of healthy human airways. Occup. Environ. Med. 2003, 60, 892. [Google Scholar] [CrossRef] [Green Version]
  35. Bai, K.J.; Chuang, K.J.; Chen, J.K.; Tsai, C.Y.; Yang, Y.L.; Chang, C.C.; Chen, T.T.; Lee, C.N.; Feng, P.H.; Chen, K.Y.; et al. Alterations by Air Pollution in Inflammation and Metals in Pleural Effusion of Pneumonia Patients. Int. J. Environ. Res. Public Health 2019, 16, 705. [Google Scholar] [CrossRef] [Green Version]
  36. Zhang, Z.; Hong, Y.; Liu, N. Association of ambient Particulate matter 2.5 with intensive care unit admission due to pneumonia: A distributed lag non-linear model. Sci. Rep. 2017, 7, 8679. [Google Scholar] [CrossRef] [Green Version]
  37. Lv, C.; Wang, X.; Pang, N.; Wang, L.; Wang, Y.; Xu, T.; Zhang, Y.; Zhou, T.; Li, W. The impact of airborne particulate matter on pediatric hospital admissions for pneumonia among children in Jinan, China: A case-crossover study. J. Air Waste Manag. Assoc. 2017, 67, 669–676. [Google Scholar] [CrossRef]
  38. Zhang, J.; Ren, D.; Cao, X.; Wang, T.; Geng, X.; Li, X.; Tang, J.; Leng, S.; Wang, H.; Zheng, Y. Ambient air pollutants and hospital visits for pneumonia: A case-crossover study in Qingdao, China. BMC Public Health 2021, 21, 66. [Google Scholar] [CrossRef]
  39. Tao, Y.; Mi, S.; Zhou, S.; Wang, S.; Xie, X. Air pollution and hospital admissions for respiratory diseases in Lanzhou, China. Environ. Pollut. 2014, 185, 196–201. [Google Scholar] [CrossRef]
  40. Faustini, A.; Stafoggia, M.; Colais, P.; Berti, G.; Bisanti, L.; Cadum, E.; Cernigliaro, A.; Mallone, S.; Scarnato, C.; Forastiere, F.; et al. Air pollution and multiple acute respiratory outcomes. Eur. Respir. J. 2013, 42, 304–313. [Google Scholar] [CrossRef] [Green Version]
  41. Guarnieri, M.; Balmes, J.R. Outdoor air pollution and asthma. Lancet 2014, 383, 1581–1592. [Google Scholar] [CrossRef] [Green Version]
  42. Zheng, P.W.; Wang, J.B.; Zhang, Z.Y.; Shen, P.; Chai, P.F.; Li, D.; Jin, M.J.; Tang, M.L.; Lu, H.C.; Lin, H.B.; et al. Air pollution and hospital visits for acute upper and lower respiratory infections among children in Ningbo, China: A time-series analysis. Environ. Sci. Pollut. Res. Int. 2017, 24, 18860–18869. [Google Scholar] [CrossRef] [PubMed]
  43. Xu, Q.; Li, X.; Wang, S.; Wang, C.; Huang, F.; Gao, Q.; Wu, L.; Tao, L.; Guo, J.; Wang, W.; et al. Fine Particulate Air Pollution and Hospital Emergency Room Visits for Respiratory Disease in Urban Areas in Beijing, China, in 2013. PLoS ONE 2016, 11, e0153099. [Google Scholar] [CrossRef] [PubMed]
  44. Liu, P.; Wang, X.; Fan, J.; Xiao, W.; Wang, Y. Effects of Air Pollution on Hospital Emergency Room Visits for Respiratory Diseases: Urban-Suburban Differences in Eastern China. Int. J. Environ. Res. Public Health 2016, 13, 341. [Google Scholar] [CrossRef] [PubMed] [Green Version]
  45. Qiu, H.; Tian, L.W.; Pun, V.C.; Ho, K.F.; Wong, T.W.; Yu, I.T. Coarse particulate matter associated with increased risk of emergency hospital admissions for pneumonia in Hong Kong. Thorax 2014, 69, 1027–1033. [Google Scholar] [CrossRef] [PubMed] [Green Version]
  46. Barsky, A.J.; Peekna, H.M.; Borus, J.F. Somatic Symptom Reporting in Women and Men. J. Gen. Intern. Med. 2001, 16, 266–275. [Google Scholar] [CrossRef] [PubMed] [Green Version]
  47. Kunzli, N.; Jerrett, M.; Mack, W.J.; Beckerman, B.; LaBree, L.; Gilliland, F.; Thomas, D.; Peters, J.; Hodis, H.N. Ambient air pollution and atherosclerosis in Los Angeles. Environ. Health Perspect. 2005, 113, 201–206. [Google Scholar] [CrossRef] [PubMed]
  48. Samoli, E.; Aga, E.; Touloumi, G.; Nisiotis, K.; Forsberg, B.; Lefranc, A.; Pekkanen, J.; Wojtyniak, B.; Schindler, C.; Niciu, E.; et al. Short-term effects of nitrogen dioxide on mortality: An analysis within the APHEA project. Eur. Respir. J. 2006, 27, 1129–1138. [Google Scholar] [CrossRef]
  49. Lv, J.; Chen, W.; Sun, D.; Li, S.; Millwood, I.Y.; Smith, M.; Guo, Y.; Bian, Z.; Yu, C.; Zhou, H.; et al. Gender-specific association between tobacco smoking and central obesity among 0.5 million Chinese people: The China Kadoorie Biobank Study. PLoS ONE 2015, 10, e0124586. [Google Scholar] [CrossRef]
  50. Kan, H.; London, S.J.; Chen, G.; Zhang, Y.; Song, G.; Zhao, N.; Jiang, L.; Chen, B. Season, Sex, Age, and Education as Modifiers of the Effects of Outdoor Air Pollution on Daily Mortality in Shanghai, China: The Public Health and Air Pollution in Asia (PAPA) Study. Environ. Health Perspect. 2008, 116, 1183–1188. [Google Scholar] [CrossRef]
  51. Moshammer, H.; Hutter, H.P.; Hauck, H.; Neuberger, M. Low levels of air pollution induce changes of lung function in a panel of schoolchildren. Eur. Respir. J. 2006, 27, 1138–1143. [Google Scholar] [CrossRef] [PubMed] [Green Version]
  52. Wang, S.; Yu, S.; Yan, R.; Zhang, Q.; Li, P.; Wang, L.; Liu, W.; Zheng, X. Characteristics and origins of air pollutants in Wuhan, China, based on observations and hybrid receptor models. J. Air Waste Manag. Assoc. 2017, 67, 739–753. [Google Scholar] [CrossRef] [PubMed] [Green Version]
  53. Al-Qaness, M.A.A.; Fan, H.; Ewees, A.A.; Yousri, D.; Abd Elaziz, M. Improved ANFIS model for forecasting Wuhan City Air Quality and analysis COVID-19 lockdown impacts on air quality. Environ. Res. 2021, 194, 110607. [Google Scholar] [CrossRef] [PubMed]
  54. Gilbert, N.L.; Woodhouse, S.; Stieb, D.M.; Brook, J.R. Ambient nitrogen dioxide and distance from a major highway. Sci. Total Environ. 2003, 312, 43–46. [Google Scholar] [CrossRef]
  55. Simonetti, A.F.; Viasus, D.; Garcia-Vidal, C.; Carratala, J. Management of community-acquired pneumonia in older adults. Ther. Adv. Infect. Dis. 2014, 2, 3–16. [Google Scholar] [CrossRef] [Green Version]
  56. Ren, M.; Li, N.; Wang, Z.; Liu, Y.; Chen, X.; Chu, Y.; Li, X.; Zhu, Z.; Tian, L.; Xiang, H. The short-term effects of air pollutants on respiratory disease mortality in Wuhan, China: Comparison of time-series and case-crossover analyses. Sci. Rep. 2017, 7, 40482. [Google Scholar] [CrossRef]
  57. Faverio, P.; Aliberti, S.; Bellelli, G.; Suigo, G.; Lonni, S.; Pesci, A.; Restrepo, M.I. The management of community-acquired pneumonia in the elderly. Eur. J. Intern. Med. 2014, 25, 312–319. [Google Scholar] [CrossRef] [Green Version]
Figure 1. Contour plots of the exposure–lag-response effects between ambient pollutants and outpatient visits for pneumonia. Note: After adjusting for long-term trends, day-of-the-week effects, and meteorological factors, the distributed lag nonlinear model (DLNM) was used to obtain contour plots, with the first percentile concentration of air pollutants as the reference. (a): PM2.5; (b): SO2; (c): NO2.
Atmosphere 13 00578 g001
Figure 2. The cumulative lag effects of ambient pollutants on outpatient visits for pneumonia cases by gender. Note: After adjusting for long-term trends, day-of-the-week effects, and meteorological factors, the distributed lag nonlinear model (DLNM) was used to obtain the cumulative lag effects, with the first percentile concentration of air pollutants as the reference. (a): The moderate levels. (b): The high levels.
Atmosphere 13 00578 g002
Figure 3. The cumulative lag effects of ambient pollutants on outpatient visits for pneumonia cases by age (child: aged 0–14 years; adult: age 15–64 years; old: age >64 years). Note: After adjusting for long-term trends, day-of-the-week effects, and meteorological factors, the distributed lag nonlinear model (DLNM) was used to obtain the cumulative lag effects, with the first percentile concentration of air pollutants as the reference. Note: (a): The moderate levels. (b): The high levels. Sensitivity Analysis.
Atmosphere 13 00578 g003
Table 1. Description of outpatient visits for pneumonia cases, air pollutants, and meteorological factors in Wuhan from 1 January 2014 to 31 December 2017.
VariablesNMean ± SDCentiles
MinP1P25P50P75P99Max
Outpatient visits for pneumonia cases
All133,882 (100%)92.00 ± 47.0023.0031.0058.0077.00119.00236.00419.00
Age 0–14 Years77,247 (57.70%)53.00 ± 32.004.0010.0029.0040.0061.00142.00247.00
Age 15–64 Years33,601 (25.10%)23.00 ± 11.004.007.0016.0038.0056.0060.00106.00
Age >64 Years23,034 (17.20%)16.00 ± 10.001.003.0010.0044.0070.0048.00113.00
Male69,345 (51.80%)47.00 ± 25.0010.0014.0030.0021.0027.00123.00238.00
Female64,537 (48.20%)44.00 ± 23.009.0013.0028.0014.0019.00112.00214.00
Ambient Pollutants
PM2.5 (μg/m3)146163.87 ± 43.035.009.0033.0054.0082.00229.40287.00
NO2 (μg/m3)146147.50 ± 20.0211.0017.0032.0044.0060.00102.40119.00
SO2 (μg/m3)146117.66 ± 13.842.003.008.0014.0023.0069.00105.00
Meteorological Factors
Temperature (°C)146117.24 ± 8.83−4.320.419.5518.3324.7932.5033.98
Relative Humidity (%)146178.81 ± 11.0340.6749.2871.5079.3387.0498.53100.00
Precipitation (mm/h)14610.16 ± 0.550.000.000.000.000.052.258.00
Wind Velocity (m/s)14611.64 ± 0.890.300.431.001.432.104.426.52
Table 2. The RR and 95% confidence interval of ambient pollutants on outpatient visits for pneumonia cases.
LagModerate Level (P50)High Level (P99)
PM2.5SO2NO2PM2.5SO2NO2
Single-day lag effects
01.006 (0.977–1.036)1.020 (0.987–1.054)1.011 (0.984–1.039)1.026 (0.974–1.081)0.972 (0.897–1.053)1.023 (0.980–1.068)
11.013 (0.996–1.030)1.020 (1.001–1.039)1.007 (0.990–1.025)1.021 (0.988–1.055)0.997 (0.951–1.046)1.023 (0.996–1.050)
21.018 (1.006–1.031)1.020 (1.007–1.033)1.005 (0.990–1.019)1.019 (0.992–1.046)1.013 (0.978–1.050)1.022 (1.001–1.044)
31.021 (1.008–1.034)1.021 (1.007–1.034)1.003 (0.988–1.017)1.018 (0.991–1.045)1.021 (0.987–1.056)1.022 (1.001–1.043)
41.022 (1.009–1.036)1.022 (1.008–1.036)1.001 (0.987–1.016)1.018 (0.991–1.046)1.021 (0.987–1.057)1.022 (1.001–1.043)
51.022 (1.010–1.035)1.023 (1.010–1.036)1.000 (0.986–1.015)1.019 (0.993–1.047)1.017 (0.985–1.050)1.021 (1.002–1.042)
61.021 (1.010–1.032)1.024 (1.013–1.035)1.000 (0.987–1.014)1.021 (0.995–1.046)1.009 (0.981–1.037)1.021 (1.003–1.039)
71.019 (1.008–1.029)1.024 (1.014–1.034)1.001 (0.988–1.014)1.022 (0.997–1.047)0.999 (0.973–1.026)1.020 (1.002–1.038)
81.016 (1.005–1.026)1.024 (1.013–1.035)1.001 (0.988–1.015)1.022 (0.997–1.048)0.989 (0.962–1.017)1.019 (1.000–1.038)
91.012 (1.000–1.024)1.022 (1.010–1.035)1.003 (0.989–1.017)1.021 (0.994–1.048)0.981 (0.950–1.013)1.017 (0.997–1.038)
101.008 (0.995–1.021)1.020 (1.006–1.034)1.005 (0.990–1.019)1.018 (0.990–1.047)0.976 (0.943–1.010)1.015 (0.994–1.037)
111.004 (0.991–1.016)1.016 (1.003–1.029)1.007 (0.993–1.022)1.013 (0.986–1.041)0.975 (0.943–1.009)1.013 (0.992–1.034)
121.000 (0.988–1.012)1.010 (0.998–1.023)1.010 (0.996–1.024)1.006 (0.979–1.033)0.981 (0.950–1.014)1.010 (0.989–1.030)
130.996 (0.981–1.011)1.003 (0.987–1.019)1.013 (0.997–1.030)0.995 (0.964–1.027)0.995 (0.955–1.037)1.006 (0.981–1.031)
140.992 (0.967–1.018)0.993 (0.966–1.022)1.017 (0.992–1.043)0.981 (0.934–1.031)1.019 (0.951–1.093)1.001 (0.962–1.042)
Cumulative lag effect
0–11.020 (0.975–1.067)1.040 (0.989–1.094)1.018 (0.975–1.064)1.048 (0.965–1.138)0.969 (0.855–1.099)1.046 (0.977–1.119)
0–21.038 (0.985–1.095)1.060 (0.999–1.125)1.023 (0.969–1.080)1.067 (0.964–1.181)0.982 (0.845–1.142)1.069 (0.984–1.162)
0–31.060 (1.001–1.123)1.082 (1.015–1.154)1.026 (0.964–1.092)1.086 (0.967–1.220)1.003 (0.849–1.184)1.093 (0.995–1.200)
0–41.084 (1.019–1.152)1.106 (1.034–1.183)1.027 (0.957–1.102)1.106 (0.970–1.260)1.024 (0.857–1.225)1.116 (1.007–1.238)
0–51.108 (1.038–1.182)1.131 (1.054–1.215)1.027 (0.950–1.111)1.127 (0.974–1.304)1.041 (0.861–1.260)1.140 (1.019–1.277)
0–61.131 (1.056–1.212)1.158 (1.074–1.248)1.028 (0.943–1.120)1.150 (0.979–1.351)1.051 (0.859–1.285)1.164 (1.031–1.315)
0–71.152 (1.072–1.239)1.186 (1.096–1.283)1.028 (0.936–1.129)1.175 (0.986–1.401)1.050 (0.850–1.297)1.187 (1.042–1.352)
0–81.170 (1.085–1.263)1.214 (1.118–1.318)1.030 (0.931–1.139)1.201 (0.992–1.453)1.039 (0.832–1.296)1.210 (1.054–1.389)
0–91.184 (1.093–1.283)1.241 (1.138–1.354)1.033 (0.927–1.151)1.226 (0.997–1.507)1.019 (0.807–1.286)1.231 (1.063–1.425)
0–101.193 (1.096–1.299)1.266 (1.154–1.389)1.038 (0.925–1.165)1.248 (1.000–1.559)0.994 (0.776–1.273)1.249 (1.069–1.460)
0–111.198 (1.094–1.311)1.286 (1.165–1.421)1.045 (0.925–1.182)1.265 (0.997–1.605)0.970 (0.744–1.264)1.265 (1.072–1.493)
0–121.197 (1.088–1.317)1.300 (1.169–1.445)1.056 (0.928–1.202)1.272 (0.987–1.639)0.951 (0.718–1.262)1.277 (1.072–1.522)
0–131.192 (1.078–1.318)1.304 (1.166–1.458)1.070 (0.935–1.225)1.266 (0.969–1.654)0.947 (0.702–1.276)1.285 (1.070–1.543)
0–141.183 (1.063–1.316)1.295 (1.150–1.459)1.088 (0.945–1.254)1.242 (0.937–1.647)0.965 (0.701–1.329)1.286 (1.060–1.561)
Note: The first percentile of each air-pollutant concentration was selected as the reference. The RR was estimated by comparing the 50th percentile of each air-pollutant concentration and 99th percentile of each air-pollutant concentration, respectively. Statistically significant results are shown in bold (p < 0.05).
Publisher’s Note: MDPI stays neutral with regard to jurisdictional claims in published maps and institutional affiliations.

