
The Effect of the Water Tower of Typhoon Mangkhut (2018)


Southern Marine Science and Engineering Guangdong Laboratory (Zhuhai), School of Atmospheric Sciences, Sun Yat-sen University, Zhuhai 519000, China
*
Author to whom correspondence should be addressed.
Atmosphere 2022, 13(4), 636; https://0-doi-org.brum.beds.ac.uk/10.3390/atmos13040636
Submission received: 29 March 2022
/
Revised: 14 April 2022
/
Accepted: 15 April 2022
/
Published: 18 April 2022
(This article belongs to the Special Issue Air-Sea Interaction: Modeling and Dynamics)
Abstract
:On 16 September 2018, the Yangtze River Delta (YRD) experienced heavy precipitation, with the local daily precipitation exceeding 250 mm. Using ERA5 reanalysis data and satellite observations from the GPM, we review this heavy rain event in terms of its meteorological triggers and water vapor transport. As the high-level water vapor produced by Typhoon Mangkhut continued to be transported northward, the precipitation in the YRD gradually increased, and stratus precipitation played a major role in this event. The high-level water vapor continued to be transported northward to the east of Taiwan Island without falling, so heavy precipitation did not appear to the east of Taiwan Island. In the present study, we suggest that the meteorological trigger of this event was mainly the gradual falling of ice particles moving northward from a high altitude. The high-level ice particles originated from the “water tower” at the center of Typhoon Mangkhut, which pumped low-level water vapor into the high-level water vapor. In general, the appearance of abnormal values of high-level water vapor transport is an important atmospheric disturbance related to heavy precipitation in the downstream areas of high-level wind, and the typhoon water tower can be used as an important forecast signal for long-distance heavy precipitation in China during the active typhoon period.
1. Introduction
Tropical cyclones are important weather systems that has a significant impact on precipitation and can cause extensive damages to property [1]. In particular, in coastal areas, precipitation caused by typhoons accounts for a large portion of the total annual precipitation [2,3]. There are three types of typhoon precipitation: eye-wall precipitation, spiral rain bands precipitation, and long-distance precipitation [4]. The largest portion of the total precipitation is caused by the typhoon eyewall precipitation that is, the precipitation in the eyewall area [5,6,7], which is usually 30–50 km away from the center of the typhoon [8]. Several studies have shown that discrete spiral rainbands frequently appear in areas far away from the typhoon center [9]; these are usually located asymmetrically within 100–500 km of the center [10]. Therefore, simply studying the precipitation occurring within 500 km of the typhoon center cannot accurately capture the overall precipitation levels of a typhoon [10].
The long-distance precipitation of a typhoon usually refers to precipitation occurring about 1000 km away from the center of the typhoon [11]. Some studies have pointed out that topography plays an important role in such precipitation [12,13]. The specific topography of a region can promote the uplift of warm and humid air, causing adiabatic cooling and condensation and thereby enhancing precipitation, which is mostly short-term heavy precipitation [12,13,14,15,16]. The combination of frontal systems and tropical cyclones can also lead to heavy precipitation over long distances. Tropical cyclones provide water vapor transport, and frontal systems provide lift, with warm and humid air being lifted above dry and cold air. During the uplifting process, the water vapor in the air cools and condenses to cause rainfall, which is mostly continuous low-intensity rainfall, and creates large accumulated amounts of rainfall [17]. Furthermore, the upper-level jet system is also closely related to the long-distance rainfall of tropical cyclones. It can provide a better upper-level divergence for the development of local strong convections, thereby promoting the development of convection and causing local heavy precipitation [18,19]. Large-scale environmental variables, such as SST, vorticity, divergence and zonal winds, regulate the development of tropical cyclones and the priority areas for tropical cyclone occurrences, as well as having an important impact on typhoon-related long-distance heavy rainfall [20].
Regarding the water vapor transport of typhoons, many scholars have pointed out that it is mainly concentrated in the middle and low layers—that is, around 700 hPa [21,22]. In addition, water vapor transport can promote the production of precipitation, and the area where heavy precipitation occurs is often the convergence area of water vapor transport [18,23]. There are a few studies on typhoon upper-level water vapor transport, but a representative study of this phenomenon focuses on the rain belt precipitation occurring outside typhoons in Japan. In this study, the authors showed [24], through sensitivity experiments, that the southerly wind associated with TC enhances precipitation by moistening the middle and upper atmosphere. This study is a case study of Typhoon Melor, and the simulations only changed the amount of water vapor at different altitudes, but not the sports field. Additionally, as this typhoon case is very close to the westerly belt, this study may not be applicable to other typhoons. However, if there is sufficient water vapor in the upper layer, it will enhance the ice phase precipitation process (deposition and riming) [25].
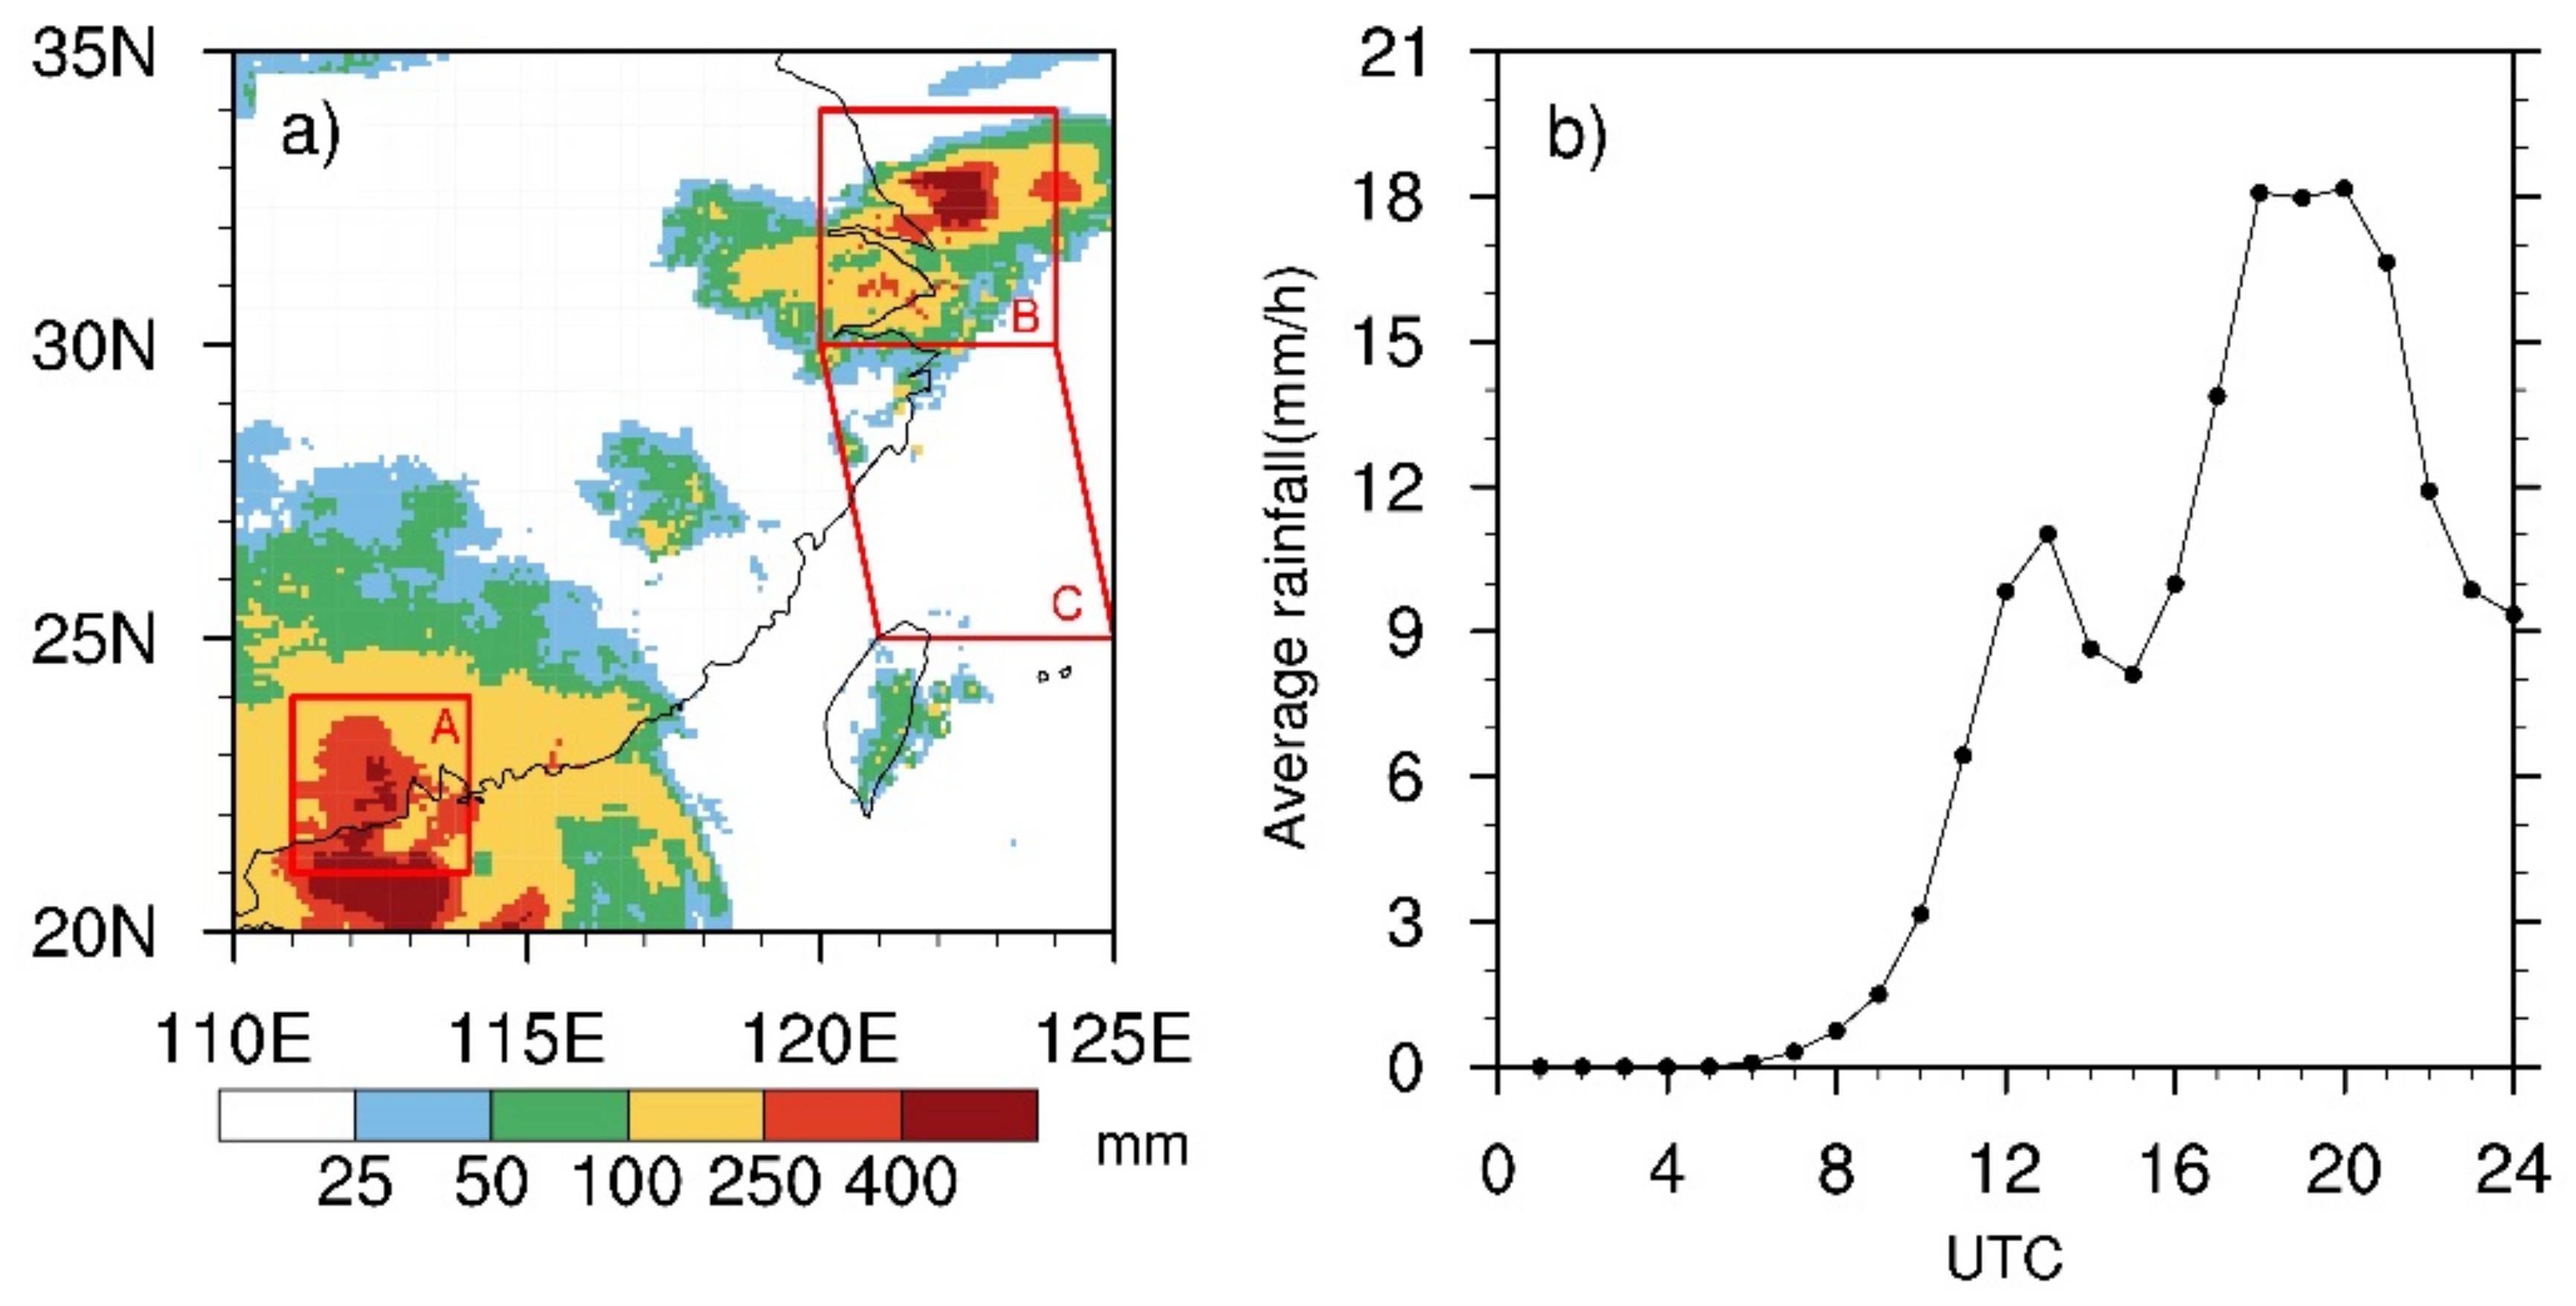
Super Typhoon Mangkhut is the most violent typhoon to have hit the coastal areas of southeastern China in recent decades [26]. Typhoon Mangkhut formed a tropical depression over the northwestern Pacific Ocean on 7 September 2018 and moved roughly westward over the subsequent four days. It intensified into a super typhoon on 11 September [27,28]. Although super Typhoon Mangkhut weakened when it first made landfall, it still caused extensive damage to the coastal areas of southeastern China [29,30]. According to statistics, the direct economic loss exceeded USD 2.2 billion. From the 16th to the 18th of September, under the influence of “Typhoon Mangkhut”, the hourly rainfall exceeded 100 mm at many of the nearby stations (31° N, 121° E) [31]. From the GPM IMERG precipitation data (Figure 1a), it can be observed that there were mainly two rainfall centers in this rainstorm process: eyewall precipitation (23° N, 112° E) and long-distance precipitation (31° N, 121° E).
Research has pointed out that long-distance precipitation is related to factors such as water vapor transport in the middle and low layers of typhoons, cold air infiltration, atmospheric circulation, and terrain coordination [12,13,14,15,16]. However, although much research has been conducted in the field of typhoon precipitation, most studies only focus on the typhoon itself, which is usually confused with monsoon precipitation; they also focus on the water vapor transport occurring in the middle and low layers (below 700 hPa) of typhoons, and little attention is paid to high-level water vapor transport. Typhoons can cause air to move strongly upward for a longer period of time, resulting in continuous high-altitude water vapor transport, which makes this a very special type of transport. High-level water vapor transport may produce unique mechanisms that are different from monsoon precipitation; thus, in this paper, we study the long-distance precipitation caused by this unique high-level water vapor transport.
As can be seen from Figure 1a, under the influence of Typhoon Mangkhut, a significant amount of precipitation occurred in area A and area B. The yellow area with a daily precipitation exceeding 100 mm surpassed 50% of the total precipitation area, and the maximum daily precipitation exceeded 400 mm. The precipitation in area A corresponds to typhoon eyewall precipitation, and the precipitation in area B corresponds to typhoon long-distance precipitation, but there are other atmospheric processes involved.
As can be seen from Figure 1b, rain began in area B at around 06:00 on 16 September, and the rainfall intensity reached its first peak at 12:00 on the same day, when the average hourly rainfall in the area was about 10 mm. The second peak was reached from 18:00 to 20:00 on 16 September, when the average hourly rainfall in the area was about 18 mm. After 20:00, it dropped rapidly, and the average hourly rainfall of the area was greater than 12 mm for 6 h.
2. Materials and Methods
We used the GPM IMERG Final Precipitation L3 Half Hourly 0.1° × 0.1° V06 (GPM_3IMERGHH) data for the entire day of 16 September 2018, to provide the rain rate. This database uses the differential precipitation-relevant satellite passive microwave sensors in the GPM constellation and is fused to the rain rate estimated by the geostationary infrared (IR) satellite [32], and contains a total of 48 files. The acquisition time was 8 March 2020 and the acquisition address was https://disc.gsfc.nasa.gov/datasets/GPM_3IMERGHHE_06/summary?keywords=GPM_3IMERGHH_06 (accessed on 29 March 2022). The total amount of precipitation over the entire day was obtained by accumulating the files, and the hourly rainfall was obtained by adding them in pairs.
Based on the validation results compared to other rainfall estimation products, GPM IMERG has some advantages. For example, some studies have pointed out that GPM IMERG has a significant performance advantage over Version-7 post-real-time 3B42 (3B42V7). The gap between the two products is more significant at a sub-daily resolution [33,34]. Additionally, on the basis of the daily timescale of bias in comparison with the ground data, the IMERG product far outperforms the ERA-Interim products [35]. The difference occurs between level 3 and level 1 and 2, which are geophysical parameters that have been spatially and/or temporally resampled from level 1 or level 2 data. Additionally, the L3 product contains the IMERG Early, Late. and Final Run. The main difference between the IMERG Early and Late Run is that the Early product only has forward propagation (which essentially amounts to extrapolation forward in time), while the Late product has both forward and backward propagation (allowing interpolation). The Late Run product is computed about 14 h after the observation time, so sometimes a microwave overpass is not delivered in time for the Late Run product, but is subsequently introduced and can be used in the Final [24]. On the whole, the correlation coefficient (CC) of the IMERG products is 0.51–0.56, and the IMERG-FR has the best probability of detection (POD, 0.88), followed by IMERG-LR (POD, 0.84) and IMERG-ER (POD, 0.81) [36].
ERA5 is the fifth generation of the ECMWF atmospheric reanalysis of the global climate and is gradually replacing ERA Interim as the latest climate reanalysis service (Copernicus Climate Change Service (C3S), 2017). This data set is produced using 4DVar data assimilation and is closely associated with the excellence of the forecast products. Compared with the widely used ERA-Interim, ERA5 makes a number of improvements in the assimilation system and input observations (including precipitation) and has higher temporal and spatial resolutions. The product consists of hourly analysis fields on 37 pressure levels, from the surface to 1 hPa. We used the ERA5 data to provide the U-component of wind, V-component of wind, specific humidity, vertical integral of the northward water vapor flux, vertical integral of the eastward water vapor flux, and vertically integrated moisture divergence. The ERA5 data set, which covers data from 1979 to the present, is now available for public use. Detailed documentation and download information can be found at the ECMWF website (https://www.ecmwf.int/) (accessed on 29 March 2022).
Typhoon rainfall occurs in the Pearl River Delta (area A in Figure 1a) and the Yangtze River Delta (area B in Figure 1a). The rectangular area within the ranges 21° N–24° N and 111° E–114° E box corresponds to the A area, and the typhoon body precipitation appears in this area. Typhoon long-distance precipitation mainly occurs in the Yangtze River Delta region, which is delimited in the rectangular area selected within the 30–34° N and 120° E–124° E box corresponding to the B area. The box area shown in Figure 1 as the C area corresponds to the water vapor transport channel of the upper and lower layers and is located to the east of Taiwan Island. The boundary of the C area is obtained based on the distribution of abnormal values of water vapor transport obtained by ERA5 data processing.
According to the decomposition of physical quantities [37], we know that heavy rain is related to synoptic-scale disturbances, and the diurnal variation, seasonal cycle, and periodic variation of various time scales in atmospheric variables are related to climate change, e.g., the atmospheric changes caused by periodic forcings, such as solar radiation. Although these changes in the climate need to be recognized, they need not be forecasted, as what needs forecasting are disturbances relative to these rule changes.
Therefore, we physically decomposed meteorological elements, such as vertically integrated water vapor transport, stratified U and V wind, and stratified specific humidity. Thereby, the weather-scale disturbance was obtained. Taking the decomposition formula of zonal wind speed U as an example, the formula is as follows:
Wind speed U disturbance amount:
where refers to the current meteorological observation wind speed U field that changes with the longitude λ and the latitude φ from 1 January to t day in the Y year; refers to the time-averaged spatial grid point wind speed U from the first year to the N year; refers to the average value of the latitude circle at the current moment of historical observation, minus the daily average climate component of the latitude circle on the t day of the accumulated N years from the 1st year to the N year; and λ is the latitude circle as equidistant grid points from the first point to the last point P.
The vertical integration of the water vapor transport disturbance, the stratified UV wind, and the stratified specific humidity disturbance were processed according to the above method, and the stratified water vapor transport disturbance was obtained using the formula , where are the layered UV wind disturbances and is the layered specific humidity disturbances 𝐻′.
In order to better highlight the extreme nature of this process, the ratio n of the disturbance quantity of stratified water vapor transport to the N year mean value of the stratified water vapor transport was calculated as .
3. Results
3.1. Circulation Background
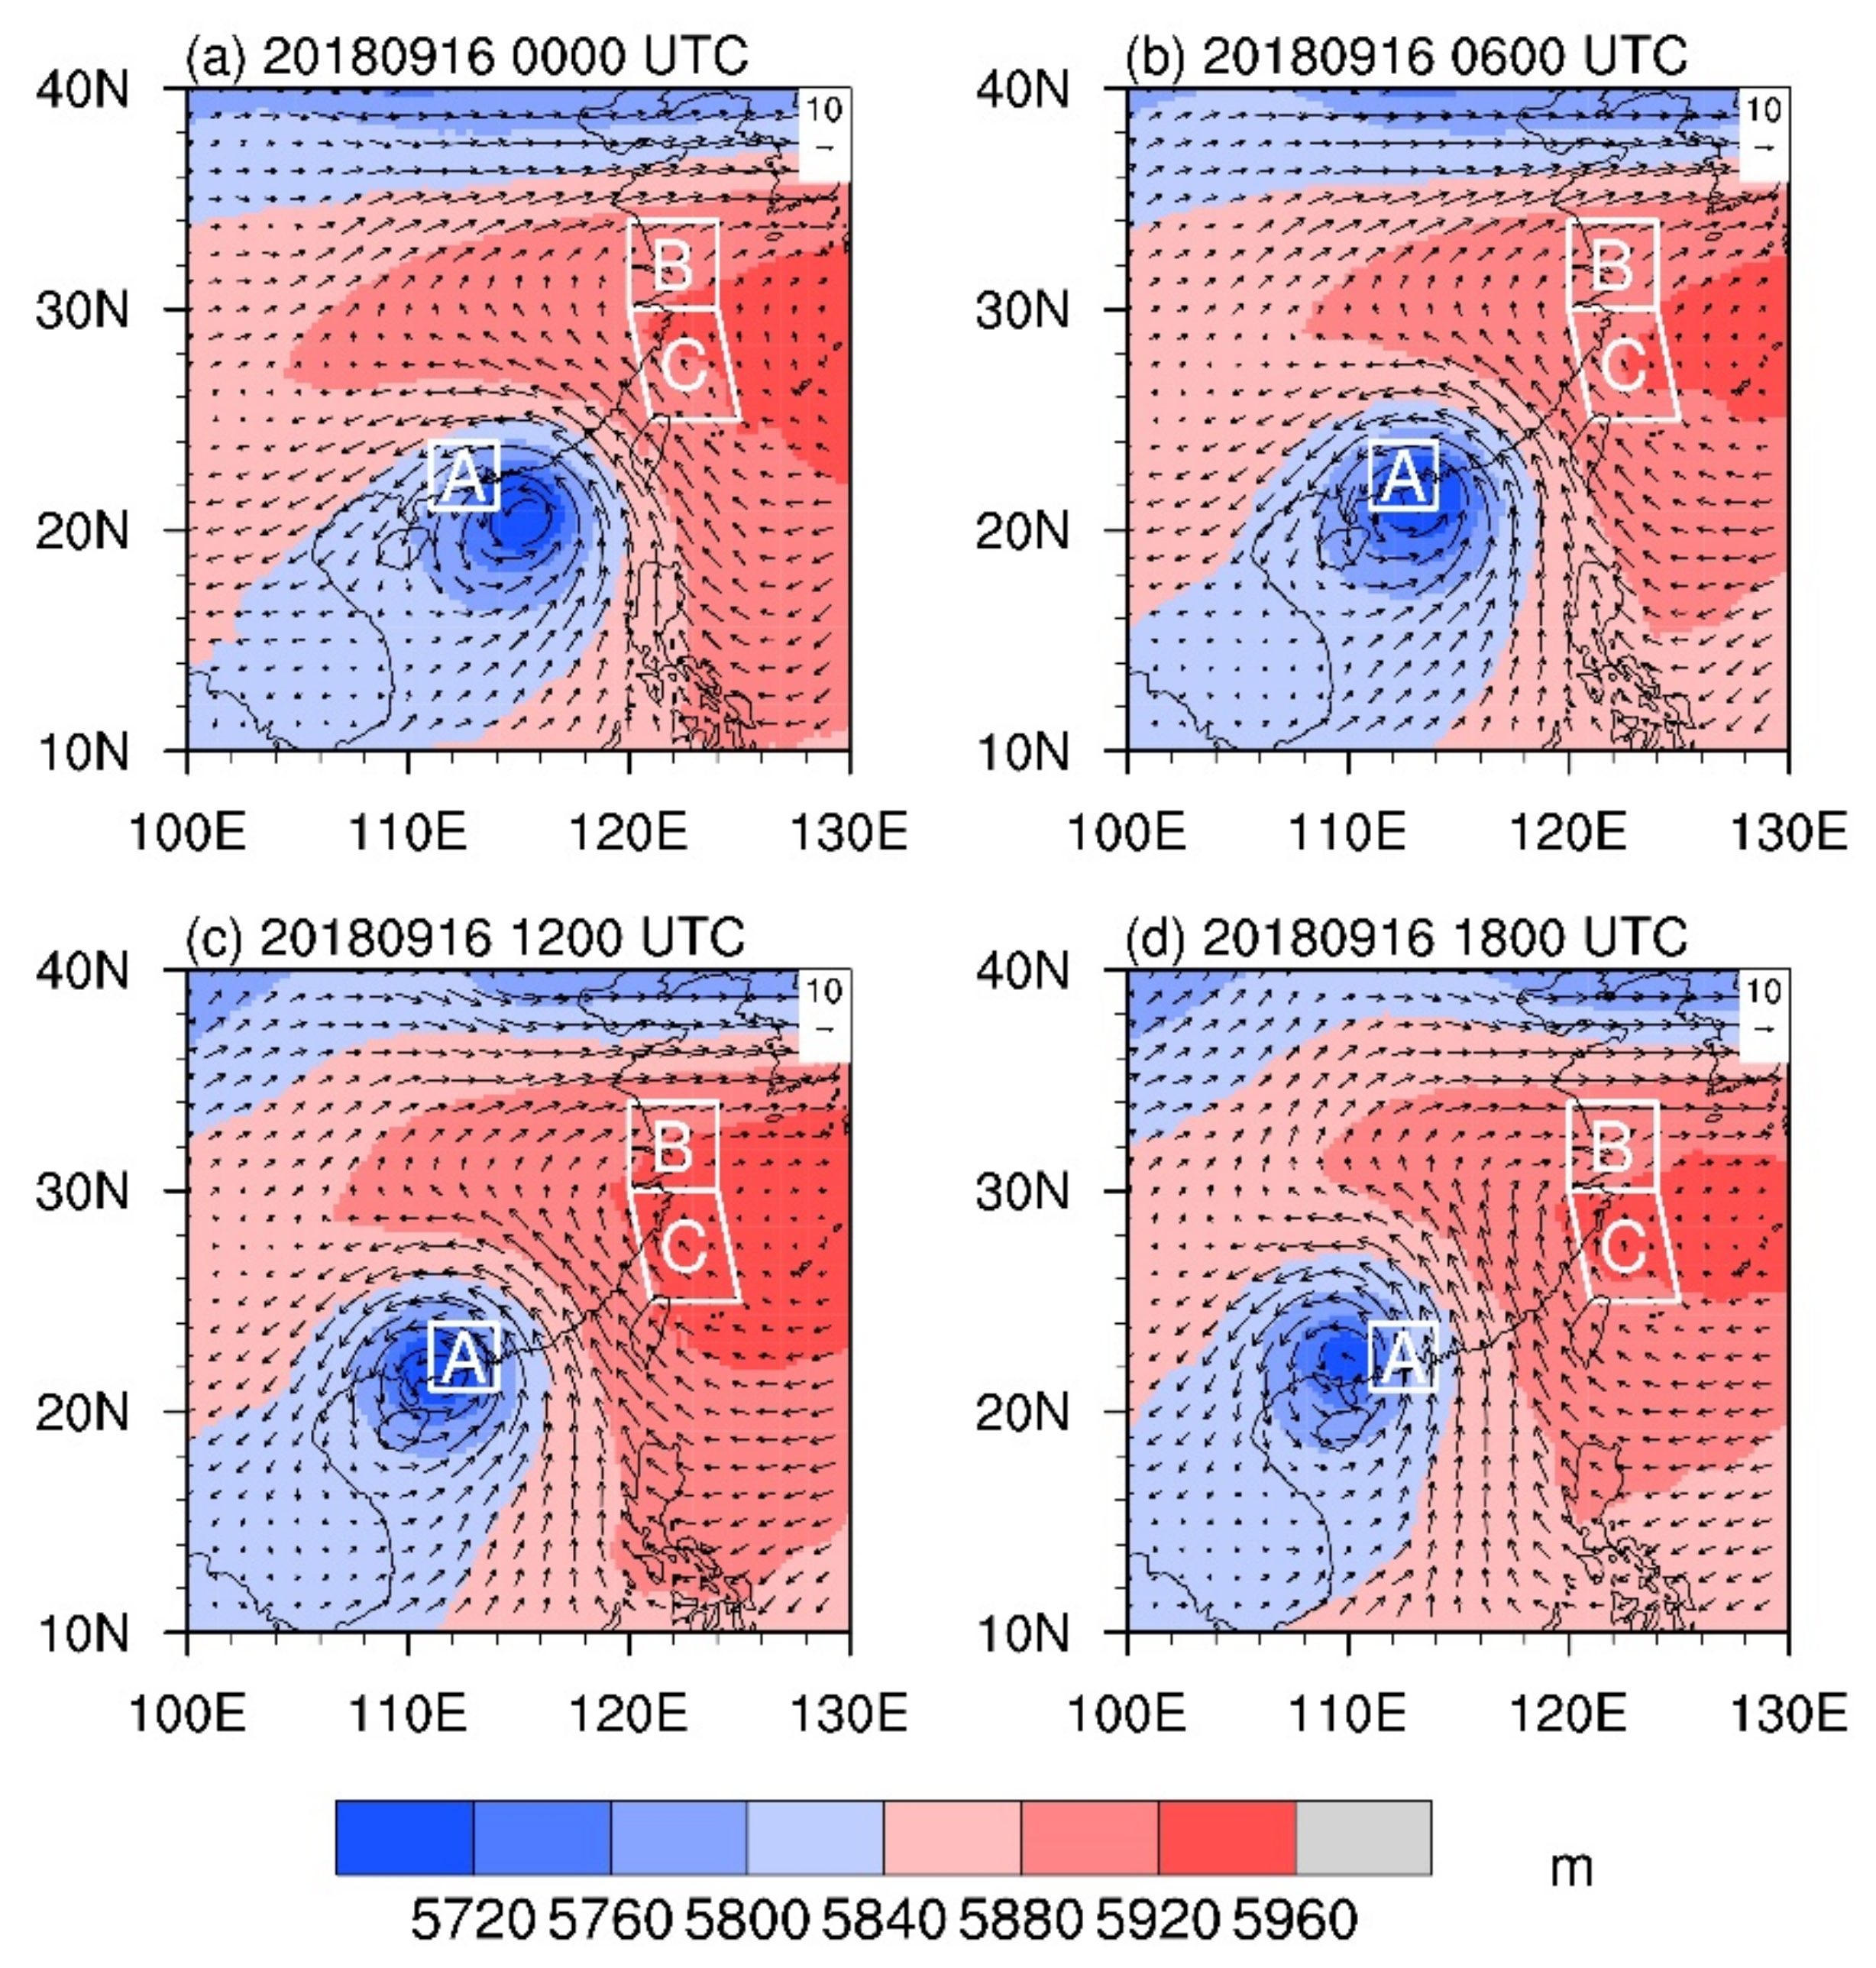
This type of long-distance rainfall is the result of the interaction of typhoons and summer monsoons. From the 500 hPa circulation background (Figure 2), it can be observed that the summer monsoon retreated, but, under the influence of the typhoon, the southerly airflow was strengthened. There was a strong pressure gradient between the subtropical high pressure and the center of the typhoon’s low pressure, which caused strong wind speeds. Additionally, as the typhoon gradually moved to the northwest, the subtropical high pressure gradually retreated to the northeast. This caused the water vapor conveyor belt to rise north.
3.2. Water Vapor Transport
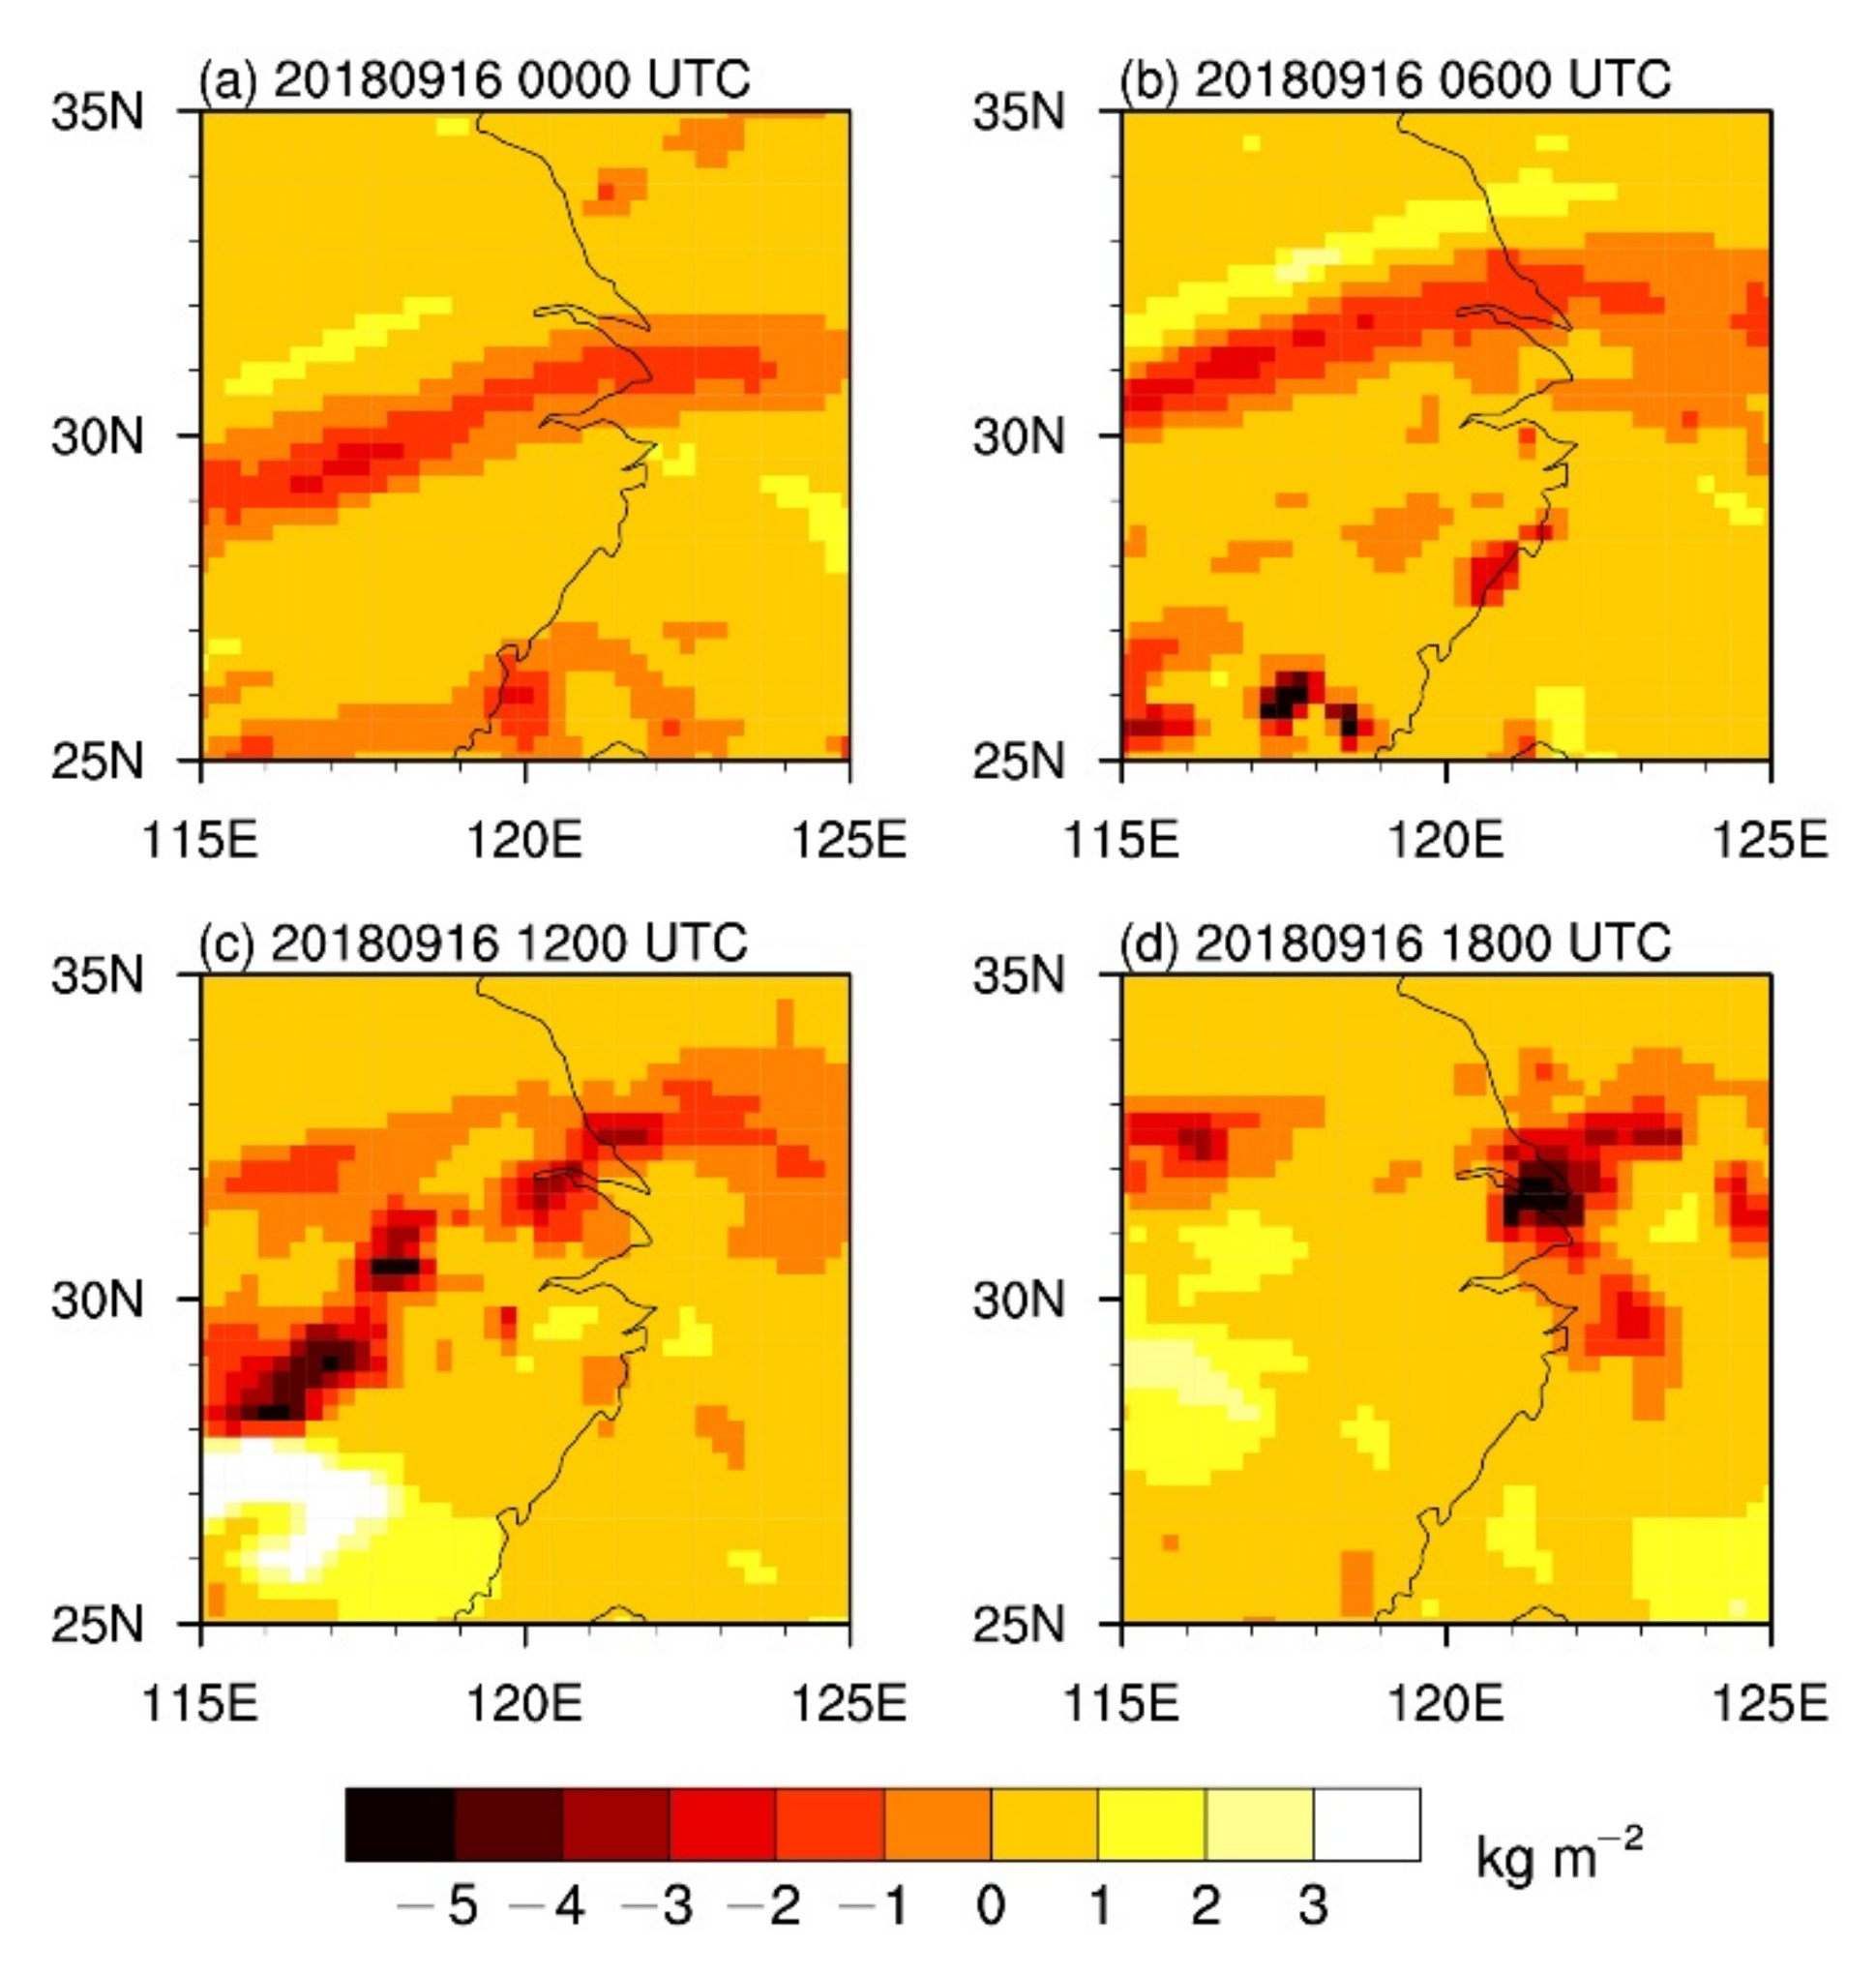
The water vapor transport parameter has a positive value in the case of moisture that spreads out or diverges, and a negative value in the opposite case—that is, for moisture that concentrates or converges (convergence). High negative values of this parameter may be related to the intensification of precipitation and floods [32]. We can see that there were high negative values in the Yangtze River Delta (Figure 4). Figure 4 shows that there was a strong convergence of water vapor in that area, resulting in heavy precipitation.
We suggest that the precipitation in area B is the result of the combined action of typhoons and other atmospheric processes. This can be explained by the background circulation. The water vapor transport of typhoons, the topographic uplift of the Yangtze River Delta, and the increase in the condensation nuclei caused by the increase in aerosols all had an impact on precipitation, indicating that other atmospheric processes also affect this precipitation process.
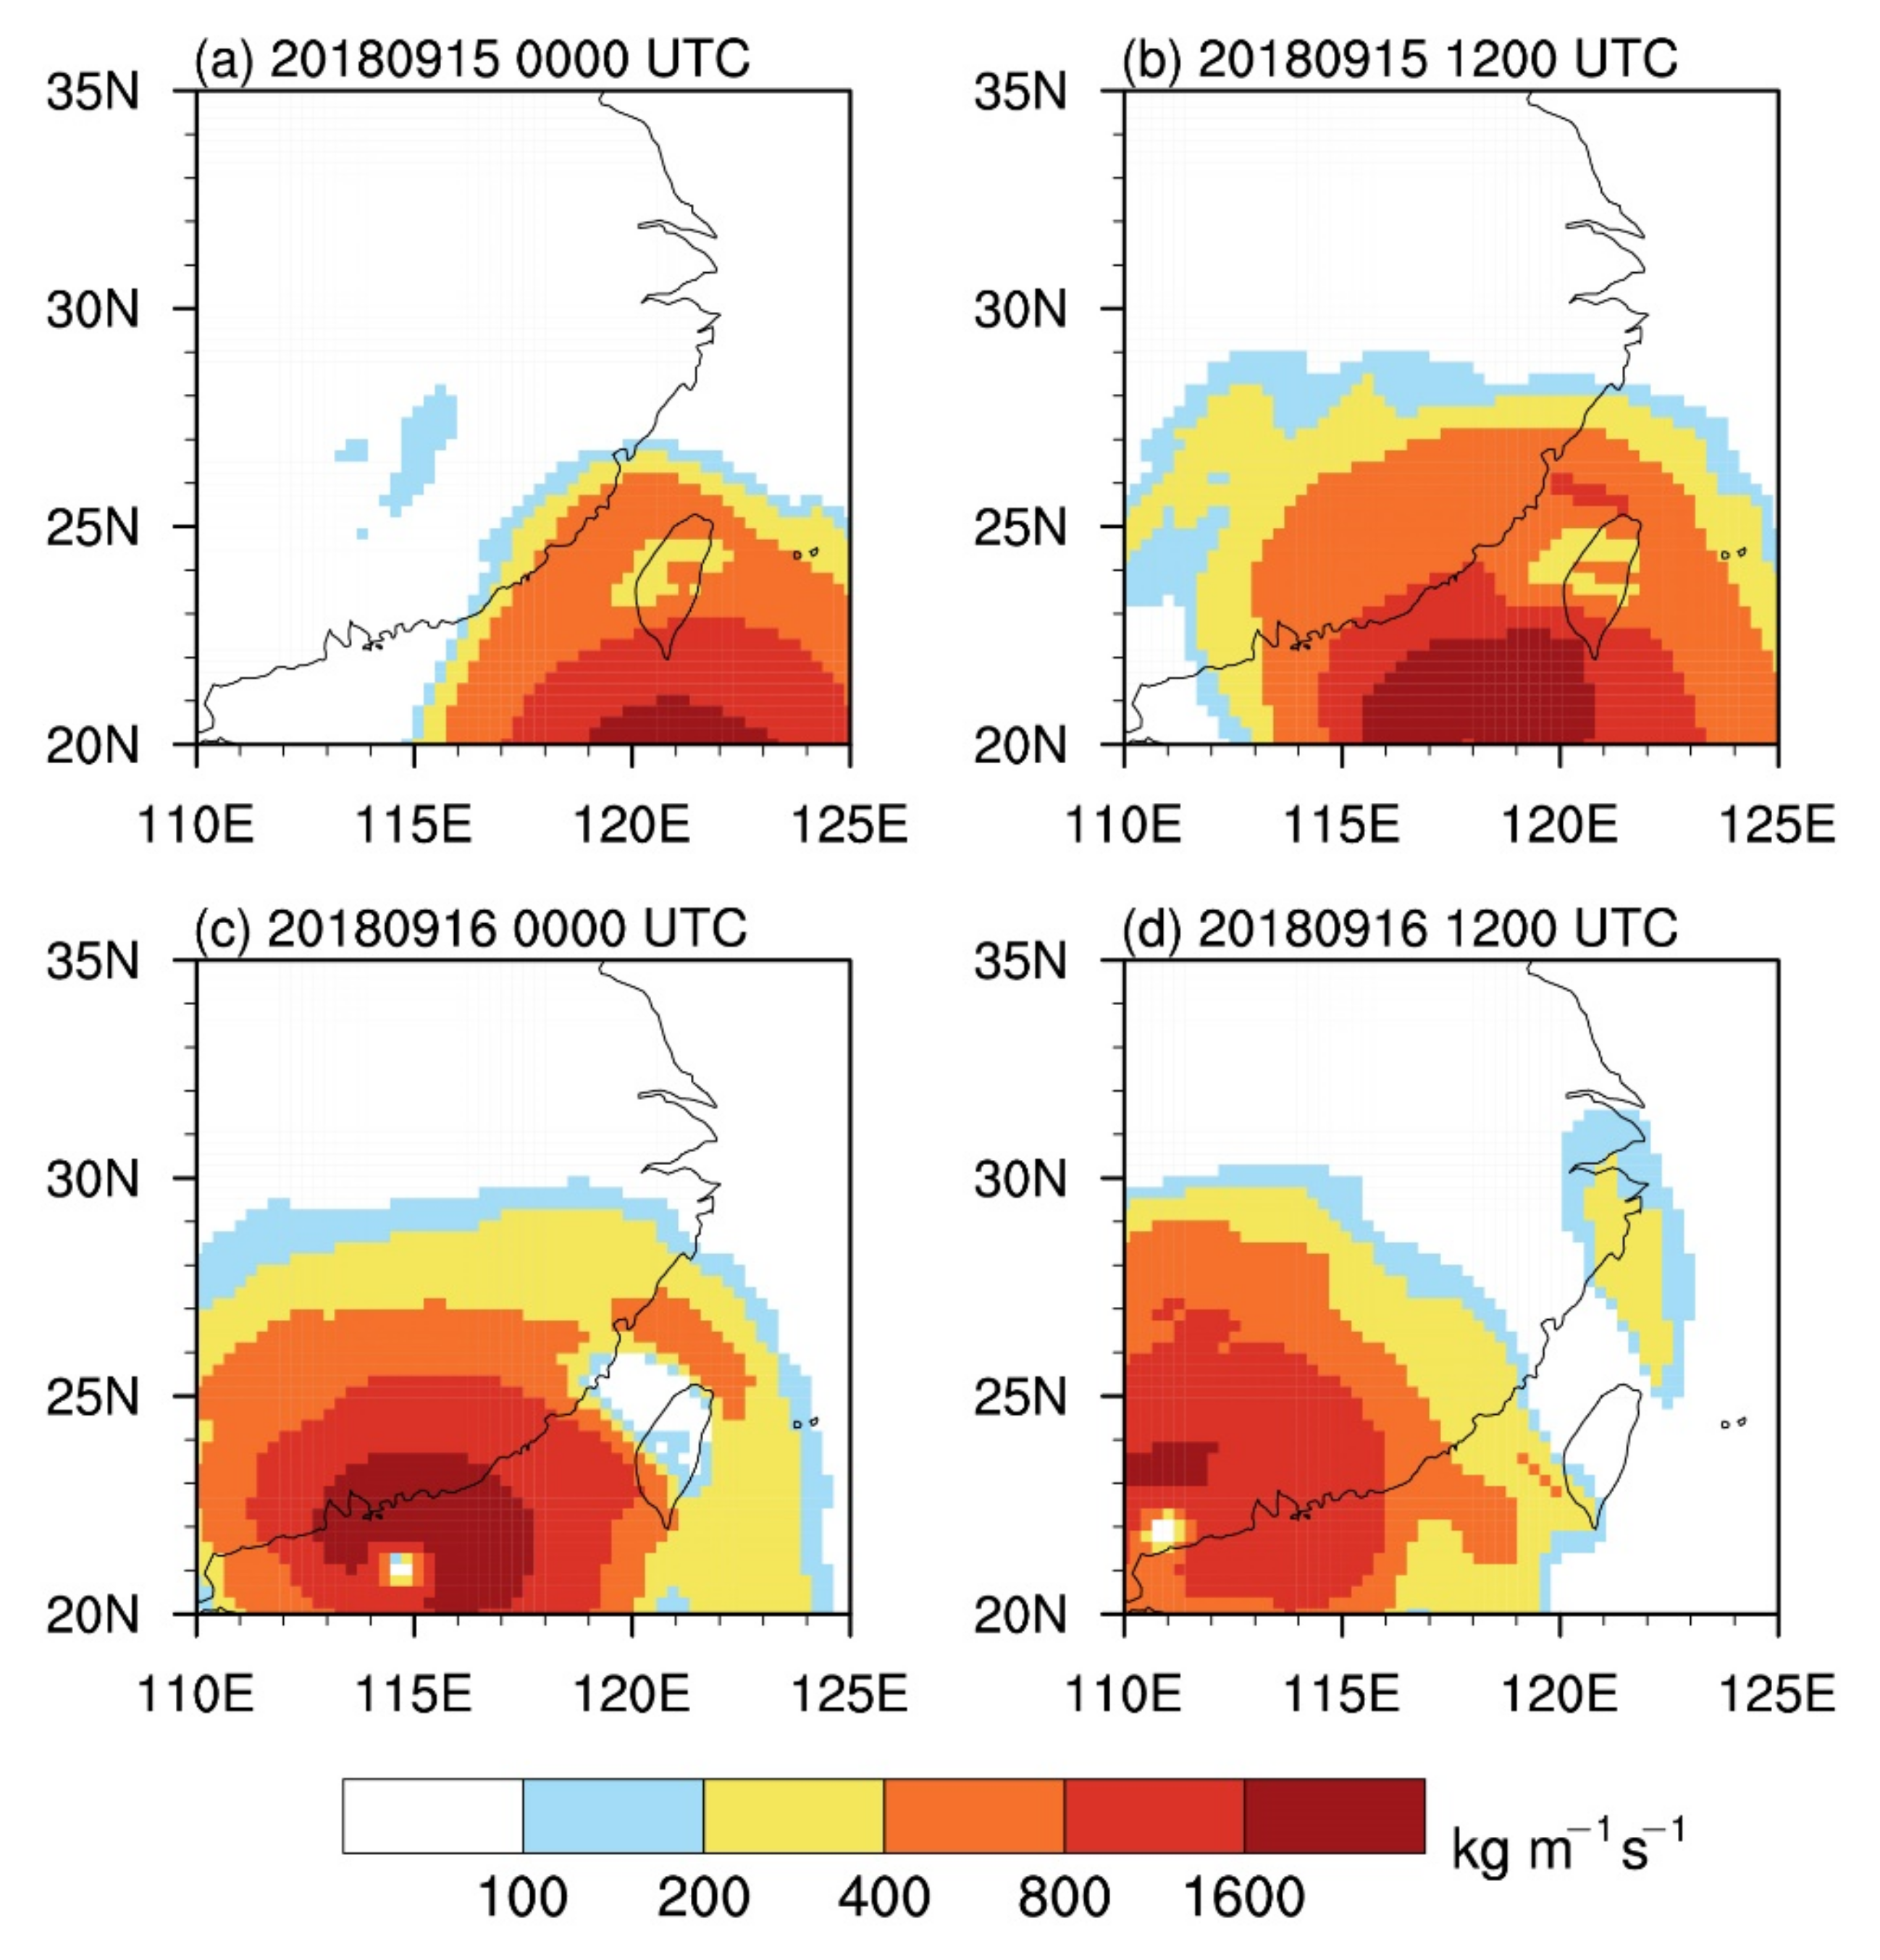
From 0:00 on 15 September to 12:00 on 16 September, Typhoon Mangkhut moved in the west–north direction under the influence of the air flow guided by the southwest side of the subtropical high pressure [30]. The center of the typhoon moved from 18.1° N, 120.7° E to 22° N, 111.6° E. From Figure 5, we can see the change in the whole-layer water vapor transport disturbance during the typhoon movement. At 0:00 on 15 September, the center of the typhoon was located in the eastern part of the Bashi Channel. Due to the topography of the Central Mountains in Taiwan Island, the southeast airflow of the Bashi Channel reached Taiwan Island and was blocked by the mountains, forming a southeast jet with the maritime subtropical high pressure, heading toward East China and transporting water vapor to the area [18]. Precipitation occurred on the southeastern side of the Taiwan Island Mountains, and the water vapor was blocked. The water vapor transport value of the whole layer decreased in the central part of Taiwan Island, forming two high value areas in the south and north (Figure 5a). At 12:00 on 15 September, as the typhoon continued to move northwestward, a sub-maximum water vapor transport area was formed in northern Taiwan Island, with a maximum value exceeding 800 kg/m/s (Figure 5b).
At 0:00 on 16 September, Typhoon Mangkhut was close to making landfall in the Pearl River Delta. The central circulation of the typhoon continued to move away from Taiwan Island, beginning to move eastward, and the second maximum value of water vapor transport remained above 400 kg/m/s (Figure 5c). At 12:00 on 16 September, Typhoon Mangkhut landed in Guangdong Province. The water vapor transport high-value area on the northeastern side of Taiwan Island was completely separated from the typhoon body, and continued to move northward, with the shape becoming more slender. At this time, the maximum value dropped to 200–400, but the area was further expanded, exceeding 36,000 km2 (Figure 5d).
The water vapor transport disturbance of 800–1600 kg/m/s far exceeds the seasonal average (monsoon factor) water vapor transport, which is usually 200–400 kg/m/s [39,40,41]. Common typhoons are often 400–800 kg/m/s, and rarely exceed 1000 kg/m/s [40,42]. Therefore, the high-value area of water vapor transport on the north side separated by the topography continued to move northward, bringing the water vapor amount close to the direct landing of an ordinary typhoon to the B area.
The sub-maximum water vapor transport area (200 kg/m/s) was completely separated from the typhoon body water vapor transport maximum value area (200 kg/m/s) at 05:00 on 16 September, and then moved to the north in isolation. At this time, the water vapor had been supplied by the typhoon on the east side of Taiwan Island for over 12 h, and sufficient water vapor had been transported from the south to the north through the C area. Thus, we chose this time period for analysis.
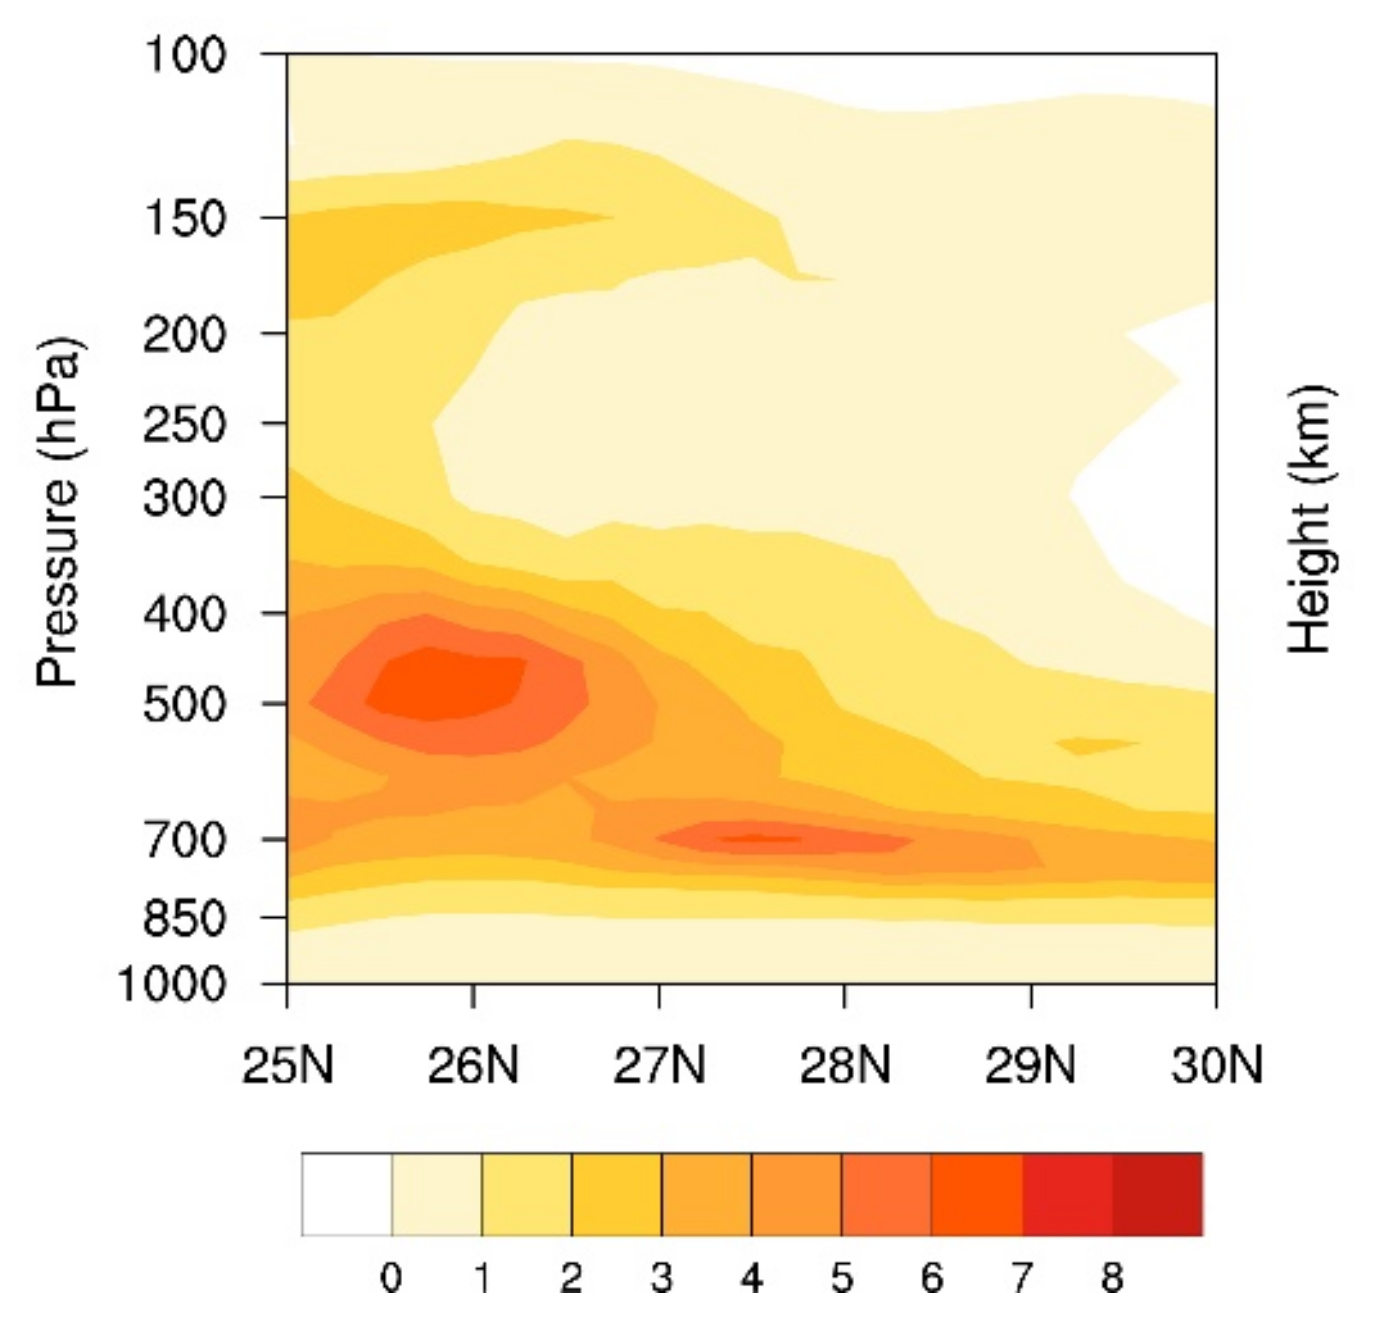
First of all, it can be seen that there is a high-value area between 150 and 200 hPa on the north side of Taiwan Island (Figure 6). This area represents the water vapor carried by the typhoon’s high-level divergent airflow, which can provide sufficient water vapor for the growth of ice crystals by vapor deposition [43].
Additionally, there was an obvious horizontal propagation in this high-value area, extending from 25° N to 28° N, and there was a significant decrease around 28° N, from over 150 hPa to around 200 hPa. At the same time, it can be seen that, at 25° N, there was more than two times the amount of water vapor transport at 150–200 hPa, and, at 26° N, the water vapor transport area was more than six times larger at the height of 500 hPa. This height was near the 0-degree layer, which may provide suitable conditions for the growth of graupel [44,45]. It may also promote multiplication, which is the dominant mechanism for the increase in the concentration of ice-phase particles [44,46]. From 25° N to 30° N, the maximum magnification height of water vapor transport decreased from 500 to 700 hPa, indicating that there was an obvious falling process when water vapor was transported from the east side of Taiwan Island to the north. The abnormal value of water vapor transport below 700 hPa decreased rapidly, because the height below 700 hPa corresponds to the traditional water vapor transport height, and the average value of water vapor transport at this height was very large. Even if the typhoon has a high wind speed, the magnification of the typhoon will not be extremely large. The water vapor conditions in the lower layers were similar, indicating that the collision and merging of the lower layers may be similar to the monsoon precipitation [47,48].
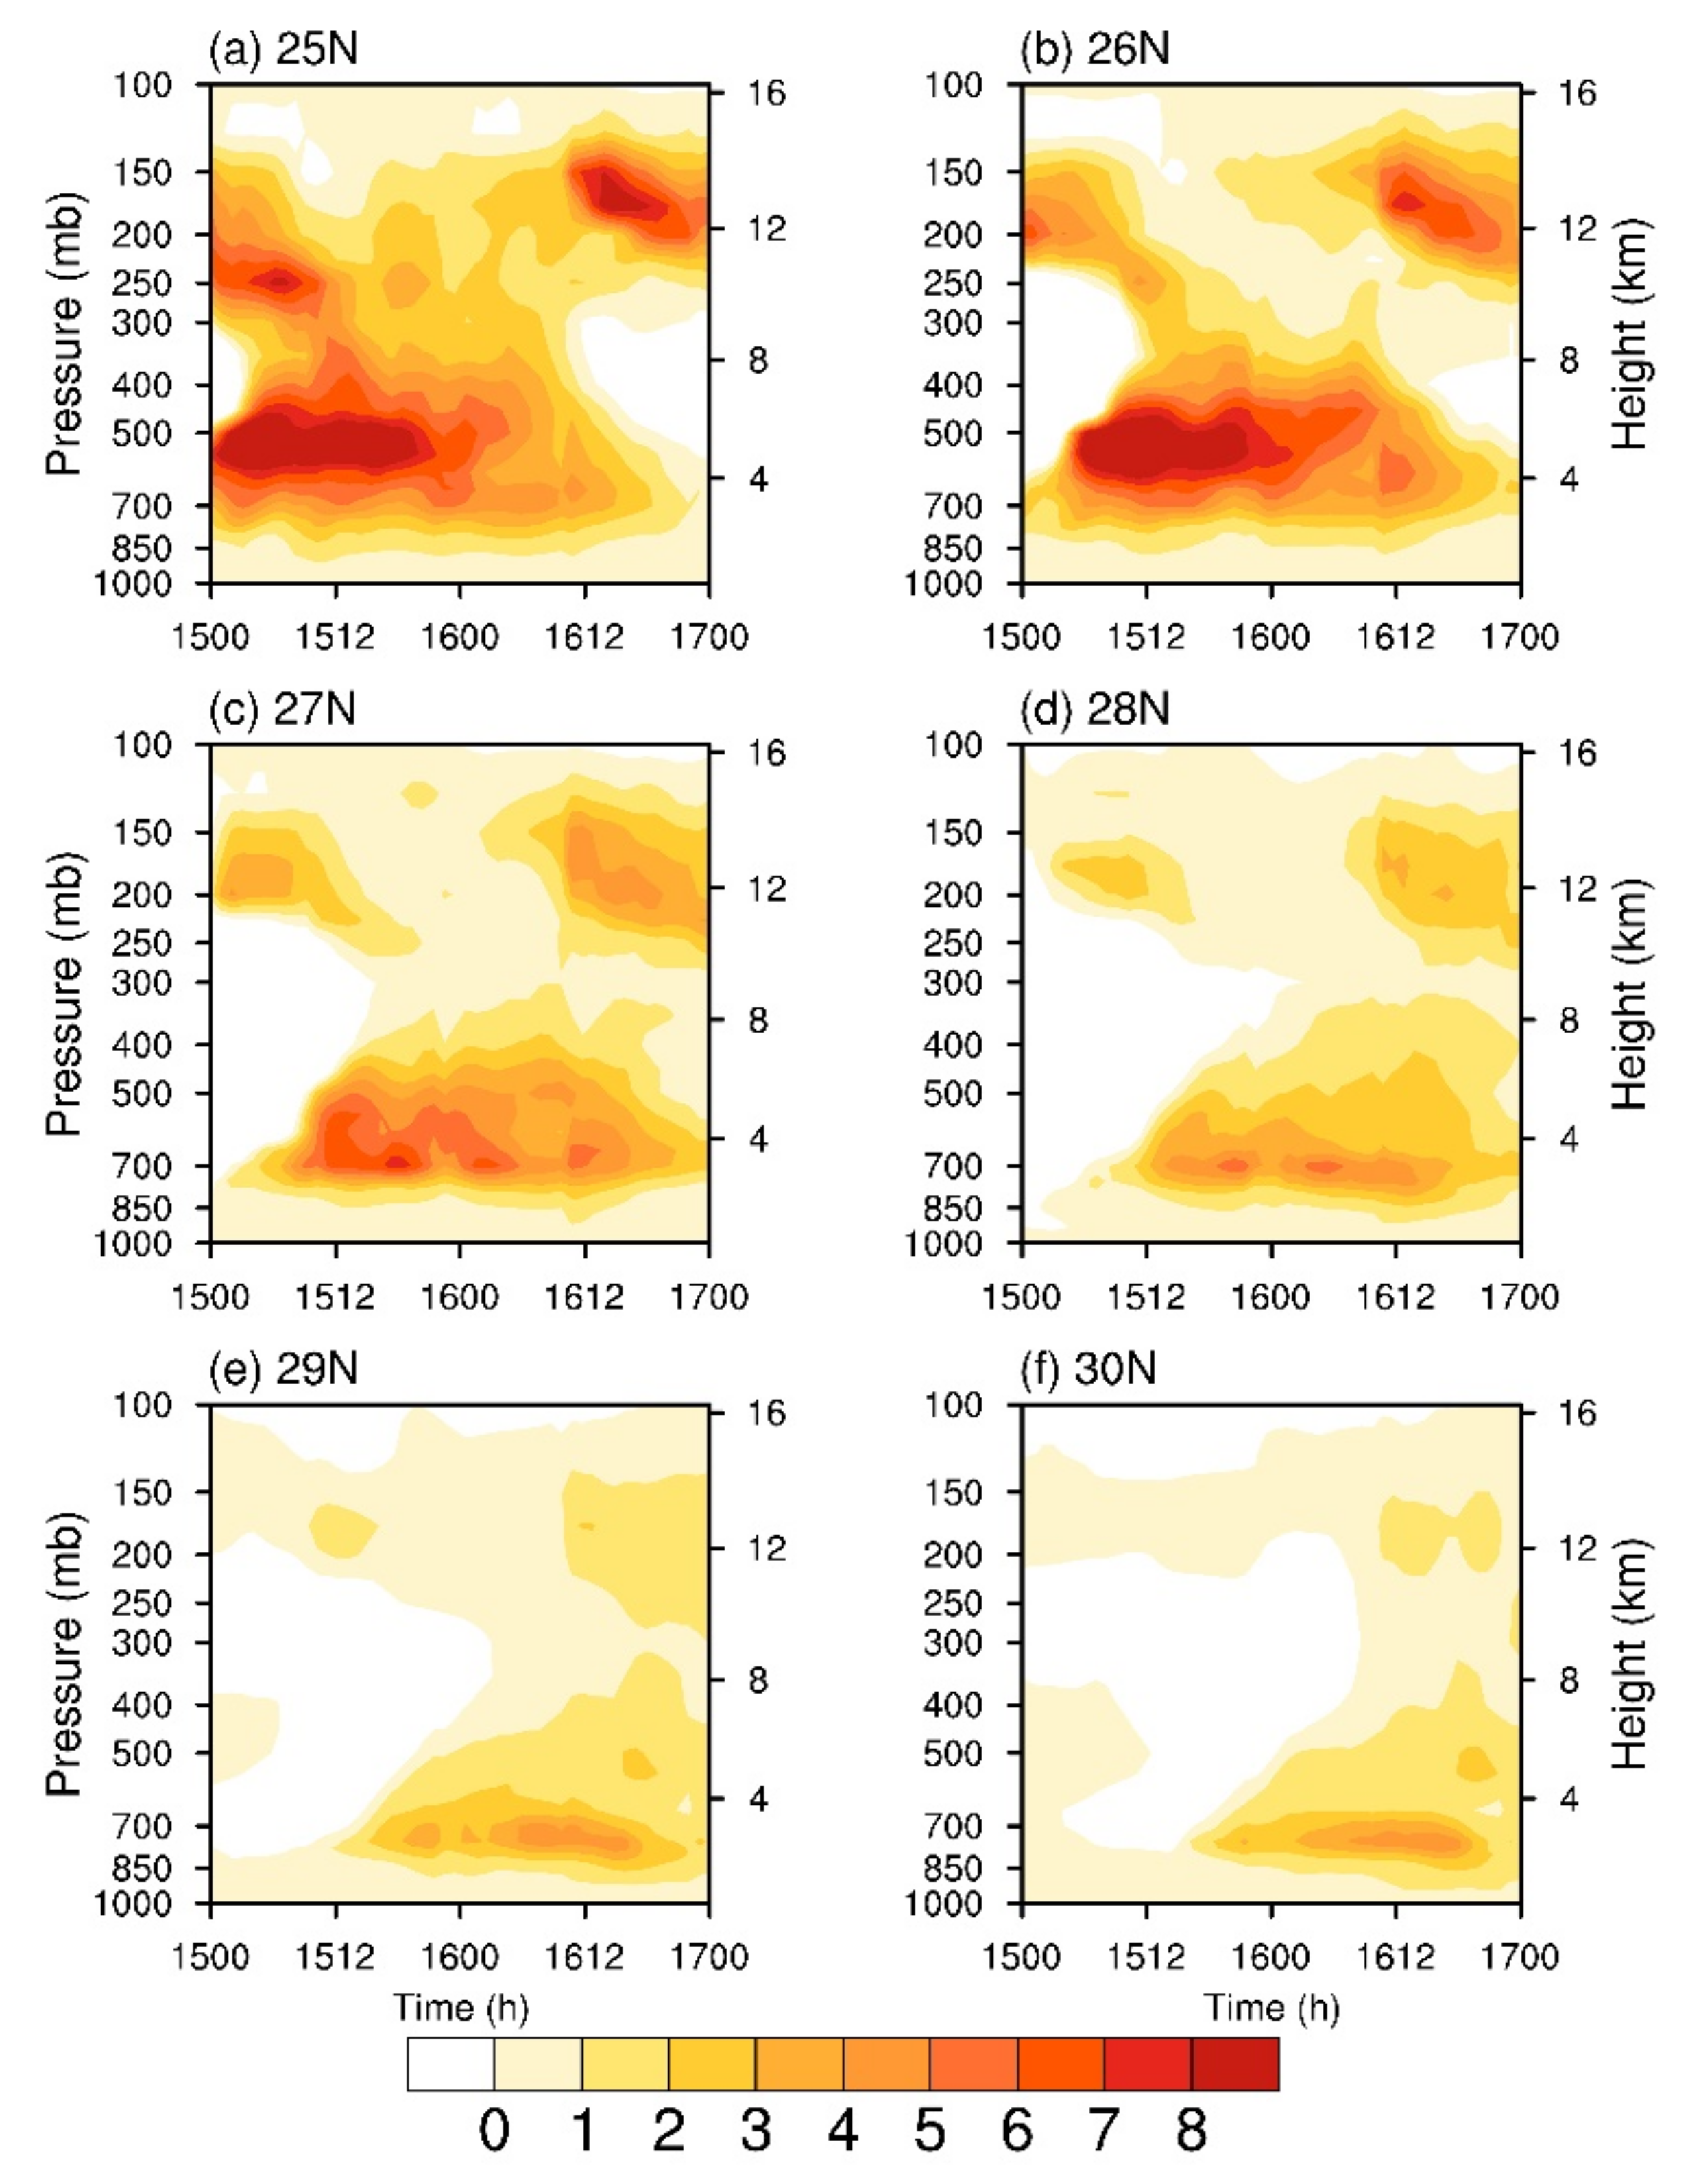
Figure 7 shows the change in water vapor transport over time at 25–30° N. It can be seen that the two graphs for 25° N and 26° N are similar. There was an abnormally large area of water vapor transport around 500 hPa and 200 hPa. The height of the high-rise high-value area gradually decreased with time, and merged with the high-value area of the middle and low layers around 0:00 on the 16 September. At 27° N and 28° N, there were also two-layer high-value areas, but they were obviously much weaker, which was caused by the attenuation of water vapor in the process of transportation to the north. In the last two pictures, the high-level high-value area had almost disappeared, while the low-level high-value area still existed, indicating that the high-level high-value area gradually weakened and fell during the northward transportation. The farthest drop occurred around 29° N, which happens to be the southern boundary of the precipitation area.
The height layers with the largest magnification in Figure 7a,b were around 500 hPa. The height layers with the largest magnification in Figure 7c,d were around 700 hPa. The height layers with the largest magnification in Figure 7e,f were less than 700 hPa. This shows that, with the continuous transportation of water vapor to the north, there was an obvious falling process in the height layer with abnormal water vapor transportation: from 0:00 on the 15 September in Figure 7a (the abnormally high-value area of water vapor transport near 500 hPa), to 6:00 on the 15 September in Figure 7b, then to 12:00 on 15 September in Figure 7d, then, finally, at 0:00 on 16 September in Figure 7f. This shows that there is a time difference in the water vapor transportation from the south to the north. Additionally, as Typhoon Mangkhut gradually moved away, the water vapor transport in each layer gradually weakened after 0:00 on the 16 September.
4. Discussion
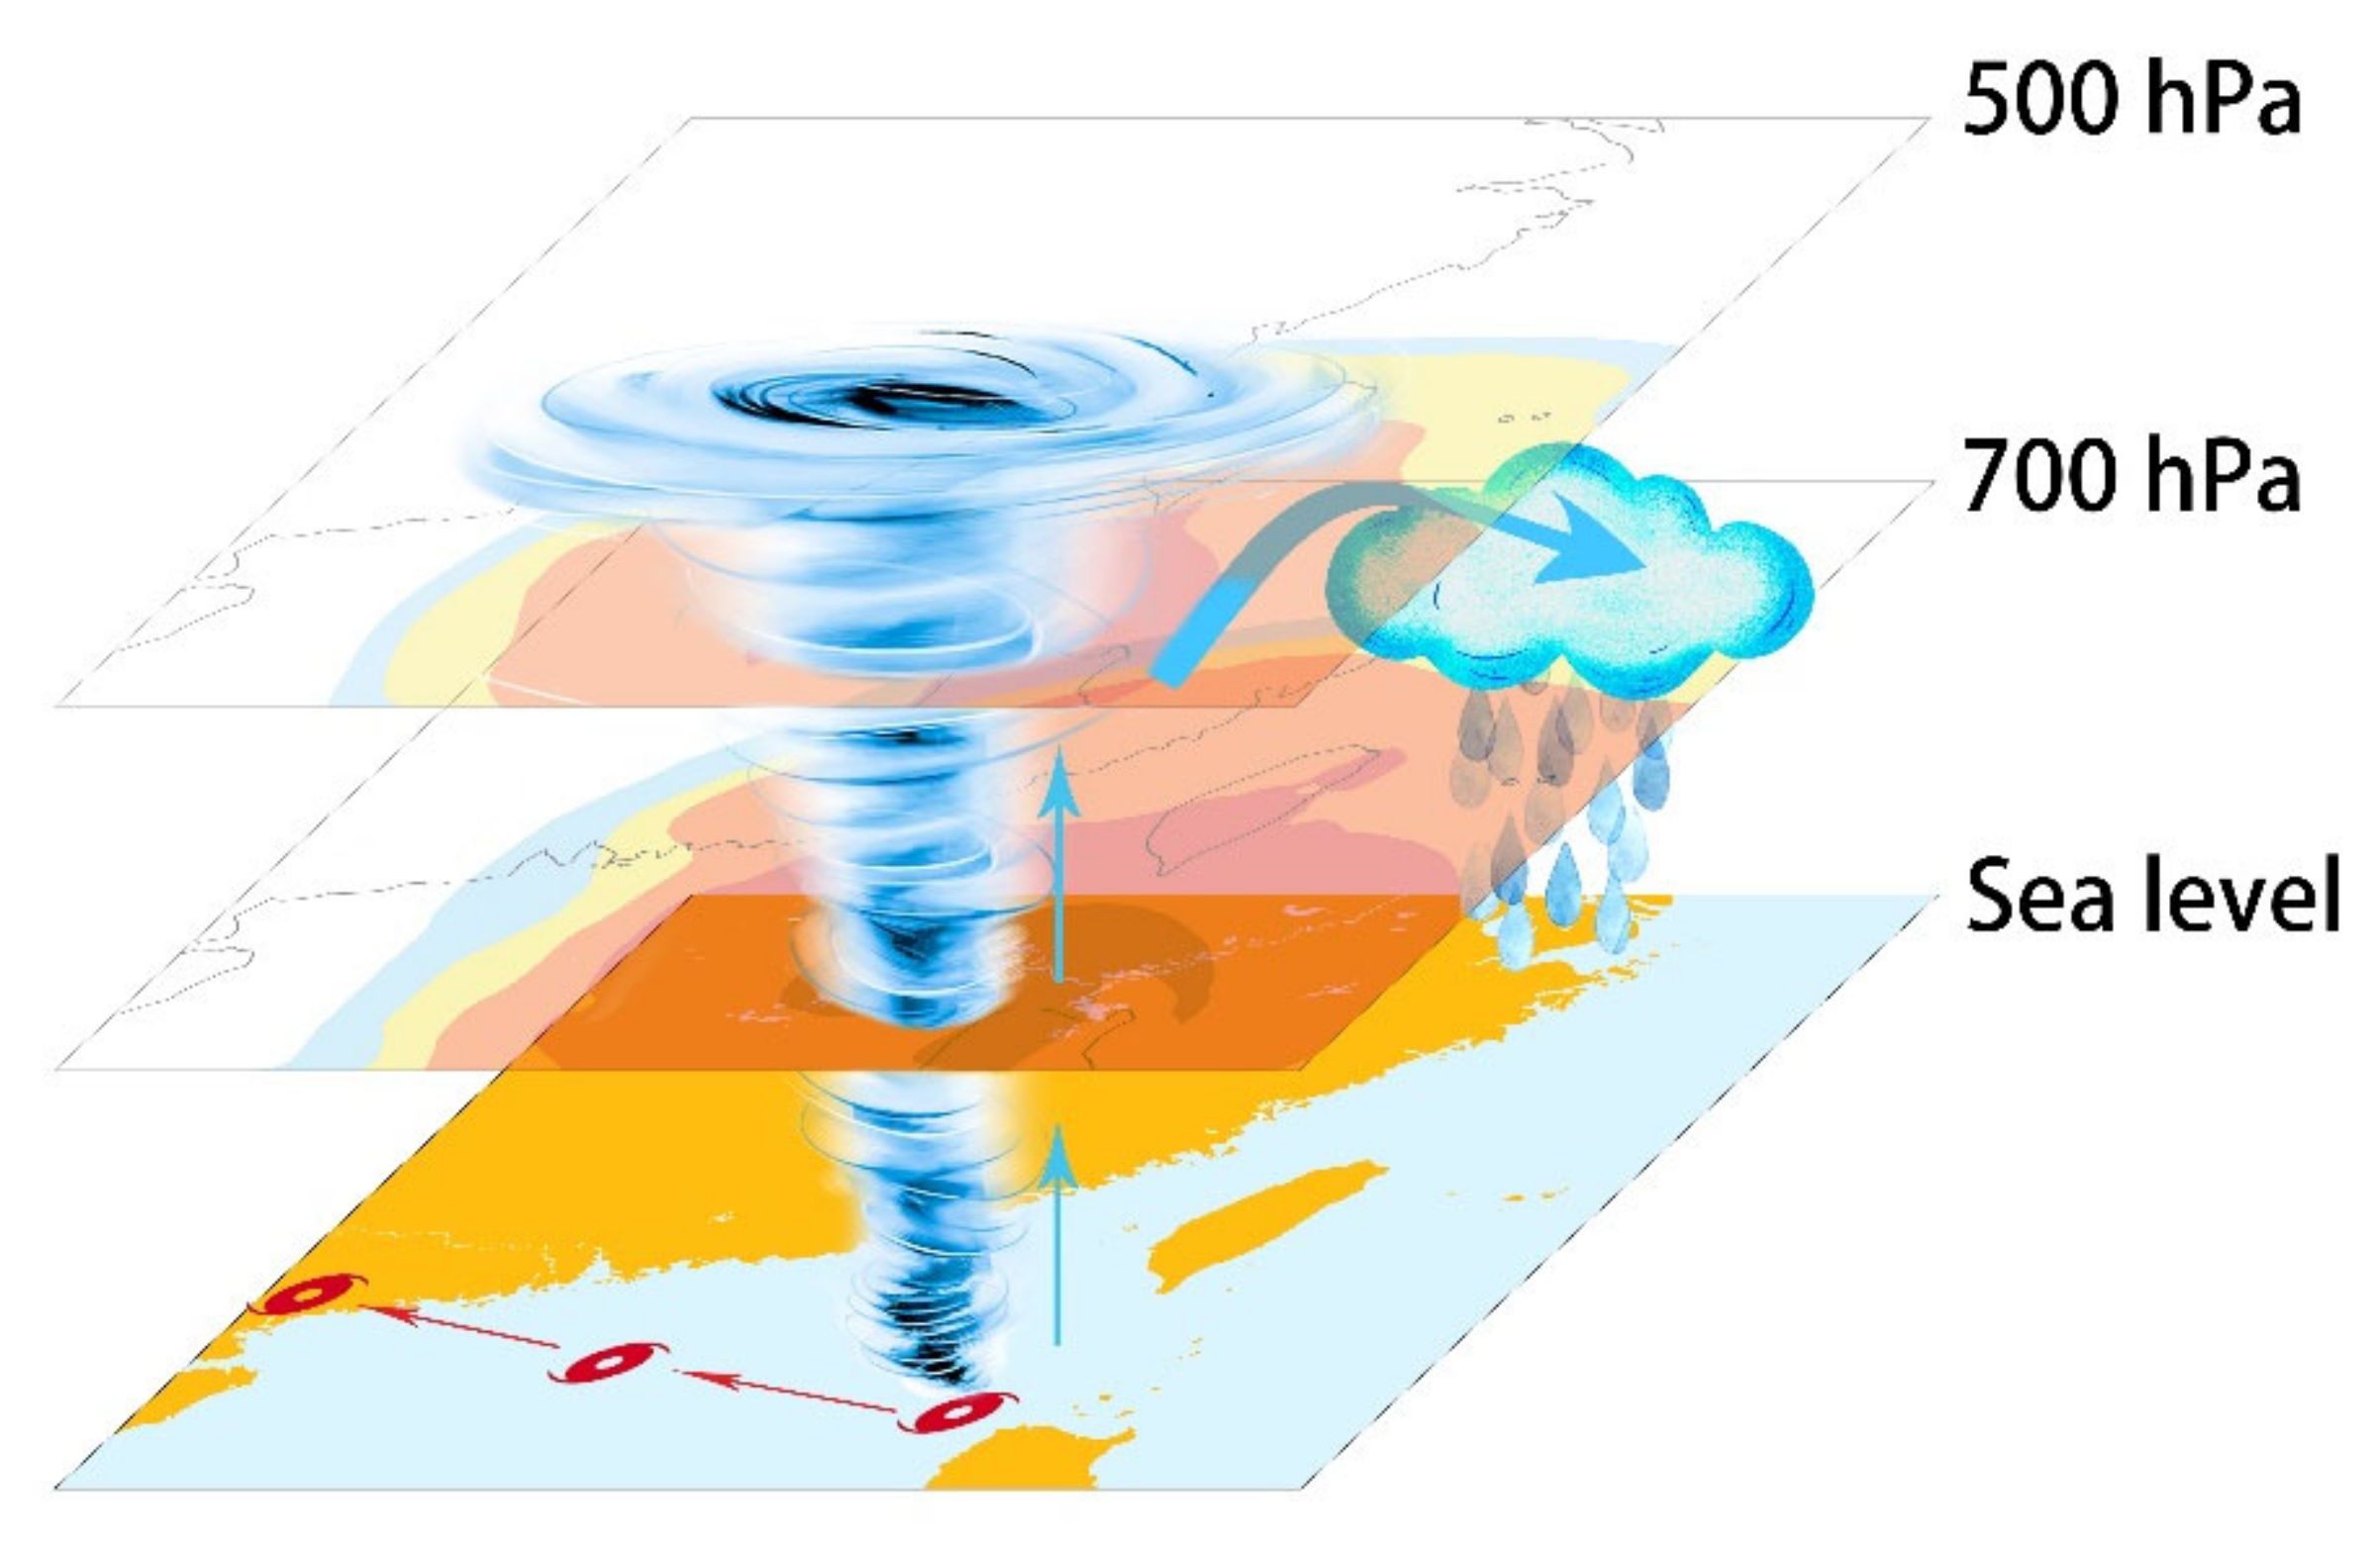
Combining the information of Figure 5, Figure 6 and Figure 7, before the first precipitation maximum that occurred at 12:00 on 16 September, we can observe that there was water vapor transport from the south to the north and, in the water vapor transport channel (that is, the south side of the rainfall area), there was no significant precipitation, indicating that there is a certain trigger mechanism that leads to the occurrence of rainfall after the water vapor transport reaches the rainfall area, but this mechanism does not exist in the water vapor transport channel. Figure 5 shows the differences between the southern boundary of the rainfall area and the water vapor transport channel. It can be observed that the abnormally high-value area of water vapor transport near 200 hPa is very small close to 29° N, which is the southern boundary of the precipitation area, and almost non-existent at 30° N. At the same time, the high-value area of 200 hPa also follows the principle of propagating gradually northward with time. Based on the analysis of the above figure, we drew a conceptual map as shown in the figure below.
Figure 8 shows the movement path of the typhoon, the updraft from the center of the typhoon, the divergent airflow at the upper level of the typhoon, the rainfall cloud clusters in the Yangtze River Delta region, and the water vapor transport of the different layers. It shows that the strong water vapor transport caused by the typhoon eventually triggered the heavy precipitation in the Yangtze River Delta region. Note that this figure does not depict the abnormally high-value area of water vapor transport near 200 hPa, but this does not mean that the abnormal water vapor transport near 200 hPa does not take place during this heavy rain. The abnormal value of water vapor transport has a large magnification near 500 hPa and 200 hPa, and as the height increases, the absolute value of water vapor transport decreases. Although a large magnification appeared near 200 hPa, this abnormal magnification did not exceed eight times. The abnormal magnification near 500 hPa exceeded eight times and lasts longer, indicating that the continuous northward water vapor transport is stronger at 500 hPa. Therefore, we only showed 500 hPa, conveying height, in the figure and did not depict 200 hPa, also conveying height. The reason for the former is its high absolute value, and for the latter is the value of the abnormal magnification being lower than 500 hPa.
First, during this precipitation process, Typhoon Mangkhut provided a large amount of water vapor to the Yangtze River Delta region. Moreover, it can be seen from the vertically integrated moisture divergence that the Yangtze River Delta had a strong water vapor convergence (Figure 4). Second, it is influenced by changes in the underlying surface and surface heating [32]. The airflow was uplifted by the topography after reaching the Yangtze River Delta. Finally, some studies have pointed out that the emission of anthropogenic aerosols in the Yangtze River Delta can provide more condensation nuclei, thereby enhancing precipitation [49]. These points explain why the heavy rainfall anomaly occurs in the Yangtze River Delta rather than in other places.
Studies have confirmed that a typhoon’s updraft and the horizontal advection strength of the middle and upper layers are proportional to the strength and radius of the typhoon [8]. Typhoon Mangkhut is recognized as a large and strong typhoon. It reached a super typhoon intensity in the ocean east of the Philippines. After entering the South China Sea, the diameter of the Category 7 wind circle exceeded 1000 km. Therefore, it had a strong updraft and horizontal advection in the middle and upper layers, which is consistent with our research. This shows that there was a strong uplift in the center, and as well as a strong radial airflow that was able to remove the water vapor in the upper layer and thus spread outward. This increase in water vapor is conducive to the formation of ice crystals [44,50].
Figure 6 and Figure 7 show that the typhoon water tower has two water vapor heights, 150–200 hPa and 500–700 hPa. Water vapor at a transport height of 150–200 hPa promotes the nucleation and deposition of ice particles. The water vapor at the height of 500–700 hPa promotes the riming or ice multiplication of ice crystals near the frozen layer with the cooperation of the rising movement of the land. The transport in the upper layer is responsible for the generation of precipitation particles, and the transport in the middle layer is responsible for their rapid development [51]. This is very different from the increase in the coalescence of droplets promoted by the traditional monsoon lower-level water vapor transport [52,53].
Atlas et al. [9,51] describe how high-level ice particles are generated and eventually fall, leading to precipitation. Considering the movement of the mid-to-high cloud system and the transport of water vapor in the lower layers, the precipitation enhancement method of this event is similar to the “seeder-feeder” mechanism [9]. Typhoons provide high-level ice crystals and low-level water vapor transport. Although this theory, based on the research of Houze et al. [50], is usually used to explain the flow of air up a hill, we speculate that typhoons can form a strong water vapor conveyor belt in the upper layer, promote the nucleation and deposition of ice crystals, and release latent heat to lift the ice crystals. When the water vapor transport is sufficiently far from the typhoon, the water vapor transport weakens, the particles no longer grow, and the latent heat is not released; consequently, the upward movement of the upper layer is weakened and the particles gradually fall.
5. Conclusions
Through a combined analysis of satellite observation, sounding, and reanalysis data, we investigated the meteorological triggers of the 2018 Yangtze River Delta rainstorm event. We focused on the observation of the abnormal values of water vapor transport of different layers caused by Typhoon Mangkhut, an approach that differs from previous studies on this rainstorm event in terms of low-level water vapor transport, cold air intrusion from the north, and high-level jet enhancement and divergence. The focus of our research is crucial for the forecast of heavy rain. The main conclusions of this work are as follows:
- The factor triggering this typhoon’s long-distance heavy rain was the high-level water vapor transport on the east side of Taiwan Island caused by Typhoon Mangkhut, which spread northward under the influence of the typhoon’s high-level divergent airflow, and gradually formed this long-distance heavy rainfall. At the same time, the outer wind field of Typhoon Mangkhut produced a low-level jet of 700 hPa, which provided sufficient water vapor and momentum for the formation of heavy precipitation.
- With the continuous transportation of water vapor from the upper layer to the north, precipitation in the Yangtze River Delta region gradually increased, and the layered precipitation played a major role in this event. Convective precipitation played a secondary role.
- The upper layer of the typhoon maintained the outward jet for a long time. The strong updraft in the center of the typhoon played a role in this event, and the continued support of the typhoon’s peripheral circulation also played a role. Under their combined action, the high-altitude water vapor maintained horizontal transport for a long time.
- A typhoon water tower has two conveying heights, 150–200 hPa and 500–700 hPa. The high-level transport is responsible for the generation of precipitation particles, and the middle-level transport is responsible for their rapid development. This is very different from the increase in the coalescence of droplets promoted by traditional monsoon lower-level water vapor transport.
There is still a lot of work that can be conducted in this research field. For example, there has been no in-depth study on the microphysical mechanism of the rainfall itself, and no modeling methods have been used to restore the current rainfall process and simulate future rainfall patterns. With global warming, the temperature of the sea surface is increasing year by year. As heat engines, typhoons may develop to be higher and stronger. This will produce stronger upper-level water vapor transport anomalies, and the increase in upper-level water vapor may cause more local heavy precipitation. Scientists need to carry out more research in this regard.
Author Contributions
Conceptualization, H.Z. and W.L.; methodology, Y.C.; software, A.Z.; validation, S.C.; formal analysis, Y.C.; investigation, W.L.; resources, H.Z. and Y.C.; data curation, A.Z.; writing—original draft preparation, H.Z.; writing—review and editing, Y.C. and S.C.; visualization, H.Z.; supervision, W.L.; project administration, W.L.; funding acquisition, W.L. All authors have read and agreed to the published version of the manuscript.
Funding
This work was funded by the Guangdong Major Project of Basic and Applied Basic Research (grant number 2020B0301030004), National Natural Science Foundation of China (grant numbers 42105068, 42075004 and 42005062), and the Innovation Group Project of Southern Marine Science and Engineering Guangdong Laboratory (Zhuhai) (grant number 311021009).
Institutional Review Board Statement
The authors declare that they have no known competing financial interests or personal relationships that could have appeared to influence the work reported in this paper.
Informed Consent Statement
Informed consent was obtained from all subjects involved in the study.
Data Availability Statement
The GPM data are available at https://disc.gsfc.nasa.gov/datasets/GPM_3IMERGHHE_06/summary?keywords=GPM_3IMERGHH_06 (accessed on 29 March 2022). The ERA5 data are available at https://cds.climate.copernicus.eu/ (accessed on 29 March 2022).
Conflicts of Interest
The authors declare no conflict of interest.
References
- Ades, M.; Adler, R.; Aldeco, L.S.; Alejandra, G.; Alfaro, E.J.; Aliaga-Nestares, V.; Allan, R.P.; Allan, R.; Alves, L.M.; Amado, J.A.; et al. State of the climate in 2018. Bull. Am. Meteorol. Soc. 2019, 100, SI-S305. [Google Scholar]
- Fumin, R.; Gleason, B.; Easterling, D. Typhoon Impacts on China’s Precipitation during 1957–1996. Adv. Atmos. Sci. 2002, 19, 943–952. [Google Scholar] [CrossRef]
- Kunkel, K.E.; Easterling, D.R.; Kristovich, D.A.; Gleason, B.; Stoecker, L.; Smith, R. Recent increases in U.S. heavy precipitation associated with tropical cyclones. Geophys. Res. Lett. 2010, 37, 24. [Google Scholar] [CrossRef]
- Houze, R.A. Clouds and precipitation in tropical cyclones. Int. Geophys. 2014, 104, 287–327. [Google Scholar]
- Chen, Y.; Zhai, P. Persistent extreme precipitation events in China during 1951–2010. Clim. Res. 2013, 57, 143–153. [Google Scholar] [CrossRef] [Green Version]
- Khouakhi, A.; Villarini, G.; Vecchi, G.A. Contribution of tropical cyclones to rainfall at the global scale. J. Clim. 2017, 30, 359–372. [Google Scholar] [CrossRef]
- Lau, W.K.M.; Zhou, Y.P. Observed recent trends in tropical cyclone rainfall over the North Atlantic and the North Pacific. J. Geophys. Res. Atmos. 2012, 117, 3. [Google Scholar] [CrossRef]
- Didlake, A.C., Jr.; Houze, R.A., Jr. Convective-scale variations in the inner-core rainbands of a tropical cyclone. J. Atmos. Sci. 2013, 70, 504–523. [Google Scholar] [CrossRef] [Green Version]
- Didlake, A.C.; Houze, R.A. Dynamics of the stratiform sector of a tropical cyclone rainband. J. Atmos. Sci. 2013, 70, 1891–1911. [Google Scholar] [CrossRef]
- Wang, Y.M.; Ren, F.; Li, W.; Wang, X. Climatic Characteristics of Typhoon Precipitation over China. J. Trop. Meteorol. 2008, 14, 125–128. [Google Scholar]
- Galarneau, T.J., Jr.; Bosart, L.F.; Schumacher, R.S.J.M.W.R. Predecessor rain events ahead of tropical cyclones. Mon. Weather. Rev. 2010, 138, 3272–3297. [Google Scholar] [CrossRef] [Green Version]
- Chen, J.; Ren, F.; Li, W.; Wang, X. Topographic Influence of Taiwan Island Island on Typhoon “Matmo”. Chin. J. Atmos. Sci. 2017, 41, 1037–1058. [Google Scholar]
- Ge, X.; Li, T.; Zhang, S.; Peng, M. What causes the extremely heavy rainfall in Taiwan Island during Typhoon Morakot (2009)? Atmos. Sci. Lett. 2010, 11, 46–50. [Google Scholar]
- Jiang, X.; Ren, F.; Li, Y.; Qiu, W.; Ma, Z.; Cai, Q. Characteristics and Preliminary Causes of Tropical Cyclone Extreme Rainfall Events over Hainan Island. Adv. Atmos. Sci. 2018, 35, 580–591. [Google Scholar] [CrossRef]
- Liu, W.; Zhu, P. The Initiation and Development of Convective Rainbands to the North of the Landfalling Typhoon Matmo (2014). Chin. J. Atmos. Sci. 2018, 42, 1038–1054. [Google Scholar]
- Pan, J.; Zhou, L.; Lu, W.; Luo, L.; Zhai, G. Comparative Analyses of Mechanisms and Energy Budgets of Local Extreme Rainfall Events Caused by Remnant Clouds of Two Typhoons with Similar Tracks. Chin. J. Atmos. Sci. 2019, 43, 1399–1412. [Google Scholar]
- Chen, T.C.; Wang, S.-Y.; Huang, W.-R.; Yen, M.-C. Variation of the East Asian summer monsoon rainfall. J. Clim. 2004, 17, 744–762. [Google Scholar] [CrossRef]
- Chen, S.; Li, Y.; Fan, Y.; Xu, Z.; Li, F. Analysis of Long-Distance Heavy Rainfall Caused by Typhoon Mangosteen (2018). Chin. J. Atmos. Sci. 2021, 45, 573–587. [Google Scholar]
- Yan, L.; Zhou, Y.; Wang, Y. Analysis on Different Characteristics and Causes of Precipitation Distribution during the Landing of Typhoon “Soudelor” (1513) and Typhoon “Matmo” (1410) with Similar Tracks. Chin. J. Atmos. Sci. 2019, 43, 297–310. [Google Scholar]
- Zhang, Q.; Gu, X.; Li, J.; Shi, P.; Singh, V.P. The impact of tropical cyclones on extreme precipitation over coastal and Inland Areas of China and its association to ENSO. J. Clim. 2018, 31, 1865–1880. [Google Scholar] [CrossRef]
- Xue, Y.; Cui, X. Moisture Sources and Quantitative Analyses of Source Contributions of Precipitation Associated with Rammasun (1409). Chin. J. Atmos. Sci. 2020, 44, 341–355. [Google Scholar]
- Wang, G.; Lan, H.; Liu, Z. Stable isotope record of super typhoon Lekima (2019). Atmos. Res. 2021, 264, 105822. [Google Scholar] [CrossRef]
- Bu, S.; Li, Y. Comparative Analysis of Precipitation Distributions of Tropical Cyclones Making Landfall in East China. Chin. J. Atmos. Sci. 2020, 44, 27–38. [Google Scholar]
- Saito, K.; Matsunobu, T. Northward Ageostrophic Winds Associated with a Tropical Cyclone. Part 2: Moisture Transport and Its Impact on PRE. Sci. Online Lett. Atmos. 2020, 16, 198–205. [Google Scholar] [CrossRef]
- Han, B.; Du, Y.; Wu, C.; Liu, X. Microphysical characteristics of the coexisting frontal and warm-sector heavy rainfall in South China. J. Geophys. Res. Atmos. 2021, 126, e2021JD035446. [Google Scholar] [CrossRef]
- Liu, X.; Wang, Q.; Liu, C.; He, Y.; Wang, S.; Hou, P.; Zhu, X.; Wu, Z. Wind Field Reconstruction and Analysis of Super Typhoon Mangkhut (1822). J. Coast. Res. 2020, 99 (Suppl. 1), 151–157. [Google Scholar] [CrossRef]
- He, Y.C.; He, J.; Chen, W.; Chan, P.; Fu, J.; Li, Q. Insights from Super Typhoon Mangkhut (1822) for wind engineering practices. J. Wind. Eng. Ind. Aerodyn. 2020, 117, 104238. [Google Scholar] [CrossRef]
- Choy, C.W.; Lau, D.S.; He, Y. Super typhoons Hato (1713) and Mangkhut (1822), part I: Analysis of maximum intensity and wind structure. Weather 2020, 1–6. [Google Scholar] [CrossRef]
- Lo, H.S.; Lee, Y.-K.; Po, B.H.-K.; Wong, L.-C.; Xu, X.; Wong, C.-F.; Wong, C.-Y.; Tam, N.F.-Y.; Cheung, S.-G. Impacts of Typhoon Mangkhut in 2018 on the deposition of marine debris and microplastics on beaches in Hong Kong. Sci. Total Environ. 2020, 716, 137172. [Google Scholar] [CrossRef]
- Yang, J.; Li, L.; Zhao, K.; Wang, P.; Wang, D.; Sou, I.M.; Yang, Z.; Hu, J.; Tang, X.; Mok, K.M.; et al. A Comparative Study of Typhoon Hato (2017) and Typhoon Mangkhut (2018)—Their Impacts on Coastal Inundation in Macau. J. Geophys. Res. Ocean. 2019, 124, 9590–9619. [Google Scholar] [CrossRef]
- Liu, L.S.; Lv, X.Y.; Gao, S.Z. Overview of typhoon activity in the Northwest Pacific and South China Sea in 2018. J. Mar. Meteorol. 2019, 39, 1–12. [Google Scholar]
- Huffman, G.J.; Bolvin, D.T.; Nelkin, E.J.; Wolff, D.B.; Adler, R.F.; Gu, G.; Hong, Y.; Bowman, K.P.; Stocker, E.F. The TRMM Multisatellite Precipitation Analysis (TMPA): Quasi-global, multiyear, combined-sensor precipitation estimates at fine scales. J. Hydrometeorol. 2007, 8, 38–55. [Google Scholar] [CrossRef]
- Tang, G.Q.; Ma, Y.; Long, D.; Zhong, L.; Hong, Y. Evaluation of GPM Day-1 IMERG and TMPA Version-7 legacy products over Mainland China at multiple spatiotemporal scales. J. Hydrol. 2016, 533, 152–167. [Google Scholar] [CrossRef]
- Siuki, S.K.; Saghafian, B.; Moazami, S. Comprehensive evaluation of 3-hourly TRMM and half-hourly GPM-IMERG satellite precipitation products. Int. J. Remote Sens. 2017, 38, 558–571. [Google Scholar] [CrossRef]
- Sharifi, E.; Steinacker, R.; Saghafian, B. Assessment of GPM-IMERG and Other Precipitation Products against Gauge Data under Different Topographic and Climatic Conditions in Iran: Preliminary Results. Remote Sens. 2016, 8, 135. [Google Scholar] [CrossRef] [Green Version]
- Yu, C.; Hu, D.; Di, Y.; Wang, Y. Performance evaluation of IMERG precipitation products during typhoon Lekima (2019). J. Hydrol. 2021, 597, 126307. [Google Scholar] [CrossRef]
- Qian, W.H. Physical decomposition principle of regional-scale atmospheric transient anomaly. Chinese J. Geophys. 2012, 55, 1439–1448. (In Chinese) [Google Scholar] [CrossRef]
- Yu, J.Q.; Gao, S.; Zhang, L.; Shen, X.; Guo, L. Analysis of A Remote Rainstorm in the Yangtze River Delta Region Caused by Typhoon Mangkhut (2018). J. Mar. Sci. Eng. 2020, 8, 345. [Google Scholar] [CrossRef]
- Lavers, D.A.; Ralph, F.M.; Waliser, D.E.; Gershunov, A.; Dettinger, M.D. Climate change intensification of horizontal water vapor transport in CMIP5. Geophys. Res. Lett. 2015, 42, 5617–5625. [Google Scholar] [CrossRef] [Green Version]
- Kudo, T.; Kawamura, R.; Hirata, H.; Ichiyanagi, K.; Tanoue, M.; Yoshimura, K. Large-scale vapor transport of remotely evaporated seawater by a Rossby wave response to typhoon forcing during the Baiu/Meiyu season as revealed by the JRA-55 reanalysis. J. Geophys. Res. Atmos. 2014, 119, 8825–8838. [Google Scholar] [CrossRef]
- Zhao, Y.; Deng, L.; Li, Z.; Wang, Y. Quantitative Attribution of Vertical Motion Responsible for Summer Heavy Rainfall Over North China. J. Geophys. Res. Atmos. 2022, 127, e2021JD035765. [Google Scholar] [CrossRef]
- Nie, Y.; Sun, J. Moisture Sources and Transport for Extreme Precipitation over Henan in July 2021. Geophys. Res. Lett. 2022, 49, e2021GL097446. [Google Scholar] [CrossRef]
- Rutledge, S.A.; Hobbs, P.V. The mesoscale and microscale structure and organization of clouds and precipitation in midlatitude cyclones. XII. A diagnostic modeling study of precipitation development in narrow cold-frontal rainbands. J. Atmos. Sci. 1984, 41, 2949–2972. [Google Scholar] [CrossRef]
- Houze, R.A., Jr. Cloud dynamics. Cloud Dyn. 1993, 3, 47–76. [Google Scholar]
- Zhang, Y.; Zheng, H.; Zhang, L.; Huang, Y.; Liu, X.; Wu, Z. Assessing the Effect of Riming on Snow Microphysics: The First Observational Study in East China. J. Geophys. Res. Atmos. 2021, 126, e2020JD033763. [Google Scholar] [CrossRef]
- Lawson, R.P.; Woods, S.; Morrison, H. The Microphysics of Ice and Precipitation Development in Tropical Cumulus Clouds. J. Atmos. Sci. 2015, 72, 2429–2445. [Google Scholar] [CrossRef] [Green Version]
- Karki, R.; Hasson, S.U.; Gerlitz, L.; Talchabhadel, R.; Schenk, E.; Schickhoff, U.; Scholten, T.; Böhner, J. WRF-based simulation of an extreme precipitation event over the Central Himalayas: Atmospheric mechanisms and their representation by microphysics parameterization schemes. Atmos. Res. 2018, 214, 21–35. [Google Scholar] [CrossRef]
- Zhou, T.J.; Yu, R.C. Atmospheric water vapor transport associated with typical anomalous summer rainfall patterns in China. J. Geophys. Res. Atmos. 2005, 110, 8. [Google Scholar] [CrossRef] [Green Version]
- Zhang, D.Q.; Xu, C.; Duan, J.; Wang, Y.; Du, J.; Zha, S.; Leng, C.; Li, X.; Cheng, T.; Tao, J.; et al. Inter-Annual Variations of Cloud and Precipitation and Their Possible Relationships with Surface Aerosols in Shanghai. Aerosol Air Qual. Res. 2015, 15, 1367–1379. [Google Scholar] [CrossRef] [Green Version]
- Schoeberl, M.R.; Jensen, E.J.; Pfister, L.; Ueyama, R.; Avery, M.; Dessler, A.E. Convective Hydration of the Upper Troposphere and Lower Stratosphere. J. Geophys. Res. Atmos. 2018, 123, 4583–4593. [Google Scholar] [CrossRef]
- Chen, Y.; Zhang, A.; Zhang, Y.; Cui, C.; Wan, R.; Wang, B.; Fu, Y. A Heavy Precipitation Event in the Yangtze River Basin Led by an Eastward Moving Tibetan Plateau Cloud System in the Summer of 2016. J. Geophys. Res. Atmos. 2020, 125, e2020JD032429. [Google Scholar] [CrossRef]
- Prakash, P. Mechanisms of precipitation initiation in convective clouds around Delhi-a radar study. Indian J. Radio Space Phys. 1998, 27, 7–10. [Google Scholar]
- Zhang, W.G.; Xu, G.; Xi, B.; Ren, J.; Wan, X.; Zhou, L.; Cui, C.; Wu, D. Comparative Study of Cloud Liquid Water and Rain Liquid Water Obtained From Microwave Radiometer and Micro Rain Radar Observations Over Central China During the Monsoon. J. Geophys. Res. Atmos. 2020, 125, e2020JD032456. [Google Scholar] [CrossRef]
Figure 1.
The distribution of the daily precipitation on 16 September 2018 and the intensity curve of the average hourly rainfall in area B from 0 to 24 UTC on 16 September 2018. (a) The distribution of the daily precipitation on 16 September 2018. A stands for the Pearl River Delta, B stands for the Yangtze River Delta and C stands for the water vapor transport channel. (b) the intensity curve of the average hourly rainfall in area B from 0 to 24 UTC on 16 September 2018.

Figure 2.
The 500 hPa geopotential height and wind from 0 to 18 UTC on 16 September 2018. (a) 0000 16 September, (b) 0600 16 September, (c) 1200 16 September and (d) 1800 16 September. A stands for the Pearl River Delta, B stands for the Yangtze River Delta and C stands for the water vapor transport channel.

Figure 3.
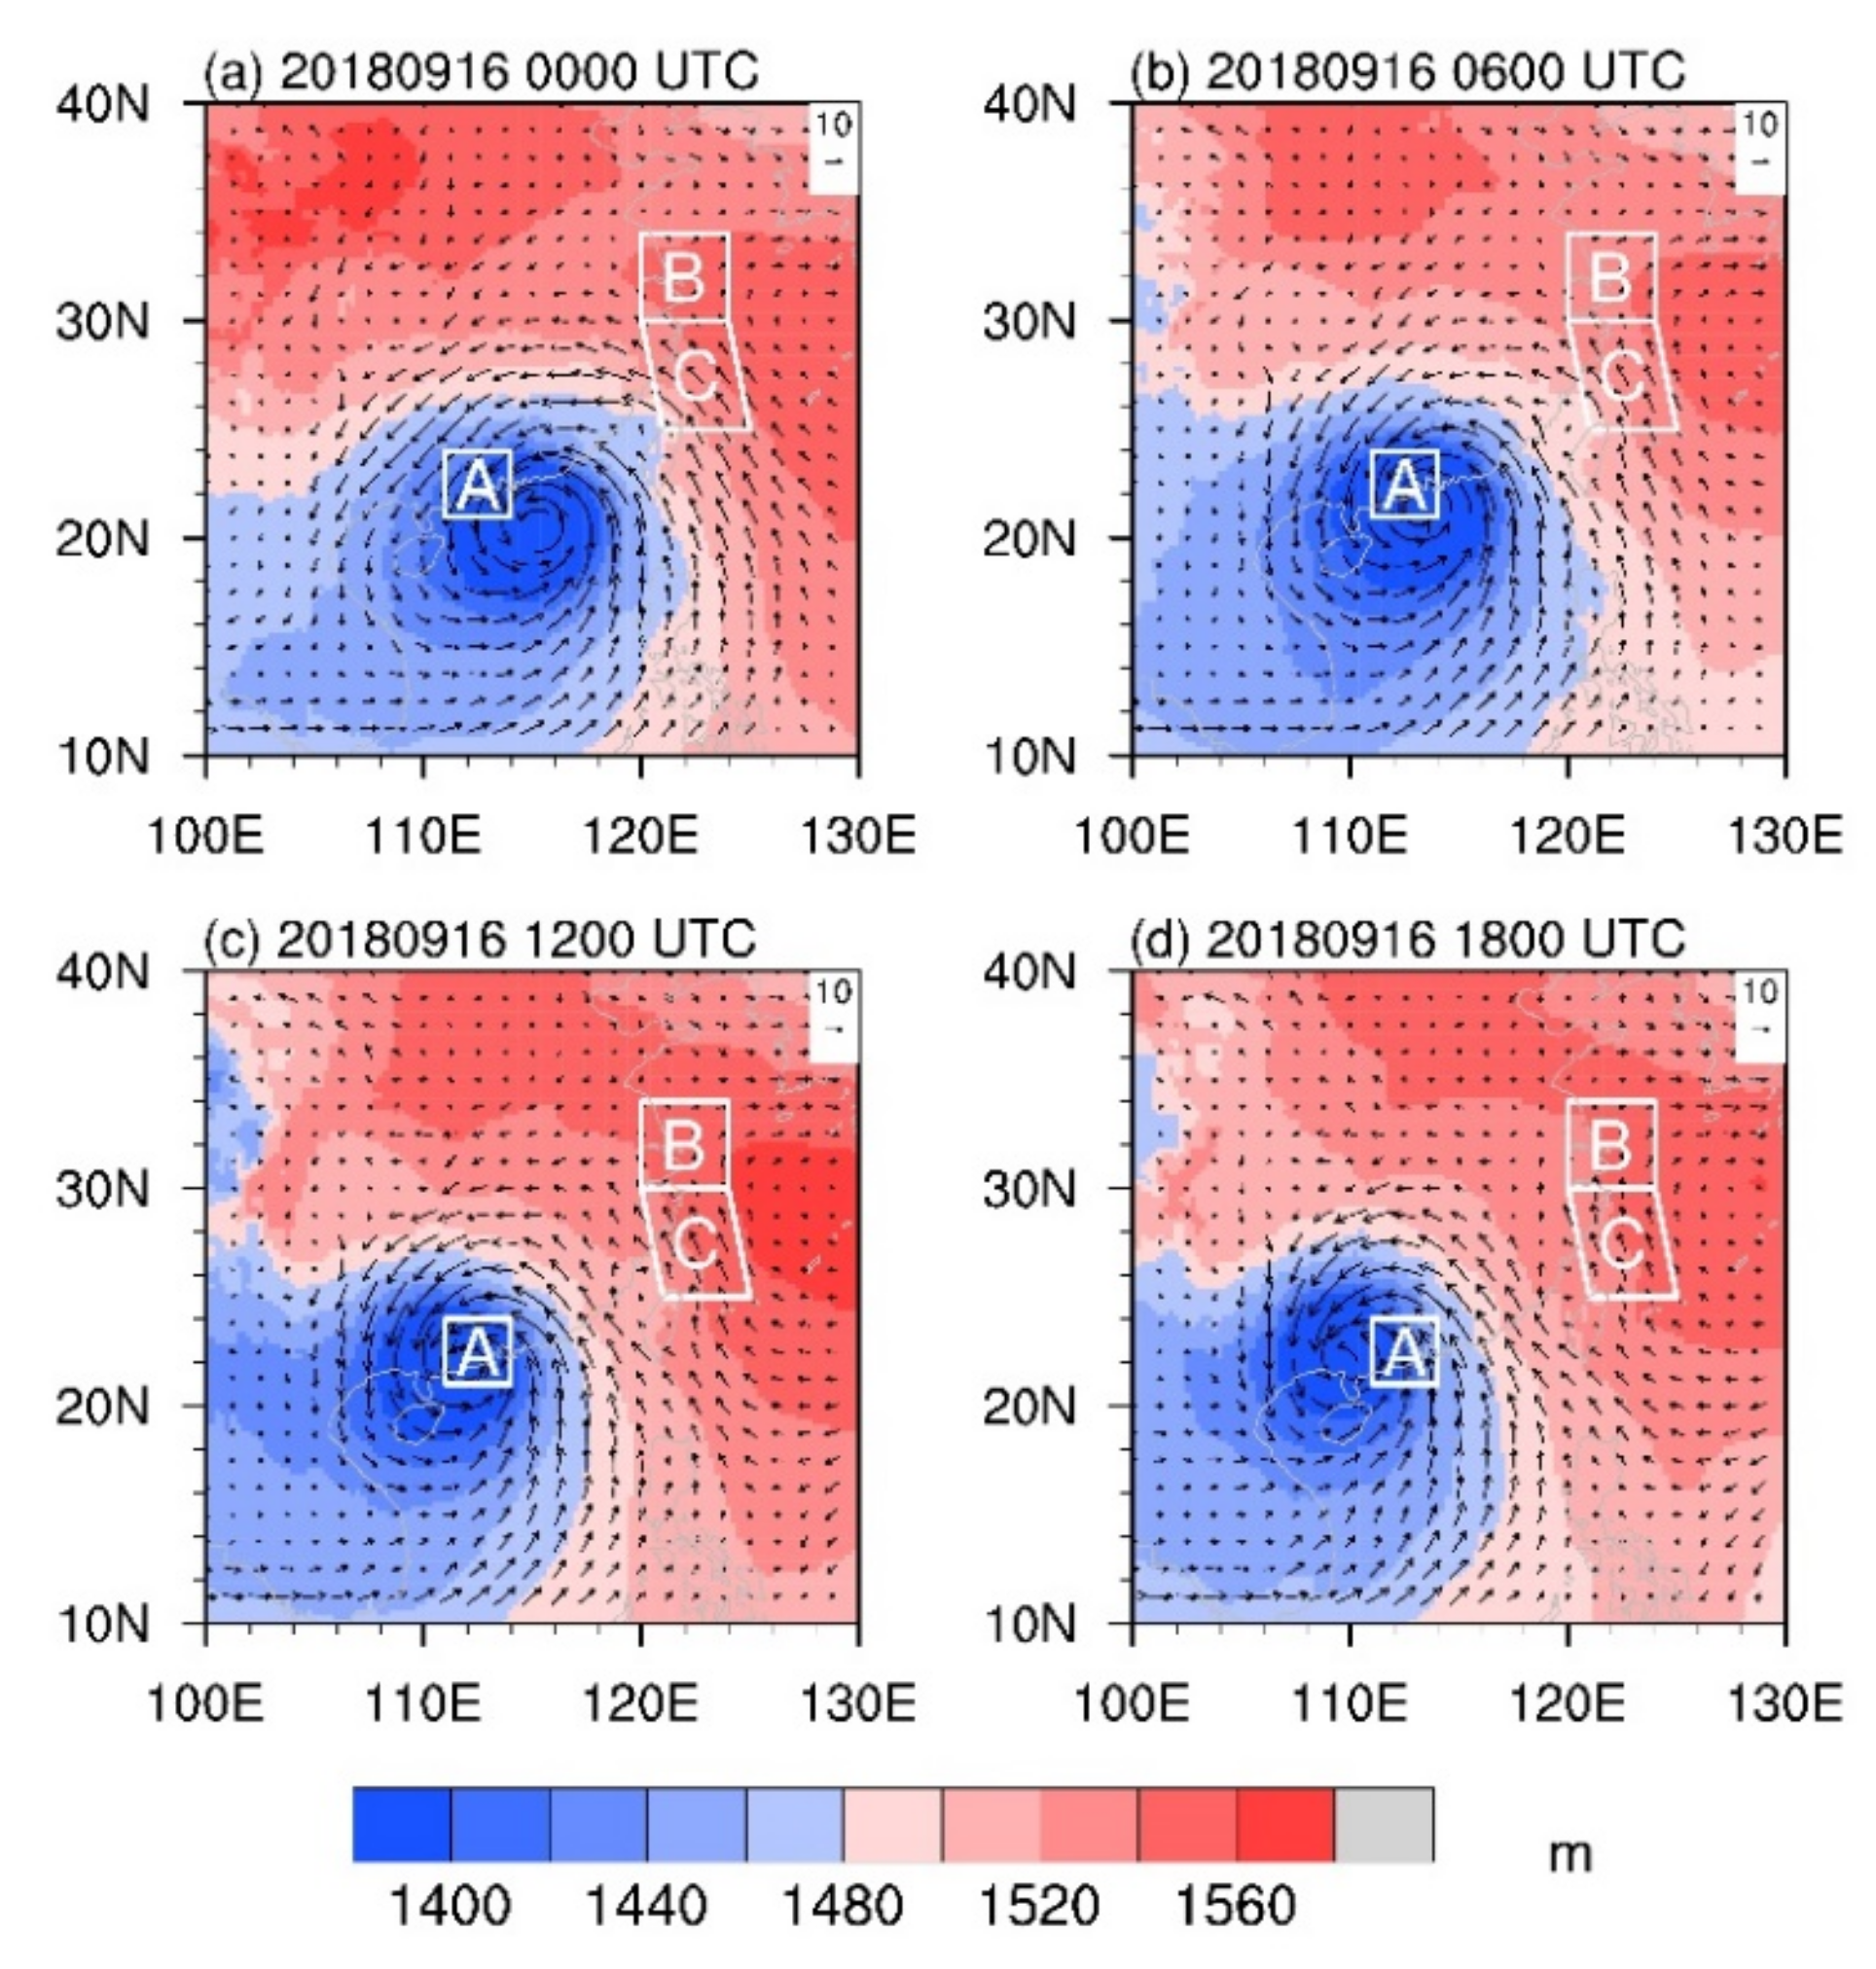
The 850 hPa geopotential height and wind from 0 to 18 UTC on 16 September 2018. (a) 0000 16 September, (b) 0600 16 September, (c) 1200 16 September and (d) 1800 16 September. A stands for the Pearl River Delta, B stands for the Yangtze River Delta and C stands for the water vapor transport channel.
Figure 3.
The 850 hPa geopotential height and wind from 0 to 18 UTC on 16 September 2018. (a) 0000 16 September, (b) 0600 16 September, (c) 1200 16 September and (d) 1800 16 September. A stands for the Pearl River Delta, B stands for the Yangtze River Delta and C stands for the water vapor transport channel.

Figure 4.
Vertically integrated moisture divergence from 0 to 18 UTC on 16 September 2018. (a) 0000 16 September, (b) 0600 16 September, (c) 1200 16 September and (d) 1800 16 September.
Figure 4.
Vertically integrated moisture divergence from 0 to 18 UTC on 16 September 2018. (a) 0000 16 September, (b) 0600 16 September, (c) 1200 16 September and (d) 1800 16 September.

Figure 5.
Distribution of the vertical integral disturbance of water vapor transport from 0:00 on 15 September to 12:00 on 16 September. (a) 0000 15 September, (b) 1200 15 September, (c) 0000 16 September and (d) 1200 16 September.
Figure 5.
Distribution of the vertical integral disturbance of water vapor transport from 0:00 on 15 September to 12:00 on 16 September. (a) 0000 15 September, (b) 1200 15 September, (c) 0000 16 September and (d) 1200 16 September.

Figure 6.
Variation in the abnormal magnification of water vapor transport in the C area with latitude at 05:00 on 16 September (The horizontal axis represents latitude).
Figure 6.
Variation in the abnormal magnification of water vapor transport in the C area with latitude at 05:00 on 16 September (The horizontal axis represents latitude).

Figure 7.
Variation in the abnormal magnification of water vapor transport in the C area at 25–30° N with time from 0:00 on the 15 September to 0:00 on the 17 September. (a) 25° N, (b) 26° N, (c) 27° N, (d) 28° N, (e) 29° N and (f) 30° N.
Figure 7.
Variation in the abnormal magnification of water vapor transport in the C area at 25–30° N with time from 0:00 on the 15 September to 0:00 on the 17 September. (a) 25° N, (b) 26° N, (c) 27° N, (d) 28° N, (e) 29° N and (f) 30° N.

Figure 8.
Conceptual diagram of water vapor transport.

Publisher’s Note: MDPI stays neutral with regard to jurisdictional claims in published maps and institutional affiliations. |
© 2022 by the authors. Licensee MDPI, Basel, Switzerland. This article is an open access article distributed under the terms and conditions of the Creative Commons Attribution (CC BY) license (https://creativecommons.org/licenses/by/4.0/).
Share and Cite
MDPI and ACS Style
Zuo, H.; Chen, Y.; Chen, S.; Li, W.; Zhang, A. The Effect of the Water Tower of Typhoon Mangkhut (2018). Atmosphere 2022, 13, 636. https://0-doi-org.brum.beds.ac.uk/10.3390/atmos13040636
AMA Style
Zuo H, Chen Y, Chen S, Li W, Zhang A. The Effect of the Water Tower of Typhoon Mangkhut (2018). Atmosphere. 2022; 13(4):636. https://0-doi-org.brum.beds.ac.uk/10.3390/atmos13040636
Chicago/Turabian StyleZuo, Haosheng, Yilun Chen, Shumin Chen, Weibiao Li, and Aoqi Zhang. 2022. "The Effect of the Water Tower of Typhoon Mangkhut (2018)" Atmosphere 13, no. 4: 636. https://0-doi-org.brum.beds.ac.uk/10.3390/atmos13040636
Note that from the first issue of 2016, this journal uses article numbers instead of page numbers. See further details here.