
Plant C and N Pools Improved by N Addition Levels but Not Frequencies in a Typical Grassland of Northern China


1
College of Grassland Science, Shanxi Agricultural University, Jinzhong 030801, China
2
Shanxi Key Laboratory of Grassland Ecological Protection and Native Grass Germplasm Innovation, Jinzhong 030801, China
3
State Key Laboratory of Vegetation and Environmental Change, Institute of Botany, Chinese Academy of Sciences, Beijing 100093, China
4
Key Laboratory of Alpine Ecology, Institute of Tibetan Plateau Research, Chinese Academy of Sciences, Beijing 100101, China
*
Authors to whom correspondence should be addressed.
Atmosphere 2022, 13(6), 851; https://0-doi-org.brum.beds.ac.uk/10.3390/atmos13060851
Submission received: 26 April 2022
/
Revised: 16 May 2022
/
Accepted: 19 May 2022
/
Published: 24 May 2022
(This article belongs to the Special Issue Global Changes and Nitrogen Cycling in Grasslands)
Abstract
:The pools of plant community carbon (C) and nitrogen (N) are important sources of soil organic matter in terrestrial ecosystems and directly affect soil C and N cycling. A large amount of studies were manipulated with multiple N levels on soil C and N pools. However, how and whether the frequency of N addition can affect the plant C and N pools is still unclear. In order to comprehensively understand the N addition effects (including frequencies and levels) on C and N pools of the plant community, we executed a randomized complete block experiment with the addition of five levels of N, including 0, 2, 10, 20 and 50 g N m−2 yr−1 (designated as N-0, N-2, N-10, N-20 and N-50) and two N addition frequencies (twice a year vs. monthly, F2, F12) in August of 2008. After 5 years of treatment, the physical-chemical properties of the plants and soil were measured in 2013. The results indicated that with increasing N addition levels, the C and N pools of the plant community significantly increased, while N addition frequency had no significant effects. Moreover, significant interactions between N addition levels and the frequencies on the C and N pools of the plant community were also found in this typical grassland. Under different frequencies of N addition treatment, the plant community C and N pools showed different response patterns along with N addition levels in plants aboveground and belowground, respectively. Under different frequencies of N addition, the changes in the C and N pools of the plant community caused by N addition were regulated by different environmental factors. We highlight that long-term N deposition could affect the plant community C and N pools and would influence C and N cycling of terrestrial ecosystems based on global climate change in the future.
1. Introduction
Plant community carbon (PC) and nitrogen (PN) pools play a vital role in adjusting carbon (C)and nitrogen (N) cycles of terrestrial ecosystems because the plant litter is an important source of soil organic matter [1,2]. They are affected by many climate factors especially N deposition [3,4,5,6], which continues to expand with the process of industrialization and urbanization in China [7,8]. The continuous increase in N deposition will change the structure and function of the grassland ecosystem [8]. However, there are few reports on the response of plant community C and N pools to different frequencies of N addition, especially in a typical grassland of northern China.
Nitrogen is one of the most limited nutrients in most of terrestrial ecosystems [9]. It has been extensively testified that exogenous N input could significantly improve primary productivity in different grassland ecosystems [10,11]. Although, there are many controlled N addition experiments, which were basically applied only once a year, while atmospheric N deposition is a continuous and intermittent process; therefore, the simulation of atmospheric N deposition can be achieved by a higher frequency of N addition [7,12,13,14,15]. A previous study indicated that the effect of a one-time addition of a certain range of N on PC and PN pools is also inconsistent [11]. For example, a positive effect on the leaf N pool was only found at a low N addition rate [11]. There were also differences between legumes and non-legumes in response to N addition, thus leading to inconsistent results in PC and PN pools [12]. However, it was not clear whether the effects of N addition on PC and PN pools were regulated by the frequency of N addition. The compared effects between multiple times and twice a year of N addition on PC and PN pools are needed to be further verified.
A previous study suggested that the effects of N addition on grassland ecosystems can be determined by N addition frequency [16,17]. N addition once or twice a year decreased the existing species compared to the addition of N multiple times, further altering the plant community structure and composition [17]. Soil chemical properties are also regulated by the frequency of N addition, such as soil pH, ammonium (NH4+) and exchangeable Na+ [16]. These changes in diverse ecosystems are closely associated with plant growth rate and plant productivity, further affecting the PC and PN pools [18,19]. Moreover, N addition can increase the absorption of N by plants, thus changing the C/N ratio in tissues [20]. However, the response of the C/N ratio of different plant tissues to different frequencies of N addition remains unclear. The C/N ratio at the plant community level largely determines the size and quality of the PC and PN pools, and then affecting the C, N cycle [21]. As we all know, N addition increased soil inorganic N availability [22]. Recent studies have indicated that a large amount of N input will amplify the limitation of water on plants due to the lifting of N limitation [23]. However, there are few studies on the synergistic effects of soil N and water on PC and PN pools under different frequencies of N addition. Moreover, optimal partitioning theory elucidates that plants will change the biomass allocation to adapt to the changed environment of soil nutrients caused by N input [24]. It is common knowledge that the coupling of C and N in primary production distributes more belowground in nutrient-poor environments while more C and N distributes aboveground in eutrophic soil nutrient environments [25]. Different N-induced nutrient use strategies of species may also lead to changes in the carbon and nitrogen pools at the community level [24]. However, we know little about whether the frequency of N addition would alter plant sensitivity to environmental factors which consequently affects the ratio of C and N distributes between plants aboveground and belowground.
In a typical grassland of northern China, a series of N addition experiments have been carried out under the scenario of a continuous increase in N deposition [8,16]. Few studies have examined how the frequency of N addition affects PC and PN pools in this grassland [10]. To accurately evaluate how long-term N deposition affects the PC and PN pools. A 5-year N addition experiment was carried out to comprehensively understand the effect of N addition frequencies and levels on PC and PN pools. The specific objectives of this study were (1) to explore the effects of different N addition frequencies and levels and their interactions on PC and PN pools. (2) To investigate the key impact factors in regulating the response of PC and PN pools with different frequencies and levels of N addition in a typical grassland.
2. Materials and Methods
2.1. Study Site
This study was conducted in a typical steppe near the Inner Mongolia Grassland Ecosystem Research Station (IMGERS), located in the Xilin River Basin of the Inner Mongolia Autonomous Region, China (116°14′ E, 43°13′ N) (Figure 1a,b) [26]. The experimental area is a natural grassland about 100 ha, up to 1250 m above sea level, which has been enclosed since 1999 to prevent large herbivores grazing. Based on a long-term observational dataset (1980–2013), the annual average air temperature is 0.9 °C, with lowest mean monthly temperature of −21.4 °C in January and the highest mean monthly temperature of 19.7 °C in July, and the mean annual precipitation is about 350.00 mm, approximately 70–80% occurred from May to September. Haplic Calcisol is classified by the FAO classification [27]. The dominant plant species in this site are Stipa grandis and Leymus chinensis, and they together accounted for more than 60% of the total aboveground biomass [28].
2.2. Experimental Design
Forty experimental plots were established with a randomized complete block design in September 2008 [29]. Each plot was 10 m × 10 m, and they were 2 m apart between two adjacent plots. Each plot was treated with different N addition levels, i.e., 0, 2, 10, 20 and 50 g N m−2 yr−1 (designated as N-0, N-2, N-10, N-20 and N-50, respectively), and two frequencies of N addition (twice a year vs. once a month) (Figure 1c). There were 10 treatments (5 × 2) in total, each with 4 replicates. The form of N was purified NH4NO3 (>99%). Nitrogen addition started on 1st November and continued on the first day of June and November of the next year for the low frequency of N addition treatment (F2) (twice N addition yr−1), or continued on the first day of each month from the first day of November for the high frequency of N addition treatment (F12) (once a month). The detailed N addition referred to the method of Zhang et al. (2016) (Figure 1) [29].
2.3. Plant and Soil Sampling and Measurements
Plant and soil samples were sampled in mid-August 2013. To investigate vegetation biomass and collect plant and soil samples, a 2 m × 0.5 m quadrat was randomly arranged in each plot, but more than 50 cm from the border of each plot to avoid edge effects. Plant samples were collected by clipping all aboveground plants, then three drills were drilled in each of the four soil layers (0–10, 10–20, 20–30, 30–40 cm) with 7 cm diameter root drill. The three drills were mixed and put into the root bag to bring back to the laboratory. After rinsing the plant roots with water, oven-drying the roots and combined clippings at 65 °C for 48 h, recording the sample’s dry weight, and then finely crushing the sample in a mill to determine the C and N content of plants (Cplant and Nplant; mg kg−1). The Caboveground, Cbelowground and Cplant were determined by a H2SO4-K2Cr2O7 oxidation method [30]. Kjeldahl acid digestion method with an Alpkem auto-analyzer (Kjektec System 1026 distilling unit, Sweden) was used to determine the Naboveground, Nbelowground and Nplant. The plant C and N pools for each component were calculated by multiplying the biomass with total C and N contents. We summed the C and N pools from the plant aboveground (PAGC, PAGN), plant belowground (PBGC, PBGN), the sum of the above- and belowground calculated as the total plant community C and N pools (PC, PN) [5]. Soil samples were collected with a soil augur (3 cm in diameter) and in each plot three cores were taken with 0–10 cm depth and at least 50 cm apart. Then, the samples were mixed and passed through a 2 mm mesh sieve, stored at 4 °C for assessment of soil ammonium (NH4+-N; mg kg−1 dry soil), nitrate (NO3−-N; mg kg−1 dry soil) and soil water content. Soil subsamples were air-dried for analysis of soil pH. We used a flow injection auto analyzer (FLAstar 5000 Analyzer; Foss Tecator, Hillerød, Denmark) to analyze soil NH4+-N and NO3−-N [30]. Soil pH value was determined by measuring the pH of a soil–water suspension (soil:water = 1:2.5) with a pH meter (FE20-FiveEasy). The soil water content was determined as the mass loss after oven-drying the soil at 105 °C for 24 h to a constant weight.
2.4. Statistical Analysis
All results were presented as mean ± SE (standard error). Duncan’s multiple range test of one-way ANOVA was used to analyze the data of PC and PN pools with different levels of N addition treatment, and an independent sample t-test was used to analyze the difference between different frequencies. We also used two-way ANOVA to test the effects of N addition levels (N) and N addition frequency (F) on the plant community C and N pools including the aboveground part, belowground part and total, and soil physicochemical data including soil NH4+-N, NO3−-N and NH4+-N + NO3−-N (InN) concentrations, soil water content and soil pH. If p < 0.05, differences were considered statistically significant. We used linear regressions (not significant was not shown) to assess the relationships between the PC and PN pools with soil physicochemical data. All statistical tests were conducted with SPSS 22.0 (SPSS for Windows, version 22.0, SPSS Inc., Chicago, IL, USA). Origin 2016 software (Origin 2016 for windows) was also used to create graphs.
3. Results
3.1. Responses of PC and PN Pools to Different N Addition Levels and Frequencies
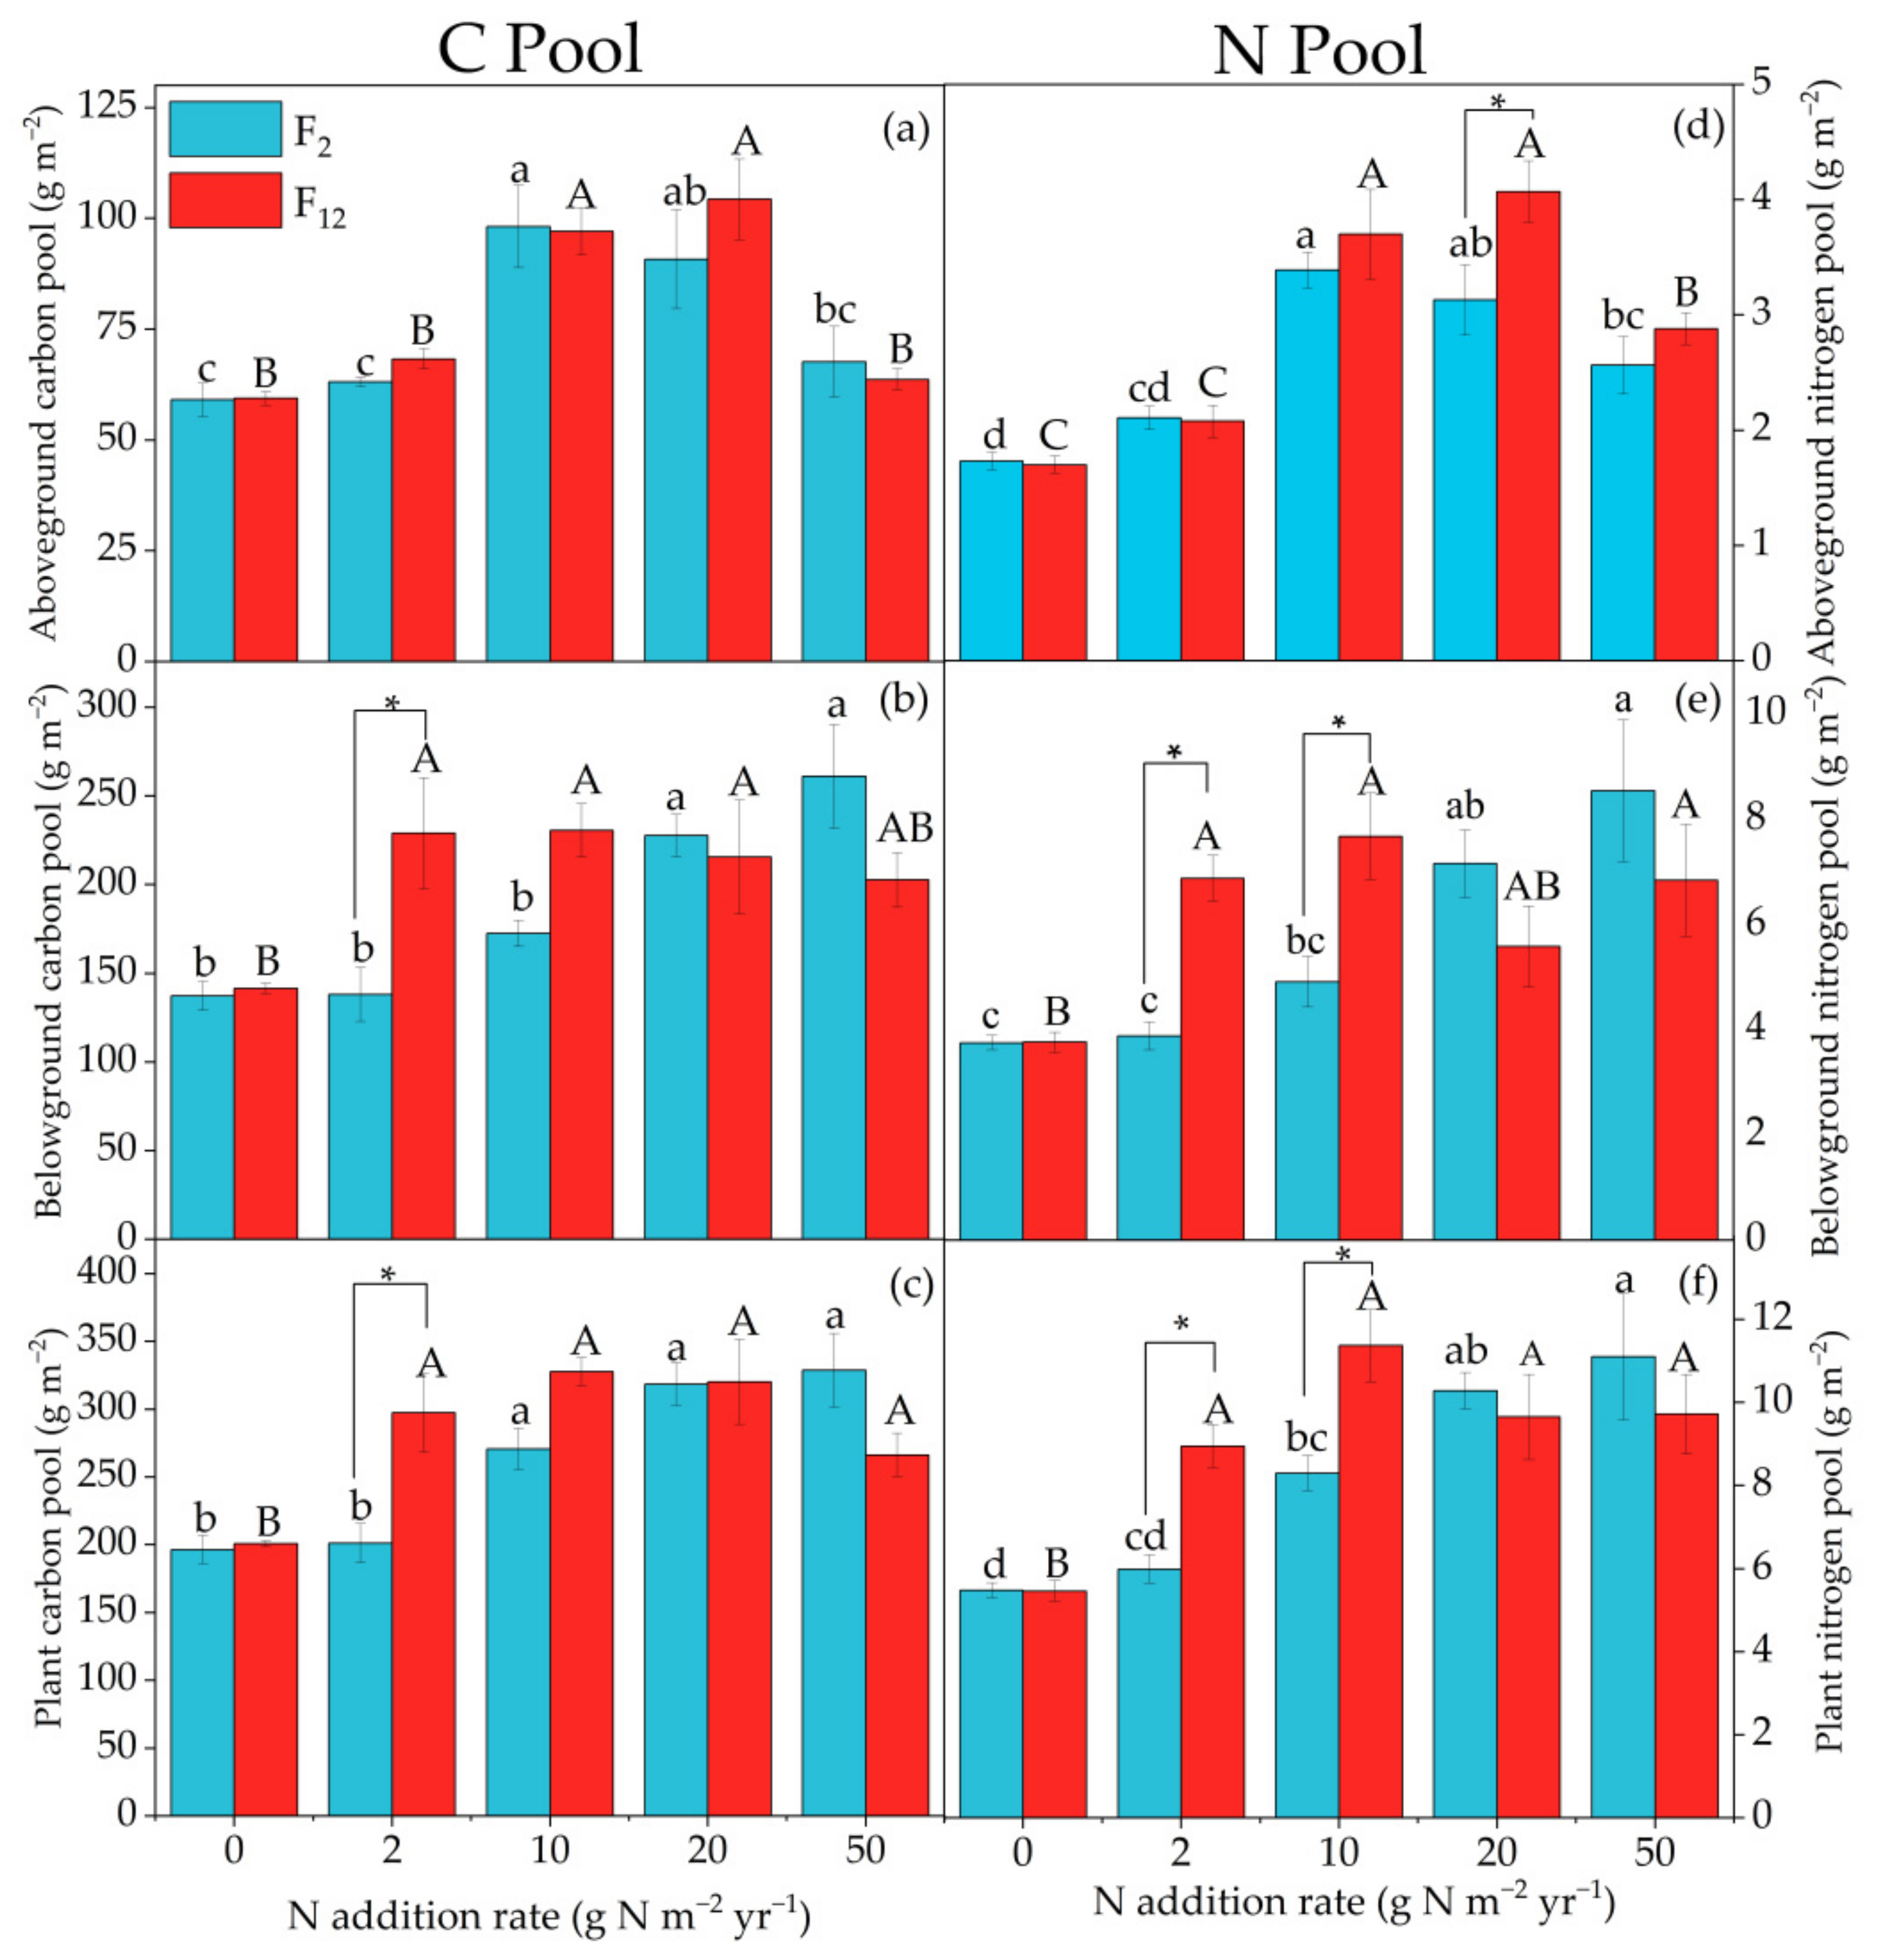
On average, compared with the control, the PC and PN pools significantly increased with N addition levels regardless of the frequency of N addition (all p < 0.05, Figure 2, Table 1). The PAGC and PAGN showed a single-peaked curve with increasing amounts of N addition, which reached the peak at N-10 and N-20 under F2 and F12 treatment, respectively (Figure 2a,d). The PBGC and PBGN increased with increasing N addition levels at F2 treatment. Compared to cases without N addition, N-50 treatment significantly increased average PBGC and PBGN by 90% and 127%, respectively. However, under F12 treatment, the PBGC and PBGN appeared to first increase and then decline with their peak occurring at N-10 treatment. Compared with the control, N-10 treatment significantly increased average PBGC and PBGN by 63% and 103%, respectively (Figure 2b,e). The PC and PN increased with increasing N addition levels under F2 treatment. N-20 treatment significantly increased average PC and PN by 62% and 87%, respectively (p < 0.05). Meanwhile, under F12 treatment, the PC and PN showed an increasing trend with increasing amounts of N addition up to the N-10 treatment, and then decreased in the N-20 treatment. Compared with the control, N-10 treatment significantly increased average PC and PN by 63% and 107%, respectively (p < 0.05, Figure 2c,f). The frequency of N addition significantly affected PAGN (p < 0.05), but no changes were found in PAGC, PBGC, PC, PBGN and PN (p > 0.05) (Table 1). Furthermore, we also found that N addition frequencies and levels interactively influenced plant C and N pools (p < 0.05). Under lower N (N-2, N-10) addition levels, F12 treatment stimulated the PBGC, PC, PBGN and PN compared to F2 treatment. Under higher N (N-20, N-50) levels, F12 treatment decreased the PBGC, PC (p < 0.05), PBGN (p < 0.01) and PN (p < 0.05), respectively, compared to F2 treatment (Figure 2c–f, Table 1).
3.2. Responses of Soil Inorganic N, Soil Moisture Content and Soil PH to Different N Addition Levels and Frequencies
The highest N addition (N-50 treatment) significantly increased soil NH4+-N, NO3−-N and NH4+-N + NO3−-N concentration (InN), respectively (p < 0.05, Table 2, Figure 3). However, no significant differences were found in soil InN concentration between two kinds of N addition frequencies, i.e., NH4+-N, InN concentration, except for soil NO3−-N. Moreover, there were significantly interactive effects on soil NH4+-N, NO3−-N and InN between addition frequencies and levels of N (p < 0.01, Table 2). Under F2 treatment, soil moisture contents tended to increase with the increasing levels of N addition (Table 2, Figure 3d). Under F12 treatment, the highest soil moisture content was found in N-10 treatment, which was significantly higher than the control and F2 treatment (p < 0.05) (Table 2, Figure 3d). The frequencies and levels of N addition, and their interactions had no effect on soil pH values (Table 2). On average, compared with the control, the soil pH values showed a decreasing trend with N addition levels under two different frequencies of N addition (Figure 3e).
3.3. Correlations between C and N Pool and Physicochemical Properties of Soil
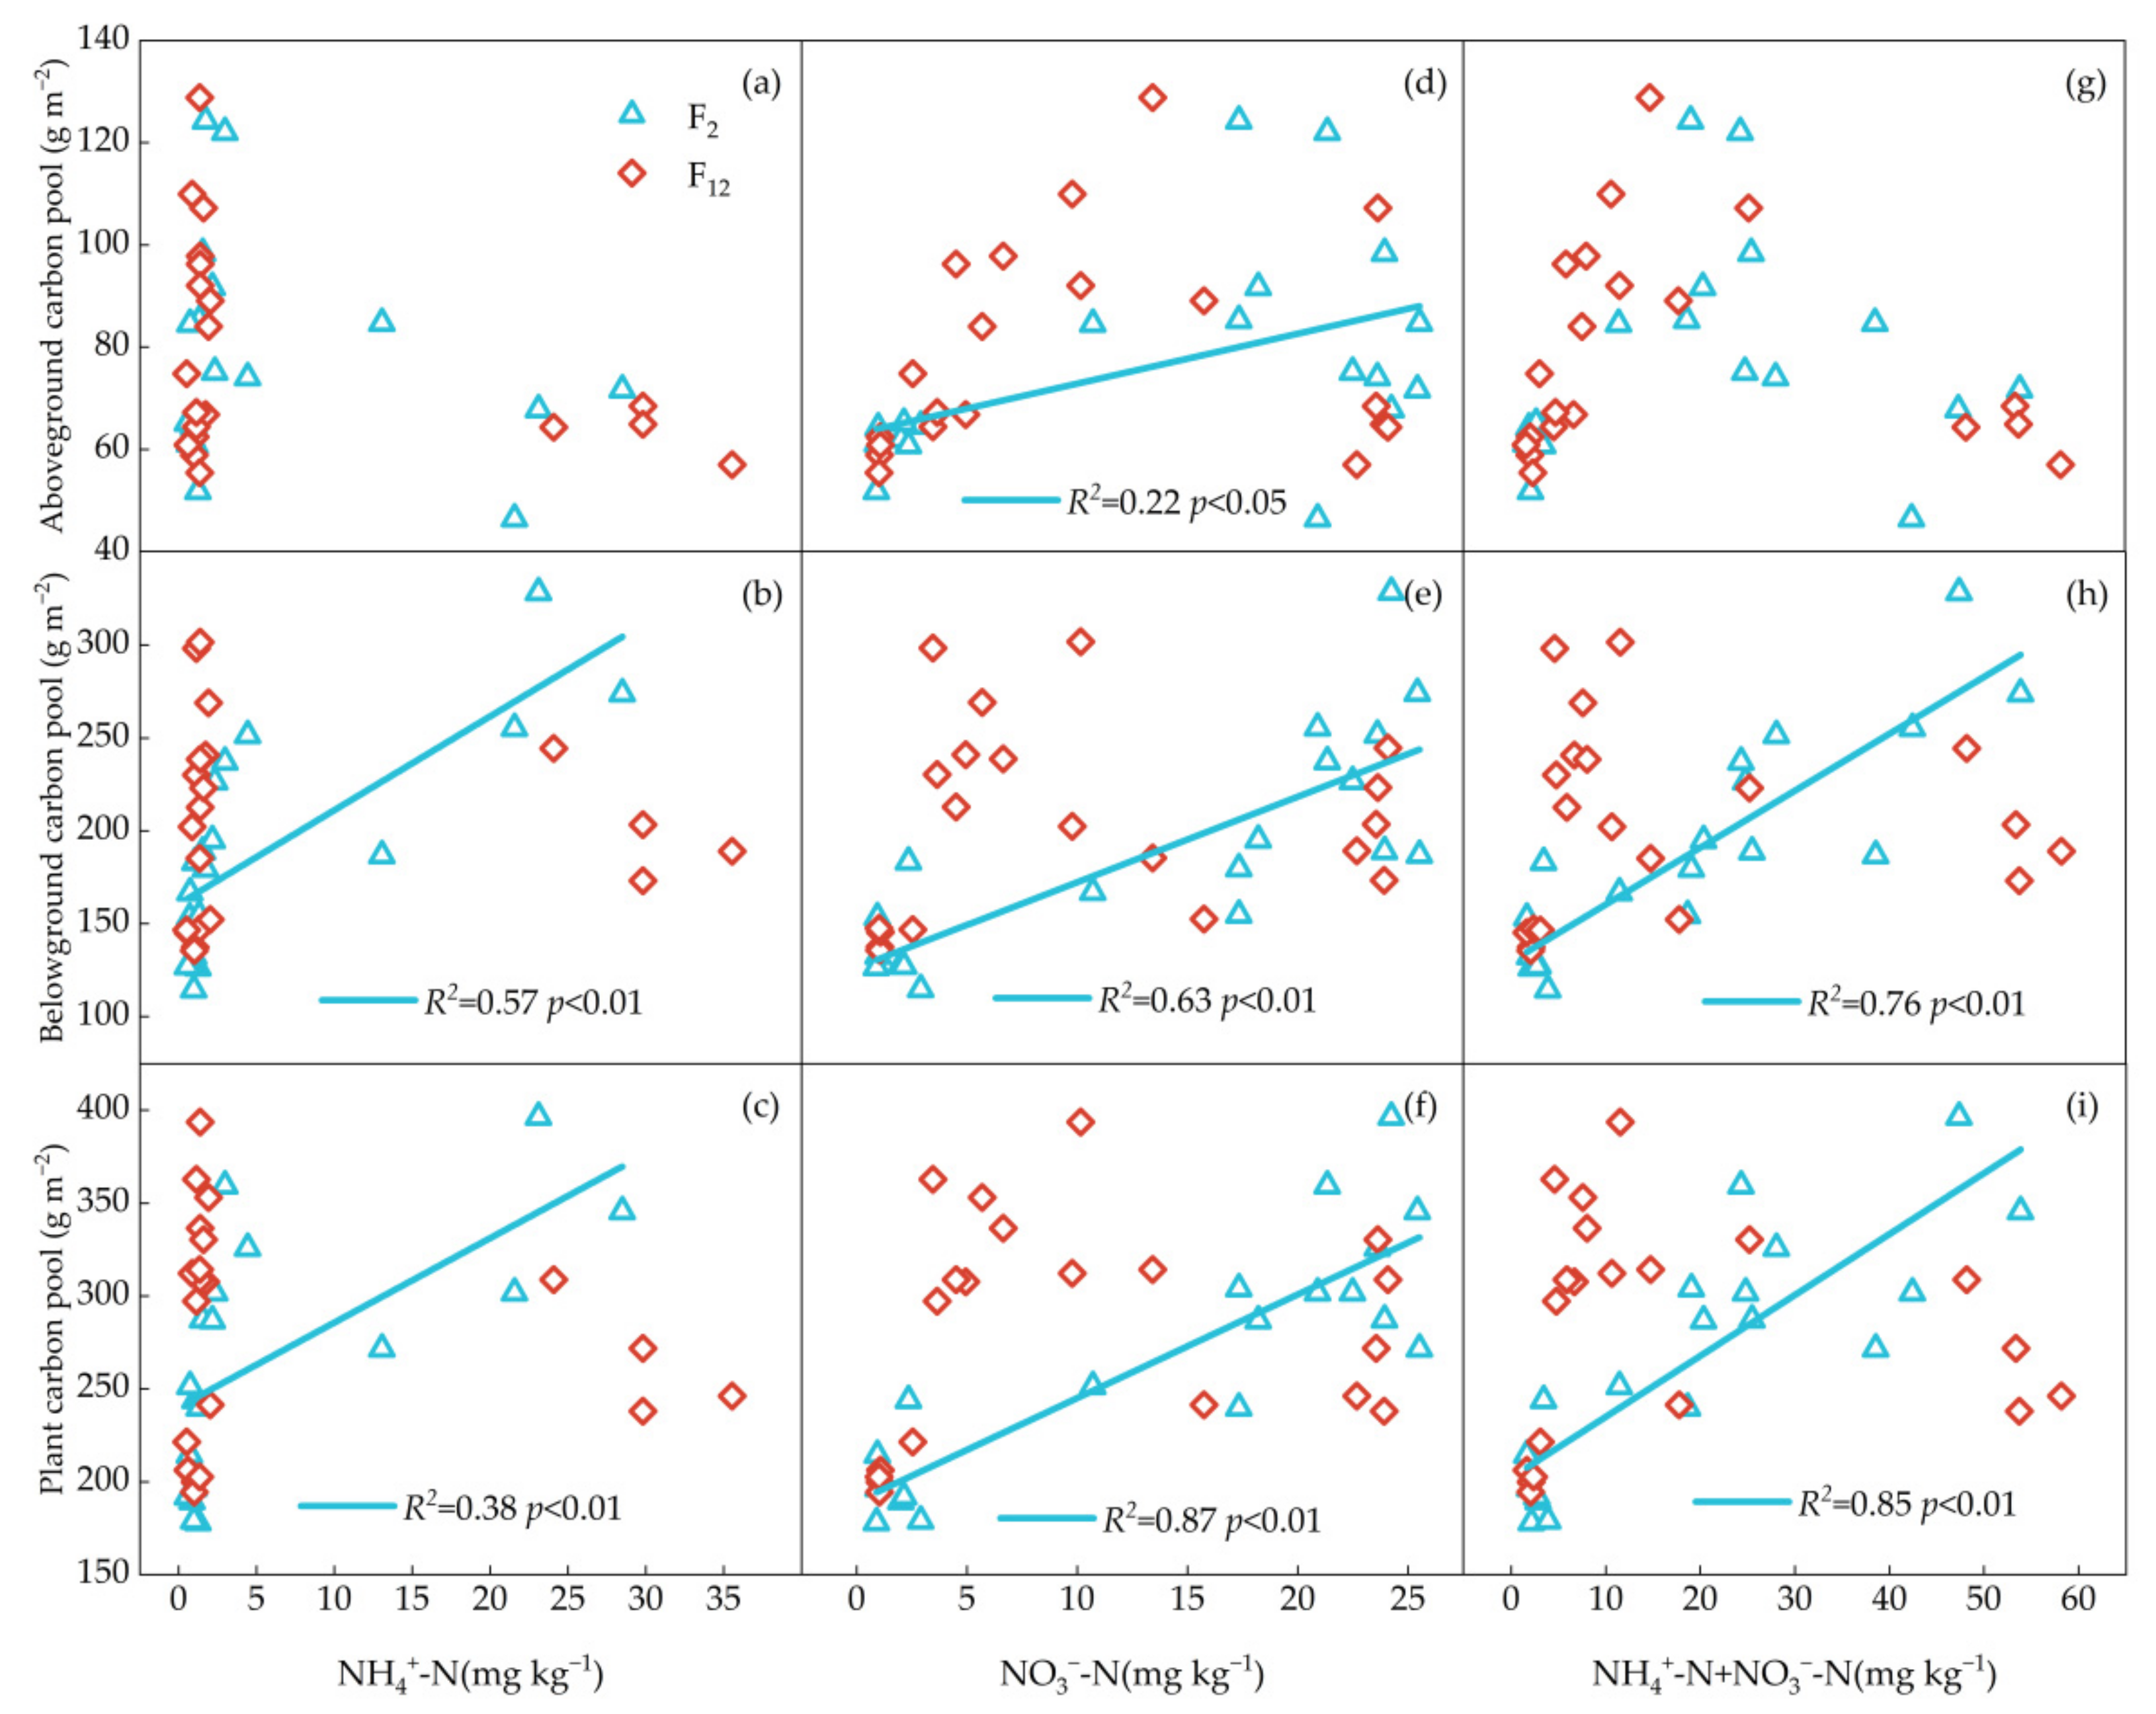
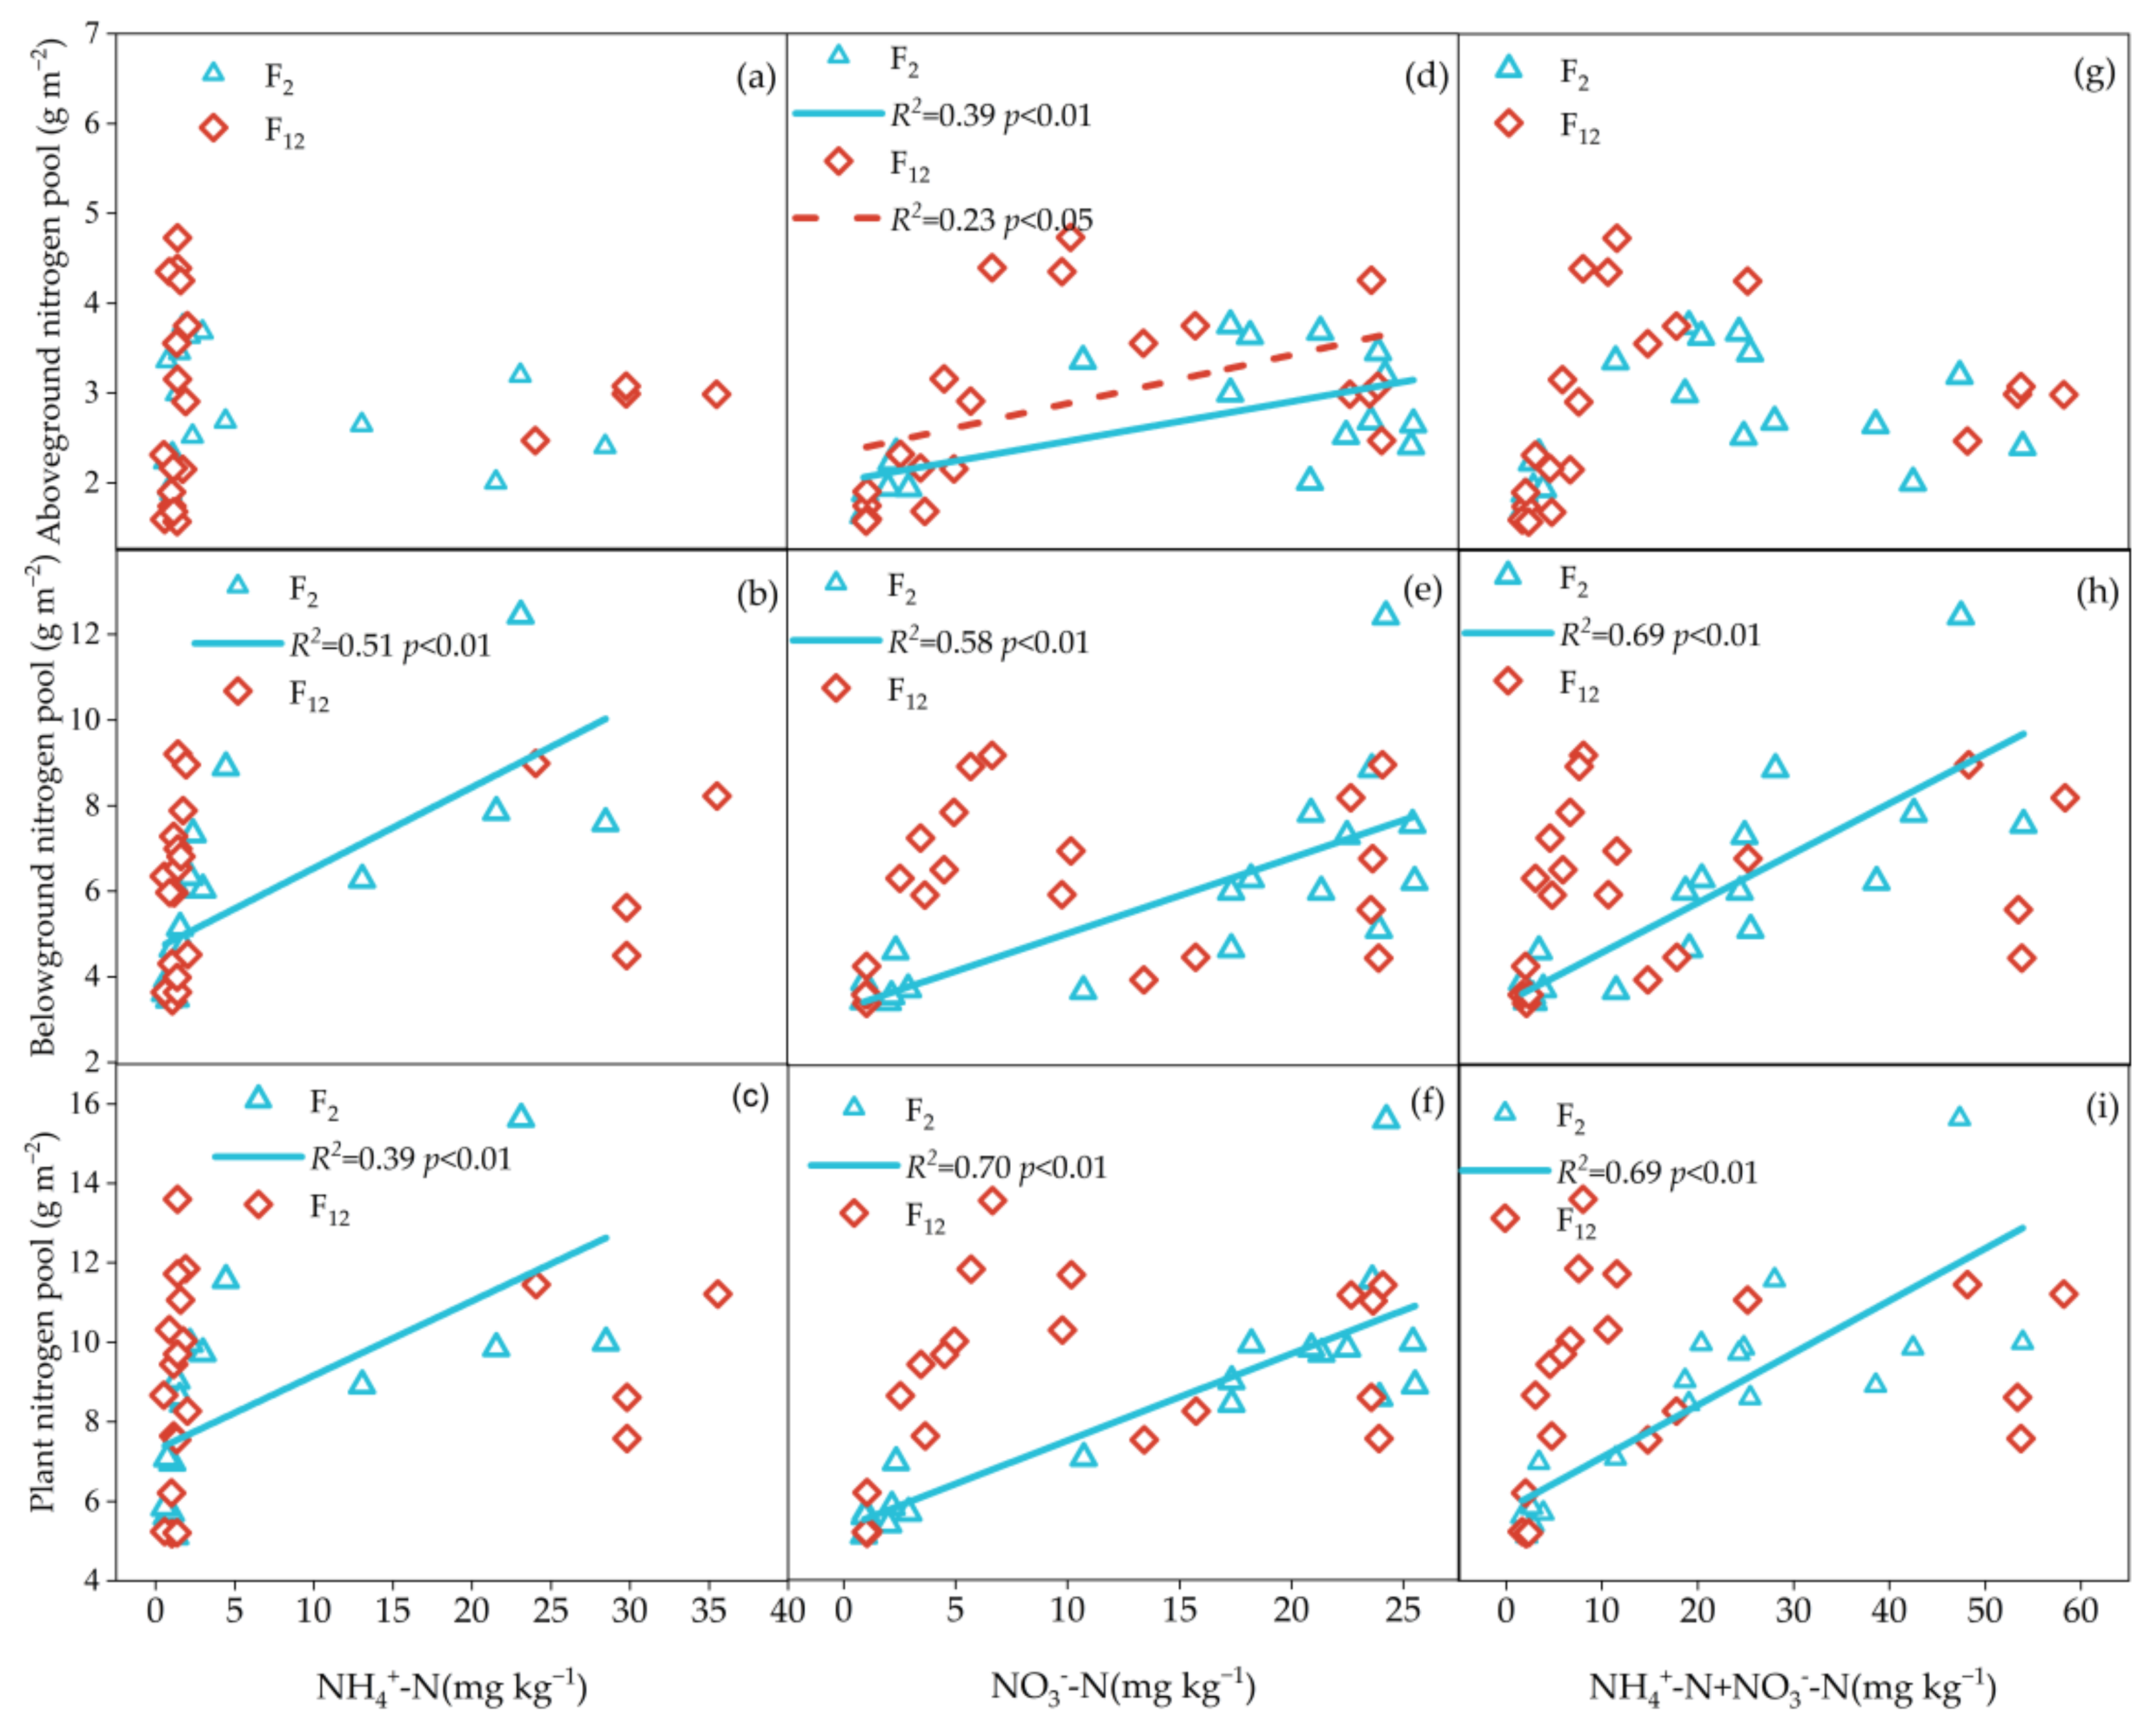
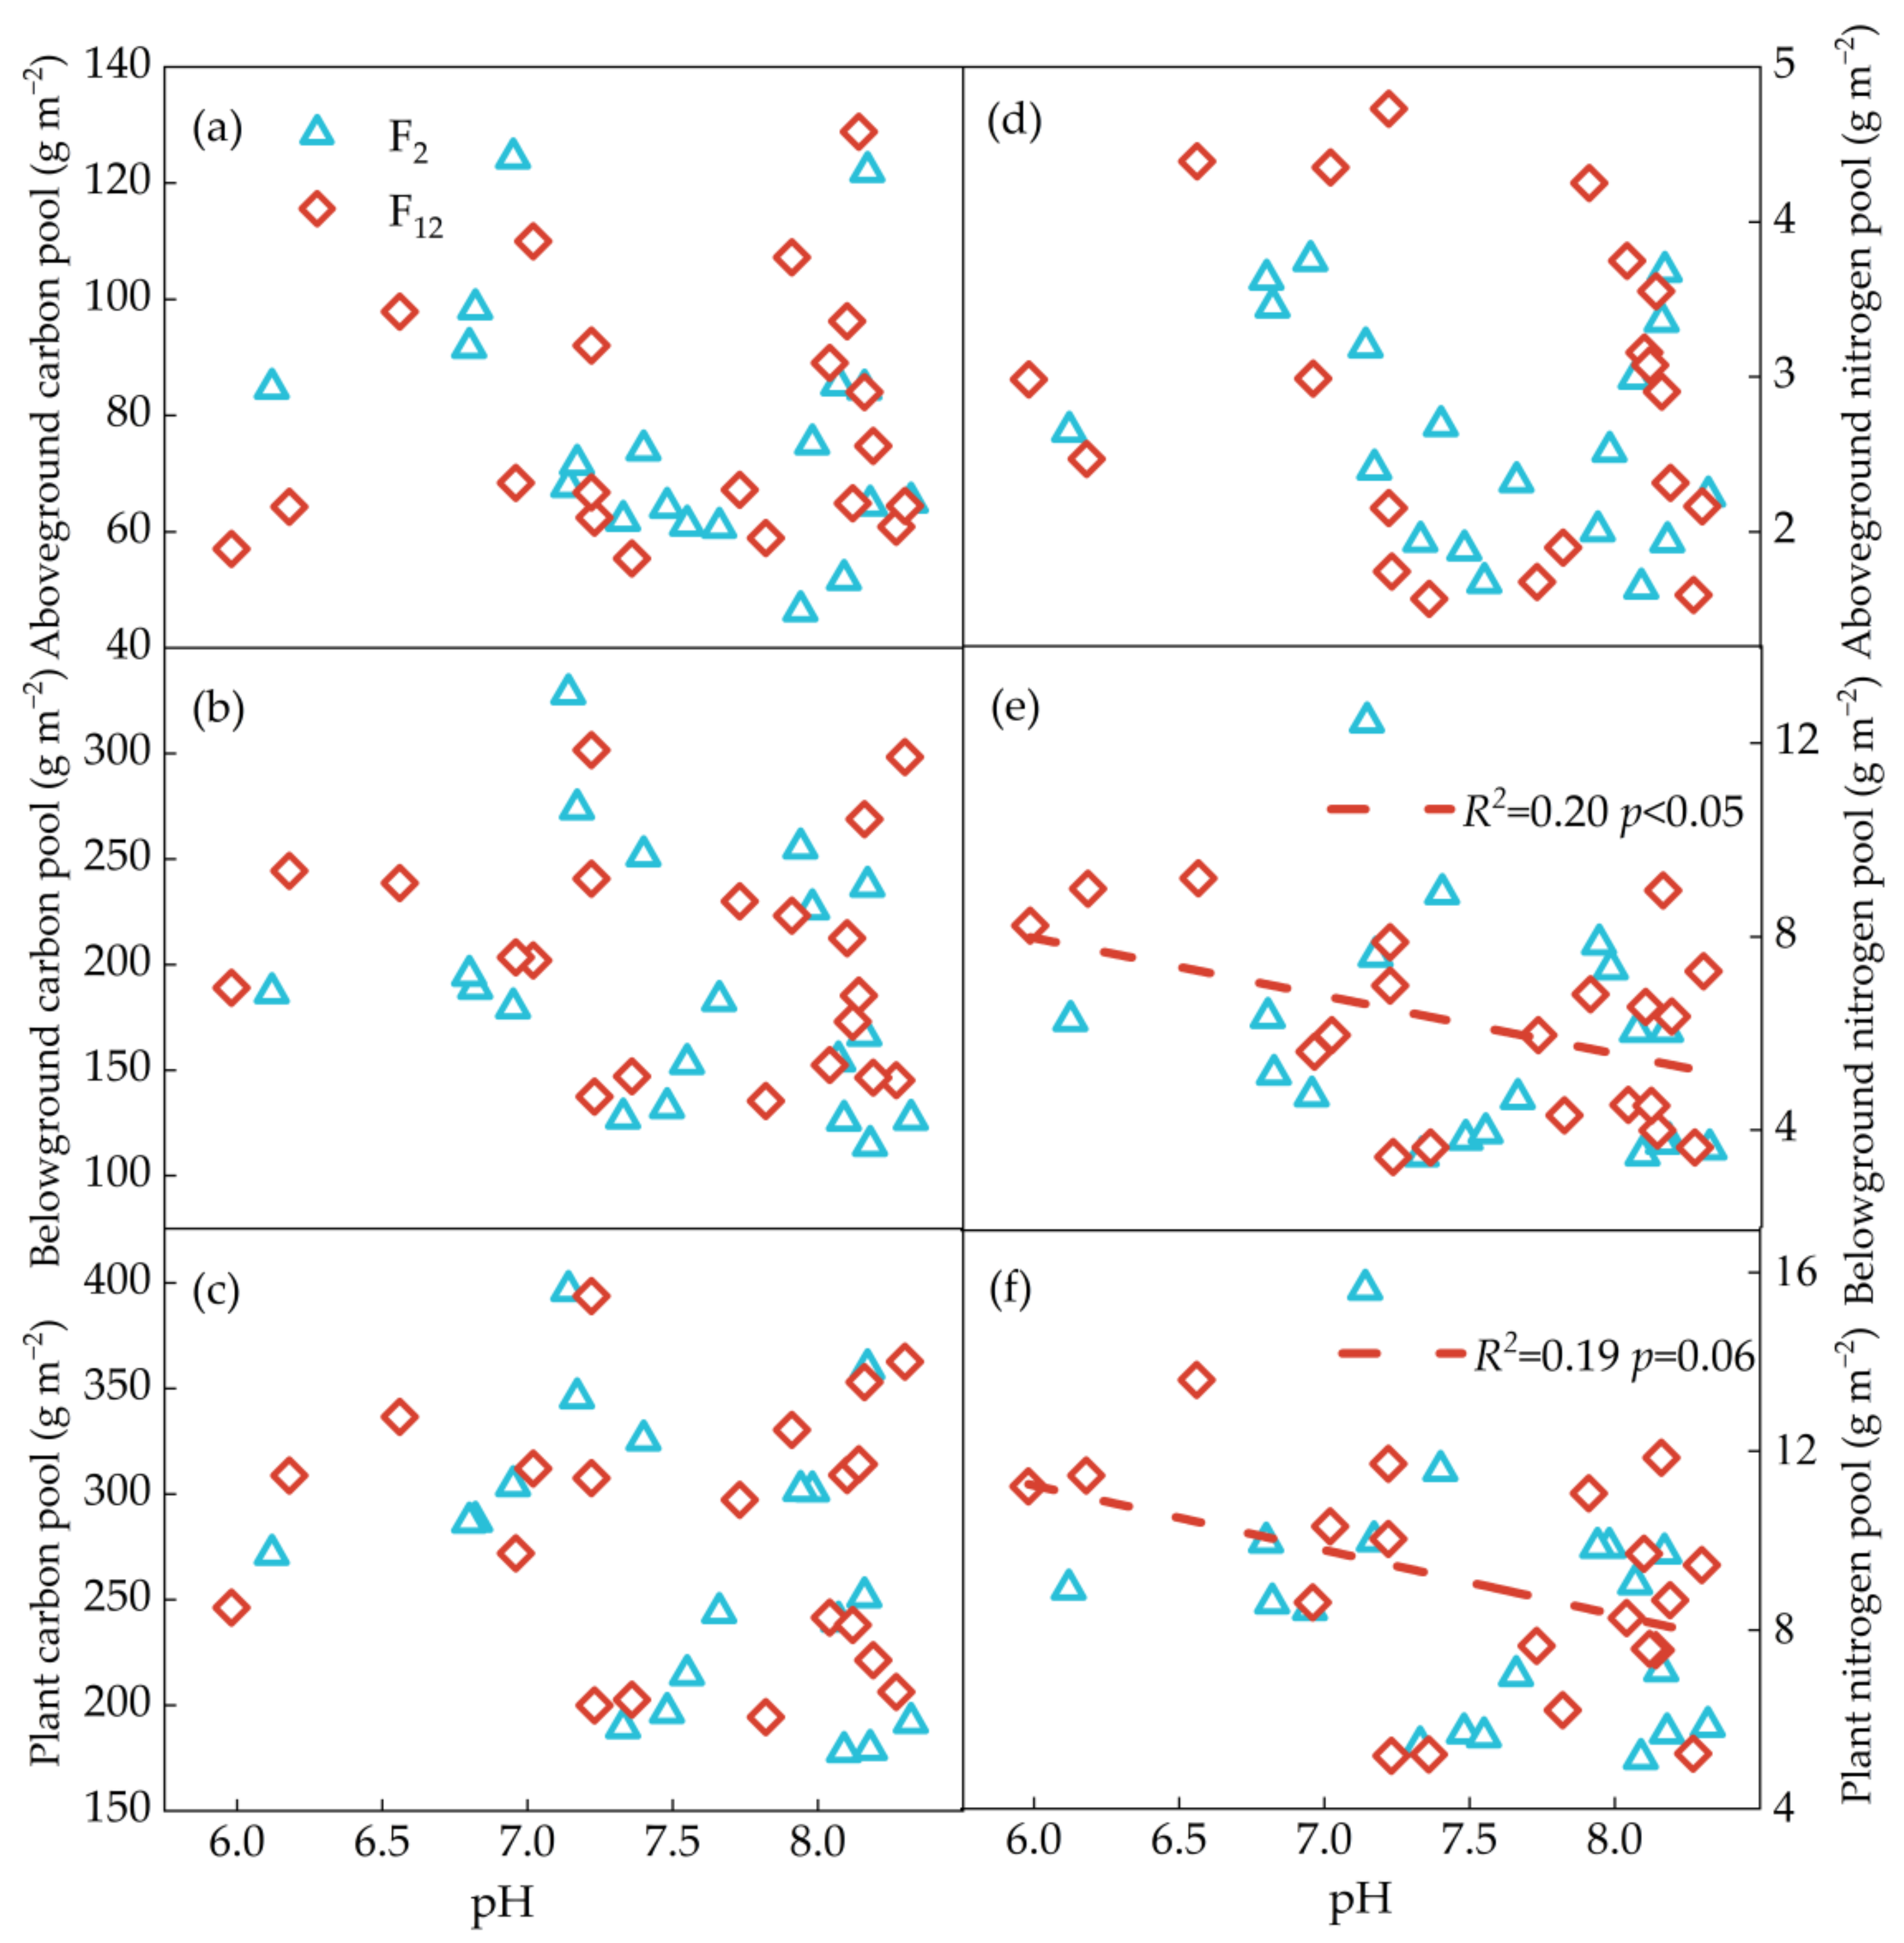
Significantly positive correlations were found between PAGC, PAGN and NO3−-N (p < 0.05); PBGC, PBGN, PC and PN were positively related to soil NH4+-N (p < 0.05), NO3−-N (p < 0.05) and InN (p < 0.05) concentrations at F2 treatment, while no correlations were found between plant C and N pools (except PAGN) and soil available N (NH4+-N, NO3−-N, InN) at F12 treatment (Figure 4 and Figure 5). PBGC and PC have a significantly positive correlation with soil moisture content at F2 treatment (p < 0.05), while there was no relationship at F12 treatment (p > 0.05, Figure 6a–c). Regardless frequency of N addition, PBGN and PN were positively related to soil water content (p < 0.05, Figure 6e,f). PC was not related to the soil pH, regardless of the frequency of N addition (p > 0.05, Figure 7a–c). PBGN and PN were negatively correlated with soil pH values at F12 treatment (p < 0.05, Figure 7e,f).
4. Discussion
4.1. The Response of PC and PN Pools to the Frequency of N Addition
Based on the background of global sustained N deposition in the future, assessing the effect frequency of N addition on PC and PN pools is of great significance to predict the C and N cycling of grassland ecosystems. In our study, no significant differences in PC and PN pools between two frequencies of N addition under the same N addition levels were found, which indicated that N addition frequency had little effect on PC and PN pools within the range of N addition. Previous studies reported that the response of PC and PN pools to N addition depended on the plant biomass [22]. We also found that there were no significant different effects on plant biomass under two N addition frequencies, which was consistent with Zhang’s results [10].
Exogenous N input is considered to be an effective method to improve plant growth and further affect plant C and N pools [31,32,33], because N is the key factor limiting productivity. This indicated that PC and PN pools were positively related to soil available N in most terrestrial ecosystems [9,34], which is further confirmed with our results (Figure 4 and Figure 5). However, our results indicated that different frequencies of N addition had little effects on soil NH4+-N, NO3−-N and InN concentrations which could further prove that PC and PN pools were not regulated by the N addition frequencies with a certain range of N addition in the typical grassland of Inner Mongolia.
Furthermore, the interaction effects between the N addition frequencies and levels on PC and PN pools were detected in this study. PBGC and PBGN showed the same trend as total PC and PN pools in relation to the frequency of N addition. Previous studies indicated that the belowground part of plants was responsible for the majority of PC and PN pools, accounting for 60% of PC and PN pools [35,36], which hinted that PC and PN pools caused by N addition depended on the belowground portion of the plant. Under the condition of lower N (N-2, N-10) application, the PC and PN pools were significantly increased in F12 compared to F2 (Figure 2). Soil moisture content was higher at F12 than F2 treatment with lower N addition level, which could explain the high PC and PN pools at F12 treatment (Figure 2 and Figure 3). Some studies indicated that soil water content and N availability had great influences on the root production and nutrient status [37,38]. Most of studies also showed that nutrients and soil water contents were two main factors regulating plant growth, especially in water-limited ecosystems [39]. Our study also found that PC and PN pools were intertwined with soil moisture content (Figure 6). These results highlighted the synergistic effect of N and water in soil stimulating the PC and PN pools. With the condition of high N (N-20, N-50) application, the plant C and N pools decreased in F12 compared to F2. This could be partly due to the soil available N and soil water conditions, as our results showed that soil inorganic N and soil moisture content were lower in F12 with the N-20 treatment (Figure 3a–d). However, under the N-50 treatment, N addition resulted in a decrease in soil pH and an increase in ammonium ions, which may aggravate the toxicity of base ions, inhibit the growth of roots and some acid-sensitive plants and further reduce the C and N storage of vegetation. This is in agreement with van den Berg et al. (2005) who indicated that under acidic soil conditions, higher soil NH4+ concentrations could reduce plant productivity and acid-sensitive species’ survival rate [40]. Our results also found that under F12 treatment, PBGN and PN were negatively associated with soil pH values (Figure 7e,f). However, this is inconsistent with previous studies showing a positive correlation between BNPP and soil pH [41]. This disagreement may be attributed to N addition decreased soil pH but increased PC and PN pools, further leading to a negative correlation between soil pH and plant N pool.
4.2. The Response of PC and PN Pools to N Addition Levels
Generally, our results showed that the PC and PN pools significantly increased with N addition levels regardless of the frequency of N addition. Our results were consistent with the previous study, which showed that an appropriate amount of N addition stimulated soil N concentrations and plant C and N contents [42,43,44]. Another previous study indicated that Leymus chinensis, as the dominant species in our research grassland, required a lot of N to maintain its growth, and preferred growing in the N enrichment soil environment [45]. Moreover, the ability of L. chinensis to vegetatively expand through rhizomes would make it more competitive under N enrichment [46]. Therefore, N addition promoted the absorption and utilization of nutrients by L. chinensis, and thus increased PC and PN pools. However, excessive N addition increased the ammonium ion in the soil and decreased the soil pH (Figure 3a,e), which leads to the toxicity of ammonium salt and soil acidification [40,47], thereby decreasing leaf N content and photosynthetic capacity which are intertwined with PC and PN pools [48]. This effect caused a decline in PAGC and PAGN high N addition levels, and ultimately showed a single-peaked curve with increasing amounts of N addition in our study.
In addition, PC and PN pools increased with the increasing N addition levels at F2 treatment, while they appeared to first increase and then decline at F12, (Figure 2b,e). Different response mechanisms to N addition levels between F2 and F12 were likely to reveal different nutrient turnover mechanisms in plants that will affect PC and PN pools. These results suggested that there was the situation of N losses with the treatment of F2, further leading to a closer relationship with physicochemical properties than F12. Our results contradicted previous studies which showed that soil N was more likely to be lost in the case of F12, because multiple small doses of N input were in winter or early spring, and soil N was more likely to be transformed or leaching under conditions of melting ice and snow [35,49]. However, rainfall mainly occurs during the growing season in our study site of the typical grassland in northern China [50], applying a large amount of N fertilizer at one time will more easily cause the loss of N, which has been in a state of N limitation and finally leads to strong impact on PC and PN pools to N addition. Moreover, a positive relationship was detected between the N pool and soil water content at two frequencies of N addition, indicating that N addition induced shifts in root nutrient ratios not only explained by any soil nutrient effect, but more closely related to the soil hydrologic changes especially in water-limited sites [51].
Overall, our results emphasized that the response of PC and PN pools to the frequency of N addition was regulated by multiple factors, including soil inorganic N content, soil water content and soil pH. Optimal partitioning theory clarified that plants allocate more biomass belowground with nutrient-limited conditions, whereas they transport more biomass aboveground with nutrient-rich conditions [25], which means plants altering the allocation of nutrient respond to environmental fluctuations to meet their own growth needs [52]. Our results do not reflect it, but the changes in PC and PN pools to the frequency of N addition were more focused on the belowground part of the plant. Our data suggest the importance of PC and PN pools to the C and N cycles, based on the background of global N deposition. We should more accurately predict the size of PC and PN pools in a typical grassland of northern China, for example, shifts in PC and PN pools at the individual level. Thus, it is of great significance for us to accurately evaluate C sink and realize “carbon neutralization”.
5. Conclusions
The C and N pools of the plant community are closely related to N input in natural grassland ecosystems. We found that the different N addition levels and the interaction with N addition frequencies had a significant effect on the PC and PN pools. However, the frequency of N addition had little effect on PC and PN pools in our study. Under different addition frequencies of N, the changes in PC and PN pools caused by N addition are regulated by different environmental factors in our study site. We suggest that the sustainable way to balance the utilization of plant nutrients is to apply a small amount of N fertilizer a number of times rather than a one-time application of a large amount of N fertilizer. Therefore, it is vital for us to understand the response of PC and PN pools and allocation methods to different frequencies of N addition which will provide important insights into the C and N nutrient cycle in the typical grasslands of northern China as well as the feedback of these ecological effects on future climate change.
Author Contributions
Data curation, J.S.; Resources, K.D.; Supervision, C.W. and K.D.; Writing—original draft, J.H. and J.S.; funding acquisition, K.D. and C.W. All authors have read and agreed to the published version of the manuscript.
Funding
This work was partially supported by the National Natural Science Foundation of China (31872406) and High Level Talents Project of Shanxi Agricultural University (2021XG008) and Shanxi Key Laboratory Project (202104010910017) and Research projects of Shanxi Province’s doctoral graduates and postdoctoral researchers working in Shanxi Province (SXBYKY2021053).
Institutional Review Board Statement
Not applicable.
Informed Consent Statement
Not applicable.
Data Availability Statement
Not applicable.
Acknowledgments
We thank Xingguo Han and Yunhai Zhang for establishing the experimental platform, Birong Liu, Yukun Luo and Jianping Sun for field and laboratory measurements and also Changhui Wang, Kuanhu D. and Andreas Wilkes for helping us with the English version of this manuscript. Requests for data sharing or any questions should be directed to Changhui Wang. (E-mail: [email protected]).
Conflicts of Interest
The authors declare no conflict of interest.
References
- Zhang, J.; Wang, X.J.; Wang, J.P.; Wang, W.X. Carbon and Nitrogen Contents in Typical Plants and Soil Profiles in Yanqi Basin of Northwest China. J. Integr. Agric. 2014, 133, 648–656. [Google Scholar] [CrossRef]
- Freschet, G.T.; Cornwell, W.K.; Wardle, D.A.; Elumeeva, T.G.; Liu, W.; Jackson, B.G.; Onipchenko, V.G.; Soudzilovskaia, N.A.; Tao, J.; Cornelissen, J.H.C.; et al. Linking litter decomposition of above- and below-ground organs to plant-soil feedbacks worldwide. J. Ecol. 2013, 1014, 943–952. [Google Scholar] [CrossRef]
- Julia, S.; Erich, T.; Dagmar, R.; Ingrid, L.; Sandra, L.; Matthew, R.T.; Manuela, B.; Nuria, A.; Matthias, D.; Loris, V.; et al. Effects of land use and climate on carbon and nitrogen pool partitioning in European mountain grasslands. Sci. Total Environ. 2022, 822, 153380. [Google Scholar] [CrossRef]
- Sardans, J.; Rivas-Ubach, A.; Peñuelas, J. Factors affecting nutrient concentration and stoichiometry of forest trees in Catalonia (NE Spain). Forest Ecol. Manag. 2011, 26211, 2024–2034. [Google Scholar] [CrossRef]
- Wang, D.; He, H.L.; Gao, Q.; Zhao, C.Z.; Zhao, W.Q.; Yin, C.Y.; Chen, X.L.; Ma, Z.L.; Li, D.D.; Sun, D.D.; et al. Effects of short-term N addition on plant biomass allocation and C and N pools of the Sibiraea angustata scrub ecosystem. Eur. J. Soil. Sci. 2017, 682, 212–220. [Google Scholar] [CrossRef]
- Li, Z.; Qiu, X.; Sun, Y.; Liu, X.; Hu, H.; Xie, J.; Chen, G.; Xiao, Y.; Tang, Y.; Tu, L. C:N:P stoichiometry responses to 10 years of nitrogen addition differ across soil components and plant organs in a subtropical Pleioblastus amarus forest. Sci. Total Environ. 2021, 796, 148925. [Google Scholar] [CrossRef]
- Galloway, J.N.; Townsend, A.R.; Erisman, J.W.; Bekunda, M.; Cai, Z.; Freney, J.R.; Martinelli, L.A.; Seitzinger, S.P.; Sutton, M.A. Transformation of the nitrogen cycle: Recent trends, questions, and potential solutions. Science 2008, 3205878, 889–892. [Google Scholar] [CrossRef] [Green Version]
- Yu, G.; Jia, Y.; He, N.; Zhu, J.; Chen, Z.; Wang, Q.; Piao, S.; Liu, X.; He, H.; Guo, X.; et al. Stabilization of atmospheric nitrogen deposition in China over the past decade. Nat. Geosci. 2019, 126, 424–429. [Google Scholar] [CrossRef]
- Lebauer, D.S.; Treseder, K.K. Nitrogen limitation of net primary productivity in terrestrial ecosystems is globally distributed. Ecology 2008, 892, 371–379. [Google Scholar] [CrossRef] [Green Version]
- Zhang, Y.; Feng, J.; Isbell, F.; Lu, X.; Han, X. Productivity depends more on the rate than the frequency of N addition in a temperate grassland. Sci. Rep. 2015, 5, 12558. [Google Scholar] [CrossRef]
- Lu, M.; Yang, Y.; Luo, Y.; Fang, C.; Zhou, X.; Chen, J.; Yang, X.; Li, B. Responses of ecosystem nitrogen cycle to nitrogen addition: A meta-analysis. New Phytol. 2011, 1894, 1040–1050. [Google Scholar] [CrossRef]
- Shen, H.; Dong, S.; Tommaso, A.; Li, S.; Xiao, J.; Yang, M.; Zhang, J.; Gao, X.; Xu, Y.; Zhi, Y.; et al. Eco-physiological processes are more sensitive to simulated N deposition in leguminous forbs than non-leguminous forbs in an alpine meadow of the Qinghai-Tibetan Plateau. Sci. Total Environ. 2020, 744, 140612. [Google Scholar] [CrossRef]
- Vourlitis, G.L. Aboveground net primary production response of semi-arid shrublands to chronic experimental dry-season N input. Ecosphere 2012, 33, 1–9. [Google Scholar] [CrossRef]
- Bai, Y.; Wu, J.; Clark, C.M.; Naeem, S.; Pan, Q.; Huang, J.; Zhang, L.; Guohan, X. Tradeoffs and thresholds in the effects of nitrogen addition on biodiversity and ecosystem functioning: Evidence from inner Mongolia Grasslands. Glob. Chang. Biol. 2010, 162, 889. [Google Scholar] [CrossRef]
- Dickson, T.L.; Mittelbach, G.G.; Reynolds, H.L.; Gross, K.L. Height and clonality traits determine plant community responses to fertilization. Ecology 2014, 95, 2443–2452. [Google Scholar] [CrossRef] [Green Version]
- Wang, R.; Zhang, Y.; He, P.; Yin, J.; Yang, J.; Liu, H.; Cai, J.; Shi, Z.; Feng, X.; Dijkstra, F.A.; et al. Intensity and frequency of nitrogen addition alter soil chemical properties depending on mowing management in a temperate steppe. J. Environ. Manag. 2018, 224, 77–86. [Google Scholar] [CrossRef]
- Zhang, Y.; Stevens, C.J.; Lü, X.; He, N.; Huang, J.; Han, X.; Allen, E. Fewer new species colonize at low frequency N addition in a temperate grassland. Funct. Ecol. 2015, 307, 1247–1256. [Google Scholar] [CrossRef] [Green Version]
- Giese, M.; Brueck, H.; Gao, Y.Z.; Lin, S.; Steffens, I.; Kögel-Knabne, T.; Gllindemann, A.; Susenbeth, F.; Taube, K.; Butterbach-bahl, X.H.; et al. N balance and cycling of Inner Mongolia typical steppe: A comprehensive case study of grazing effects. Ecol. Monogr. 2013, 83, 195–219. [Google Scholar] [CrossRef]
- Harpole, W.S.; Ngai, J.T.; Cleland, E.E.; Seabloom, E.W.; Borer, E.T.; Bracken, M.E.S.; Elser, J.J.; Gruner, D.S.; Hillebrand, H.; Shurin, J.B.; et al. Nutrient co-limitation of primary producer communities. Ecol. Lett. 2011, 14, 852–862. [Google Scholar] [CrossRef]
- Sardans, J.; Penuelas, J. The role of plants in the effects of global change on nutrient availability and stoichiometry in the plant-soil system. Plant Physiol. 2012, 1604, 1741–1761. [Google Scholar] [CrossRef] [Green Version]
- Yang, Y.; Liu, B.R.; An, S.-S. Ecological stoichiometry in leaves, roots, litters and soil among different plant communities in a desertified region of Northern China. Catena 2018, 166, 328–338. [Google Scholar] [CrossRef]
- Wang, D.; Chi, Z.; Yue, B.; Huang, X.; Zhao, J.; Song, H.; Yang, Z.; Miao, R.; Liu, Y.; Zhang, Y.; et al. Effects of mowing and nitrogen addition on the ecosystem C and N pools in a temperate steppe: A case study from northern China. Catena 2020, 185, 104332. [Google Scholar] [CrossRef]
- Diao, H.; Chen, X.; Zhao, X.; Dong, K.; Wang, C. Effects of nitrogen addition and precipitation alteration on soil respiration and its components in a saline-alkaline grassland. Geoderma 2022, 406, 115541. [Google Scholar] [CrossRef]
- Milchunas, D.G.; Lauenroth, W.K. Belowground primary production by carbon isotope decay and long-term root biomass dynamics. Ecosystems 2001, 42, 139–150. [Google Scholar] [CrossRef]
- Poorter, H.; Niklas, K.J.; Reich, P.B.; Oleksyn, J.; Poot, P.; Mommer, L. Biomass allocation to leaves, stems and roots: Meta-analyses of interspecific variation and environmental control. New Phytol. 2012, 1931, 30–50. [Google Scholar] [CrossRef]
- Sommer, M.Y. Effect of grazing on wind driven carbon and nitrogen ratios in the grasslands of Inner Mongolia. Catena 2008, 752, 182–190. [Google Scholar] [CrossRef]
- Chen, Z.Z. Topography and Climate of Xilin River Basin//Research on Grassland Ecosystem, 3rd ed.; Academia Sinica Inner Mongolia Grassland Ecosystem Research Station; Science Press: Beijing, China, 1988; pp. 13–22. [Google Scholar]
- Zhang, Y.; Loreau, M.; He, N.; Zhang, G.; Han, X. Mowing exacerbates the loss of ecosystem stability under nitrogen enrichment in a temperate grassland. Funct. Ecol. 2017, 318, 1637–1646. [Google Scholar] [CrossRef] [Green Version]
- Zhang, Y.; Loreau, M.; Lu, X.; He, N.; Zhang, G.; Han, X. Nitrogen enrichment weakens ecosystem stability through decreased species asynchrony and population stability in a temperate grassland. Glob. Chang. Biol. 2016, 224, 1445–1455. [Google Scholar] [CrossRef]
- Lü, X.T.; Lü, F.M.; Zhou, L.S.; Han, X.; Han, X.G. Stoichiometric response of dominant grasses to fire and mowing in a semi-arid grassland. J. Arid. Environ. 2012, 78, 154–160. [Google Scholar] [CrossRef]
- Mikajlo, I.; Pourrut, B.; Louvel, B.; Hynt, J.; Záhora, J. Plant-soil nitrogen, carbon and phosphorus content after the addition of biochar, bacterial inoculums and nitrogen fertilizer. J. Plant. Nutr. 2022, 12, 1–15. [Google Scholar] [CrossRef]
- Erisman, J.W.; Galloway, J.N.; Seitzinger, S.; Bleeker, A.; Dise, N.B.; Petrescu, A.M.; Leach, A.M.; de Vries, W. Consequences of human modification of the global nitrogen cycle. Philos. Trans. R. Soc. Lond. B Biol. Sci. 2013, 3681621, 20130116. [Google Scholar] [CrossRef] [PubMed] [Green Version]
- Duarte, B.; Santos, D.; Marques, J.C.; Cacador, I. Ecophysiological adaptations of two halophytes to salt stress: Photosynthesis, PS II photochemistry and anti-oxidant feedback--implications for resilience in climate change. Plant Physiol. Biochem. 2013, 67, 178–188. [Google Scholar] [CrossRef] [PubMed]
- Wang, C.; Butterbach-Bahl, K.; Han, Y.; Wang, Q.; Zhang, L.; Han, X.; Xing, X. The effects of biomass removal and N additions on microbial N transformations and biomass at different vegetation types in an old-field ecosystem in northern China. Plant Soil. 2010, 3401–3402, 397–411. [Google Scholar] [CrossRef]
- Wang, J.; Gao, Y.; Zhang, Y.; Yang, J.; Smith, M.D.; Knapp, A.K.; Eissenstat, D.M.; Han, X. Asymmetry in above- and belowground productivity responses to N addition in a semi-arid temperate steppe. Glob. Chang. Biol. 2019, 259, 2958–2969. [Google Scholar] [CrossRef]
- Jaman, M.S.; Wu, H.; Yu, Q.; Tan, Q.; Zhang, Y.; Dam, Q.K.; Muraina, T.O.; Xu, C.; Jing, M.; Jia, X.; et al. Contrasting responses of plant above and belowground biomass carbon pools to extreme drought in six grasslands spanning an aridity gradient. Plant Soil. 2022, 473, 167–180. [Google Scholar] [CrossRef]
- Shovon, T.A.; Rozendaal, D.; Gagnon, D.; Gendron, F.; Vetter, M.; Vanderwel, M.C. Plant communities on nitrogen-rich soil are less sensitive to soil moisture than plant communities on nitrogen-poor soil. J. Ecol. 2019, 108, 133–144. [Google Scholar] [CrossRef]
- Dukes, J.S.; Chiariello, N.R.; Cleland, E.E.; Moore, L.A.; Shaw, M.R.; Thayer, S.; Tobeck, T.; Mooney, H.A.; Field, C.B. Responses of grassland production to single and multiple global environmental changes. PLoS Biol. 2005, 310, e319. [Google Scholar] [CrossRef] [Green Version]
- Arndt, S.K.; Kahmen, A.; Arampatsis, C.; Popp, M.; Adams, M. Nitrogen fixation and metabolism by groundwater-dependent perennial plants in a hyperarid desert. Oecologia 2004, 1413, 385–394. [Google Scholar] [CrossRef]
- van den Berg, L.J.L.; Dorland, E.; Vergeer, P.; Hart, M.A.C.; Bobbink, R.; Roelofs, J.G.M. Decline of acid-sensitive plant species in heathland can be attributed to ammonium toxicity in combination with low pH. New Phytol. 2014, 166, 551–564. [Google Scholar] [CrossRef]
- Wang, B.; Gong, J.; Zhang, Z.; Yang, B.; Liu, M.; Zhu, C.; Shi, J.; Zhang, W.; Yue, K. Nitrogen addition alters photosynthetic carbon fixation, allocation of photoassimilates, and carbon partitioning of Leymus chinensis in a temperate grassland of Inner Mongolia. Agric. Forest Meteorol. 2019, 279, 107743. [Google Scholar] [CrossRef]
- Sun, Y.; Wang, C.; Chen, H.; Ruan, H. Responses of C:N stoichiometry in plants, soil, and microorganisms to nitrogen addition. Plant Soil. 2020, 456, 1–11. [Google Scholar] [CrossRef]
- Yue, K.; Peng, Y.; Fornara, D.A.; Meerbeek, K.V.; Vesterdal, L.; Yang, W.; Peng, C.; Tan, B.; Zhou, W.; Xu, Z.; et al. Responses of nitrogen concentrations and pool contents to multiple environmental change drivers: A meta-analysis across terrestrial ecosystems. Global. Ecol. Biogeogr. 2019, 28, 690–724. [Google Scholar] [CrossRef]
- Yue, K.; Peng, Y.; Peng, C.; Yang, W.; Peng, X.; Wu, F. Stimulation of terrestrial ecosystem carbon storage by nitrogen addition: A meta-analysis. Sci. Rep. 2016, 6, 19895. [Google Scholar] [CrossRef] [PubMed] [Green Version]
- Bai, W.; Sun, X.; Wang, Z.; Li, L. Nitrogen addition and rhizome severing modify clonal growth and reproductive modes of Leymus chinensis population. Plant Ecol. 2009, 2051, 13–21. [Google Scholar] [CrossRef]
- Zhang, Y.H.; He, N.P.; Zhang, G.M.; Huang, J.H.; Han, X. Nitrogen deposition and Leymus chinensis leaf chlorophyll content in Inner Mongolian grassland. Acta Ecol. Sin. 2013, 33, 6786–6794. [Google Scholar] [CrossRef]
- Midolo, G.; Alkemade, R.; Schipper, A.M.; Benítez-López, A.; Perring, M.P.; Vries, W.D. Impacts of nitrogen addition on plant species richness and abundance: A global meta-analysis. Glob. Ecol. Biogeogr. 2019, 28, 1–16. [Google Scholar] [CrossRef] [Green Version]
- Mao, Q.; Lu, X.; Wang, C.; Zhou, K.; Mo, J. Responses of understory plant physiological traits to a decade of nitrogen addition in a tropical reforested ecosystem. Forest Ecol. Manag. 2017, 401, 65–74. [Google Scholar] [CrossRef]
- Zhang, Y.; Lu, X.; Isbell, F.; Stevens, C.; Han, X.; He, N.; Zhang, G.; Yu, Q.; Huang, J.; Han, X. Rapid plant species loss at high rates and at low frequency of N addition in temperate steppe. Glob. Chang. Biol. 2014, 2011, 3520–3529. [Google Scholar] [CrossRef]
- Zhang, B.; Hautier, Y.; Tan, X.; You, C.; Cadotte, M.W.; Chu, C.; Jiang, L.; Sui, X.; Ren, T.; Han, X.; et al. Species responses to changing precipitation depend on trait plasticity rather than trait means and intraspecific variation. Funct. Ecol. 2020, 3412, 2622–2633. [Google Scholar] [CrossRef]
- Güsewell, S.; Bollens, U.; Ryser, P.; Klotzli, F. Contrasting effects of nitrogen, phosphorus and water regime on first- and second-year growth of 16 wetland plant species. Funct. Ecol. 2003, 17, 754–765. [Google Scholar] [CrossRef]
- Chapin, F.S., III; Bloom, A.J.; Field, C.B.; Waring, R.H. Plant responses to multiple environmental factors. Bioscience 1987, 37, 49–57. [Google Scholar] [CrossRef]
Figure 1.
Experimental site (a,b) and experimental design (c), each plot was treated with one of five different N addition levels of N addition, i.e., 0, 2, 10, 20 and 50 g N m−2 yr−1 (designated as N-0, N-2, N-10, N-20 and N-50, respectively), at one of two addition frequencies of N (twice a year (F2) vs. monthly (F12)).

Figure 2.
Effect of N addition levels and frequencies on the PAGC (a), PBGC (b), PC (c), PAGN (d), PBGN (e), and PN (f). Values are the means ± SE of four replications. F2 and F12 represent twice a year and once a month, respectively. Bars with different lowercase (a, b, c, d) and uppercase letters (A, B, C) are significantly different among N addition levels (p < 0.05). “*” indicated significant differences between the F2 and F12 with the same N addition level (p < 0.05).

Figure 3.
Effect of different frequencies of N addition on the soil NH4+-N concentration. (a) Soil NO3−-N concentration, (b) soil NH4+-N +NO3−-N concentration, (c) soil moisture and (d) pH, (e) soil pH under two different frequencies. Values are the means ± SE of four replications. Blue triangles with solid lines indicate 2 N additions yr−1 (F2). The red quadrilateral and dotted line indicate once a month (F12).

Figure 4.
The relationships between PAGC, PBGC, PC and soil NH4+-N concentration (a–c), soil NO3−-N concentration (d–f) and soil NH4+-N +NO3−-N concentration (g–i). Blue triangles with solid lines indicate 2 N additions yr−1 (F2). The red quadrilateral and dotted line indicate once a month (F12).
Figure 4.
The relationships between PAGC, PBGC, PC and soil NH4+-N concentration (a–c), soil NO3−-N concentration (d–f) and soil NH4+-N +NO3−-N concentration (g–i). Blue triangles with solid lines indicate 2 N additions yr−1 (F2). The red quadrilateral and dotted line indicate once a month (F12).

Figure 5.
The relationships between PAGN, PBGN, PN and soil NH4+-N concentration (a–c), soil NO3−-N concentration (d–f) and soil NH4+-N +NO3−-N concentration (g–i). Blue triangles with solid lines indicate 2 N additions yr−1 (F2). The red quadrilateral and dotted line indicate once a month (F12).
Figure 5.
The relationships between PAGN, PBGN, PN and soil NH4+-N concentration (a–c), soil NO3−-N concentration (d–f) and soil NH4+-N +NO3−-N concentration (g–i). Blue triangles with solid lines indicate 2 N additions yr−1 (F2). The red quadrilateral and dotted line indicate once a month (F12).

Figure 6.
The relationships between soil moisture content (SM) and PAGC (a), PBGC (b), PC (c), PAGN (d), PNGN (e) and PN (f). Blue triangles with solid lines indicate 2 N additions yr−1 (F2). The red quadrilateral and dotted line indicate once a month (F12).
Figure 6.
The relationships between soil moisture content (SM) and PAGC (a), PBGC (b), PC (c), PAGN (d), PNGN (e) and PN (f). Blue triangles with solid lines indicate 2 N additions yr−1 (F2). The red quadrilateral and dotted line indicate once a month (F12).

Figure 7.
The relationships between soil moisture, pH and PAGC (a), PBGC (b), PC (c), PAGN (d), plant PBGN (e) and PN (f). Blue triangles with solid lines indicate 2 N additions yr−1 (F2). The red quadrilateral and dotted line indicate once a month (F12).
Figure 7.
The relationships between soil moisture, pH and PAGC (a), PBGC (b), PC (c), PAGN (d), plant PBGN (e) and PN (f). Blue triangles with solid lines indicate 2 N additions yr−1 (F2). The red quadrilateral and dotted line indicate once a month (F12).


Table 1.
Results (F values) of two-way ANOVA testing the effects of N addition levels (N) and frequencies (F) on the C and N pool of plant aboveground, plant belowground and plant community (PAGC, PBGC, PC, PAGN, PBGN and PN).
Table 1.
Results (F values) of two-way ANOVA testing the effects of N addition levels (N) and frequencies (F) on the C and N pool of plant aboveground, plant belowground and plant community (PAGC, PBGC, PC, PAGN, PBGN and PN).
| PAGC | PBGC | PC | PAGN | PBGN | PN | |
|---|---|---|---|---|---|---|
| N | 16.27 *** | 6.21 * | 11.46 *** | 28.57 *** | 7.28 *** | 13.33 *** |
| F | 0.44 | 1.68 | 2.37 | 4.68 * | 1.12 | 2.52 |
| N × F | 0.69 | 4.41 | 4.77 * | 1.62 | 4.84 ** | 3.53 * |
Note: ‘*’, ‘**’ and ‘***’ represent p < 0.05, p < 0.01 and p < 0.001, respectively.
Table 2.
Results (F values) of two-way ANOVA testing the effects of N addition levels (N) and frequencies (F) on NH4+-N, NO3−-N, InN, soil moisture content (SM) and soil pH values.
Table 2.
Results (F values) of two-way ANOVA testing the effects of N addition levels (N) and frequencies (F) on NH4+-N, NO3−-N, InN, soil moisture content (SM) and soil pH values.
| NH4+-N | NO3−-N | InN | SM | pH | |
|---|---|---|---|---|---|
| N | 139.85 * | 90.10 *** | 182.77 *** | 13.35 *** | 2.46 |
| F | 2.99 | 11.26 *** | 1.74 | 0.69 | 0.01 |
| N × F | 4.44 ** | 6.07 ** | 7.11 *** | 4.11 *** | 0.16 |
Note: ‘*’, ‘**’ and ‘***’ represent p < 0.05, p < 0.01 and p < 0.001, respectively.
Publisher’s Note: MDPI stays neutral with regard to jurisdictional claims in published maps and institutional affiliations. |
© 2022 by the authors. Licensee MDPI, Basel, Switzerland. This article is an open access article distributed under the terms and conditions of the Creative Commons Attribution (CC BY) license (https://creativecommons.org/licenses/by/4.0/).
Share and Cite
MDPI and ACS Style
Hao, J.; Sun, J.; Dong, K.; Wang, C. Plant C and N Pools Improved by N Addition Levels but Not Frequencies in a Typical Grassland of Northern China. Atmosphere 2022, 13, 851. https://0-doi-org.brum.beds.ac.uk/10.3390/atmos13060851
AMA Style
Hao J, Sun J, Dong K, Wang C. Plant C and N Pools Improved by N Addition Levels but Not Frequencies in a Typical Grassland of Northern China. Atmosphere. 2022; 13(6):851. https://0-doi-org.brum.beds.ac.uk/10.3390/atmos13060851
Chicago/Turabian StyleHao, Jie, Jianping Sun, Kuanhu Dong, and Changhui Wang. 2022. "Plant C and N Pools Improved by N Addition Levels but Not Frequencies in a Typical Grassland of Northern China" Atmosphere 13, no. 6: 851. https://0-doi-org.brum.beds.ac.uk/10.3390/atmos13060851
Note that from the first issue of 2016, this journal uses article numbers instead of page numbers. See further details here.