
Effects of Air Pollution on Sunshine Duration Trends in Typical Chinese Cities
by
 ,
,
Wei Chong
1,2,* ,
,
Wenhua Lyu
1,2,*,
Jian Zhang
1,3,4,
Jing Liang
1,
Xiaotong Yang
1 and
Guoyu Zhang
1,3,4 1
School of Opto-Electronic Engineering, Changchun University of Science and Technology, Changchun 130022, China
2
Meteorological Observation Center, China Meteorological Administration, Beijing 100081, China
3
Key Laboratory of Opto-Electronic Measurement and Optical Information Transmission Technology, Ministry of Education, Changchun 130022, China
4
Jilin Province Engineering Research Center of Opto-Electronic Measurement and Control Instrumentation, Changchun 130022, China
*
Authors to whom correspondence should be addressed.
Atmosphere 2022, 13(6), 950; https://0-doi-org.brum.beds.ac.uk/10.3390/atmos13060950
Submission received: 13 May 2022
/
Revised: 5 June 2022
/
Accepted: 6 June 2022
/
Published: 10 June 2022
(This article belongs to the Special Issue Air Pollution in China)
Abstract
:Long-term trends in sunshine duration in Chinese cities have been closely linked to factors caused by air pollution. To understand this impact on sunshine duration (SD), surface solar radiation from 1981 to 2020, annual PM2.5 concentration from 2012 to 2020 and air pollution index (API) data from 2013 to 2020 collected in ten representative cities in China were investigated, and the long-term relationship of SD with diffuse fraction (DF), aerosol option depth (AOD), annual PM2.5 concentration and API were analyzed. The results indicated that trends in SD varied across cities. SD decreased in seven of the ten selected cities’ stations in the past 40 years, and the annual mean SD decreased from −0.03 h d−1 per decade to −0.36 h d−1 per decade—particularly in the Beijing North China Plain, Shanghai and Wuhan stations in the Yangtze River delta, where the trend coefficients were lower than −0.5. Conversely, increases in varying degrees of SD were found in Kunming (0.38 h d−1 per decade), Guangzhou and Shenyang in Southwest, South and Northeast China, respectively—with the biggest trend coefficient of 0.54 in Kunming. In addition to the SD variation, the DF in the ten city stations increased continuously from 1981 to 2010 and then declined after 2010, which is closely related to decreases in the annual PM2.5 concentration after 2012. The correlation coefficients between DF and SD ranged from −0.04 to −0.62, validating their negative relationship and the slight increasing trend in SD in recent ten years. The annual averages for SD and the DF plateaued in the 2010s due to the stringent pollution controls established by the Chinese government after 2010. Furthermore, the correlation coefficients between SD and the API ranged from −0.12 to −0.58, demonstrating a negative relationship between SD and the API.
1. Introduction
Over the past decades, China has become one of the most rapidly industrialized and urbanized countries worldwide. The growing population and intensified anthropogenic activities have led to the continuous increase in anthropogenic pollutant emissions in China. Moreover, the exacerbation of air pollution through aerosol radiative forcing has highly affected the radiation balance of the surface-atmosphere system. As an important indicator of solar radiation, sunshine duration (SD)—defined by the World Meteorological Organization (WMO) in 1989—is “the sum of the time for which the direct solar irradiance exceeds 120 W·m−2” [1]. As SD reflects the solar energy absorbed from the sun, it has become an important thermodynamic factor for large-scale atmospheric movements [2,3]. Small changes in SD may have a tremendous impact on weather and climate [4,5,6]. However, with the increase of anthropogenic aerosol loading in the atmosphere, the absorption and scattering of solar radiation by aerosols intensifies the reduction of surface solar radiation [7]. In addition, acting as cloud condensation nuclei, aerosol particles enhance the longevity of clouds and their reflection of extraterrestrial radiation, further reducing SD [8]. Therefore, it is of great significance to study the effect of air pollution on SD.
Several studies have focused on the impact of air pollution on long-term trends in sunshine duration and solar radiation. Fu et al. found that in large cities and medium-sized cities throughout China, due to extensive anthropogenic activities and the air pollution represented by aerosol optical depth (AOD) and tropospheric column NO2 (TroNO2), sunny SD presented with a decrease of −0.13 h d−1 per decade from 1960 to 2005 [9,10]. Bartoszek et al. researched the relationships between cloudiness, aerosol optical thickness, and sunshine duration in Poland from 1980 to 2018; they found a growing trend in area-average values of relative sunshine duration in each season of the year with reductions in aerosol optical thickness [11]. Wang et al. analyzed the spatiotemporal changes of surface solar radiation over East China during 2000–2016, pointing out that aerosol-induced radiation reduction could result in about a mean 6.74% reduction in rice yield over East China [12]. Chen et al. analyzed trends in global radiation and sunshine hours at 51 stations during 1961–1998 in mainland China and found decreasing trends in global radiation at 47 stations, with 42 stations showing a reduced trend in sunshine hours [13]. Song et al. reported that SD in eastern China decreased throughout the year at an annual rate of −0.132 h d−1 per decade during 1961–2014, suggesting that urbanization and industrialization may be responsible [14]. Kaiser and Qian reported an average decrease of approximately 1% per decade in possible SD in China from 1954 to 1998 and proposed that the increased atmospheric anthropogenic aerosol loading due to growing fossil fuel combustion accounted for the decline in SD [15]. Liao et al. pointed out that the attenuation of visibility and SD was consistent during 1980–2012 in South China and suggested that increases in pollutants are responsible for sunlight obstruction and reductions in visibility [16]. Wang et al. investigated the long-term trends in surface solar radiation from 1960 to 2000 in China and found that surface solar radiation in most regions of China began to increase after 1990, which was attributed to decreases in cirrus and cirrostratus clouds [17]. Qi et al. reported that the interannual trends and variations of surface solar radiation decreased in both East and West China during 1961–2010, and suggested that aerosol pollutants were the main factor causing the reduction of surface solar radiation in East China [18]. Furthermore, they determined that an abrupt change occurring in the early 1990s, followed by a sustained increase—possibly due to the Chinese government’s environmental protection plans [18]. The abovementioned studies improve our understanding of air pollution related to changes in SD. However, most of these studies have focused on the influence of air pollution on trends in solar radiation separately, rather than combined with SD, or the impacts have only covered limited land areas or weather conditions. Discussion of the influence of air pollution on long-term SD trends in representative cities of China under all weather conditions are rare in previous studies.
In this study, we examined SD and related solar radiation data from ten typical cities in different climate regions over China from 1981 to 2020, mainly focusing on the long-term trends in and associations between SD, the diffuse fraction (DF), annual PM2.5 concentration and the air pollution index (API)—which is related to increases in anthropogenic aerosols. This paper aims to provide an improved understanding of SD changes influenced by severe environmental issues that have occurred during the industrialization and urbanization caused by China’s reform and opening policy of 1980. The present article is organized as follows: Section 2 introduces the data source and the methods. Section 3 presents interannual SD trends and seasonal SD trends from 1981 to 2020, followed by discussions of the relationships between SD changes and the DF and API. The main conclusions are presented in Section 4.
2. Methodology
2.1. Data
The SD and solar radiation data were collected from ten China Meteorological Radiation Data International Exchange Stations located in seven climate regions in mainland China [19] (Figure 1), with station information shown in Table 1. Daily SD, global solar radiation and diffuse radiation were measured simultaneously from 1981 to 2020—except for Shanghai, from 1991 to 2020. SD was measured using a Jordan Sunshine Recorder with an absolute error of ±0.1 h and global solar radiation and diffuse radiation were measured horizontally using a thermopile-based pyranometer with a relative error of ±2%. The daily data were archived at the National Meteorological Information Center of China Meteorological Administration (http://data.cma.cn/, accessed on 31 August 2021). The annual and seasonal averages of SD and solar radiation deduced from daily data were analyzed. In this study, spring, summer, autumn and winter corresponded to March–May, June–August, September–November and December–February, respectively.
The DF and clearness index (CI) are introduced in this article. The DF is defined as the ratio of diffuse radiation to global solar radiation and is an important indicator of the global transmissivity of the atmosphere. The clearness index, which varies primarily due to cloud cover and cloud type, is the ratio of global solar radiation to extraterrestrial radiation. To obtain the clearness index, the equation for calculating the extraterrestrial radiation (MJ/m2) on a horizontal surface, , is as follows [20,21]:
where is the solar constant (1367 W m−2), is the day number of the year—starting from January 1— is the latitude of the station in degrees, is the declination of the sun in degrees and is the sunrise hour angle in degrees. and can be obtained by Equations (2) and (3) [20,21]:
To ensure the quality of the SD and solar radiation data, some quality control criteria were applied to the daily data. The criteria included: (1) daily collections were rejected if either SD or solar radiation was missing; (2) only daily collections meeting 0 < DF < 1 and 0 < CI < 1 simultaneously were used; (3) the month was rejected if more than ten days of SD or solar radiation were missing in that month.
API is a dimensionless parameter describing the comprehensive conditions of urban environmental air quality. The higher the API, the more serious the comprehensive pollution. API includes six pollutants: SO2, NO2, PM10, PM2.5, CO and O3; it is calculated using the sub-index of the six pollutants derived from daily or monthly average concentrations. The equations are as follows:
where Ii is the sub-index of the ith pollutant of the six pollutants, Ci is the concentration of the ith pollutant of the six pollutants; when the ith pollutant is either SO2, NO2, PM10 or PM2.5, Ci is the monthly mean concentration; when the ith pollutant is either CO or O3, Ci is the concentration at a specific percentile. Si is the secondary standard of the ith pollutant; when the ith pollutant is either SO2, NO2, PM10 or PM2.5, Si is the secondary standard for the annual mean; when the ith pollutant is CO, Si is the secondary standard for the daily mean; and when the ith pollutant is O3, Si is the secondary standard for the 8 h mean.
The monthly API data used in this study were obtained from the China National Environmental Monitoring Centre (http://www.cnemc.cn/jcbg/kqzlzkbg/, accessed on 31 August 2021); however, the data consistent with the SD and global solar radiation stations are only available from January 2013 to August 2020 because the observation starting time and data were unavailable for this study. In addition, the annual PM2.5 concentration data from 2012 to 2020 were used in this study, which were obtained from the Tracking Air Pollution in China website: http://tapdata.org.cn/ (accessed on 11 May 2022).
2.2. Methods
The linear regression method was used to analyze the inclination of climatic elements over a long time scale. To evaluate inclination, we established the unary linear regression equation between the SD () and time series (, year), where is the regression constant and is the regression coefficient—namely, the inclination rate. Both and can be calculated using the least square method. b > 0 indicates that increases with an increase in time ; on the contrary, b < 0 means decreases as time increases.
A moving average was introduced to investigate the SD trends in this study. For a climate element series, its moving average series can be depicted using Equation (6):
where stands for the number of years, is the moving average of SD, k is the step length and ith is the sequence of the step length. From the curve of the moving average, we can see whether the climate variable is increasing or decreasing, which helps determine the turning point of the climate variable.
We also analyzed the trend coefficient , which is defined as a correlation coefficient between the climatic element series and the time series, and can be expressed as in Equation (7) [10]:
where denotes the number of years, is the year sequence, is the element value in the year, represents the mean of all the element values in years and is equal to . If , the element increases during years, whereas if , the trend in the element declines during n years; means no change. Furthermore, correlation and fitting analyses were used in our study.
3. Results and Discussion
3.1. Trends in Sunshine Duration from 1981 to 2020
Figure 2 shows the spatial distribution of the trend coefficients of SD for the ten stations over China from 1981 to 2020. SD trend coefficients are presented in Table 2. There was a clear decline in SD at seven stations, but not in Kunming, Guangzhou and Shenyang—located in Southwest, South and Northeast China, respectively. Owing to its environment and high altitude, Kunming showed a significant increase in SD, with a trend coefficient greater than 0.5. Guangzhou, thanks to its being an inshore region in southeast China and its advanced technology and tertiary industry, had a positive trend coefficient of 0.21. The trend coefficient of Shenyang was 0.03; hence, the increase in SD in this region was minimal. In contrast, stations in the other representative cities in China showed a decreasing trend in SD. The Beijing, Shanghai and Wuhan stations had trend coefficients lower than −0.5. Notably, in Beijing and Shanghai, the trend coefficients were both less than −0.6, which were attributed to their larger population densities and levels of anthropogenic pollution due to urbanization.
Through a regression analysis of the daily average SD, a ranking of the cities with decreasing SD trends can be obtained: Lanzhou < Chengdu < Urumqi < Wuhan < Harbin < Beijing < Shanghai, ranging from −0.03 h d−1 per decade to −0.36 h d−1 per decade. Increasing trends in SD were found in Kunming, Guangzhou and Shenyang, with the biggest increasing trend of 0.38 h d−1 per decade in Kunming. The regression equations are listed in Table 2.
Setting the step length k as 5 years, the moving average curves of the annual daily mean SD of the ten stations are shown in Figure 3. Except for obvious upward trends in Kunming and Guangzhou and a weak upward trend in Shenyang, downward trends in the SD of the other seven stations can be observed from Figure 3—which is consistent with the results of the linear analysis and trend analysis. Moreover, except for the turning points of Urumqi and Harbin in 2015 and Shenyang in 2006, inflection points in the SD of most stations could be identified at around 2010.
Figure 4 shows the seasonal trends in SD from 1981 to 2020. Consistently, the changes in SD in the studied cities exhibited a similar variation. The overall SD decreased in 1981–2010 and started increasing after 2010. This fall–rise trend might be due to environmental protection measures taken by the Chinese government over the past decade. In Shanghai, Wuhan and Chengdu, SD trends seasonally varied in fall–rise and rise–fall patterns. This was primarily due to the climate characteristics of spring and winter in these areas, which are not conducive to the diffusion of pollutants, further reducing the solar radiation reaching the ground, and consequently reducing SD.
3.2. DF and SD Trends
Generally, DF is an important indicator of levels of diffuse radiation, which are closely related to the aerosol content in the air, and can uncover the effects of pollutants on SD measurements. The correlation coefficients between DF and SD, listed in Table 2, ranged from −0.04 to −0.62, indicating that there was a negative relationship between the DF and SD. Therefore, sunshine duration decreased when diffuse radiation increased, and vice versa.
However, the bar graph of the DF trend coefficients shown in Figure 5 provides a different perspective. Long-term trend coefficients of DF during 1981 to 2020 were both positive and negative, with no distinct relationship between SD and the DF. According to the previous analysis on seasonal trends in SD, most SD trends took 2010 as the node—first decreasing and then increasing. We recalculated the trend coefficients of DF according to the 2010 node. From Figure 5, the DF trend coefficients of all the studied stations were positive before 2010 and negative from 2011 to 2020. This indicates that the diffuse radiation component increased continuously from 1981 to 2010, and began to decrease after 2010, just contrary to the seasonal trends in SD depicted in Section 3.1.
The opposite trend observed between SD and DF might be closely related to anthropogenic emissions. To understand the impact of the anthropogenic emissions on the relationship between SD and DF, AOD, as an important physical property of particle pollutants, is introduced to validate the negative correlation. The spatial–temporal variation and trends in MERRA-2 AOD over China from 1980 to 2017 have been analyzed by Sun et al. [22]. High AOD values mainly appeared in agglomerations such as the North China Plain (the city cluster of Beijing–Tianjin–Hebei), Pearl River Delta (the city cluster of Guangzhou–Shenzhen–Zhuhai), Yangtze River delta (the city cluster of Shanghai–Nanjing–Wuhan) and part of the Sichuan Basin (the city cluster of Chengdu), while low AOD values mainly appeared in western China. The annual Mean MERRA-2 AOD of the whole of China showed a slight increase from the 1980s to the 1990s, a sharp increase from 2001 to 2010 and a decrease from 2010 to 2017—which is almost identical to the trends and turning points of the DF and SD. Furthermore, He et al. [23] investigated the AOD spatial–temporal distribution during 2003 to 2016 throughout China. Their statistical results showed that high AOD values mainly occurred in developed agglomerations; the overall annual mean AOD showed a declining trend of −0.0018 per year from 2004 to 2016 over the whole of China. A remarkable upward trend of 0.012 year−1 from 2003 to 2008 and a significant decrease from 2008 to 2016 could be found; the turnaround appeared in 2008, which is adjacent to the inflection point of the SD and DF at around 2010. Obviously, the variation in AOD had a good positive correlation with the DF, and an evident negative correlation with SD. The possible reason for this might be that the surged anthropogenic emissions could lead to an increase in aerosols and AOD; through scattering and absorbing, a large number of aerosols will increase the diffuse radiation in the atmosphere and reduce the direct radiation reaching the ground—thus reducing the SD. Regarding the turning point shown in the SD, DF and AOD trends, this is most likely due to the Chinese government taking a series of stringent pollution controls from around 2010.
In this study, we took annual PM2.5 concentration as an example to investigate the influence of anthropogenic emissions on the relationship between SD and DF. As the particle concentration data from throughout China before 2012 are not available, we could only illustrate the spatial distributions in annual PM2.5 concentrations during 2012 to 2020 in Figure 6—which correlate well with the trends in SD and DF after 2010 and are consistent with previous studies [22,23]. From 2012, high concentrations of PM2.5 have been distributed over the North China Plain (the city cluster of Beijing–Tianjin–Hebei), Yangtze River delta (the city cluster of Shanghai–Nanjing–Wuhan), Northeast Plain (the city cluster of Shenyang–Jilin–Harbin), Northwest Plateau (the city cluster of Xi’an–Lanzhou–Urumqi) and Sichuan Basin (the city cluster of Chengdu). All these regions are the fastest developing areas in China. However, the interannual trend in PM2.5 concentration is getting better year by year. This is likely to be closely related to the Air Pollution Prevention and Control Action Plan (2013–2017) and the Blue Sky Protection Campaign (2018–2020), implemented since 2013. According to statistical studies, the Air Pollution Prevention and Control Action Plan reduced the annual population-weighted mean PM2.5 from 62.5 μg/m3 in 2013 to 44.4 μg/m3 in 2017, and the Blue Sky Protection Campaign further reduced PM2.5 concentrations to 33.1 μg/m3 in 2020 [24,25,26]. The decrease in anthropogenic aerosols resulted in a decrease in the DF, which further increased the solar radiation reaching the ground and raised SD. Correspondingly, except for Urumqi—which had a decreasing trend of SD before 2015—the other nine cities had an overall decrease before 2010; after that, the SD trends of the cities rose gradually, which is consistent with the analysis results in Figure 5, validating the negative relationship between SD and DF related to the concentrations of aerosol particles.
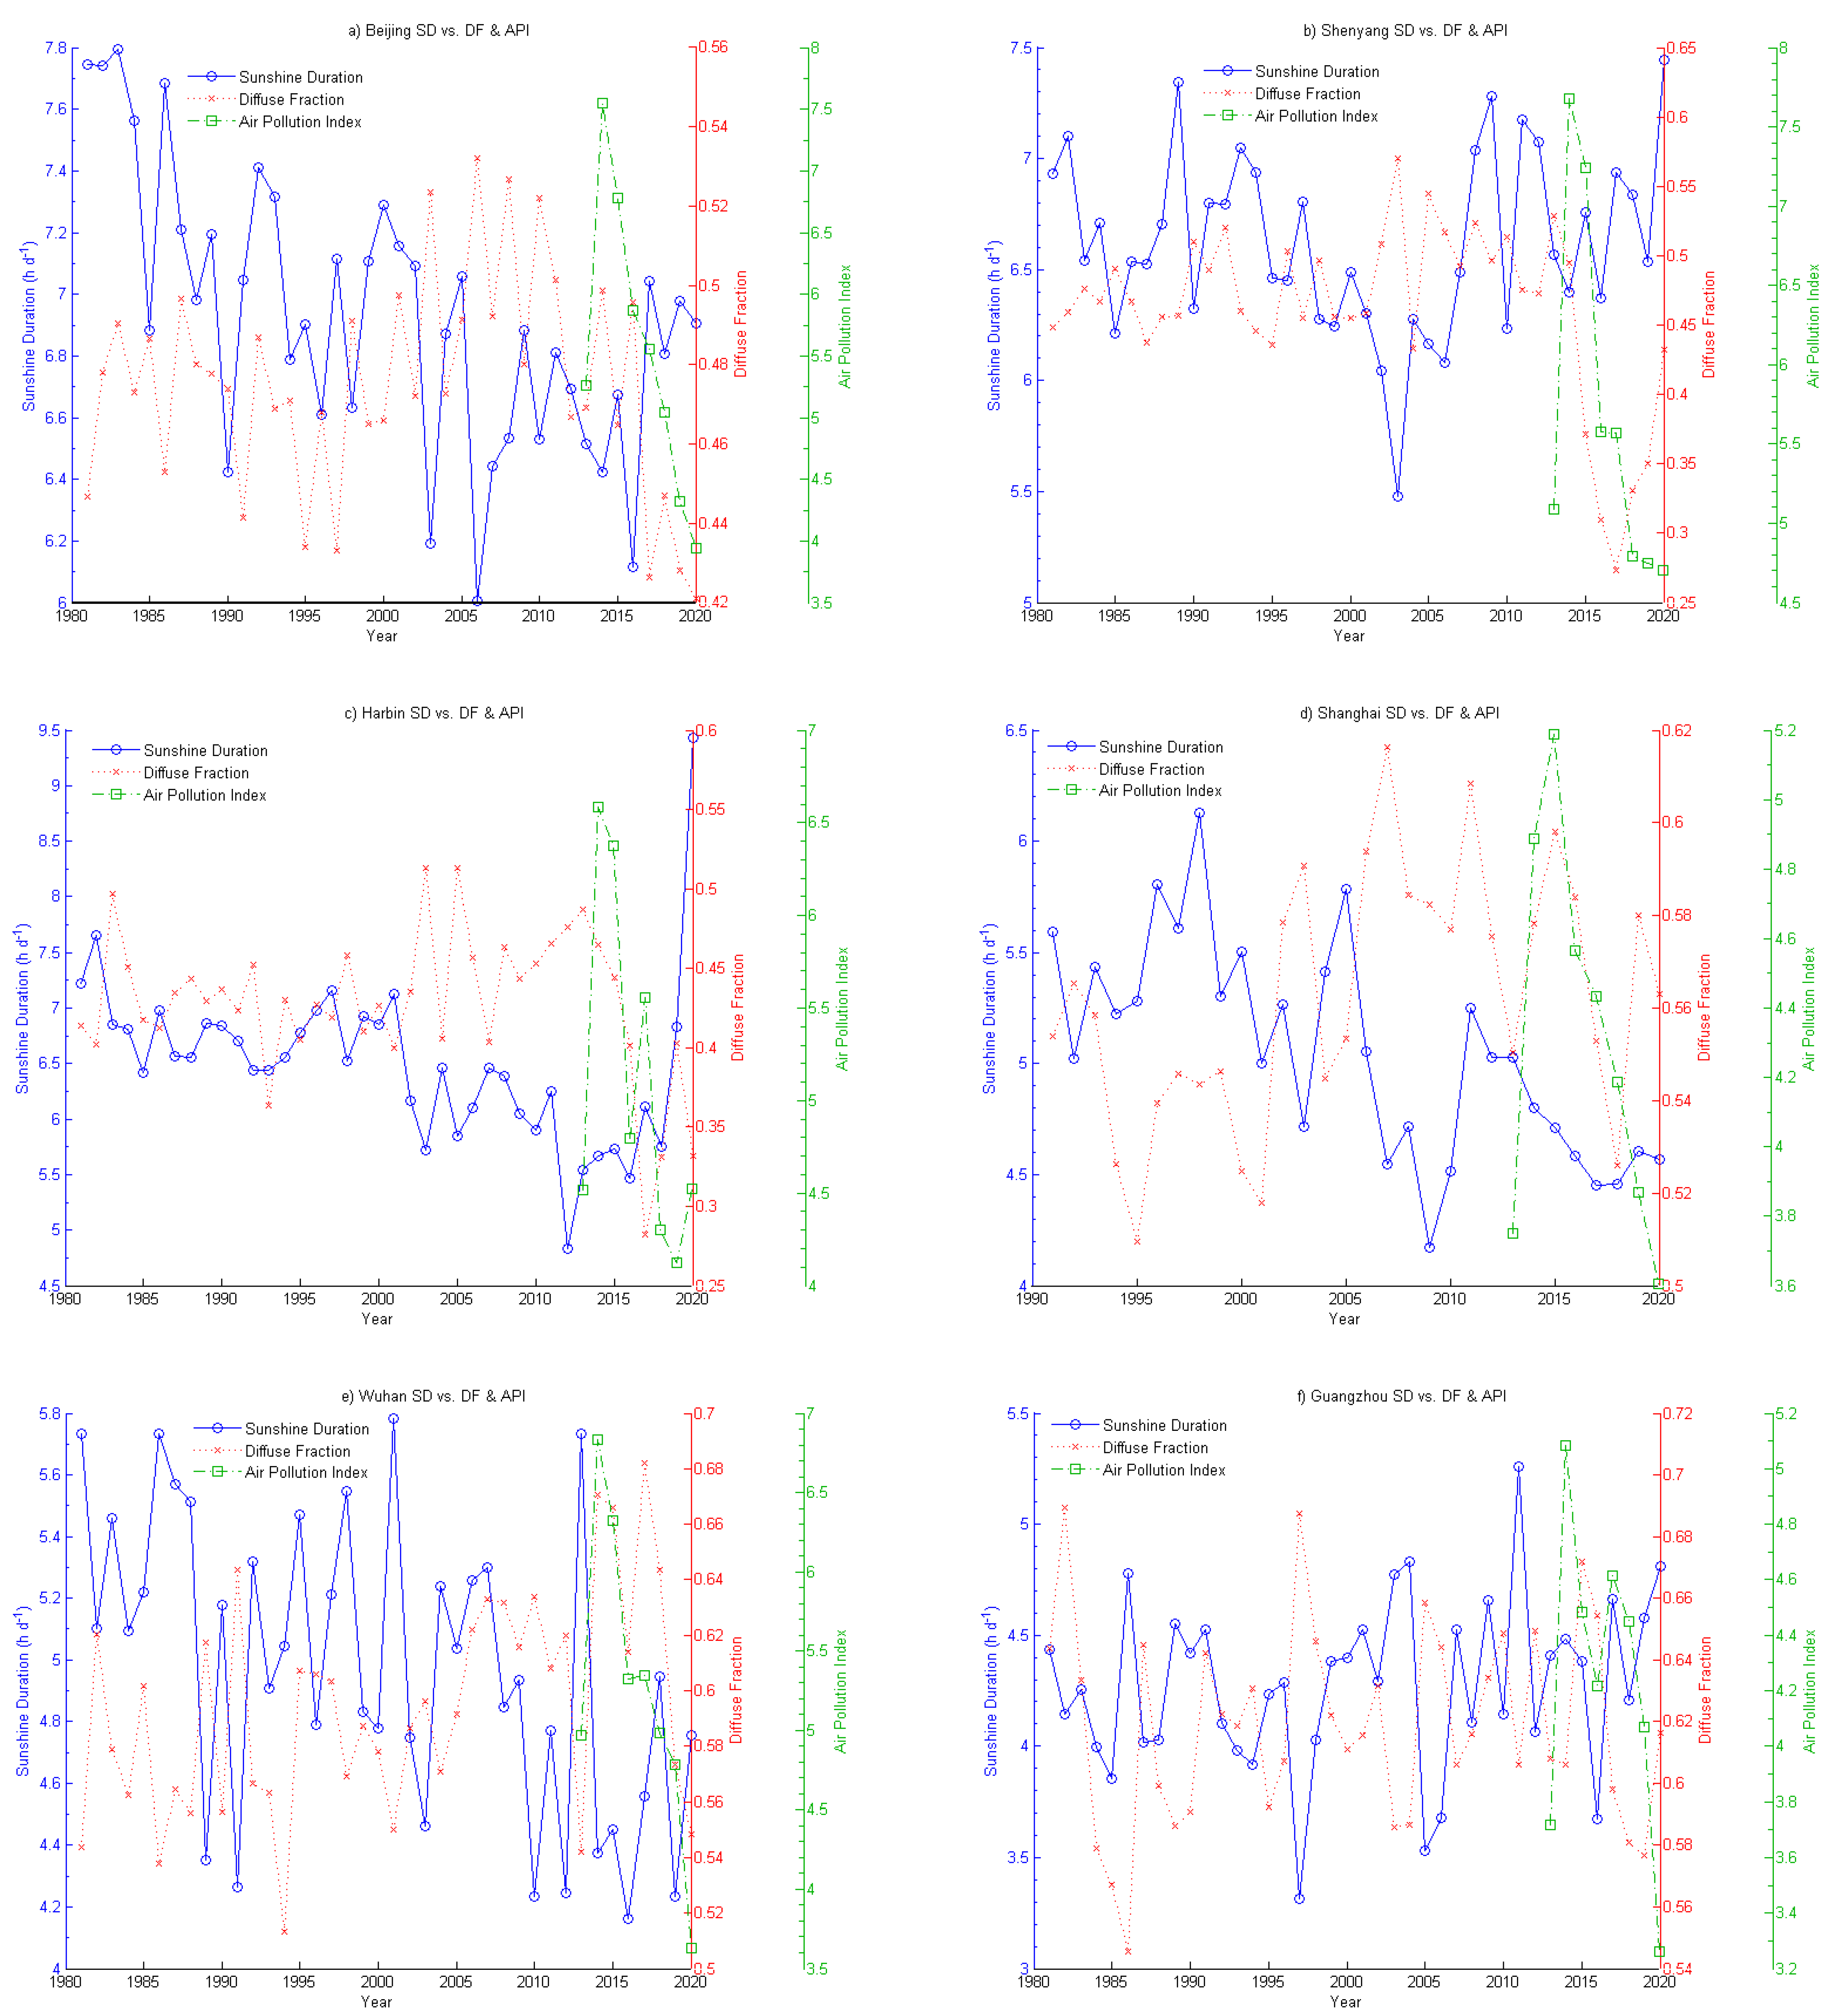
3.3. Connections between API and SD Trends
Figure 7 displays the time series of the annual mean API from 2013 to 2020. A negative correlation was observed between SD and API, which confirms that light pollution will result in high SD. Furthermore, sharp decreases in API were observed after 2015 for all stations, along with a slight improvement in SD during this period. This might correlate with pollution controls such as supersessions in polluting industrial equipment and enterprises, and reductions in emissions of sulfur and nitrogen oxides from large plants.
Using only the available API data, the correlation coefficients between SD and the API were calculated and listed in Table 3, ranging from −0.12 to −0.58. Correlation coefficients of less than −0.3 could be found in the urban agglomerations in North China Plain, Yangtze River delta, Northeast Plain, and Northwest Plateau, this is supported by the distribution of annual PM2.5 concentration across China.
4. Conclusions
In this study, the SD, surface solar radiation, PM2.5 concentration and API data from ten China Meteorological Radiation Data International Exchange Stations in ten representative cities were collected to examine the trends between DF and SD from 1981 to 2020, PM2.5 concentration and SD from 2012–2020, and API and SD from 2013–2020. Our analysis indicates that solar radiation and SD are associated closely with aerosol pollutants due to urbanization and industrialization.
Overall, SD decreased in seven of the ten selected cities’ stations from 1981 to 2020, with a decreasing rate of −0.03 h d−1 per decade to −0.36 h d−1 per decade—notable in Beijing, Shanghai and Wuhan, where trend coefficients were lower than −0.5. By contrast, SD increased in Kunming, Guangzhou and Shenyang, with the largest trend coefficient of 0.54 and the largest increasing rate of 0.38 h d−1 per decade in Kunming. Seasonal trends in SD showed a fluctuating decrease in SD from 1981 to 2010 and increases from 2011 to 2020. In contrast to the seasonal trends in SD, the DF trend coefficients suggested that diffuse radiation increased continuously from 1981 to 2010, peaking in the 2010s and decreasing after 2010. The correlation coefficients between DF and SD ranged from −0.04 to −0.62, validating the negative relationship between DF and SD—this was supported by the improvement in annual PM2.5 concentrations due to the stringent pollution controls in place since 2013 throughout China. Furthermore, the correlation coefficients ranging from −0.12 to −0.58 demonstrated a negative relationship between SD and API; sharp decreases in API were observed after 2015 for the ten typical cities’ stations and slight improvements in SD during this period were found which accounted for the pollution impact on SD trends from the other side.
Because many factors can affect the transmission of solar radiation in the atmosphere, some factors might not have been accounted for in this study. SD and diffuse radiation are not only affected by air pollution, but also by clouds. As cloud coverage data are not available for this study, we only adopted the clearness index related to the cloud cover, without analyzing the relationship between SD and cloud cover. We will further explore the influence of clouds on SD in subsequent studies.
Author Contributions
Conceptualization, W.C.; methodology, W.C.; software, W.C.; validation, W.L. and G.Z.; investigation, X.Y.; resources, J.L.; data curation, W.C.; writing—original draft, W.C.; writing—review and editing, J.Z.; supervision, W.L.; project administration, W.L.; funding acquisition, J.Z and G.Z. All authors have read and agreed to the published version of the manuscript.
Funding
This research was funded by the Youth Fund of the National Natural Science Foundation of China, grant number 61805027; the Jilin Scientific and Technological Development Program, grant number 20190302124GX; and the Innovation Fund of the Changchun University of Science and Technology, grant number XJJLG-2018-02.
Institutional Review Board Statement
Not applicable.
Informed Consent Statement
Not applicable.
Data Availability Statement
The daily SD and solar radiation data were collected from ten China Meteorological Radiation Data International Exchange Stations, located in Mainland China; the data were archived at the National Meteorological Information Center of China Meteorological Administration (http://data.cma.cn/, accessed on 31 August 2021); The monthly API data used in this study were provided openly and freely by the China National Environmental Monitoring Centre (http://www.cnemc.cn/jcbg/kqzlzkbg/, accessed on 31 August 2021). The annual PM2.5 concentration data were obtained from Tracking Air Pollution in China (http://tapdata.org.cn/, accessed on 11 May 2022).
Acknowledgments
The authors are grateful to the staff at the investigated stations for collecting the sunshine duration and air pollution data used in our research, and the National Meteorological Information Centre of China Meteorological Administration and National Environmental Monitoring Centre of China for providing these archived data. Figure 6 is cited from http://tapdata.org.cn, accessed on 11 May 2022; the authors also appreciate the support of the TAP team (Tracking Air Pollution in China) for producing Figure 6.
Conflicts of Interest
The authors declare no conflict of interest.
References
- World Meteorological Organization (WMO). Guide to Instruments and Methods of Observation, 2018th ed.; Part I. WMO-No. 8; World Meteorological Organization: Geneva, Switzerland, 2018; pp. 299–310.
- Meehl, G.A.; Arblaster, J.M.; Matthes, K.; Sassi, F.; van Loon, H. Amplifying the pacific climate system response to a small 11-year solar cycle forcing. Science 2009, 325, 1114–1118. [Google Scholar] [CrossRef] [PubMed] [Green Version]
- Yu, L.; Zhang, M.; Wang, L.C.; Qin, W.; Lu, Y.; Li, J. Clear-sky solar radiation changes over arid and semi-arid areas in China and their determining factors during 2001–2015. Atmos. Environ. 2020, 223, 117198. [Google Scholar] [CrossRef]
- Qi, Y.; Fang, S.B.; Zhou, W.Z. Correlative analysis between the changes of surface solar radiation and its relationship with air pollution, as well as meteorological factor in East and West China in recent 50 years. Acta Physiol. Sin. 2015, 64, 089201. [Google Scholar] [CrossRef]
- Richard, A. Climate change. Joining forces to pump up a variable sun’s climate effects. Science 2009, 325, 1058–1059. [Google Scholar] [CrossRef]
- Makade, R.G.; Jamil, B. Statistical analysis of sunshine based global solar radiation (GSR) models for tropical wet and dry climatic Region in Nagpur, India: A case study. Renew. Sustain. Energy Rev. 2018, 87, 22–43. [Google Scholar] [CrossRef]
- Zhao, J.F.; Kong, X.N.; He, K.J.; Xu, H.; Mu, J. Assessment of the radiation effect of aerosols on maize production in China. Sci. Total Environ. 2020, 720, 137567. [Google Scholar] [CrossRef]
- Fan, J.L.; Wu, L.F.; Zhang, F.C.; Cai, H.; Wang, X.; Lu, X.; Xiang, Y. Evaluating the effect of air pollution on global and diffuse solar radiation prediction using support vector machine modeling based on sunshine duration and air temperature. Renew. Sustain. Energy Rev. 2018, 94, 732–747. [Google Scholar] [CrossRef]
- Fu, C.B.; Dan, L. Influence of intensified air pollution on the sunny diffuse radiation fraction in China. Chin. Sci. Bull. 2018, 63, 2655–2665. [Google Scholar] [CrossRef] [Green Version]
- Fu, C.B.; Dan, L.; Chen, Y.L.; Tang, J. Trends of the sunshine duration and diffuse radiation percentage on sunny days in urban agglomerations of China during 1960–2005. J. Environ. Sci. 2015, 34, 206–211. [Google Scholar] [CrossRef]
- Bartoszek, K.; Matuszko, D.; Soroka, J. Relationships between cloudiness, aerosol optical thickness, and sunshine duration in Poland. Atmos. Res. 2020, 245, 105097. [Google Scholar] [CrossRef]
- Wang, Y.Y.; Meng, Z.; Lyu, R.; Huang, G.; He, Q.; Cheng, T. Spatiotemporal changes of surface solar radiation: Implication for air pollution and rice yield in East China. Sci. Total Environ. 2020, 739, 140361. [Google Scholar] [CrossRef] [PubMed]
- Chen, R.S.; Kang, E.S.; Ji, X.B.; Yang, J.; Zhang, Z. Trends of the global radiation and sunshine hours in 1961–1998 and their relationships in China. Energy Convers. Manag. 2006, 47, 2859–2866. [Google Scholar] [CrossRef]
- Song, Z.Y.; Chen, L.T.; Wang, Y.J.; Liu, X.; Lin, L.; Luo, M. Effects of urbanization on the decrease in sunshine duration over eastern China. Urban Clim. 2019, 28, 100471. [Google Scholar] [CrossRef]
- Kaiser, D.P.; Qian, Y. Decreasing trends in sunshine duration over China for 1954–1998: Indication of increased haze pollution? Geophys. Res. Lett. 2002, 29, 2042. [Google Scholar] [CrossRef]
- Liao, W.H.; Wang, X.M.; Fan, Q.; Zhou, S.; Chang, M.; Wang, Z.; Wang, Y.; Tu, Q. Long-term atmospheric visibility, sunshine duration and precipitation trends in South China. Atmos. Environ. 2015, 107, 204–216. [Google Scholar] [CrossRef]
- Wang, C.H.; Zhang, Z.F.; Tian, W.S. Factors affecting the surface radiation trends over China between 1960 and 2000. Atmos. Environ. 2011, 45, 2379–2385. [Google Scholar] [CrossRef]
- Qi, Y.; Fang, S.B.; Zhou, W.Z. Variation and spatial distribution of surface solar radiation in China over recent 50 years. Acta Ecol. Sin. 2014, 34, 7444–7453. [Google Scholar]
- Zhang, J.; Lin, Z. Climate in China; Technology Publishing Company: Shanghai, China, 1985; pp. 467–506. (In Chinese) [Google Scholar]
- Duffie, J.A.; Beckman, W.A. Solar Engineering of Thermal Processes, 3rd ed.; John Wiley & Sons, Inc.: New Jersey, NJ, USA, 2006; pp. 9–45. [Google Scholar]
- Li, H.; Ma, W.; Lian, Y.; Wang, X.; Zhao, L. Global solar radiation estimation with sunshine duration in Tibet, China. Renew. Energy 2011, 36, 3141–3145. [Google Scholar] [CrossRef]
- Sun, E.; Xu, X.; Che, H.; Tang, Z.; Gui, K.; An, L.; Lu, C.; Shi, G. Variation in MERRA-2 aerosol optical depth and absorption aerosol optical depth over China from 1980 to 2017. J. Atmos. Solar-Terr. Phys. 2019, 186, 8–19. [Google Scholar] [CrossRef]
- He, Q.; Gu, Y.; Zhang, M. Spatiotemporal patterns of aerosol optical depth throughout China from 2003 to 2016. Sci. Total Environ. 2019, 653, 23–35. [Google Scholar] [CrossRef]
- Geng, G.; Xiao, Q.; Liu, S.; Liu, X.; Cheng, J.; Zheng, Y.; Xue, T.; Tong, D.; Zheng, B.; Peng, Y.; et al. Tracking Air Pollution in China: Near Real-Time PM2.5 Retrievals from Multisource Data Fusion. Environ. Sci. Technol. 2021, 55, 12106–12115. [Google Scholar] [CrossRef] [PubMed]
- Xiao, Q.; Zheng, Y.; Geng, G.; Chen, C.; Huang, X.; Che, H.; Zhang, X.; He, K.; Zhang, Q. Separating emission and meteorological contribution to PM2.5 trends over East China during 2000–2018. Atmos. Chem. Phys. 2021, 21, 9475–9496. [Google Scholar] [CrossRef]
- Xiao, Q.; Geng, G.; Cheng, J.; Liang, F.; Li, R.; Meng, X.; Xue, T.; Huang, X.; Kan, H.; Zhang, Q.; et al. Evaluation of gap-filling approaches in satellite-based daily PM2.5 prediction models. Atmos. Environ. 2021, 244, 117921. [Google Scholar] [CrossRef]
Figure 1.
Locations of the ten investigated stations and their climate conditions. NC for North China, NE for Northeast China, CC for Central China, SC for South China, SW for Southwest China, EA for Eastern arid regions, WA for Western arid/semi-arid regions, TP for the Tibetan plateau.
Figure 1.
Locations of the ten investigated stations and their climate conditions. NC for North China, NE for Northeast China, CC for Central China, SC for South China, SW for Southwest China, EA for Eastern arid regions, WA for Western arid/semi-arid regions, TP for the Tibetan plateau.

Figure 2.
Trend coefficients of SD from 1981 to 2020 for the ten selected stations.

Figure 3.
Moving average of the daily mean sunshine duration per year.

Figure 4.
Seasonal trends in SD from 1981 to 2020 for the ten selected stations. (a) Seasonal trends in SD for Beijing; (b) Seasonal trends in SD for Shenyang; (c) Seasonal trends in SD for Harbin; (d) Seasonal trends in SD for Shanghai; (e) Seasonal trends in SD for Wuhan; (f) Seasonal trends in SD for Guangzhou; (g) Seasonal trends in SD for Chengdu; (h) Seasonal trends in SD for Kunming; (i) Seasonal trends in SD for Urumqi; (j) Seasonal trends in SD for Lanzhou.

Figure 5.
Trend coefficients of DF from 1981 to 2020 for the ten selected stations.

Figure 6.
The spatial distributions of annual PM2.5 concentrations from 2012 to 2020 (Source: http://tapdata.org.cn, accessed on 11 May 2022).
Figure 6.
The spatial distributions of annual PM2.5 concentrations from 2012 to 2020 (Source: http://tapdata.org.cn, accessed on 11 May 2022).

Figure 7.
Interannual changes in averaged SD, DF and API for the ten cities from 1981 to 2020. (a) For Beijing; (b) For Shenyang; (c) For Harbin; (d) For Shanghai; (e) For Wuhan; (f) For Guangzhou; (g) For Chengdu; (h) For Kunming; (i) For Urumqi; (j) For Lanzhou.
Figure 7.
Interannual changes in averaged SD, DF and API for the ten cities from 1981 to 2020. (a) For Beijing; (b) For Shenyang; (c) For Harbin; (d) For Shanghai; (e) For Wuhan; (f) For Guangzhou; (g) For Chengdu; (h) For Kunming; (i) For Urumqi; (j) For Lanzhou.


Table 1.
Geographical information of the investigated stations used in this study.
| Station Name | Longitude/E° | Latitude/N° | Altitude/m asl. | Climate Regions |
|---|---|---|---|---|
| Beijing | 116.47 | 39.81 | 32.8 | NC |
| Shenyang | 123.51 | 41.73 | 51.0 | NE |
| Harbin | 126.57 | 45.93 | 118.3 | NE |
| Shanghai | 121.44 | 31.39 | 5.5 | CC |
| Wuhan | 114.05 | 30.60 | 23.6 | CC |
| Guangzhou | 113.48 | 23.21 | 70.7 | SC |
| Chengdu | 103.86 | 30.75 | 547.7 | SW |
| Kunming | 102.65 | 25.01 | 1888.1 | SW |
| Urumqi | 87.65 | 43.78 | 935.0 | WA |
| Lanzhou | 104.14 | 35.87 | 1874.4 | EA |
Table 2.
Statistical summary of SD.
| Station | Mean (h d−1) | Std. (h d−1) | Trend Coefficient | Regression Equation | Correlation Coefficients of SD vs. DF |
|---|---|---|---|---|---|
| Beijing | 6.93 | 0.44 | −0.62 | y = −0.023x + 7.40 | −0.41 |
| Shenyang | 6.62 | 0.41 | 0.03 | y = 0.001x + 6.60 | −0.30 |
| Harbin | 6.50 | 0.74 | −0.34 | y = −0.022x + 6.95 | −0.40 |
| Shanghai | 5.05 | 0.48 | −0.70 | y = −0.036x + 5.64 | −0.44 |
| Wuhan | 4.98 | 0.48 | −0.51 | y = −0.021x + 5.41 | −0.59 |
| Guangzhou | 4.28 | 0.39 | 0.21 | y = 0.007x + 4.14 | −0.48 |
| Chengdu | 2.71 | 0.36 | −0.27 | y = −0.008x + 2.89 | −0.35 |
| Kunming | 6.13 | 0.81 | 0.54 | y = 0.038x + 5.36 | −0.53 |
| Urumqi | 7.77 | 0.53 | −0.39 | y = −0.018x + 8.14 | −0.04 |
| Lanzhou | 7.08 | 0.31 | −0.10 | y = −0.003x + 7.14 | −0.62 |
Table 3.
The correlation coefficients between SD and API.
| Station | Correlation Coefficients of SD vs. API |
|---|---|
| Beijing | −0.55 |
| Shenyang | −0.39 |
| Harbin | −0.33 |
| Shanghai | −0.32 |
| Wuhan | −0.37 |
| Guangzhou | −0.22 |
| Chengdu | −0.12 |
| Kunming | −0.17 |
| Urumqi | −0.33 |
| Lanzhou | −0.58 |
Publisher’s Note: MDPI stays neutral with regard to jurisdictional claims in published maps and institutional affiliations. |
© 2022 by the authors. Licensee MDPI, Basel, Switzerland. This article is an open access article distributed under the terms and conditions of the Creative Commons Attribution (CC BY) license (https://creativecommons.org/licenses/by/4.0/).
Share and Cite
MDPI and ACS Style
Chong, W.; Lyu, W.; Zhang, J.; Liang, J.; Yang, X.; Zhang, G. Effects of Air Pollution on Sunshine Duration Trends in Typical Chinese Cities. Atmosphere 2022, 13, 950. https://0-doi-org.brum.beds.ac.uk/10.3390/atmos13060950
AMA Style
Chong W, Lyu W, Zhang J, Liang J, Yang X, Zhang G. Effects of Air Pollution on Sunshine Duration Trends in Typical Chinese Cities. Atmosphere. 2022; 13(6):950. https://0-doi-org.brum.beds.ac.uk/10.3390/atmos13060950
Chicago/Turabian StyleChong, Wei, Wenhua Lyu, Jian Zhang, Jing Liang, Xiaotong Yang, and Guoyu Zhang. 2022. "Effects of Air Pollution on Sunshine Duration Trends in Typical Chinese Cities" Atmosphere 13, no. 6: 950. https://0-doi-org.brum.beds.ac.uk/10.3390/atmos13060950
Note that from the first issue of 2016, this journal uses article numbers instead of page numbers. See further details here.