Article

Winter Potato Water Footprint Response to Climate Change in Egypt

by
Amal Mohamed Abdel-Hameed
1,
Mohamed EL-Sayed Abuarab
1,*,
Nadhir Al-Ansari
2,*,
Hazem Sayed Mehawed
3,
Mohamed Abdelwahab Kassem
1,
Hongming He
4,
Yeboah Gyasi-Agyei
5 and
Ali Mokhtar
1,4
1
Department of Agricultural Engineering, Faculty of Agriculture, Cairo University, Giza 12613, Egypt
2
Civil, Environmental and Natural Resources Engineering, Lulea University of Technology, 97187 Lulea, Sweden
3
Irrigation and Drainage Department, Agricultural Engineering Research Institute, Giza 12613, Egypt
4
School of Geographic Sciences, East China Normal University, Shanghai 210062, China
5
School of Engineering and Built Environment, Griffith University, Nathan, QLD 4111, Australia
*
Authors to whom correspondence should be addressed.
Submission received: 20 May 2022 / Revised: 27 June 2022 / Accepted: 27 June 2022 / Published: 30 June 2022
(This article belongs to the Special Issue Agrometeorology)

Abstract

:
The limited amount of freshwater is the most important challenge facing Egypt due to increasing population and climate change. The objective of this study was to investigate how climatic change affects the winter potato water footprint at the Nile Delta covering 10 governorates from 1990 to 2016. Winter potato evapotranspiration (ETC) was calculated based on daily climate variables of minimum temperature, maximum temperature, wind speed and relative humidity during the growing season (October–February). The Mann–Kendall test was applied to determine the trend of climatic variables, crop evapotranspiration and water footprint. The results showed that the highest precipitation values were registered in the northwest governorates (Alexandria followed by Kafr El-Sheikh). The potato water footprint decreased from 170 m3 ton−1 in 1990 to 120 m3 ton−1 in 2016. The blue-water footprint contributed more than 75% of the total; the remainder came from the green-water footprint. The findings from this research can help government and policy makers better understand the impact of climate change on potato crop yield and to enhance sustainable water management in Egypt’s major crop-producing regions to alleviate water scarcity.

1. Introduction

Water use assessment is one of the most attractive topics in hydrological sciences because of climate change and water scarcity. Egypt is one of many arid countries where precipitation and groundwater contribute only 1.18 and 9.03%, respectively, to the annual water supply [1], the Nile River being the main source [2]. Total annual water from the Nile is 55.5 billion m3 [3], which represents 72.64% of Egypt’s annual water supply. Of this, the agricultural sector, which accounts for 12% of Egypt’s annual GDP, consumes 81.6% [4]. Water scarcity in not limited to Egypt: 1.8–2.9 billion people face severe water scarcity for 4–6 months of the year, and about half a billion people face severe water scarcity all year [5]. Meanwhile, the water consumption by intensive agriculture has shown an increasing trend during the last five decades in Egypt [6]. To preserve the quantity and quality of water, effective water management in arid regions has received more attention as has evaluation of agricultural water consumption.
During the past decade, several studies have assessed the impact of water shortage on crop yield, especially crop morphology and physiology [7,8,9,10]. However, there have been no investigations into the response of crop production to water shortages [9,11,12]. Several studies have investigated the effect on agriculture water resources and water use efficiency [13,14,15]. Climate change has had a profound effect on water usage and crop yield [16,17,18]. A climate change sensitivity analysis showed that a temperature rise of 1–4 °C decreased wheat yield by 17.6%. However, elevated atmospheric CO2 concentrations increased the yield and mitigated some of the negative temperature responses. A sea level rise of 2.0 m would reduce the extent of agricultural land on the North Nile Delta by ~60%, creating an additional challenge to wheat production [19]. Therefore, it is necessary to introduce a quantifiable indicator to measure the relationship between crop yield and water use [20,21]. To study the relationship between agricultural water consumption and water availability, several assessments have been conducted on water use efficiency, water scarcity and water footprint (WF).
Xu et al. [22] noted that water footprint, scarcity, and productivity are the main indicators for evaluating sustainable irrigated agriculture. However, it has been documented that WF is practical and more credible in comparison with the other methods [22,23,24]. It is a multi-dimensional measure of direct or indirect freshwater consumption by a producer or consumer and helps to analyze the relationship between water consumption and industry [25]. The WF comprises green and blue components that refer to precipitation and irrigation water, respectively. Based on the WF evaluation, the sustainability of water resources can be assessed, and the relationship between water consumption and crop yield can be evaluated [26]. Moreover, it can be assessed based on limited data on surplus water, deficit irrigation, and crop water consumption [27].
WF was originally introduced by Hoekstra [28], but the concept has been developed within the life-cycle assessment framework [29,30]. For example, in 2013 the international standard (ISO) reported that the WF is a useful indicator for measuring the water appropriated for human activity by assessing the amount consumed and the impact on water quality [31]. WF assessment involves data collection and development of inventory analyses to point out the relationship between water use and crop yield [32]. Thus, WF is a vital tool for representing both water-use and crop-production efficiency. Recently, the evapotranspiration colors of green and blue were introduced in agricultural water management assessment [33]. Green-water evapotranspiration (ETgreen) is the sum of rainwater stored in the soil that is available for crop evapotranspiration, which is similar to effective precipitation (Peff) [34]; blue-water evapotranspiration (ETblue) is the irrigation water drawn from groundwater aquifers and surface water during the growing seasons [35].
In Egypt, potatoes represent 18.90% of the total vegetable area planted. Annual production of 5.029 million tons represents 25.11% of Egypt’s total vegetable production [36]. Winter potatoes rank first in vegetable exports for a total value of USD 147.15 million or 5.18% of Egypt’s total 2016 agricultural exports [37,38,39].
Climate change in recent decades has affected crop yields and caused fluctuations in the WF over time. A few local studies have compared the temporal variation of the WF with crop yield [40,41,42,43]. Therefore, the aim of this study was to investigate the impact of climatic change on potato evapotranspiration and evaluate the response of the potato water footprint to climate change from 1990 to 2016.

2. Materials and Methods

2.1. Study Area

The Nile delta is a large region in northern Egypt that discharges into the eastern Mediterranean Sea. It accounts for nearly 2% of the total area of Egypt, with a cultivated area of 1.83 × 10⁶ ha. The study area covers 10 governorates (Alexandria, Al-Beheira, Al-Dakahlia, Damietta, Al-Gharbia, Al-Ismailia, Kafr El-Sheikh, Al-Monofia, Al-Qalyubia, and Al-Sharkia) as shown in Figure 1.
Table 1 shows the geographical coordinates and areas of the governorates, ranging from 30.2 to 31.55° N and 29.95 to 32.23° E, and at an altitude of −103 m below sea level to 490 m above sea level. During the summer, the delta records the highest temperatures in July and August reaching 34 °C. In winter, the temperature ranges from 9 to 19 °C. The annual rainfall is 100–200 mm, which generally occurs in winter, classifying Egypt as an arid region [44]. The agricultural sector consumes about 85% of the total freshwater. The potato was selected for this study as it is the most important winter crop and ranks as the most exported vegetable at the local level for quantity, importance, and usage in the food industry.
The potato variety in the study was Solanum tuberosum L. cv. Spunta. The tuber is characterized by a long oval shape, very shallow-to-shallow eye depth, very low dry matter, and high yield. The potatoes were sown at a depth of 10 cm in raised ridges prepared in the third week of October with a tuber and ridge spacing of 20 × 75 cm. The base width and height of the ridges were kept at 60 and 30 cm, respectively.

2.2. Data Sources

The historical daily data of maximum (Tmax) and minimum (Tmin) temperature, precipitation (P), wind speed (WS) and dew point (TDew) from 1990 to 2016 on a 0.5 × 0.5-degree grid were retrieved from NASA Prediction of Worldwide Energy Resources (https://power.larc.nasa.gov/data-access-viewer/, accessed on 15 April 2022) [45,46]. Potato yield data from 1990 to 2016 were collected from the agriculture directorates of the governorates, Economic Affairs Sector, Ministry of Agriculture and Land Reclamation.

2.3. Crop Evapotranspiration

The reference evapotranspiration (ETo) was based on the Penman–Monteith equation [47], which is recommended by the Food and Agriculture Organization (FAO) [48,49,50] and has been successfully used by Allen [51,52,53,54]. It is also the most widely used for water footprints [55,56,57]. The ETo calculator software (http://www.fao.org/land-water/databases-and-software/eto-calculator/en/, accessed on 15 April 2022) was used with meteorological data as inputs.
The calculation of the green and blue WFs followed the methods and procedures in the FAO Irrigation and Drainage Paper No. 56, which requires the calculation of the daily crop evapotranspiration (ETc, mm) and effective precipitation (Peff, mm) during the growing period [58]:
ET c = ET o K c
P eff = { P i ( 4.17 0.2 P i ) 4.17 P i < 8.3 4.17 + 0.1   P i P i 8.3 }
where Pi [mm] is the precipitation during the growth period (mm) and Kc is the crop coefficient.

2.4. Water Footprint Calculations

WF is divided into three classifications: green, blue and grey water [45]. Following the terminology of Hoekstra [28], the water footprint of the crop season (WFc) is the sum of the green ( WF green ) and blue ( WF blue   ) components and is generally expressed in m3 ton−1, which is equivalent to L kg−1 as:
WF tot =   WF green + WF blue  
WF green = CWR green Y
WF blue = CWR blue Y
where WFtot is the total water footprint m3 ton−1; Y is the crop yield (ton ha−1), and CWR is the crop water requirement (m3 ha−1). Even though, there are three types of WF, in our study we focused on the green and blue because we were working on a regional scale, and grey WF needs field measurements, which is difficult on a large scale.
The green and blue crop water requirements (CWRs) were calculated by the accumulated daily evapotranspiration (ET) over the whole growing period [55]:
CWR green = 10 ET green
CWR blue = 10 ET blue
where ET is the daily evapotranspiration (either green or blue) in (mm). ETgreen and ETblue, the green and blue crop water usage (CWU), were calculated by multiplying effective precipitation and evapotranspiration by 10 over the growing season.

2.5. Spatiotemporal Trend Analysis

The Mann–Kendall test was applied to determine the trend (monotonic upward or downward) of the climate parameters [48,58,59,60,61]. Inverse distance weighting (IDW) had the lowest mean error among the common interpolation methods. In this study, an IDW algorithm with highly variable data analysis was applied to arrive at the lowest mean error compared to common interpolation methods. As a moving average interpolator, it is usually applied to highly variable data. Furthermore, IDW was simple and quick because it did not require the preliminary modeling step of a variance distance relationship [48].

3. Results and Discussion

3.1. The Spatiotemporal Changes of Climate Variables (1990–2016)

Climatic variables are the most important factors influencing water resource management, and their temporal variations fluctuated over the study area from 1990 to 2016 (Figure 2). The lowest and highest seasonal values of effective precipitation were observed in 1990 (16 mm) and 2016 (82 mm), respectively.
Furthermore, the average seasonal effective precipitation was 35 mm year−1 with a decreasing trend of 0.5 mm decade−1. With respect to the minimum temperature, the lowest and highest recorded growing-season values were 2010 (11 °C) and 2011 (14 °C), respectively, which had a mean value of 13 °C. The minimum and maximum temperatures showed a significantly increasing trend of 0.01 °C decade−1 and 0.02 °C decade−1, respectively.
The highest wind speed of 3.5 m s−1 was recorded in the 1991 season, while the lowest value of 2.5 m/s was recorded in 1990, but a decreasing trend of −0.1 m s−1decade−1 was mild. Growing season relative humidity decreased from 65% in 1991 to 59% in 2014 with a slightly declining slope of 0.8% decade−1. The trend of ETc significantly increased at a rate of 7 mm decade−1 with significant fluctuations during the study period.
The spatial distribution of the climate parameters showed differences in effective rainfall between the northern and the southern study areas (see Figure 3a). The northern areas experienced larger variability. The northwest had a high rate of effective precipitation, particularly northeast of Alexandria, ranging from 68 to 100 mm, followed by the northern governorates of Kafr El-Sheikh (49–67 mm), and eastern Damietta (36–48 mm). On the other hand, the southern governorates (Al-Menoufia and Al-Qalyubia) had the lowest rate of effective precipitation (20–35 mm), as also reported by Elbeltagi et al. [34]. The maximum precipitation was observed in Alexandria during the winter (114.96 mm) followed by Kafr El-Sheikh (47 mm). Wind speed increased from 2.6 ms−1 in the southern governorates to 4.3 ms−1 in the northern (see Figure 3d). Interpolated data displayed the highest relative humidity in the Alexandria governorate of about 67% with the lowest value of 58% in the southern governorates (see Figure 3e). Significant increases in Tmax, and Tmin, as shown in Figure 3b,c, were the main factors for the increasing ETc as seen in Figure 3f. In addition, lower relative humidity and wind speed played a vital role in the decreasing trend of ETc from 1990 to 2016. The maximum value of ETc of 310 mm during the potato growing season occurred in the southern governorates followed by 290 mm in the middle governorates and the lowest value of 250 mm in the northern governorates. It was concluded that ETc increased from south to north as observed by Elbeltagi et al. [34].

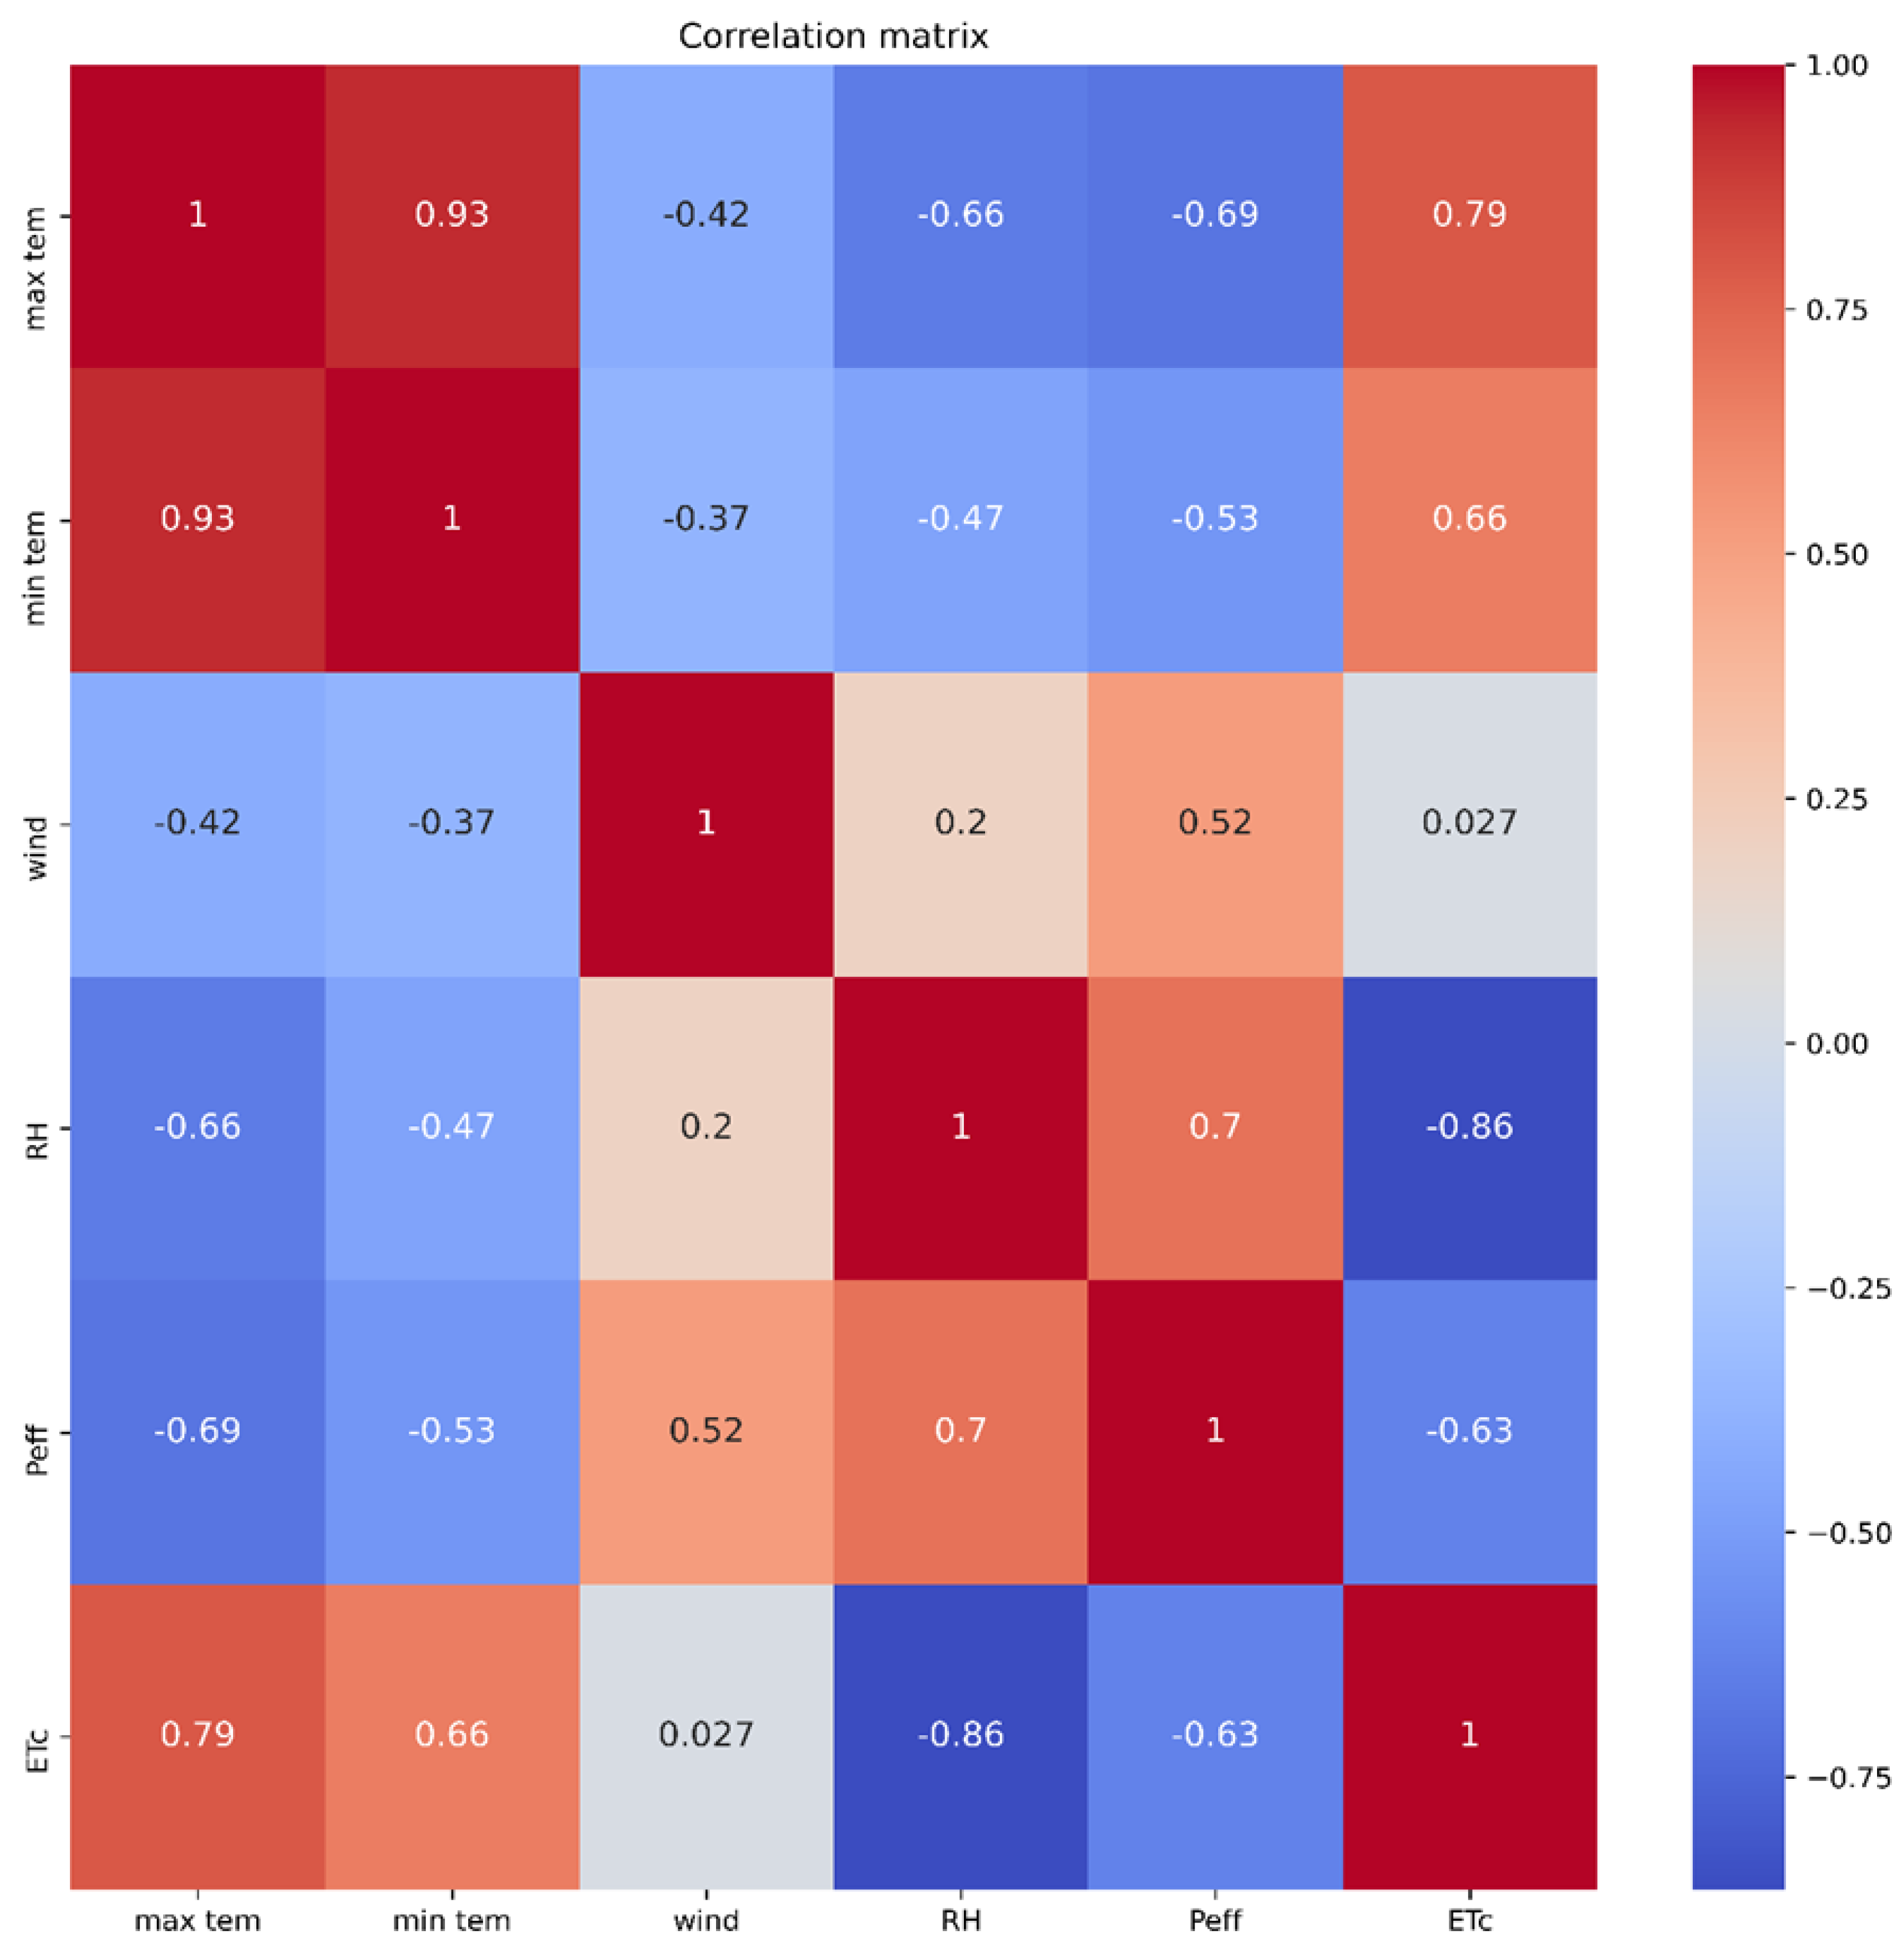
3.2. Response of ETc to Climate Parameters

The correlation coefficients between ETc and the climatic parameters (Tmax, Tmin and wind speed) were positive (Figure 4). The highest correlation coefficient was 0.79 between ETc and Tmax and 0.66 between ETc and Tmin, while wind speed had very low positive correlations with ETc. Because the growing period is in the winter, relative humidity and effective precipitation had low correlations with ETc. Relative humidity had the highest negative correlation coefficient of −0.86 with ETc, and the effective precipitation had the second- highest negative correlation coefficient of −0.63 with ETc. From an analysis of the correlation coefficients, all the climatic parameters had an impact on ETc, with Tmax having the highest, followed by Tmin and wind speed.
The results showed that changes in the rate of increase in Tmax and Tmin were greater than that of wind speed, which resulted in an increased change in ETc. Nevertheless, the meteorological parameters affected the spatial distribution of ETc [60,61]. A significant increase of Tmax, Tave, and Tmin, and decrease in relative humidity were the main reasons for the increased ETo [47]. Furthermore, potato production wsa strongly influenced by water availability, as the crop is very sensitive to water stress [62] as even brief periods affect both yield and tuber quality [63]. Any changes in climate, such as increased summer temperatures or changes in seasonal rainfall could have a dramatic impact on production and water requirements [64].

3.3. Potato Yield Variations from 1990 to 2016

Temporal changes in potato yield fluctuated over the study area, and changing the cropping areas was a main reason. As shown in Figure 5, all governorates reported the lowest yield during 1990–2000, but then increased gradually till 2016. The results showed that Alexandria recorded the highest yield (33.32 ton ha−1) in 2009 (Figure 5a), while for Al-Sharqiyah it was 34.986 ton ha−1 in 2003 (Figure 5b), followed by Kafr El-Sheikh (34.8 and 33.56 ton ha−1 in 2009 and 2013, respectively) and Al-Qalyubia with 34.75 ton ha−1 in 2016 (Figure 5c). For Damietta and Al-Menoufia, the lowest recorded potato yield of 10.71 ton ha−1 occurred in 1996 and 2015, respectively, while for Al-Qalyubia, it occurred in 2000.
Global potato production has increased by about 20% since 1990 although production is still 50% below that of wheat, maize, and rice [65]. Global production is skewed toward the northern hemisphere, especially Europe, which has around 50% of the global growing area and relatively high yields [65,66]. Asia is now catching up to Europe as a major producer, with India, Bangladesh, and China increasing yields and growing area [65]. Africa has also seen an increase in potato growing area since 1990 [65]. Temperature is the most important climatic variable determining duration, but the relationship of climate variables to duration in the developmental stages weakens after tuber initiation [67].

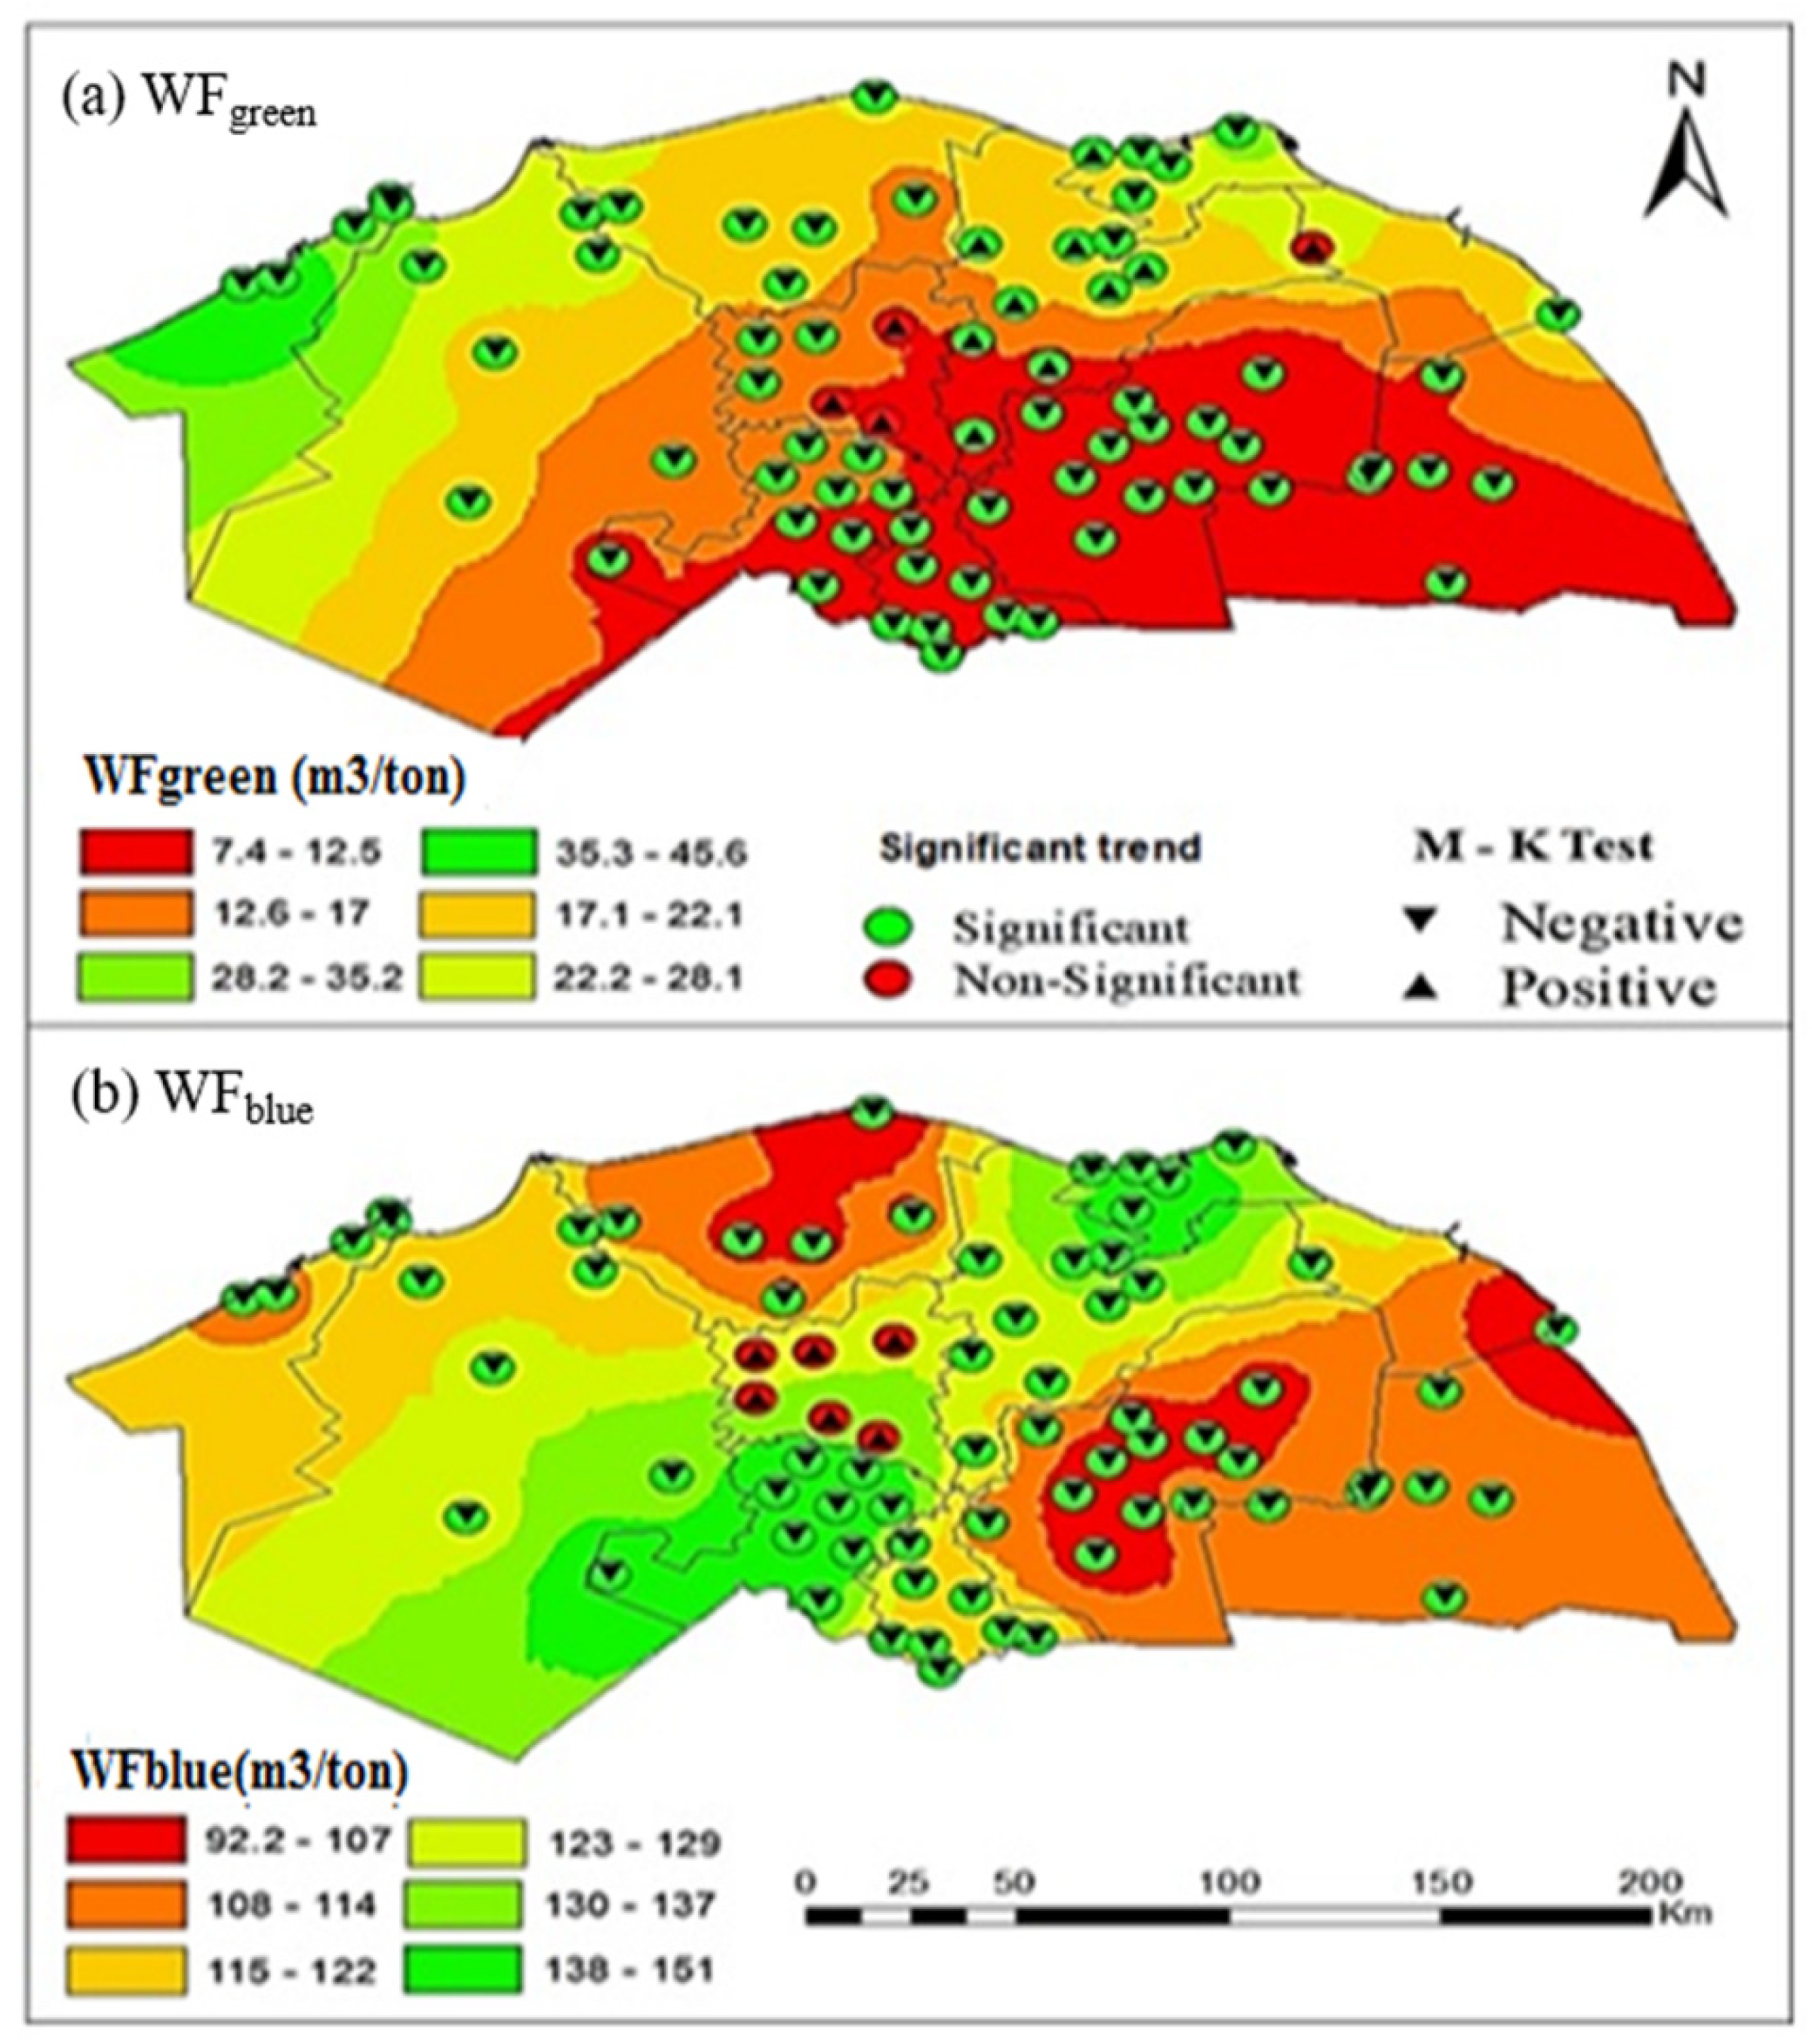
3.4. Spatiotemporal Distribution of the Agriculture Water Footprint

Alexandria had the greatest average green-water footprint from 1990 to 2016 due to its high rate of effective precipitation and lower potato yield. The green-water footprint was approximately 40 m3 ton−1. On the other hand, the governorates in the southern parts of the study areas recorded the lowest green-water footprint (~12 m3 ton−1) due to low precipitation rates (Figure 6a). Our estimated green WF (12 m3 ton−1) was a little lower than the estimated value (15.8 m3 ton−1) of [68]. This discrepancy might be explained by different climatic conditions. Green water is an important resource that needs to be taken into account to achieve better water-use sustainability in agricultural production [69,70]. It was observed that almost all of the stations in the governorates demonstrated significant trends. The maximum blue-water footprints in Damietta and Al-Menoufia were almost 150 m3 ton−1 due to the high crop water requirement and low yield, while the minimum was 100 m3 ton−1 in the middle of Al-Sharqiyah, Kafr El-Sheikh, and some areas of Al-Ismailiyah (Figure 6b). Our finding regarding WFblue was higher than that in the investigation of [71]. The global average consumptive blue WF for potatoes (33 m3 ton−1) comes from irrigated crop evapotranspiration. The results agreed with those of [72], who found a WF between 1 and 63 m3 ton−1 for WFgreen.
The difference in the blue and green WF estimates can be attributed to the different models used, study areas, and weather conditions. For example, the CROPWAT model was used by [73], whereas [40] used the water-balance approach. The WF of crop production depends on two factors: water use and yield. In the lower parts of the study area, the blue-crop water requirement was relatively high; at the same time, the green-crop water requirement was much lower, making the irrigation water one of the highest. The average potato water footprint was 150 m3 ton−1 (Figure 7a). The blue-water footprint contributed more than 75% of the total water footprint, while the green-water footprint contributed less than 30% (Figure 7b). In the life-cycle assessment-based methods of water footprints, the impact of green-water consumption is negligible because, regardless of the system, it is used by both production and natural ecosystems [74,75]. WFblue contributes a large percentage to the total water footprint of Egyptian crops [71].
The potato fields in all regions were nearly 100% irrigated, making the blue-water footprint high. In irrigated agriculture, blue water usually makes a significant contribution to total water consumption, the largest being in arid and semi-arid regions [76]. There was a strong negative relation (R2 value = 0.84) between productivity yield and WF, which showed a significant increasing trend of 2.9 m3 ton−1 (Figure 8). These findings were consistent with the work of [71], who documented that the WF of a specific crop depends mainly on agricultural management, not agroclimatic factors. The field experiments of Brauman et al. [77] reported that using high-yield cultivars increased crop-water productivity and caused a decline in water consumption [77]. Increased crop yields were responsible for the significant reductions in the WF of crops [41]. Figure 9a explains that the highest blue-water footprint in Damietta and Al-Menoufia was the result of decreased yield and low crop evapotranspiration. Although Al-Sharqiyah recorded the largest crop evapotranspiration value, its blue-water footprint was the lowest because it had the highest yield. Alexandria has the largest green-water footprint as a result increased effective precipitation, while Al-Qalyubia had the lowest green-water footprint because of very low effective precipitation and high yield. According to previous studies, a decrease in WF is more significantly related to increased yields than to minimum evapotranspiration [76,77,78].
Figure 9b shows that as the crop yield increased the total water footprint decreased. The year 2016 achieved the minimum total water footprint because of high yield. To sustain blue-water resources, water use should be increased in both irrigated and rainfed areas to improve crop yields.

4. Conclusions

The water footprint of crops is one means of integrated water management as it helps save water to obtain the highest efficiency of use and the highest return from one cubic meter of water. Therefore, this study investigated the impact of climate change on potato yield and water footprint in the Nile Delta, Egypt, from 1990 to 2016.
Among the main conclusions, the spatial distribution of the climate parameters showed that the highest precipitation was reported in Alexandria followed by Kafr El-Sheikh during the winter. By contrast, the maximum ETc was recorded in the southern followed by the middle governorates, and the lowest was in the northern governorates.
The potato water footprint in the Nile Delta decreased from 170 m3 ton−1 in 1990 to 120 m3 ton−1 in 2016. The blue-water footprint contributed more than 75% of the total water footprint, while the green-water footprint contributed less than 25%. The decrease in the potato water footprint in the Nile valley was the result of a shift from surface irrigation to pressurized irrigation, especially pivot irrigation.
Because of its importance as an industrial and export crop to investors, potato growing has been allocated large areas of land in the desert backwater of the Delta governorates. However, pressurized irrigation allows for great control of the amount of water and fertilizer used. Together with the effective use of mechanization, the quantity and quality of production increased; water loss was lower; and the water footprint of the winter potato crop was reduced.
The findings from this research can help the government and policy makers to mitigate the impact of climate change on crop yield and enhance sustainable water resource management in Egypt for major crop-production regions.

Author Contributions

A.M.A.-H. and A.M. collected and analyzed the research data and wrote the draft manuscript. A.M.A.-H. and A.M. designed the research and provided suggestions regarding data analysis. A.M. generated the figures in the main manuscript. M.E.-S.A., H.S.M., M.A.K. and Y.G.-A. read and edited the draft and final manuscript with suggested changes. N.A.-A., H.H. revised the final manuscript. All authors have read and agreed to the published version of the manuscript.

Funding

This research received no external funding.

Institutional Review Board Statement

This study was approved by the Agricultural Engineering Research Institute, Agricultural Research Center, and the author certify that this study was performed in accordance with the ethical standards as laid down in the 1964 Declaration of Helsinki and its later amendments or comparable ethical standards. The participants provided their written informed consent to participate in this study.

Informed Consent Statement

Informed consent was obtained from all subjects involved in the study.

Data Availability Statement

The original contributions presented in the study are included in the article, further inquiries can be directed to the corresponding authors.

Acknowledgments

The authors would like to express their thanks to the Agricultural Engineering Research Institute and Faculty of Agriculture, Cairo University, for the financial support this work.

Conflicts of Interest

The authors declare no conflict of interest.

References

  1. Zilitinkevich, S. National Security and Human Health Implications of Climate Change; NATO Science for Peace and Security Series C: Environmental Security; Springer: Berlin, Germany, 2012. [Google Scholar]
  2. Xu, Y.; Yu, L.; Zhao, Y.; Feng, D.; Cheng, Y.; Cai, X.; Gong, P. Monitoring cropland changes along the Nile River in Egypt over past three decades (1984–2015) using remote sensing. Int. J. Remote Sens. 2017, 38, 4459–4480. [Google Scholar] [CrossRef]
  3. Aquastat, F. Food and Agriculture Organization of the United Nations (FAO). 2017. Available online: https://www.fao.org/aquastat/en/ (accessed on 15 April 2022).
  4. Usman, M.; Anwar, S.; Yaseen, M.R.; Makhdum, M.S.A.; Kousar, R.; Jahanger, A. Unveiling the dynamic relationship between agriculture value addition, energy utilization, tourism and environmental degradation in South Asia. J. Public Aff. 2021, e2712. [Google Scholar] [CrossRef]
  5. Zhuo, L.; Hoekstra, A.Y.; Wu, P.; Zhao, X. Monthly blue water footprint caps in a river basin to achieve sustainable water consumption: The role of reservoirs. Sci. Total Environ. 2019, 650, 891–899. [Google Scholar] [CrossRef] [PubMed] [Green Version]
  6. Hockett, R.C.; Omarova, S.T. Private wealth and public goods: A case for a national investment authority. J. Corp. Law 2017, 43, 437. [Google Scholar] [CrossRef] [Green Version]
  7. Bolat, I.; Dikilitas, M.; Ikinci, A.; Ercisli, S.; Tonkaz, T. Morphological, physiological, biochemical characteristics and bud success responses of myrobolan 29 c plum rootstock subjected to water stress. Can. J. Plant Sci. 2016, 96, 485–493. [Google Scholar] [CrossRef]
  8. Jiménez, S.; Dridi, J.; Gutiérrez, D.; Moret, D.; Irigoyen, J.J.; Moreno, M.A.; Gogorcena, Y. Physiological, biochemical and molecular responses in four Prunus rootstocks submitted to drought stress. Tree Physiol. 2013, 33, 1061–1075. [Google Scholar] [CrossRef]
  9. Kulak, M.; Ozkan, A.; Bindak, R. A bibliometric analysis of the essential oil-bearing plants exposed to the water stress: How long way we have come and how much further? Sci. Hortic. 2019, 246, 418–436. [Google Scholar] [CrossRef]
  10. Ma, X.; Ma, F.; Li, C.; Mi, Y.; Bai, T.; Shu, H. Biomass accumulation, allocation, and water-use efficiency in 10 Malus rootstocks under two watering regimes. Agrofor. Syst. 2010, 80, 283–294. [Google Scholar] [CrossRef]
  11. Radwan, A.; Kleinwächter, M.; Selmar, D. Impact of drought stress on specialised metabolism: Biosynthesis and the expression of monoterpene synthases in sage (Salvia officinalis). Phytochemistry 2017, 141, 20–26. [Google Scholar] [CrossRef]
  12. Gupta, S.; Gupta, N. High temperature induced antioxidative defense mechanism in seedlings of contrasting wheat genotypes. Indian J. Plant Physiol. 2005, 10, 73. [Google Scholar]
  13. Cong, Z.; Wang, S.; Ni, G. Simulations of the impact of climate change on winter wheat production. J. Tsinghua Univ. Sci. Technol. 2008, 48, 1426–1430. [Google Scholar]
  14. Fischer, G.; Tubiello, F.N.; Van Velthuizen, H.; Wiberg, D.A. Climate change impacts on irrigation water requirements: Effects of mitigation, 1990–2080. Technol. Forecast. Soc. Chang. 2007, 74, 1083–1107. [Google Scholar] [CrossRef] [Green Version]
  15. Luo, Y.; Jiang, Y.; Peng, S.; Cui, Y.; Khan, S.; Li, Y.; Wang, W. Hindcasting the effects of climate change on rice yields, irrigation requirements, and water productivity. Paddy Water Environ. 2015, 13, 81–89. [Google Scholar] [CrossRef]
  16. Wang, W.; Yu, Z.; Zhang, W.; Shao, Q.; Zhang, Y.; Luo, Y.; Jiao, X.; Xu, J. Responses of rice yield, irrigation water requirement and water use efficiency to climate change in China: Historical simulation and future projections. Agric. Water Manag. 2014, 146, 249–261. [Google Scholar] [CrossRef]
  17. Wang, W.; Zou, S.; Shao, Q.; Xing, W.; Chen, X.; Jiao, X.; Luo, Y.; Yong, B.; Yu, Z. The analytical derivation of multiple elasticities of runoff to climate change and catchment characteristics alteration. J. Hydrol. 2016, 541, 1042–1056. [Google Scholar] [CrossRef]
  18. Wang, W.; Ding, Y.; Shao, Q.; Xu, J.; Jiao, X.; Luo, Y.; Yu, Z. Bayesian multi-model projection of irrigation requirement and water use efficiency in three typical rice plantation region of China based on CMIP5. Agric. For. Meteorol. 2017, 232, 89–105. [Google Scholar] [CrossRef] [Green Version]
  19. Kheir, A.M.; El Baroudy, A.; Aiad, M.A.; Zoghdan, M.G.; Abd El-Aziz, M.A.; Ali, M.G.; Fullen, M.A. Impacts of rising temperature, carbon dioxide concentration and sea level on wheat production in North Nile delta. Sci. Total Environ. 2019, 651, 3161–3173. [Google Scholar] [CrossRef]
  20. Challinor, A.J.; Watson, J.; Lobell, D.B.; Howden, S.; Smith, D.; Chhetri, N. A meta-analysis of crop yield under climate change and adaptation. Nat. Clim. Chang. 2014, 4, 287–291. [Google Scholar] [CrossRef]
  21. Zheng, J.; Wang, W.; Chen, D.; Cao, X.; Xing, W.; Ding, Y.; Dong, Q.; Zhou, T. Exploring the water–energy–food nexus from a perspective of agricultural production efficiency using a three-stage data envelopment analysis modelling evaluation method: A case study of the middle and lower reaches of the Yangtze River, China. Water Policy 2019, 21, 49–72. [Google Scholar] [CrossRef]
  22. Xu, Z.; Chen, X.; Wu, S.R.; Gong, M.; Du, Y.; Wang, J.; Li, Y.; Liu, J. Spatial-temporal assessment of water footprint, water scarcity and crop water productivity in a major crop production region. J. Clean. Prod. 2019, 224, 375–383. [Google Scholar] [CrossRef]
  23. Zhang, L.; Yin, X.; Zhi, Y.; Yang, Z. Determination of virtual water content of rice and spatial characteristics analysis in China. Hydrol. Earth Syst. Sci. 2014, 18, 2103–2111. [Google Scholar] [CrossRef] [Green Version]
  24. Zhang, Y.; Huang, K.; Ridoutt, B.G.; Yu, Y. Comparing volumetric and impact-oriented water footprint indicators: Case study of agricultural production in Lake Dianchi Basin, China. Ecol. Indic. 2018, 87, 14–21. [Google Scholar] [CrossRef]
  25. Hoekstra, A.Y. The Water Footprint of Modern Consumer Society; Routledge: London, UK, 2013. [Google Scholar] [CrossRef]
  26. Falkenmark, M.; Rockstrom, J.; Rockström, J. Balancing Water for Humans and Nature: The New Approach in Ecohydrology; Earthscan: London, UK, 2004. [Google Scholar] [CrossRef]
  27. Morillo, J.G.; Díaz, J.A.R.; Camacho, E.; Montesinos, P. Linking water footprint accounting with irrigation management in high value crops. J. Clean. Prod. 2015, 87, 594–602. [Google Scholar] [CrossRef]
  28. Hoekstra, A.Y. Virtual Water Trade: Proceedings of the International Expert Meeting on Virtual Water Trade; Value of Water Research Report Series No. 12; UNESCO-IHE: Delft, The Netherlands, 2003. [Google Scholar]
  29. Bayart, J.-B.; Bulle, C.; Deschênes, L.; Margni, M.; Pfister, S.; Vince, F.; Koehler, A. A framework for assessing off-stream freshwater use in LCA. Int. J. Life Cycle Assess. 2010, 15, 439–453. [Google Scholar] [CrossRef]
  30. Mazzi, A.; Manzardo, A.; Scipioni, A. Water footprint to support environmental management: An overview. In Pathways to Environmental Sustainability; Springer International Publishing: Cham, Switzerland, 2014; pp. 33–42. [Google Scholar] [CrossRef]
  31. International Organization for Standardization. Environmental Management: Water Footprint—Principles, Requirements and Guidelines; International Organization for Standardization: Geneva, Switzerland, 2014. [Google Scholar]
  32. Bligny, F.B.; Castellani, V.; De Camillis, C.; Mubareka, S.; Vandecasteele, I.; Wolf, M.-A. Water Footprint in the Context of Sustainability Assessment; Publications Office of the European Union: Luxembourg, 2013; Available online: https://publications.jrc.ec.europa.eu/repository/bitstream/JRC78032/lb-na-25781-en-n%20water%20footprint%20in%20the%20context%20of%20sustainability%20assessment.%20report%20on%20the%20application%20of%20life%20cycle%20based%20indicators%20of%20water%20consumption%20in%20the%20context%20of%20integrated%20sustainability%20impact%20analysis.pdf (accessed on 15 April 2022).
  33. Han, Y.; Jia, D.; Zhuo, L.; Sauvage, S.; Sánchez-Pérez, J.-M.; Huang, H.; Wang, C. Assessing the water footprint of wheat and maize in Haihe River Basin, Northern China (1956–2015). Water 2018, 10, 867. [Google Scholar] [CrossRef] [Green Version]
  34. Elbeltagi, A.; Aslam, M.R.; Mokhtar, A.; Deb, P.; Abubakar, G.A.; Kushwaha, N.; Venancio, L.P.; Malik, A.; Kumar, N.; Deng, J. Spatial and temporal variability analysis of green and blue evapotranspiration of wheat in the Egyptian Nile Delta from 1997 to 2017. J. Hydrol. 2021, 594, 125662. [Google Scholar] [CrossRef]
  35. Madugundu, R.; Al-Gaadi, K.A.; Tola, E.; Hassaballa, A.A.; Kayad, A.G. Utilization of Landsat-8 data for the estimation of carrot and maize crop water footprint under the arid climate of Saudi Arabia. PLoS ONE 2018, 13, e0192830. [Google Scholar]
  36. Rabia, A.H.; Yacout, D.M.; Shahin, S.F.; Mohamed, A.; Abdelaty, E.F. Towards Sustainable Production of Potato under Climate Change Conditions. Curr. Appl. Sci. Technol. 2018, 18, 200–207. [Google Scholar]
  37. Chapagain, A.K.; Hoekstra, A.Y.; Savenije, H.H. Water saving through international trade of agricultural products. Hydrol. Earth Syst. Sci. 2006, 10, 455–468. [Google Scholar] [CrossRef] [Green Version]
  38. Huang, J.; Zhang, H.-L.; Tong, W.-J.; Chen, F. The impact of local crops consumption on the water resources in Beijing. J. Clean. Prod. 2012, 21, 45–50. [Google Scholar] [CrossRef]
  39. Zaki, C. Employment, Gender and International Trade: A Micro-Macro Evidence for Egypt. Rev. Econ. Political Sci. 2016, 415, 1–27. [Google Scholar] [CrossRef]
  40. Sun, S.; Liu, J.; Wu, P.; Wang, Y.; Zhao, X.; Zhang, X. Comprehensive evaluation of water use in agricultural production: A case study in Hetao Irrigation District, China. J. Clean. Prod. 2016, 112, 4569–4575. [Google Scholar] [CrossRef]
  41. Zhuo, L.; Mekonnen, M.M.; Hoekstra, A.Y. The effect of inter-annual variability of consumption, production, trade and climate on crop-related green and blue water footprints and inter-regional virtual water trade: A study for China (1978–2008). Water Res. 2016, 94, 73–85. [Google Scholar] [CrossRef] [Green Version]
  42. Tuninetti, M.; Tamea, S.; Laio, F.; Ridolfi, L. A Fast Track approach to deal with the temporal dimension of crop water footprint. Environ. Res. Lett. 2017, 12, 074010. [Google Scholar] [CrossRef]
  43. Xu, H.; Wu, M. A first estimation of county-based green water availability and its implications for agriculture and bioenergy production in the United States. Water 2018, 10, 148. [Google Scholar] [CrossRef] [Green Version]
  44. Okal, H.A.; Ngetich, F.K.; Okeyo, J.M. Spatio-temporal characterisation of droughts using selected indices in Upper Tana River watershed, Kenya. Sci. Afr. 2020, 7, e00275. [Google Scholar] [CrossRef]
  45. Mompremier, R.; Her, Y.; Hoogenboom, G.; Migliaccio, K.; Muñoz-Carpena, R.; Brym, Z.; Colbert, R.; Jeune, W. Modeling the response of dry bean yield to irrigation water availability controlled by watershed hydrology. Agric. Water Manag. 2021, 243, 106429. [Google Scholar] [CrossRef]
  46. Allen, R.G.; Pereira, L.S.; Raes, D.; Smith, M. Crop evapotranspiration-Guidelines for computing crop water requirements-FAO Irrigation and drainage paper 56. Fao Rome 1998, 300, D05109. [Google Scholar]
  47. Mokhtar, A.; He, H.; Alsafadi, K.; Li, Y.; Zhao, H.; Keo, S.; Bai, C.; Abuarab, M.; Zhang, C.; Elbagoury, K. Evapotranspiration as a response to climate variability and ecosystem changes in southwest, China. Environ. Earth Sci. 2020, 79, 312. [Google Scholar] [CrossRef]
  48. Mokhtar, A.; He, H.; Zhao, H.; Keo, S.; Bai, C.; Zhang, C.; Ma, Y.; Ibrahim, A.; Li, Y.; Li, F. Risks to water resources and development of a management strategy in the river basins of the Hengduan Mountains, Southwest China. Environ. Sci. Water Res. Technol. 2020, 6, 656–678. [Google Scholar] [CrossRef]
  49. Abdo, A.I.; Abdelghany, A.E.; Wei, H.; Wang, L.; Zhang, J.; Mokhtar, A. Perspective of agricultural water safety under combined future changes in crop water requirements and climate conditions in China. Theor. Appl. Climatol. 2022, 148, 1629–1645. [Google Scholar] [CrossRef]
  50. Allen, R.G. Using the FAO-56 dual crop coefficient method over an irrigated region as part of an evapotranspiration intercomparison study. J. Hydrol. 2000, 229, 27–41. [Google Scholar] [CrossRef]
  51. Sumner, D.M.; Jacobs, J.M. Utility of Penman–Monteith, Priestley–Taylor, reference evapotranspiration, and pan evaporation methods to estimate pasture evapotranspiration. J. Hydrol. 2005, 308, 81–104. [Google Scholar] [CrossRef]
  52. Wang, Y.; Zhou, G.-S. Evapotranspiration characteristics and crop coefficient of rain-fed maize agroecosystem. Ying Yong Sheng Tai Xue Bao = J. Appl. Ecol. 2010, 21, 647–653. [Google Scholar]
  53. Fan, Z.-X.; Thomas, A. Spatiotemporal variability of reference evapotranspiration and its contributing climatic factors in Yunnan Province, SW China, 1961–2004. Clim. Chang. 2013, 116, 309–325. [Google Scholar] [CrossRef]
  54. Chico, D.; Aldaya, M.M.; Garrido, A. A water footprint assessment of a pair of jeans: The influence of agricultural policies on the sustainability of consumer products. J. Clean. Prod. 2013, 57, 238–248. [Google Scholar] [CrossRef] [Green Version]
  55. Hoekstra, A.Y.; Chapagain, A.; Martinez-Aldaya, M.; Mekonnen, M. Water Footprint Manual: State of the Art 2009; Earthscan: Washington, DC, USA, 2009. [Google Scholar]
  56. Yusof, N.A.; Abidin, N.Z.; Zailani, S.H.M.; Govindan, K.; Iranmanesh, M. Linking the environmental practice of construction firms and the environmental behaviour of practitioners in construction projects. J. Clean. Prod. 2016, 121, 64–71. [Google Scholar] [CrossRef]
  57. Siebert, S.; DÖLL, P. 2.4 Irrigation water use–A global perspective. Cent. Asia 2007, 14, 10.12–11.18. [Google Scholar]
  58. Li, Z.; Xu, X.; Yu, B.; Xu, C.; Liu, M.; Wang, K. Quantifying the impacts of climate and human activities on water and sediment discharge in a karst region of southwest China. J. Hydrol. 2016, 542, 836–849. [Google Scholar] [CrossRef]
  59. Miao, C.; Ni, J.; Borthwick, A.G. Recent changes of water discharge and sediment load in the Yellow River basin, China. Prog. Phys. Geogr. 2010, 34, 541–561. [Google Scholar] [CrossRef] [Green Version]
  60. Kendall, M. Rank Correlation Methods; Hafner Pub. Co.: New York, NY, USA, 1962; p. 199. [Google Scholar]
  61. Mann, H.B. Nonparametric tests against trend. Econom. J. Econom. Soc. 1945, 13, 245–259. [Google Scholar] [CrossRef]
  62. Opena, G.B.; Porter, G.A. Soil management and supplemental irrigation effects on potato: II. Root growth. Agron. J. 1999, 91, 426–431. [Google Scholar] [CrossRef]
  63. Lynch, D.; Foroud, N.; Kozub, G.; Fames, B. The effect of moisture stress at three growth stages on the yield, components of yield and processing quality of eight potato varieties. Am. Potato J. 1995, 72, 375–385. [Google Scholar] [CrossRef]
  64. Reddy, K.R.; Hodges, H. Climate Change and Global Crop Productivity; CABI International: Wallingford, UK, 2000; pp. 1–5. [Google Scholar] [CrossRef]
  65. Flammini, A.; Pan, X.; Tubiello, F.N.; Qiu, S.Y.; Rocha Souza, L.; Quadrelli, R.; Bracco, S.; Benoit, P.; Sims, R. Emissions of greenhouse gases from energy use in agriculture, forestry and fisheries: 1970–2019. Earth Syst. Sci. Data 2022, 14, 811–821. [Google Scholar] [CrossRef]
  66. Birch, P.R.; Bryan, G.; Fenton, B.; Gilroy, E.M.; Hein, I.; Jones, J.T.; Prashar, A.; Taylor, M.A.; Torrance, L.; Toth, I.K. Crops that feed the world 8: Potato: Are the trends of increased global production sustainable? Food Secur. 2012, 4, 477–508. [Google Scholar] [CrossRef]
  67. Kooman, P.; Fahem, M.; Tegera, P.; Haverkort, A. Effects of climate on different potato genotypes 2. Dry matter allocation and duration of the growth cycle. Eur. J. Agron. 1996, 5, 207–217. [Google Scholar] [CrossRef]
  68. Herath, I.; Green, S.; Horne, D.; Singh, R.; Clothier, B. Quantifying and reducing the water footprint of rain-fed potato production, part I: Measuring the net use of blue and green water. J. Clean. Prod. 2014, 81, 111–119. [Google Scholar] [CrossRef]
  69. Schyns, J.F.; Hoekstra, A.Y.; Booij, M.J. Review and classification of indicators of green water availability and scarcity. Hydrol. Earth Syst. Sci. 2015, 19, 4581–4608. [Google Scholar] [CrossRef] [Green Version]
  70. Schyns, J.F.; Hoekstra, A.Y.; Booij, M.J.; Hogeboom, R.J.; Mekonnen, M.M. Limits to the world’s green water resources for food, feed, fiber, timber, and bioenergy. Proc. Natl. Acad. Sci. USA 2019, 116, 4893–4898. [Google Scholar] [CrossRef] [Green Version]
  71. Mekonnen, M.M.; Hoekstra, A.Y. The green, blue and grey water footprint of crops and derived crop products. Hydrol. Earth Syst. Sci. 2011, 15, 1577–1600. [Google Scholar] [CrossRef] [Green Version]
  72. El-Marsafawy, S.M.; Mohamed, A.I. Water footprint of Egyptian crops and its economics. Alex. Eng. J. 2021, 60, 4711–4721. [Google Scholar] [CrossRef]
  73. Mekonnen, M.M.; Hoekstra, A.Y. A global and high-resolution assessment of the green, blue and grey water footprint of wheat. Hydrol. Earth Syst. Sci. 2010, 14, 1259–1276. [Google Scholar] [CrossRef] [Green Version]
  74. Gerbens-Leenes, W.; Berger, M.; Allan, J.A. Water footprint and life cycle assessment: The complementary strengths of analyzing global freshwater appropriation and resulting local impacts. Water 2021, 13, 803. [Google Scholar] [CrossRef]
  75. Ridoutt, B.G.; Pfister, S. A revised approach to water footprinting to make transparent the impacts of consumption and production on global freshwater scarcity. Glob. Environ. Chang. 2010, 20, 113–120. [Google Scholar] [CrossRef]
  76. Zhang, X.; Chen, S.; Sun, H.; Wang, Y.; Shao, L. Water use efficiency and associated traits in winter wheat cultivars in the North China Plain. Agric. Water Manag. 2010, 97, 1117–1125. [Google Scholar] [CrossRef]
  77. Brauman, K.A.; Siebert, S.; Foley, J.A. Improvements in crop water productivity increase water sustainability and food security—A global analysis. Environ. Res. Lett. 2013, 8, 024030. [Google Scholar] [CrossRef]
  78. Chukalla, A.D.; Krol, M.S.; Hoekstra, A.Y. Green and blue water footprint reduction in irrigated agriculture: Effect of irrigation techniques, irrigation strategies and mulching. Hydrol. Earth Syst. Sci. 2015, 19, 4877–4891. [Google Scholar] [CrossRef] [Green Version]
Figure 1. Location of the study area and the meteorological stations.
Atmosphere 13 01052 g001
Figure 2. Seasonal variations from 1990 to 2016: “(a)” effective precipitation, “(b)” min. temperature, “(c)” max. temperature, “(d)” wind speed, “(e)” relative humidity, and “(f)” crop evapotranspiration.
Atmosphere 13 01052 g002
Figure 3. Spatial distribution of “(a)” effective precipitation, “(b)” max. temperatures, “(c)” min. temperature, “(d)” wind speed, “(e)” relative humidity, and “(f)” crop evapotranspiration.
Atmosphere 13 01052 g003
Figure 4. Correlation matrix between max. temperature, min. temperature, wind speed and relative humidity.
Atmosphere 13 01052 g004
Figure 5. Time evolution of the potato yield in the 10 governorates from 1990 to 2016.
Atmosphere 13 01052 g005
Figure 6. Spatial distribution of the agriculture water footprint from 1990 to 2016: “(a)” WFgreen, and “(b)” WFblue.
Atmosphere 13 01052 g006
Figure 7. Agriculture water footprints from 1990 to 2016: “(a)” WFblue and WFgreen annual component values and “(b)” their relative percentage composition of the annual total.
Atmosphere 13 01052 g007
Figure 8. Relationship between yearly crop yield and yearly WF from 1990 to 2016.
Atmosphere 13 01052 g008
Figure 9. For 1990 to 2016: “(a)” averages of WFblue, WFgreen, yield, ETc and Peff for each governorate, and “(b)” the time series of total water footprint, yield and ETc.
Atmosphere 13 01052 g009
Table 1. The geographical coordinates and areas of the study governorates.
GovernorateArea (km2)Latitude (°N)Longitude (°E)
Alexandria267930.229.95
Al-Beheira1012930.6530.7
Al-Dakahlia347131.0031.45
Damietta58931.4231.82
Al-Ismailiyah144230.5832.23
Al-Gharbia194230.8230.93
Kafr El-Sheikh343731.5531.08
Al-Sharqiyah418030.5831.50
Al-Monofia153230.6031.02
Al-Qalyubia100131.0530.22
Publisher’s Note: MDPI stays neutral with regard to jurisdictional claims in published maps and institutional affiliations.

