
Influence of Meteorological Factors and Chemical Processes on the Explosive Growth of PM2.5 in Shanghai, China


1
Department of Research, Shanghai University of Medicine & Health Sciences Affiliated Zhoupu Hospital, Shanghai 201318, China
2
College of Medical Technology, Shanghai University of Medicine & Health Sciences, Shanghai 201318, China
3
Shanghai Environmental Monitoring Center, Shanghai 200235, China
4
School of Medical Instrument, Shanghai University of Medicine & Health Sciences, Shanghai 201318, China
*
Author to whom correspondence should be addressed.
Atmosphere 2022, 13(7), 1068; https://0-doi-org.brum.beds.ac.uk/10.3390/atmos13071068
Submission received: 16 June 2022
/
Revised: 3 July 2022
/
Accepted: 4 July 2022
/
Published: 6 July 2022
(This article belongs to the Special Issue Physical Models and Statistical Methods in Atmospheric Environment)
Abstract
:In order to explore the mechanism of haze formation, the meteorological effect and chemical reaction process of the explosive growth (EG) of PM2.5 were studied. In this study, the level of PM2.5, water-soluble inorganic ions, carbonaceous aerosols, gaseous precursors, and meteorological factors were analyzed in Shanghai in 2018. The EG event is defined by a net increase of PM2.5 mass concentration greater than or equal to 100 μg m−3 within 3, 6, or 9 h. The results showed that the annual average PM2.5 concentration in Shanghai in 2018 was 43.2 μg m−3, and secondary inorganic aerosols and organic matter (OM) accounted for 55.8% and 20.1% of PM2.5, respectively. The increase and decrease in the contributions of sulfate, nitrate, ammonium (SNA), and elemental carbon (EC) to PM2.5 from clean days to EG, respectively, indicated a strong, secondary transformation during EG. Three EG episodes (Ep) were studied in detail, and the PM2.5 concentration in Ep3 was highest (135.7 μg m−3), followed by Ep2 (129.6 μg m−3), and Ep1 (82.3 μg m−3). The EG was driven by stagnant conditions and chemical reactions (heterogeneous and gas-phase oxidation reactions). This study improves our understanding of the mechanism of haze pollution and provides a scientific basis for air pollution control in Shanghai.
1. Introduction
Since persistent haze pollution was experienced in Eastern China in January 2013, fine particulate matter of less than 2.5 µm in diameter (PM2.5) has attracted widespread, national attention as a key component of pollution events [1]. The hazy episodes caused severe aerosol pollution events, led to a significant reduction in visibility, affected traffic, constrained local economic development, and greatly damaged the respiratory and circulatory systems of residents [2]. Furthermore, when PM2.5 contains hydrophilic components, such as sulfate and nitrate, it can also serve as cloud condensation nuclei (CCN), changing the physical and chemical characteristics of clouds, and thus influencing precipitation as well as the regional climate [3]. Understanding the mechanism of heavy haze is vital to evaluating the influences of PM2.5 in regional air quality, regional climate forcing, and human health.
In recent years, many studies have been conducted to investigate the formation mechanisms of heavy haze. PM2.5 concentration in the atmosphere is influenced by a variety of factors, such as pollutant emissions, regional transportation, aerosol physicochemical processes, gas–particle conversion, and meteorological conditions [4,5,6,7]. Ye et al. [8] concluded that there was a significant relationship between daily PM2.5 concentration and meteorological factors, including temperature (T), relative humidity (RH), wind speed (WS), and wind direction (WD), and they suggested that an increase in RH could promote the growth of PM2.5. Meanwhile, PM2.5 was negatively correlated with WS; that is, with increases in WS, PM2.5 showed a decreasing trend, which was attributed to a high WS helping to disperse PM2.5 [8]. Using a stacked system model for the prediction and analysis of daily average PM2.5 concentrations in Beijing, Zhai and Chen [9] also learned that local extreme and maximum WS were considered to be the main influences of meteorological factors in the interregional transport of pollutants. The adverse meteorological factors could cause atmospheric advection, atmospheric dispersion, and secondary aerosol formation [10]. Zhong et al. [1] suggested that the cumulative explosive growth (EG) in PM2.5 mass in Beijing was mainly influenced by the stable atmospheric stratification characteristics of a southerly breeze or flat wind, anomalous near-surface inversion temperatures, and water vapor accumulation. A study on emission-control downwind of Nanjing during the 2014 Summer Youth Olympic Games suggested that stagnant meteorological conditions and a high RH had a significant effect on the production and accumulation of PM2.5, indicating that the seasonal meteorological characteristics were significant for the production of PM2.5 [11].
A recent study found that severe haze pollution is largely driven by the formation of secondary aerosols. The formation of the secondary aerosols of sulfate and nitrate were dominated by gas-phase oxidation and heterogeneous reactions, which were enhanced by a high RH [12,13]. Through the research group’s repeated, simultaneous observations of the gas–liquid and gas–particle phases of atmospheric peroxides in the Beijing area, Xuan et al. [14] concluded that strong atmospheric oxidation was considered to be a key factor in the rapid increase of secondary, fine particulate matter concentrations during periods of heavy pollution, which was one of the causes of heavy atmospheric pollution in Beijing–Tianjin–Hebei and the surrounding areas in autumn and winter. The formation mechanism of PM2.5 is complicated; more field measurements of chemical PM2.5 components in different environments are urgently needed.
Therefore, it is meaningful to explore the driving factors of EG to provide useful information to the government, which will enable forecasting and the reduction of severe air pollution. In this study, the meteorological effect and chemical process of EG were explored by analyzing PM2.5, water-soluble inorganic ions, carbonaceous substances, gaseous precursors, and meteorological factors in Shanghai in 2018 so as to explore the factors that lead to EG.
2. Materials and Methods
2.1. Sample Site
The observation site was located at 45 km westward from the center of Shanghai in the suburban Qingpu Environmental Monitoring Center (Dianshan Lake Superstation, 31.09° N, 120.98° E). The Qingpu District is bounded by Zhejiang Province to the south and Jiangsu Province to the west. The land use near the observation site included residential areas, agriculture, industry, and highways. Shanghai has a predominantly subtropical monsoon climate with moderate humidity and an annual average temperature of 17.6 °C; it had an RH of 76.5%, a WS of 2.1 m s−1, and a total annual rainfall of 1172.8 mm in 2018. Shanghai is mainly influenced by parts of the Yangtze River Delta (YRD) and North China Plain (NCP) areas in winter; the WD is generally from the northwest and the north. In contrast, Shanghai becomes the contributor of pollutant sources in the summer in the YRD region [15]. The total area of Dianshan Lake reaches 62 km2, and it is located 0.2 km to the west and north of the measurement site, resulting in the higher RH of the site.
2.2. Measurement Methods
The PM2.5 concentration was measured automatically by a tapered element oscillating microbalance (TEOM 1405-D, Thermo Scientific Co., Waltham, MA, USA). The TEOM flow rate was 16.7 L min−1. The average sampling time was 5 min, which was converted to hourly means. The uncertainty of the hourly measurements was ±1.50 µg m−3, and the detection limit was 0.06 µg m−3. Detailed information about the measurement methods of the instrument can be found in a previously published study [16].
Gas species were measured online by a series of gas analyzers, including an O3 analyzer (model 49I), a NO/NO2 analyzer (model 42I), a SO2 analyzer (model 43I), and a CO analyzer (model 48I; Thermo Scientific, Waltham, MA, USA). The ambient air was connected to the gas analyzer located 1.5 m above the roof with a Teflon tube. The collected gas data were resolved to 1 min and then converted to hourly averages. The TSO2, NOx, and CO gas analyzers were calibrated daily using standard gases of 50 ppmv SO2, 52 ppmv NO, and 5000 ppmv CO, with multipoint calibrations performed every 3–6 months. An O3 analyzer was calibrated by a specific O3 calibrator (49C PS) and zeroed every 2 h using an internal catalytic converter. The accuracy of the gas analyzers for O3, NO/NO2, SO2, and CO were 1.0, 0.4, 1.0, and 0.1 ppb, respectively. The meteorological parameters, including RH, T, WS, WD, atmospheric pressure (P), precipitation, and visibility, were monitored by an automatic meteorological station which was installed 18 m above the ground on the roof of a building located inside the Qingpu Environmental Monitoring Center. The station registered one datapoint every minute and then converted those into hourly averages.
The MARGA instrument (ADI 2080, Applikon Analytical, Schiedam, The Netherlands) equipped with a PM2.5 cutting head was used to measure water-soluble, inorganic ions at a flow rate of 16.7 L min−1 and at a resolution of 1 h. To ensure the accuracy of the data, the MARGA was calibrated using the internal standard method (with bromide as the anion and lithium as the cation) and the external standard method (with a mixture of anions and cations), and the soluble ions in the target water were determined before and after the experiment using the multipoint method. The limits of the detection of NO3−, SO42−, Cl−, NH4+, K+, Na+, Mg2+, and Ca2+ were 0.04, 0.01, 0.05, 0.09, 0.05, 0.06, and 0.1 μg m−3 (based on a sampling time of 45 min), respectively.
Organic carbon (OC) and elemental carbon (EC) concentrations were determined by using an online Sunset semi-continuous carbon analyzer (Sunset Laboratory, Forest Grove, OR, USA) using the thermal–optical transmittance method at a flow rate of 8 L min−1 through the PM2.5 cutting head. OC and EC concentrations were collected every 30 min and averaged as hourly data. The accuracy and detection limits were measured by the changes in EC and OC concentrations on exposed filters and blank membranes, respectively. The measurement results were well-correlated with the membrane analysis, with relative standard deviations below 5%. The EC level on the blank membrane was found to be negligible, but the OC concentrations ranged from 0.1 to 1.0 μg m−3. The detection limits for the OC and EC concentrations were 0.2 and 0.04 μg m−3, respectively (based on 45 min sampling time).
2.3. Definition of Explosive Growth of PM2.5
EG has been defined in previous studies and is briefly described in this section. Wang et al. [17] defined an increase in PM2.5 concentration in the Beijing–Tianjin–Hebei region from a low concentration (<35 μg m−3) to an extremely high concentration (>500 μg m−3) within 8 h as an EG event. After this study, Zhong et al. [1] defined an explosive growth event as occurring when a minimum PM2.5 concentration doubles within a few hours (up to 10 h) in Beijing during a period of heavy haze (PM2.5 concentration > 80 μg m−3 for 3 consecutive days with a maximum value of 400 μg m−3 or more). However, most studies on EG have focused on the Beijing area [1,17]. Therefore, given the typical air pollution characteristics of Shanghai, we proposed a definition of EG events that occur within 3, 6, or 9 h, respectively [12]. EG was defined as
3. Results and Discussion
3.1. PM2.5 Level
The annual average PM2.5 concentration in Shanghai in 2018 was 43.2 μg m−3, which was 1.2 times higher than the value recommended by the World Health Organization (WHO; 35 μg m−3). This concentration was lower than that of Beijing (135 ± 63 μg m−3) [18], but higher than that of Guangdong in 2017 (37.5 μg m−3) [19]. Secondary inorganic aerosols accounted for 55.8% of the total PM2.5 mass concentration, in which NO3−, SO42−, and NH4+ accounted for 24.7%, 17.6%, and 13.5%, respectively. The primary ions (Cl−, K+, Na+, Ca2+, and Mg2+) accounted for only 3.4% of PM2.5. The contribution of OM (OC * 1.8) [20,21] to PM2.5 was 20.1%, but that of EC was only 4.2%. The unknown fraction of PM2.5 accounted for 22.4%, which may be related to the uncertainty of the OM and OC conversion factors, other unknown species, and the uncertainty of observations.
Compared to other water-soluble ions, the concentration of NO3− was the highest in Shanghai in 2018, with an annual mean concentration of 10.7 ± 12.1 μg m−3, followed by SO42− (7.6 ± 5.4 μg m−3), NH4+ (5.8 ± 5.6 μg m−3), Cl− (1.0 ± 1.0 μg m−3), K+ (0.20 ± 0.34 μg m−3), Na+ (0.14 ± 0.18 μg m−3), Ca2+ (0.07 ± 0.12 μg m−3), and Mg2+ (0.02 ± 0.04 μg m−3). This concentration differs from that of Beijing, where Zhang et al. [18] found that the largest concentration was SO42− (13.6 ± 12.4 μg m−3), followed by NO3− (11.3 ± 10.8 μg m−3), NH4+ (6.9 ± 7.1 μg m−3), Ca2+ (1.6 ± 1.4 μg m−3), Cl− (1.4 ± 2.2 μg m−3), K+ (0.92 ± 0.75 μg m−3), Na+ (0.46 ± 0.55 μg m−3), and Mg2+ (0.02 ± 0.04 μg m−3). This may have been due to the fact that coal combustion is the main winter heating method in North China, compared with Shanghai, moreover, the distance of Beijing to Inner Mongolia was much near. Thus, the higher SO42− and Ca2+ in Beijing’s atmosphere may be related to coal combustion and dusty weather, respectively [22]. In conclusion, NO3−, SO42−, and NH4+, as secondary, inorganic ions, were the major components of the total inorganic ions (94.0%), which is consistent with previous studies [23]. The annual average concentrations of OC and EC in Shanghai in 2018 were 5.1 ± 3.2 μg m−3 and 1.8 ± 1.4 μg m−3, respectively. These concentration values are lower than the national carbonaceous aerosols measured by Zhang et al. (OC 16.1 ± 5.2 μg m−3 and EC 3.6 ± 0.93 μg m−3), but the carbonaceous aerosol concentrations at urban sites were twice as high (OC 33.1 ± 9.6 μg m−3 and EC 11.2 ± 2.0 μg m−3) [24].
3.2. Seasonal Distribution Characteristics of PM2.5 and Chemical PM2.5 Components
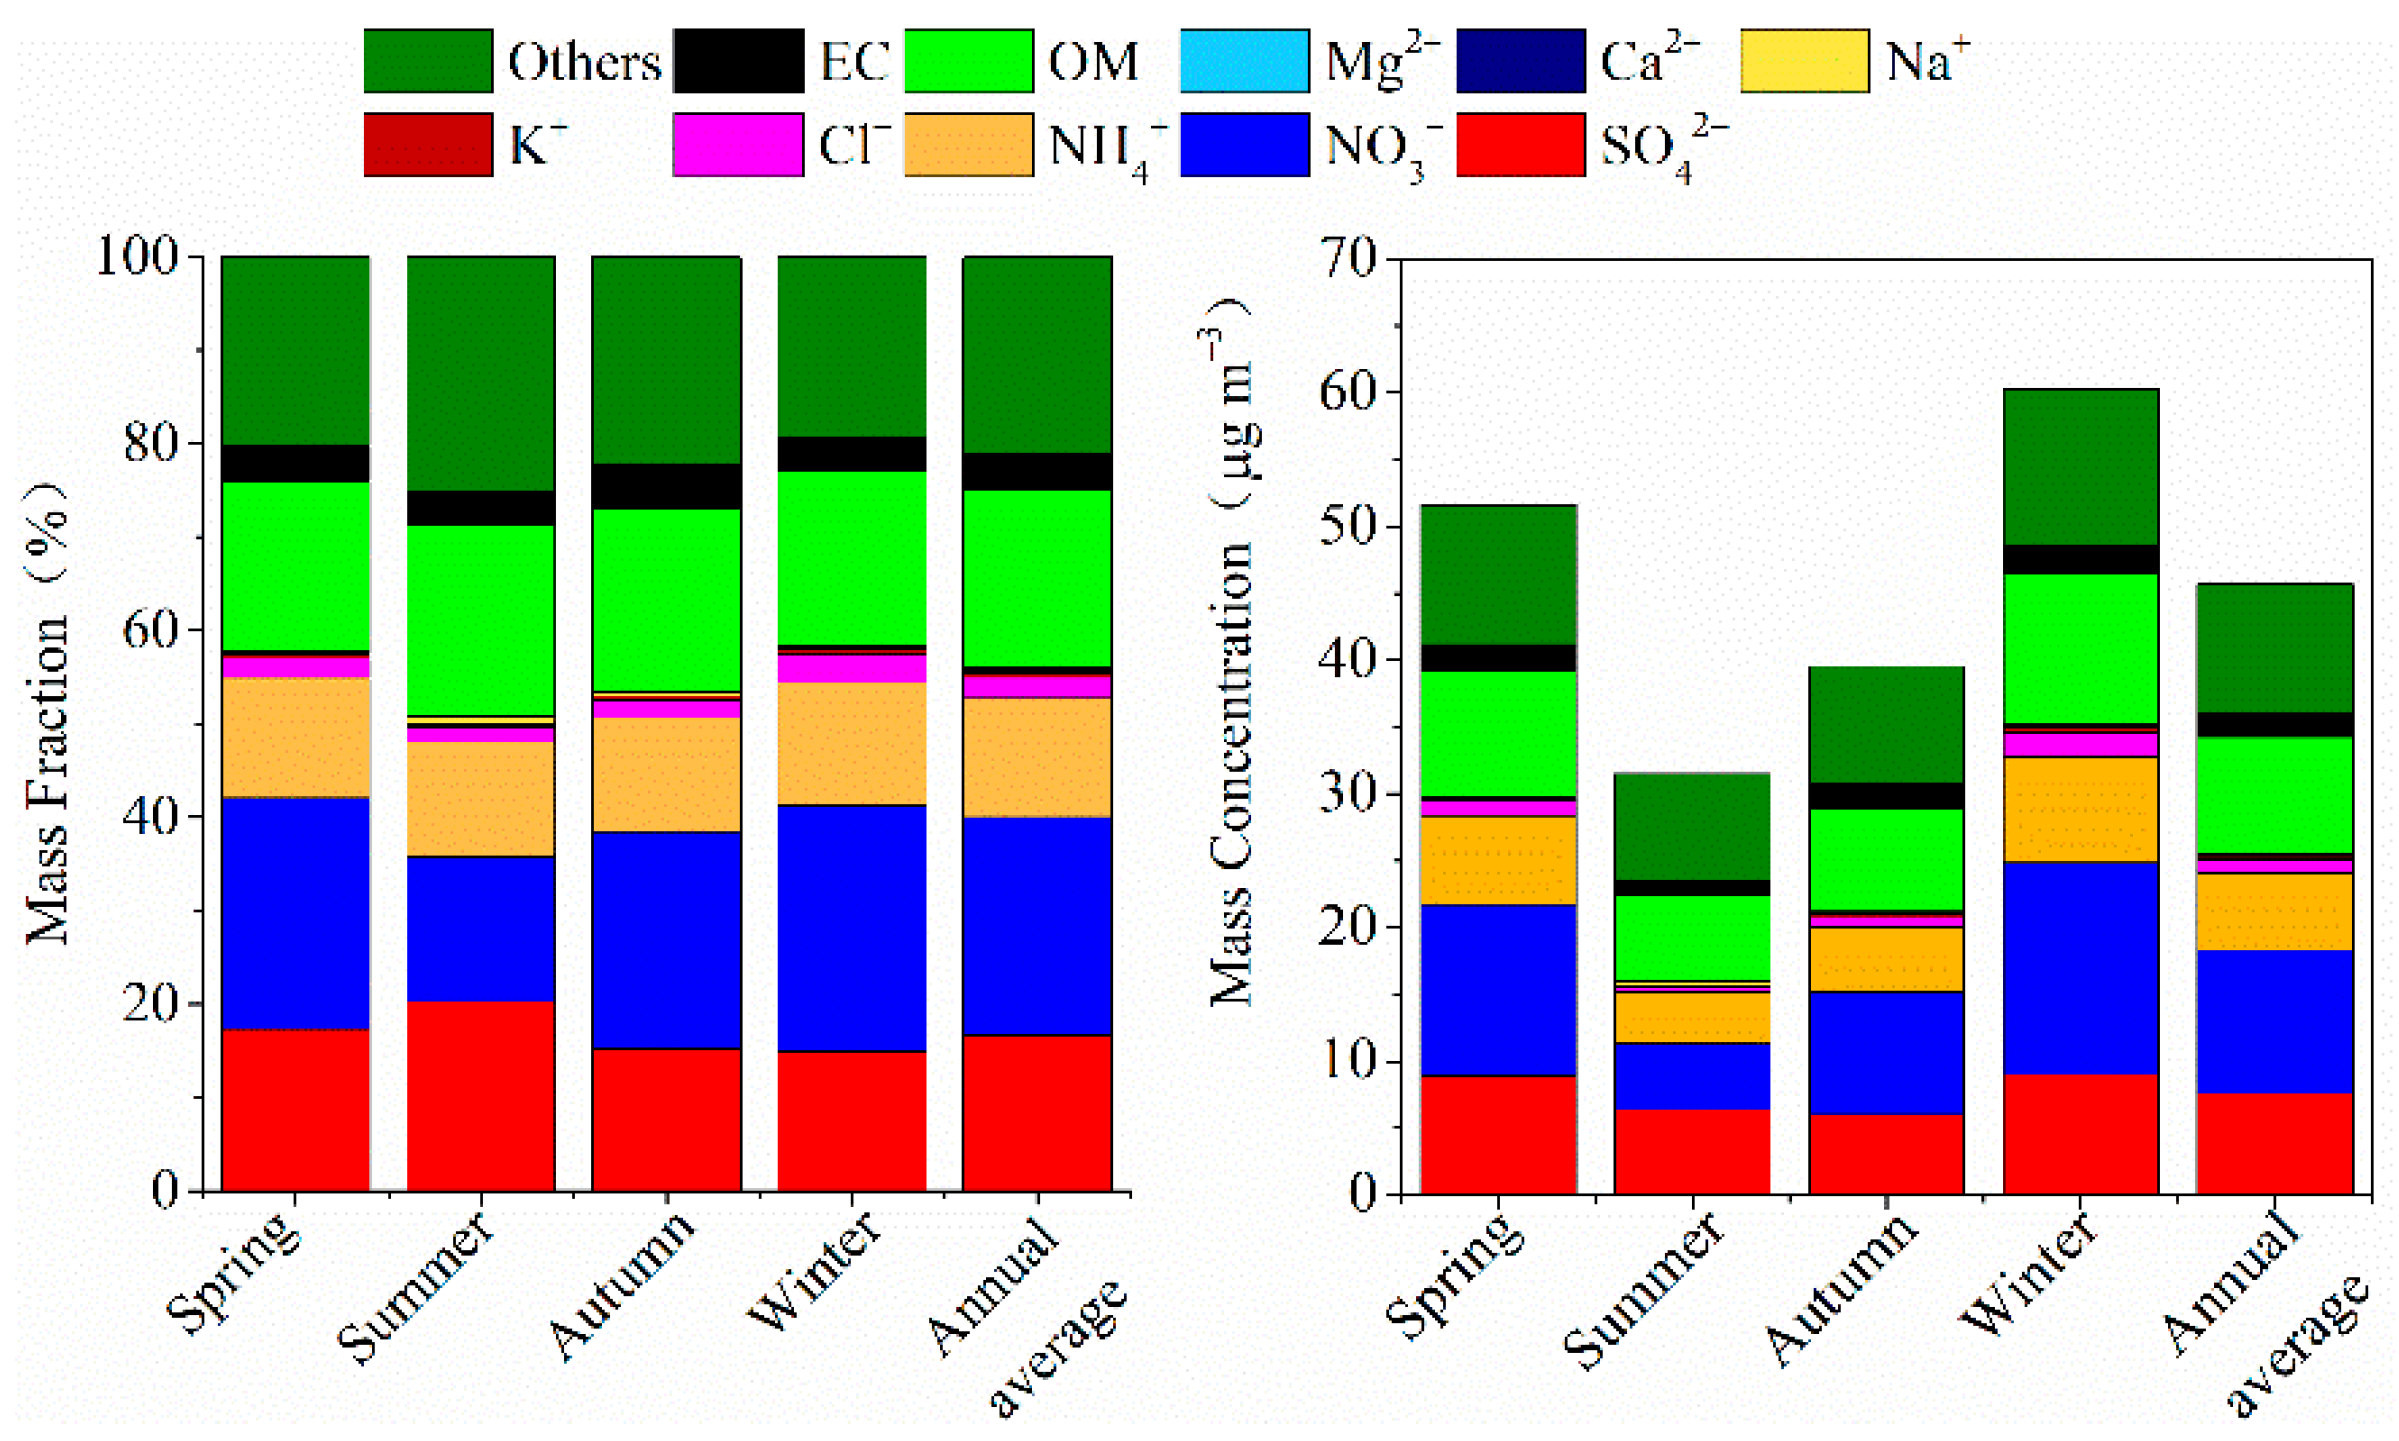
Figure 1 shows the seasonal variation of the concentrations of PM2.5, major chemical PM2.5 components, and gaseous precursors in Shanghai in 2018. The seasonal variation of pollutants is influenced by the intensity of pollutant emissions from sources, atmospheric processes, and meteorological conditions. Unlike Northern China, there is less indoor coal combustion and wood-burning for winter heating in Shanghai due to the higher average winter temperature (5.6 °C). Therefore, the influence of atmospheric processes and meteorological conditions on the seasonal variation of PM2.5 is of great important in Shanghai. The highest PM2.5 mass concentration was observed in winter (56.5 ± 44.6 μg m−3), which was 1.1–1.9 times higher than that of other seasons, followed by spring (50.0 ± 28.7 μg m−3), autumn (37.1 ± 16.2 μg m−3), and summer (29.4 ± 20.9 μg m−3). Stagnant weather conditions, due to frequently calm winds and lower mixed boundary-layer heights, were the main reasons for the highest PM2.5 concentrations in winter [25]. However, the lowest PM2.5 concentration in summer was attributed to the fact that the rainfall (a total precipitation of 533.5 mm in summer) was mainly concentrated in this period.
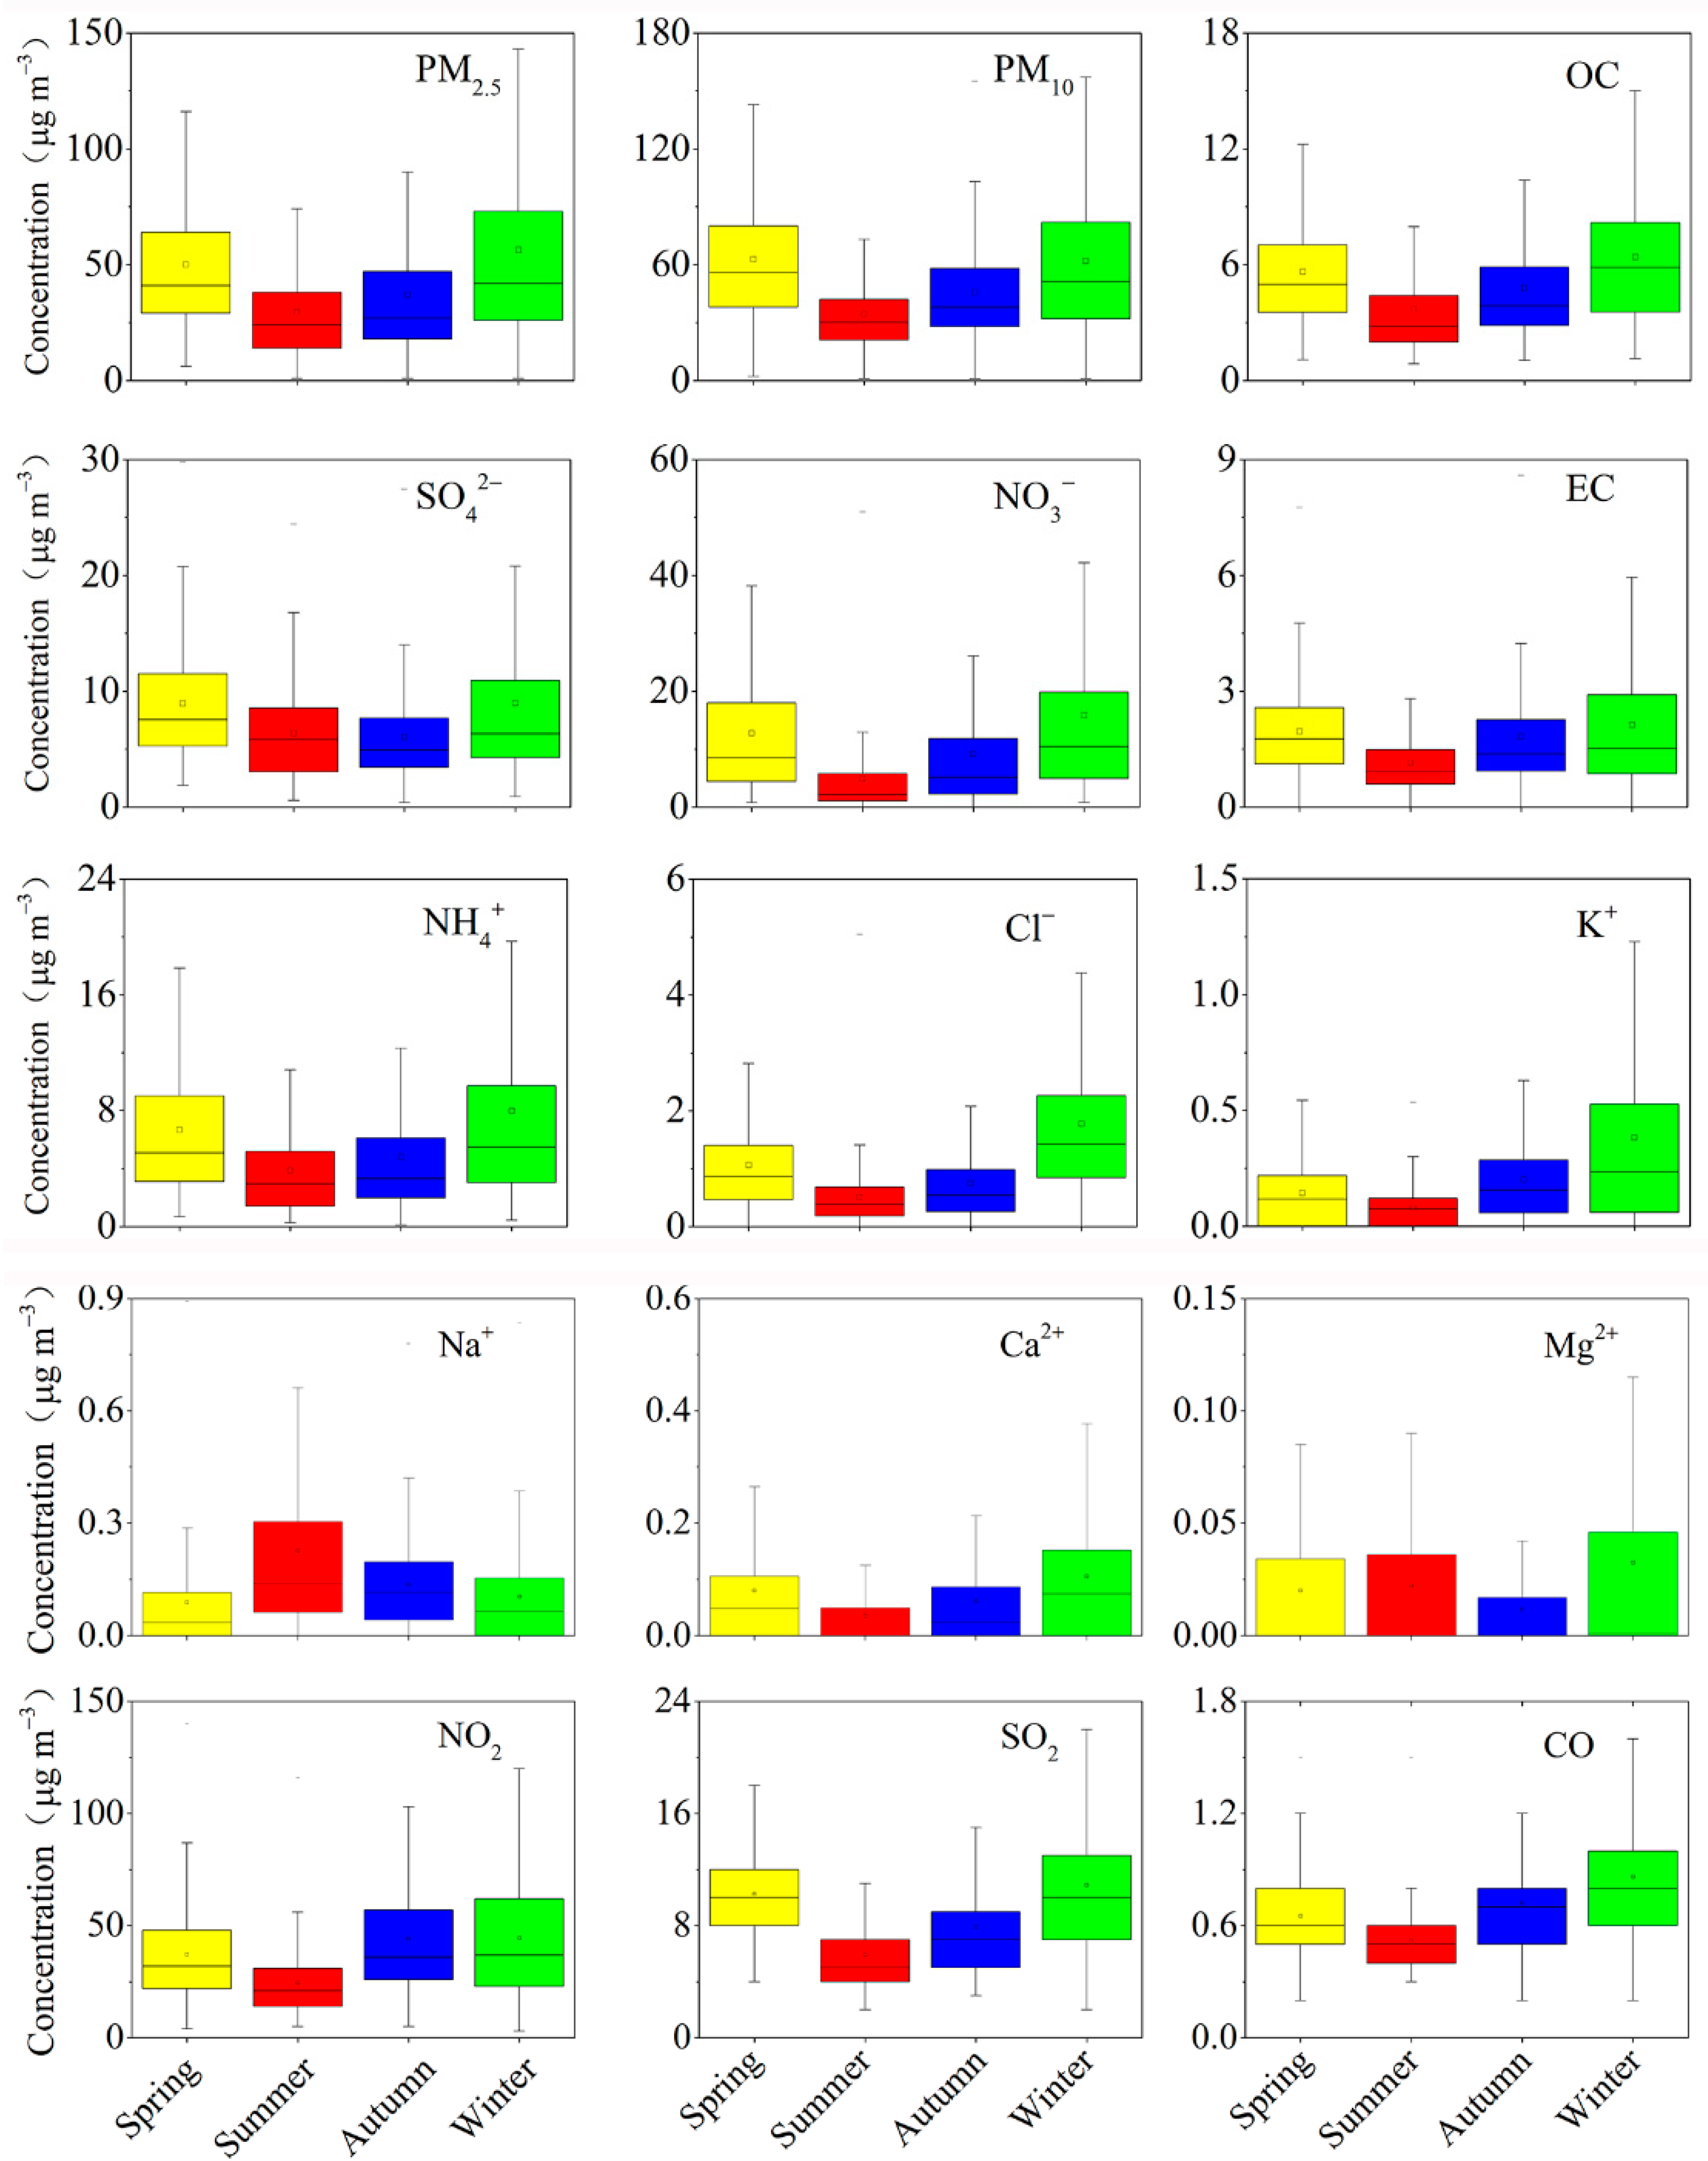
The seasonal distributions of all major chemical components of PM2.5, except Na+, were similar to PM2.5, with highest occurring in winter (Figure 2). The concentration of Na+ was highest in summer (0.23 ± 0.26 μg m−3) and lowest in spring (0.09 ± 0.14 μg m−3), and the high level in summer was probably due to the influence of sea-salt aerosols brought by the Shanghai summer monsoon [16]. The seasonal variations of Ca2+ and Mg2+ were slightly similar, with the highest concentrations registered in winter (0.11 ± 0.15 μg m−3 and 0.03 ± 0.06 μg m−3), followed by spring (0.08 ± 0.13 μg m−3 and 0.02 ± 0.04 μg m−3). The relatively higher WS and lower RH in spring favored the resuspension of dust, and the more frequent dust storms from northwestern China in spring can transport dust to Shanghai over long distances, causing high Ca2+ and Mg2+ levels [26]. The concentration of K+ showed the highest level in winter (0.38 ± 0.57 μg m−3), followed by autumn (0.20 ± 0.04 μg m−3), measured as being 1.4 and 2.5 times higher in autumn than in spring and summer, respectively, which was closely related with biomass-burning being mainly concentrated in autumn [27]. The level of Cl− exhibited the highest value in winter (1.8 ± 1.4 μg m−3), that being 1.7–3.5 times higher than that in other seasons, which was mainly associated with coal combustion for winter heating and regional transport from Northern China [28].
As shown in Figure 1 and Figure 2, the seasonal contributions of sulfate, nitrate, and ammonium (SNA) to PM2.5 varied from 51.3% to 58.0%. Both NO3− and NH4+ contributed to PM2.5 the most in winter and the least in summer, but the seasonal contribution and distribution of SO42− was the opposite. The high contribution of SO42− in summer was mainly attributed to enhanced photochemical reactions due to the higher temperatures and stronger solar radiation in summer, which is consistent with the findings of Wang et al. [29]. In addition, the higher O3 concentration (78.1 μg m−3) in summer also promoted this seasonal distribution characteristic [30]. Interestingly, the seasonal variation characteristics of SO42− and SO2 were different. SO2 showed a more pronounced seasonal variation, with the highest value registered in winter, with that being 1.1–1.8 times higher than that in the other seasons, while the SO42− level did not exhibit an obvious difference in winter and spring, being 1.4–1.5 times higher than the other seasons. Similarly, the seasonal variation characteristics of NO3− were more distinct compared with those of NO2, with the maximum registered in winter (15.8 ± 15.6 μg m−3) and the lowest value registered in summer (4.9 ± 6.6 μg m−3), being 1.2–3.2 times higher in winter than in the other seasons. In contrast, NO2 exhibited the highest values in autumn (44.3 ± 31.1 μg m−3) and winter (44.5 ± 27.1 μg m−3), with that being 1.2–1.8 times higher than in other seasons. The levels of SO42− and NO3− in the atmosphere were influenced by emission sources, such as coal combustion, vehicle emission, and biomass burning; meteorological factors, such as stagnant weather conditions, a high RH, and plenty of sunshine; and complex atmospheric chemical processes, such as heterogeneous reactions, photochemical processes, and gas–particle equilibria. Therefore, the atmospheric chemical processes in Shanghai had a strong influence on the seasonal variation of both SO42− and NO3−. Previous studies have shown that atmospheric chemical processes led to increases in NO3− concentrations in winter at a higher RH and to decreases in NO3− concentrations in summer due to the volatilization of ammonium nitrate at a higher temperature [31] and the thermodynamic drive of NH4NO3 [32], thus increasing the seasonal distribution gap of NO3− between winter and summer.
OC and EC had similar seasonal distribution trends, with the highest values in winter (6.4 ± 3.6 μg m−3 and 2.1 ± 1.8 μg m−3), being 1.1–1.7 and 1.1–1.9 times higher than those of the other seasons, respectively, and the lowest in summer (3.7 ± 2.6 μg m−3 and 1.1 ± 0.9 μg m−3). This distribution characteristic was similar to that found by a previous study performed by Zhang et al. [24], who conducted continuous observations of OC and EC at 18 background and urban sites in China, finding that both were highest in winter and lowest in summer. This seasonal variation may be mainly influenced by emissions intensity and meteorological conditions, for instance, low-molecular semi-volatile organic compounds exist mainly in a gas phase at high temperatures in summer [33]. Studies have shown that secondary organics were present when the ratio of OC/EC was more than 2 [34]. In the present study, the OC/EC ratio averaged 2.8 throughout the year, with ratios of 2.9, 3.1, 2.6, and 2.9 in spring, summer, autumn, and winter, respectively, indicating the existence of secondary organics in Shanghai. Similar to OC, the concentration of secondary organic carbon (SOC) was highest in winter, which was mainly attributed to the enhanced coalescence process of SOC at lower temperatures [35]. In contrast, higher temperatures in summer favored gas–particle separation in the gas phase, therefore limiting the formation of SOC [36]. The contribution of carbonaceous substances to PM2.5 was roughly the same as the seasonal distribution of SNA, accounting for 22.9–25.9% of PM2.5. Although the highest concentrations of OM and EC were in winter, the contribution of OM to PM2.5 was highest in summer (21.8%) and lowest in spring (18.9%), and the contribution of EC was lowest in spring and winter (both 3.9%) and highest in autumn (5.0%), suggesting SNA was the main driving factor for hazy days in winter.
3.3. Chemical Composition Characteristics of Explosive Growth and Clean Days
To deeply study the mechanism of EG in Shanghai, the concentration and contribution of chemical components in PM2.5 during clean days (CDs) and during explosive growth in Shanghai in 2018 were compared (Figure 3). Considering the National Air Quality Standards in China (the second grade of the PM2.5 daily average mass concentrations; 75 μg m−3) and the PM2.5 concentrations in this work, PM2.5 mass concentrations below 75 μg m−3 were defined as CDs. A net increase of PM2.5 concentration more than or equal to 100 μg m−3 within 3, 6, or 9 h was defined as EG.
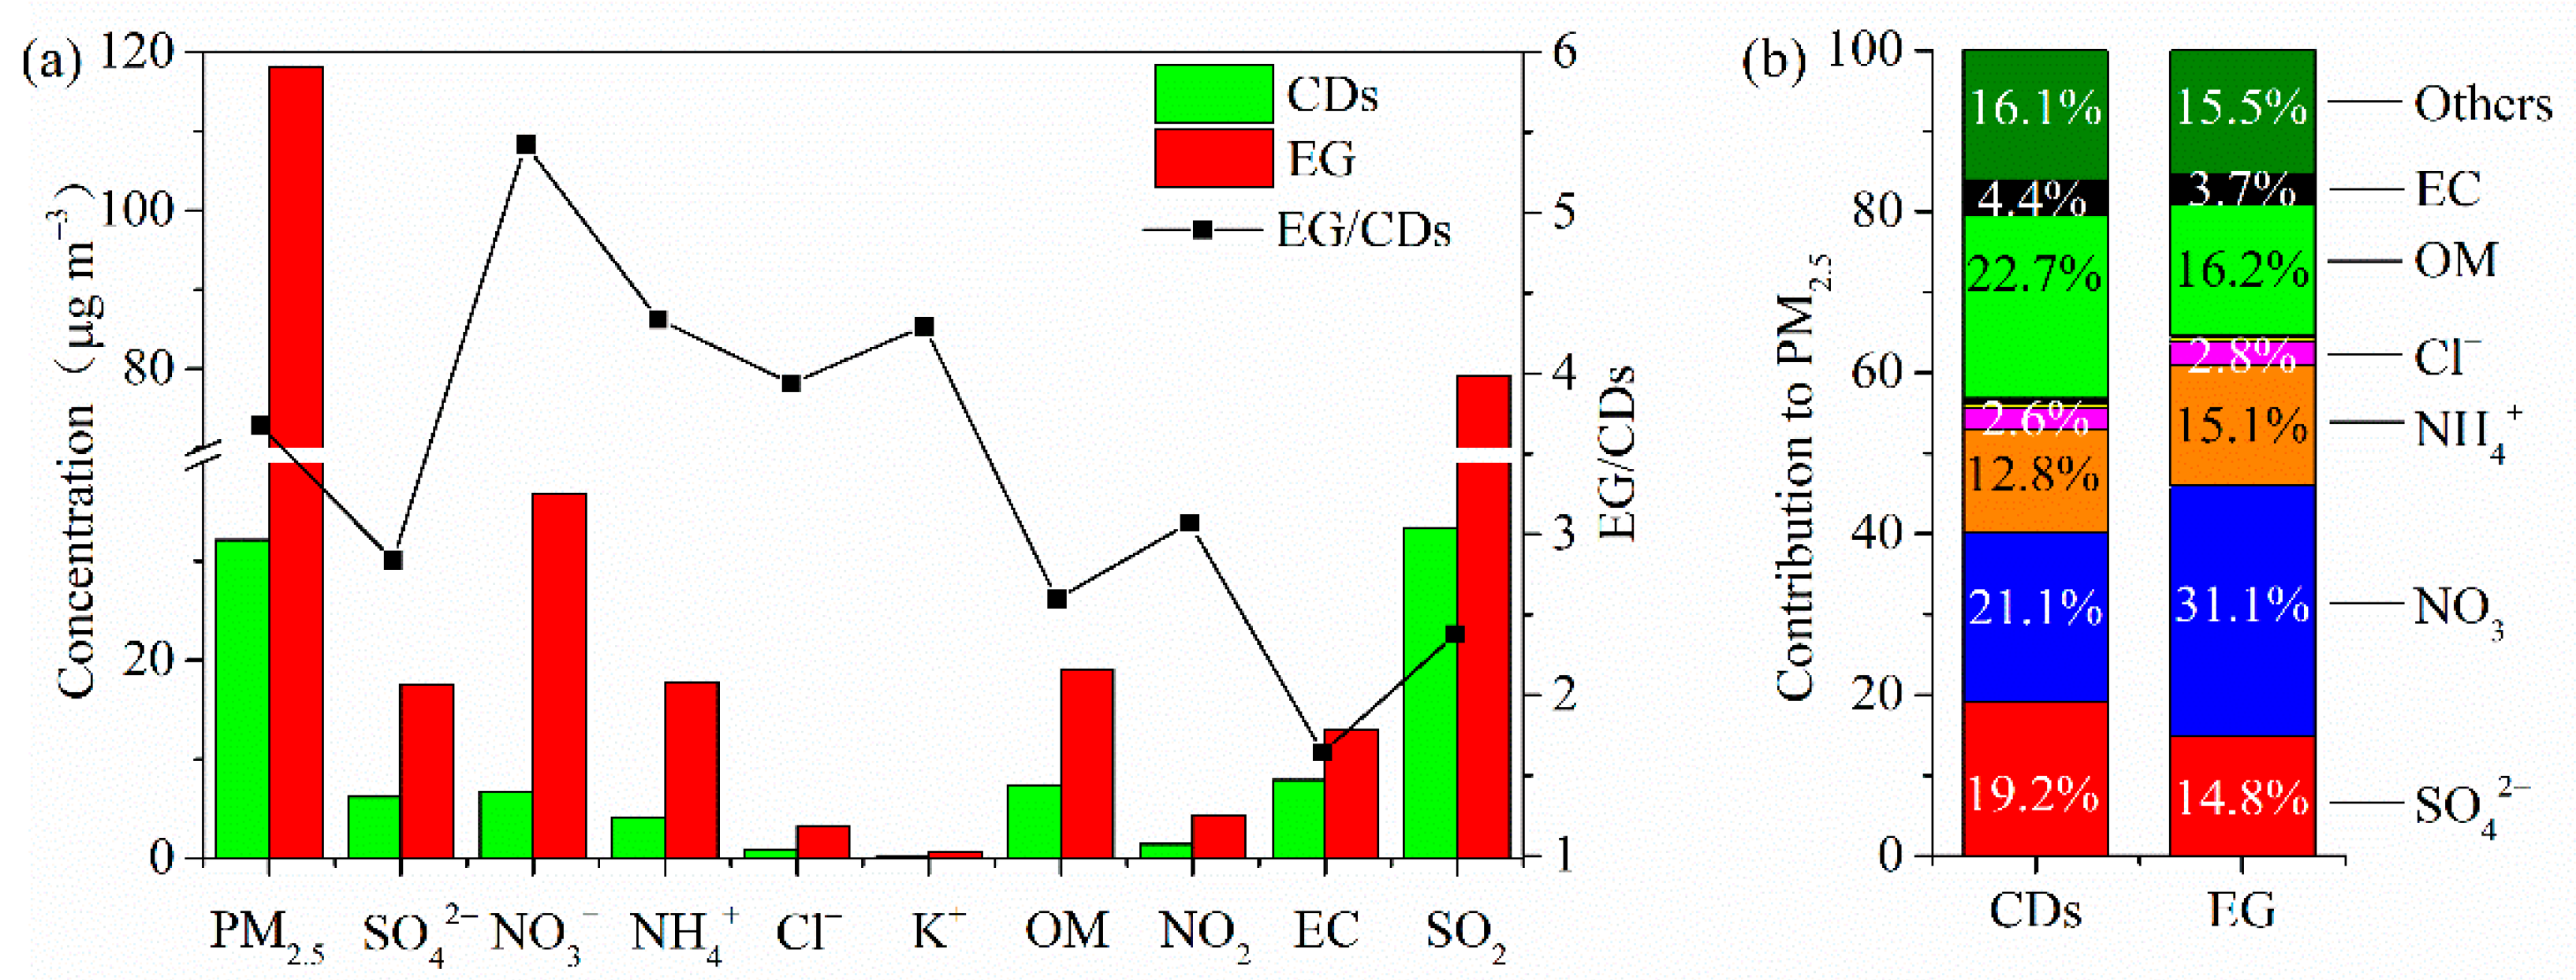
As shown in Figure 3a, the concentrations of PM2.5, water-soluble ions, carbonaceous substances, and gaseous precursors increased significantly during EG compared to CDs. PM2.5 concentration (118.1 μg m−3) was 3.7 times higher in EG periods than on CDs (32.1 μg m−3), with SNA being 2.8–5.4 times higher, as well as OM and EC being 2.6–3.1 times higher. The different increase rates of each chemical component of PM2.5 indicated that the contribution to EG of each chemical component was different. The largest growth was NO3− (5.4 times higher in EG periods than that of CDs), comparable increases in NH4+, K+, and Cl− (about 4 times higher), and the minimum enhancement was OM (2.6 times), indicating that both primary emissions and secondary transformations contributed to the EG. Both SO2 and NO2 increased during EG periods, but a larger growth in NO2 suggested that nitrogenous substances contributed more to the EG.
As shown in Figure 3b, the contribution of SNA during periods of EG (61%) was greater than that of CDs (53.1%), but the contribution of OM exhibited the opposite distribution. The results were in general agreement with a previous study that found that the contributions of SNA and OM to PM2.5 differed between the eastern coastal region of China and the North China Plain, and the contribution of SNA increased and decreased distinctly on hazy days and clean days, respectively, but it was contrary to OM [37]. Among SNA, NO3− contributed the most during EG, rising from 21.1% on CDs to 31.1% during EG. Similarly, NH4+ increased from 12.8% on CDs to 15.1% during EG; however, SO42− decreased from 19.2% on the CDs to 14.8% during EG. The increase in the percentage of SNA combined with the decrease in EC (from 4.9% on CDs to 3.9% during EG periods) indicated a strong secondary transformation process during EG. Such enhancement of secondary transformations may be related to stagnant weather conditions (e.g., WS less than 1.5 m s−1 in this study) and higher gas precursor levels, which accelerated the production and accumulation of secondary aerosols. To some degree, the higher contribution of NO3− during EG was also associated with higher RH and lower T in winter, and such meteorological conditions favored the conversion of the gaseous precursor NO2 to NO3−.
3.4. Case Study of Typical Explosive Growth Episodes
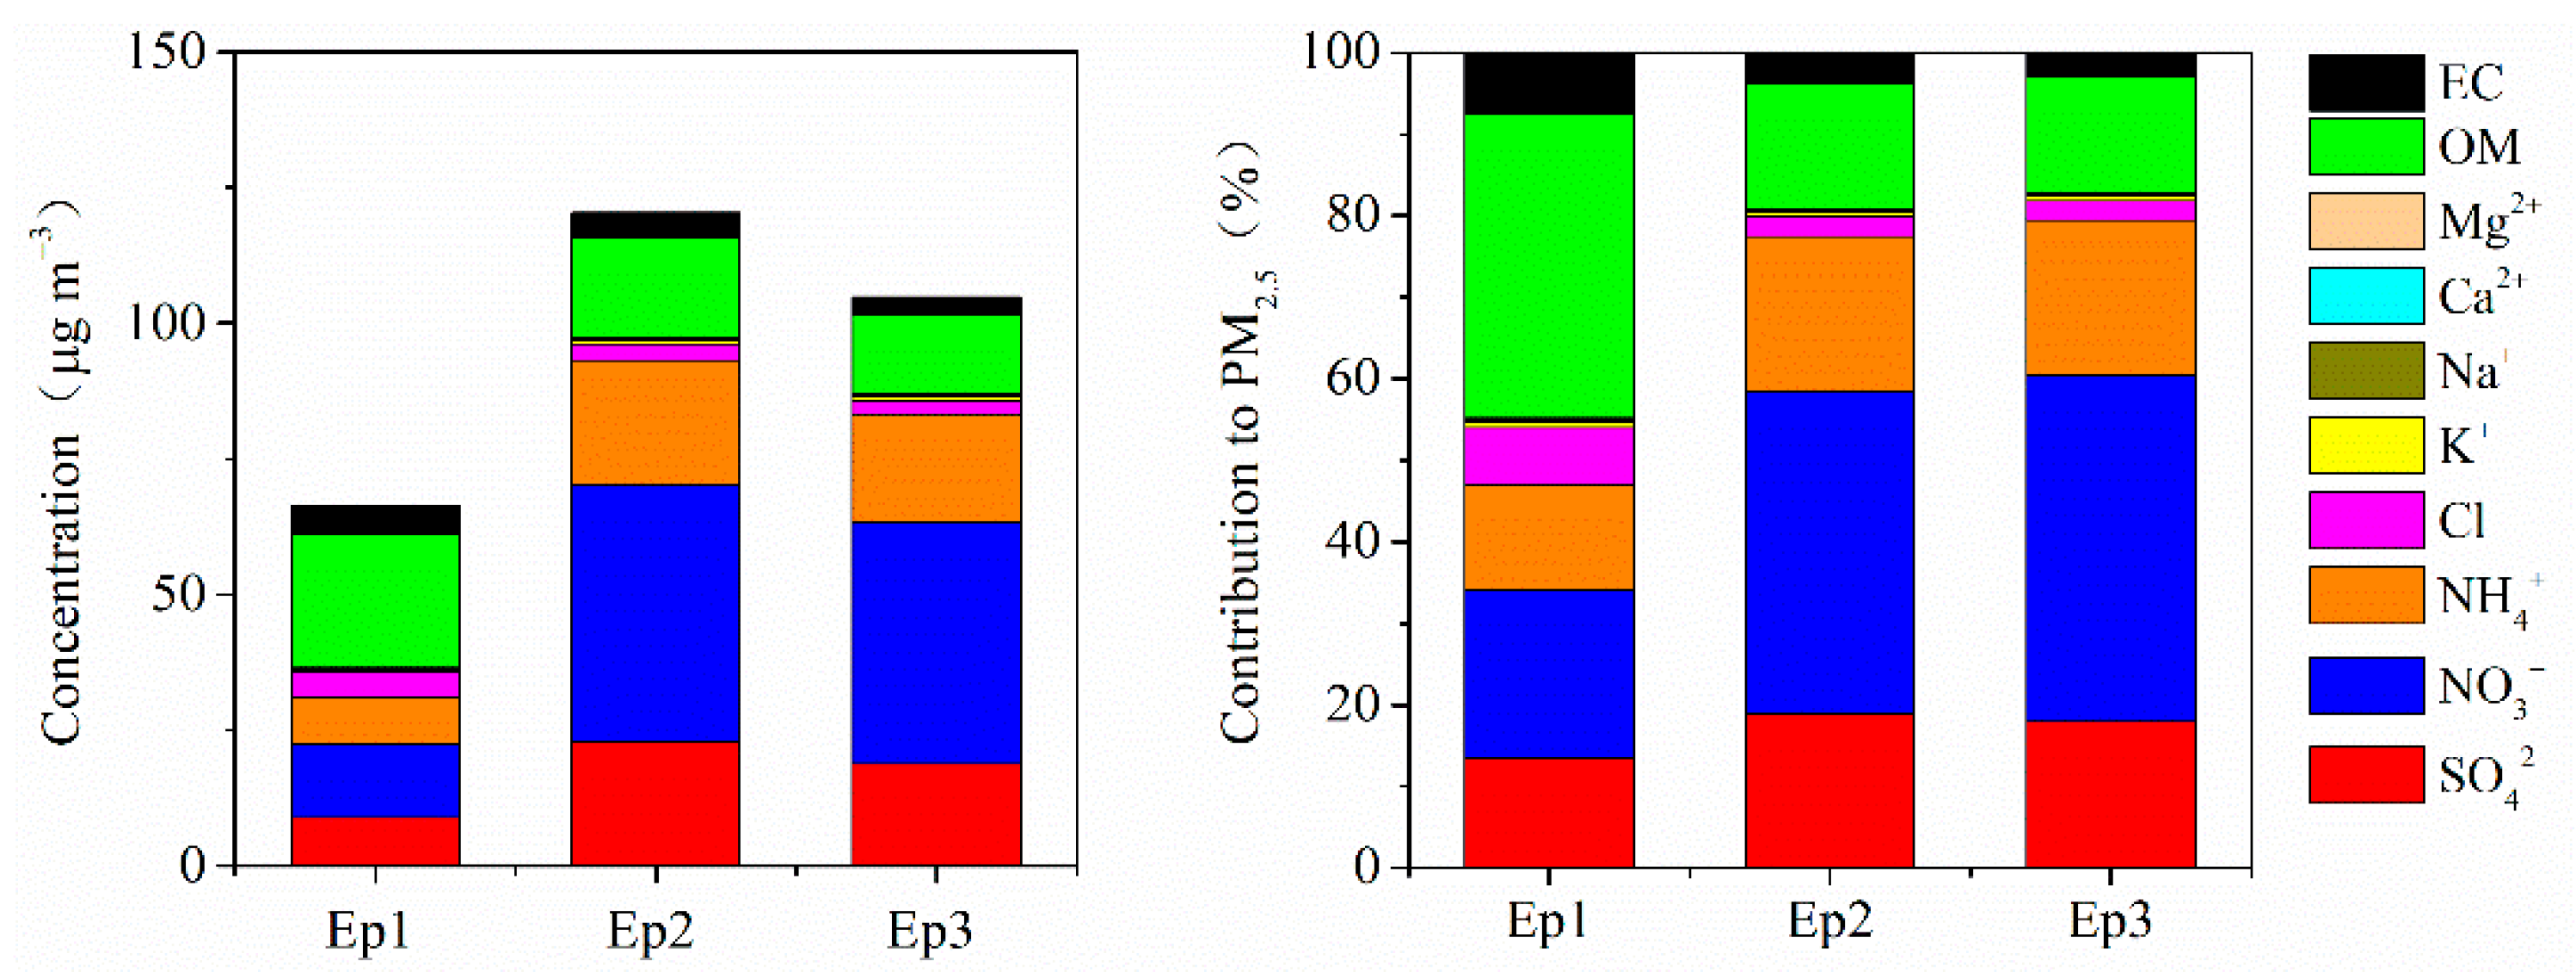
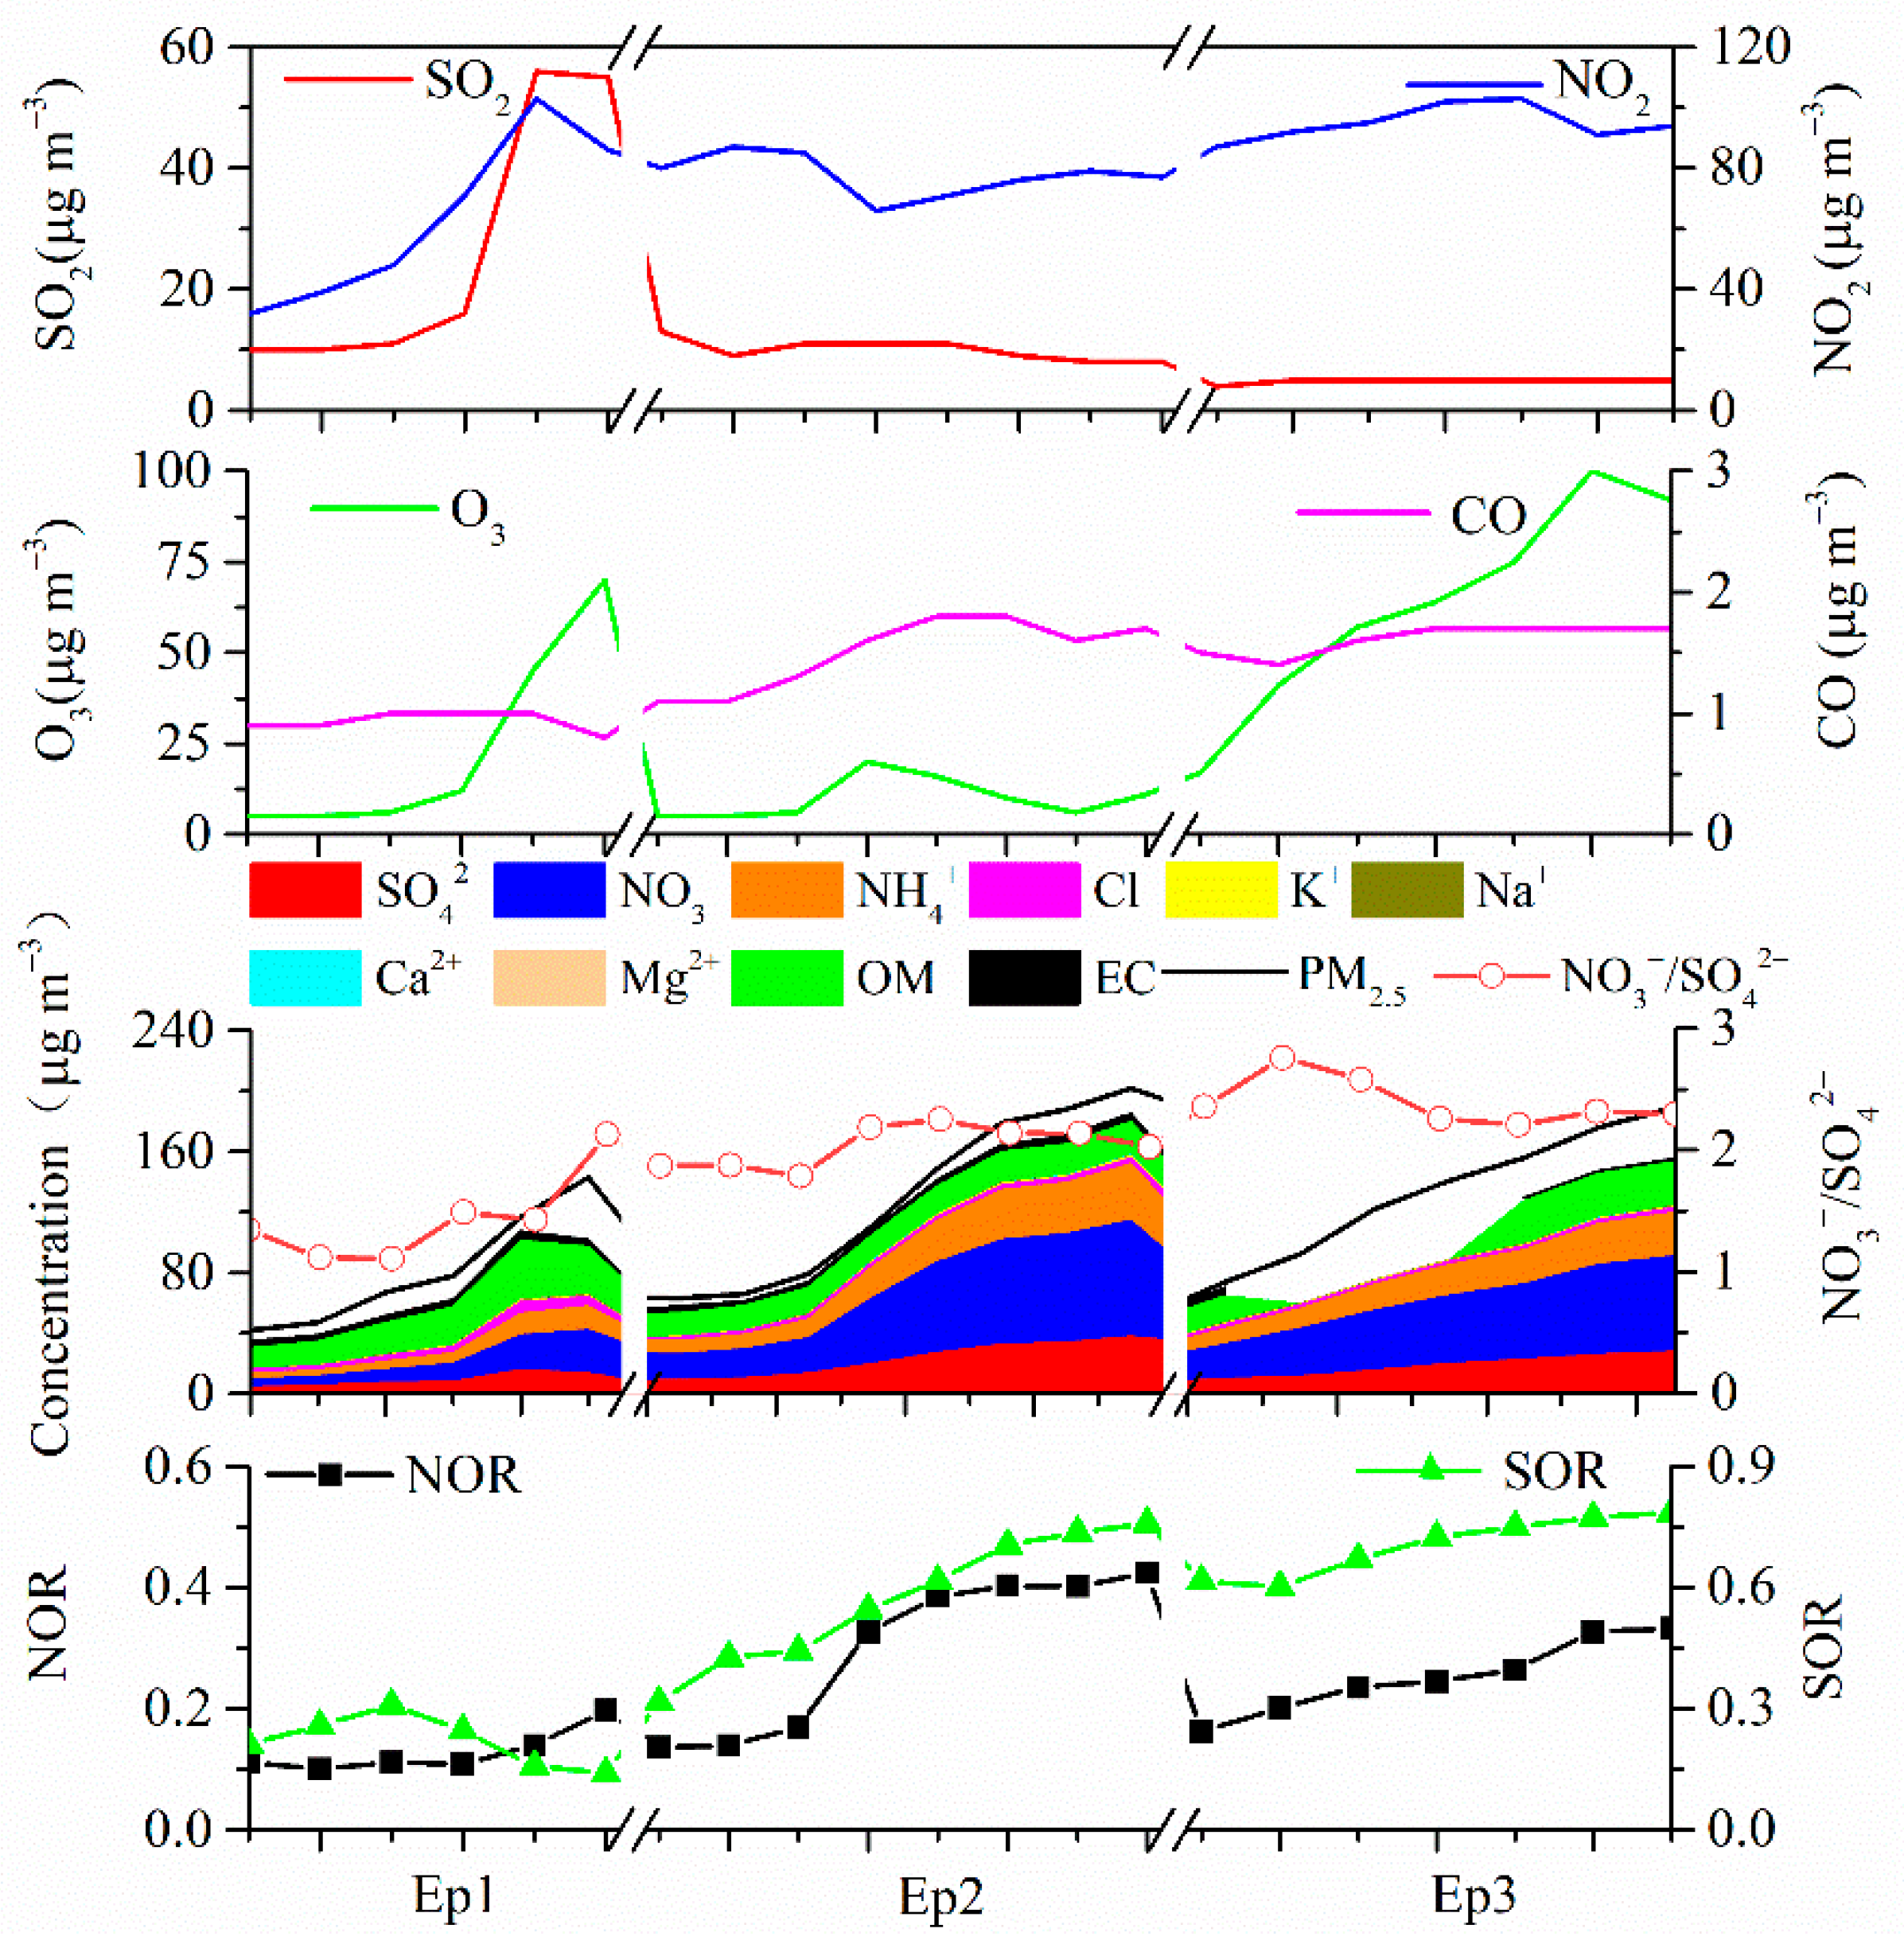
A total of 3 explosive growth episodes (Ep) occurred in Shanghai in 2018, 2 in winter and 1 in autumn, with a total duration of 21 h. Ep1 occurred from 08:00 to 13:00 on 15 January 2018; Ep2 occurred from 23:00 on 22 January to 06:00 on 23 January 2018; and Ep3 occurred from 10:00 to 16:00 on 27 November 2018. The highest PM2.5 concentration was measured in Ep3, with 135.7 μg m−3, followed by Ep2 (129.6 μg m−3), and Ep1 (82.3 μg m−3). As shown in Figure 4, the contributions of chemical components in Ep2 and Ep3 were relatively similar, with the largest contributions being NO3− (39% and 42%, respectively), followed by NH4+ (both 19%), and SO42− (19% and 18%, respectively). The contributions of OM and EC in Ep1 (29.9% and 8%) were highest, measuring more than twice the amounts registered in other EG events. The contribution of POC was also the highest in Ep1 (9.7%), 1.8 and 2.7 times higher than that in Ep2 (5.5%) and Ep3 (3.6%), respectively; however, the contribution of SOC was the highest in Ep3 (7.0%). The above results suggested that Ep1 was mainly driven by primary pollutants, while secondary aerosols were the main influencing factors in Ep2 and Ep3.
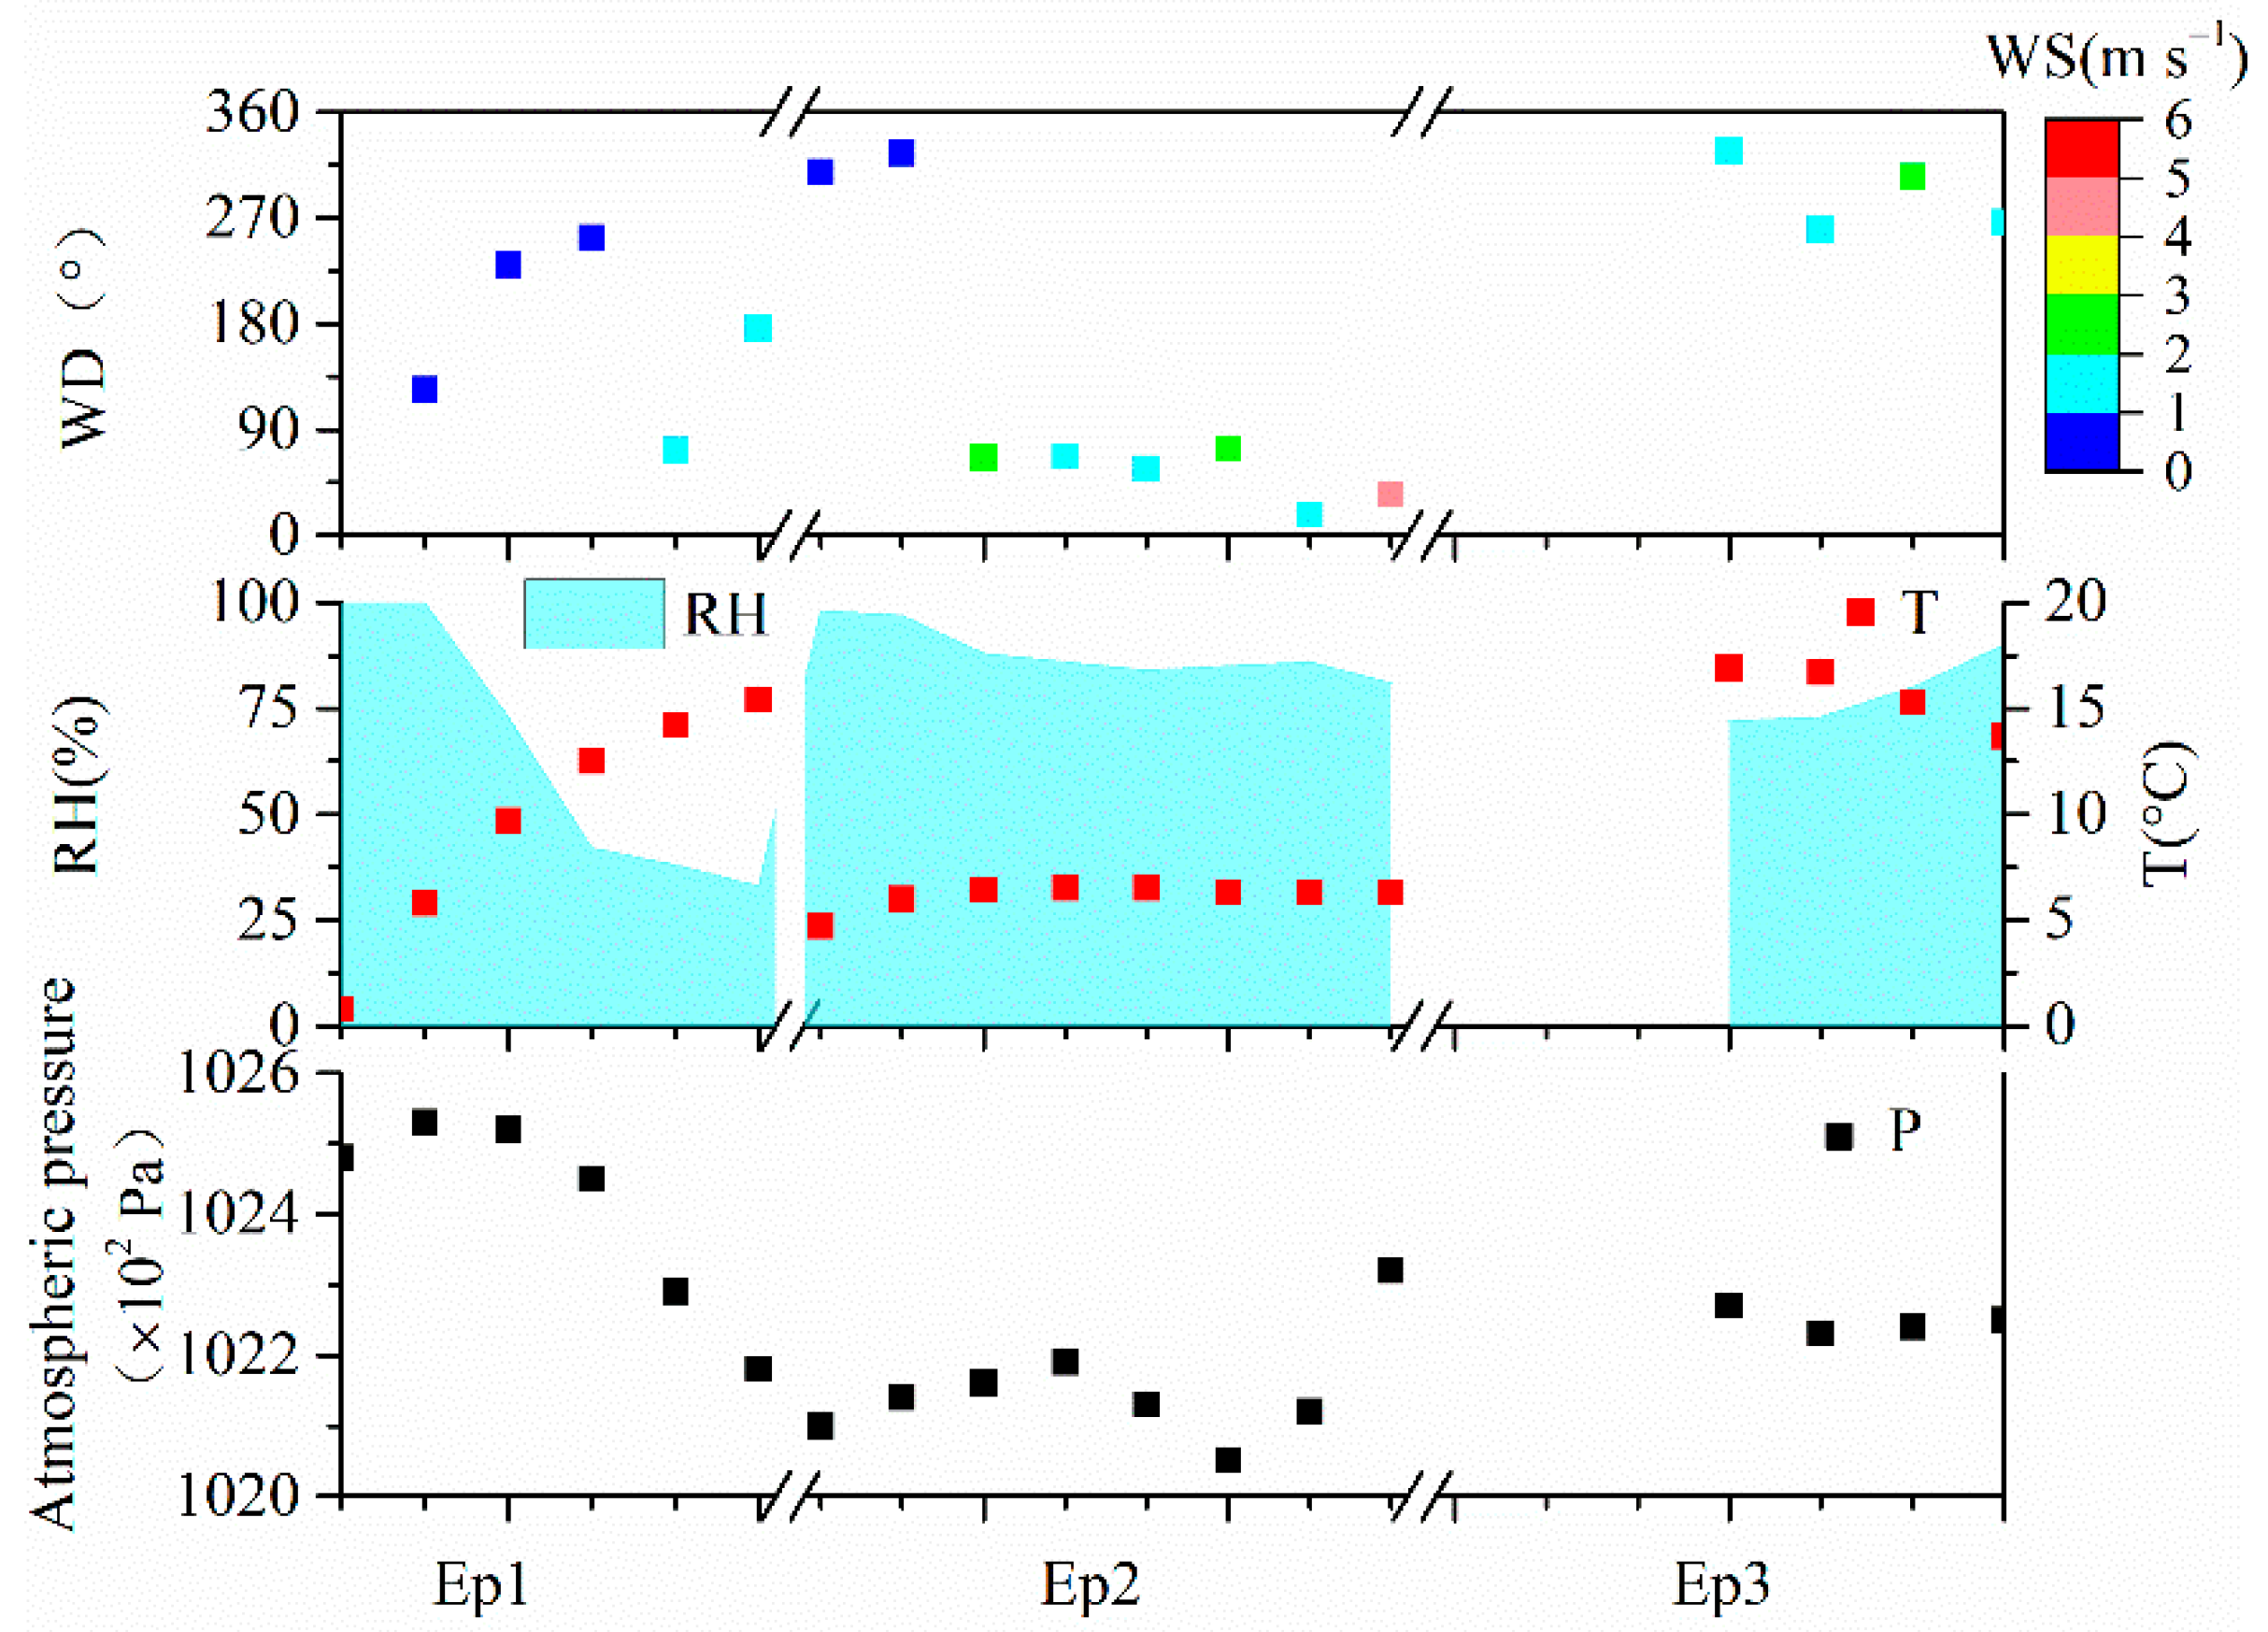
As shown in Figure 5, the O3 concentration was lower in Ep2 (<20 μg m−3) and higher in Ep1 (a maximum of 70 μg m−3) and Ep3 (a maximum of 100 μg m−3). Moreover, Ep2 occurred at night, and Ep1 and Ep3 occurred during the day. Zheng et al. [38] have shown that O3 is usually used as an indicator of photochemical processes. In addition, there was clearly a daily variation of O3 in this study, with the highest concentration at noon and lower values in the morning and evening (Figure 5), which was typical of photochemical processes [39]. The results were comparable to the existing conclusions that sunny days could trigger stronger photochemical reactions between 12:00 and 18:00 [40]. Therefore, the photochemical reaction was stronger during Ep1 and Ep3, while it was weaker in Ep2, implying different chemical formation mechanisms for Ep1, Ep3, and Ep2. The strong photochemical activities during Ep1 and Ep3 could generate sufficient oxidants (OH and H2O2 radicals) for gas-phase oxidation [41]. As T gradually increased and a strong photochemical effect occurred, it was beneficial to secondary aerosol formation by gas–particle oxidation reactions in Ep1 and Ep3. However, the percentage of secondary inorganic ions was lower in Ep1, along with the lower RH (64.3%) and wind speed (0.8 m s−1) in Ep1 (Figure 6 and Table 1), it was demonstrated that Ep1 was mainly influenced by gas–particle oxidation reactions.
It has been shown that stagnant weather conditions, higher RH, and primary emissions are the important causes in triggering atmospheric particulate-matter pollution [38]. The concentrations of NO2 gaseous precursors were higher in EG episodes (63.2 μg m−3, 77.6 μg m−3, and 94.9 μg m−3 for Ep1, Ep2, and Ep3, respectively), but SO2 concentrations were higher only in Ep1 (26.3 μg m−3, 10.0 μg m−3, and 4.9 μg m−3 for Ep1, Ep2, and Ep3, respectively). The concentrations of secondary inorganic ions (NO3− and SO42−) were low in Ep1, which was probably due to the low NOR (0.13) and SOR (0.22). Although the concentration of NO2 was high in Ep2 and Ep3, that of SO2 was lower than that in Ep1; thus, the high concentrations of the secondary inorganic ions NO3− and SO42− were closely related to the high NOR (0.29 and 0.25 for Ep2 and Ep3, respectively) and SOR (0.57 for Ep2 and 0.7 for Ep3). Apart from the effect of gas precursors, the chemical reaction was also influenced by weather conditions. The obvious enhancement of the RH during hazy days on the North China Plain promoted the liquid-phase formation of secondary inorganic aerosols, leading to a rapid increase in SO42− and NO3− concentrations [38,39]. In this study, the higher RH and proportions of secondary aerosols in Ep2 and Ep3 suggested that the high RH played a crucial role in the formation of explosive growth in Shanghai. The lower planetary boundary-layer (PBL) height, WS, and T during EG tended to form stagnant weather conditions, making it difficult for pollutants to disperse, accompanied by a high RH, which was conducive to the secondary transformation of gaseous pollutants [42,43]. Combining the high RH (88.1%) and lower O3 (9.9 μg m−3) level in Ep2, implies that Ep2 was dominated by heterogeneous reaction. However, both the RH (76.7%) and O3 (63.7 μg m−3) were high in Ep3; therefore, Ep3 was simultaneously influenced by gas-phase oxidation and heterogeneous reactions.
4. Conclusions
To further determine the mechanism of pollution formation, this study deeply explored the chemical reaction process and meteorological effects of EG episodes by analyzing PM2.5, water-soluble inorganic ions, carbonaceous substances, gaseous precursors, and meteorological factors in Shanghai in 2018. The annual average concentration of PM2.5 in Shanghai in 2018 was 43.2 μg m−3, and NO3−, SO42−, NH4+, and OM were the main chemical components of PM2.5, accounting for 75.9% of PM2.5. The seasonal variation showed that the highest value of PM2.5 in Shanghai in 2018 was in winter (56.5 ± 44.6 μg m−3), which was about 2 times higher than that in summer (29.4 ± 20.9 μg m−3). The difference in seasonal distribution of gas precursors (NO2 and SO2) and secondary ions (NO3− and SO42−) indicated that atmospheric chemical processes have an important influence on levels of both SO42− and NO3−. The increases and decreases in the percentage of SNA and EC from CDs to EG, respectively, indicated a strong secondary transformation during the EG.
The concentration of PM2.5 during EG in Shanghai in 2018 was 3.7 times higher than that on CDs, with the largest enhancement occurring in NO3− (5.4 times), comparable increases in NH4+, K+, Cl− (approximately 4 times), and the smallest increase in OM (2.6 times), indicating that both primary emissions and secondary transformations contributed to the EG. A total of 3 EG episodes were analyzed in this study; 2 occurred in winter and 1 occurred in autumn, with a total duration of 21 h. The PM2.5 concentration in Ep3 was highest (135.7 μg m−3), followed by that of Ep2 (129.6 μg m−3), and that of Ep1 (82.3 μg m−3). The contributions of chemical components were relatively similar in Ep2 and Ep3, and the highest contribution was NO3−, while OM contributed the most in Ep1. The contribution of primary pollutants to Ep1 was greater than that to other EG events, while Ep2 and Ep3 were mainly affected by secondary aerosols. The high O3 levels and stronger photochemical effects during Ep1 and Ep3 indicated that they were dominated by gas-phase oxidation reactions. The higher RH and contribution of secondary aerosols in Ep2 and Ep3 suggested that Ep2 and Ep3 were mainly influenced by heterogeneous reactions. This study indicated that stagnant weather conditions and chemical reaction processes made important contributions to the EG and improved our understanding of the causes of EG.
The contribution of SNA during EG (61%) was greater than that on CDs (53.1%); however, the contribution of OM exhibited the opposite distribution. In addition, among SNA, NO3− contributed the most during EG, rising from 21.1% on CDs to 31.1% during EG. Thus, we recommend paying more attention to secondary inorganic compounds in Shanghai, especially NO3−.
Author Contributions
Conceptualization, W.S.; methodology, W.S.; investigation, J.H. and Q.F.; resources, J.H. and Q.F.; data curation, W.S.; writing—original draft preparation, W.S.; writing—review and editing, W.S., Y.Z. and X.L.; visualization, W.S.; supervision, W.S. and X.L.; project administration, W.S.; funding acquisition, W.S. All authors have read and agreed to the published version of the manuscript.
Funding
This research was funded by Shanghai Sailing Program, grant number 21YF1418400; Climbing Program by Shanghai University of Medicine and Health Sciences, grant number A3-0200-22-311008-2; the Scientific Research Fund of Shanghai University of Medicine and Health Sciences, grant number SSF-21-05-013; and the High-Level Local University Construction Program of Shanghai, grant number E1-2602-21-201006-1.
Institutional Review Board Statement
Not applicable.
Informed Consent Statement
Not applicable.
Data Availability Statement
Not applicable.
Conflicts of Interest
The authors declare no conflict of interest. The funders had no role in the design of the study; in the collection, analyses, or interpretation of data; in the writing of the manuscript; or in the decision to publish the results.
References
- Zhong, J.; Zhang, X.; Dong, Y.; Wang, Y.; Liu, C.; Wang, J.; Zhang, Y.; Che, H. Feedback effects of boundary-layer meteorological factors on cumulative explosive growth of PM2.5 during winter heavy pollution episodes in Beijing from 2013 to 2016. Atmos. Chem. Phys. 2018, 18, 247–258. [Google Scholar] [CrossRef] [Green Version]
- Li, Y.E.; Zhu, B.; Lei, Y.; Li, C.; Wang, H.; Huang, C.; Zhou, M.; Miao, Q.; Wei, H.; Wu, Y.; et al. Characteristics, formation, and sources of PM2.5 in 2020 in Suzhou, Yangtze River Delta, China. Environ. Res. 2022, 212, 113545. [Google Scholar] [CrossRef] [PubMed]
- Amaladhasan, D.A.; Heyn, C.; Hoyle, C.R.; El Haddad, I.; Elser, M.; Pieber, S.M.; Slowik, J.G.; Amorim, A.; Duplissy, J.; Ehrhart, S.; et al. Modelling the gas-particle partitioning and water uptake of isoprene-derived secondary organic aerosol at high and low relative humidity. Atmos. Chem. Phys. 2022, 22, 244. [Google Scholar] [CrossRef]
- He, K.; Yang, F.; Ma, Y.; Zhang, Q.; Yao, X.; Chan, C.K.; Cadle, S.; Chan, T.; Mulawa, P. The characteristics of PM2.5 in Beijing, China. Atmos. Environ. 2001, 35, 4959–4970. [Google Scholar] [CrossRef]
- Chen, Z.; Xie, X.; Cai, J.; Chen, D.; Gao, B.; He, B.; Cheng, N.; Xu, B. Understanding meteorological influences on PM2.5 concentrations across China: A temporal and spatial perspective. Atmos. Chem. Phys. 2018, 18, 5343–5358. [Google Scholar] [CrossRef] [Green Version]
- Zhang, X.; Zhong, J.; Wang, J.; Wang, Y.; Liu, Y. The interdecadal worsening of weather conditions affecting aerosol pollution in the Beijing area in relation to climate warming. Atmos. Chem. Phys. 2018, 18, 5991–5999. [Google Scholar] [CrossRef] [Green Version]
- Li, R.; Cui, L.; Liang, J.; Zhao, Y.; Zhang, Z.; Fu, H. Estimating historical SO2 level across the whole China during 1973–2014 using random forest model. Chemosphere 2020, 247, 125839. [Google Scholar] [CrossRef]
- Ye, W.; Ma, Z.; Ha, X. Spatial-temporal patterns of PM2.5 concentrations for 338 Chinese cities. Sci. Total Environ. 2018, 631, 524–533. [Google Scholar] [CrossRef]
- Zhai, B.; Chen, J. Development of a stacked ensemble model for forecasting and analyzing daily average PM2.5 concentrations in Beijing, China. Sci. Total Environ. 2018, 635, 644–658. [Google Scholar] [CrossRef]
- Cheng, J.; Su, J.; Cui, T.; Li, X.; Dong, X.; Sun, F.; Yang, Y.; Tong, D.; Zheng, Y.; Li, Y.; et al. Dominant role of emission reduction in PM2.5 air quality improvement in Beijing during 2013–2017: A model-based decomposition analysis. Atmos. Chem. Phys. 2019, 19, 6125–6146. [Google Scholar] [CrossRef] [Green Version]
- Wang, J.; Ge, X.; Sonya, C.; Ye, J.; Lei, Y.; Chen, M.; Zhang, Q. Influence of regional emission controls on the chemical composition, sources, and size distributions of submicron aerosols: Insights from the 2014 Nanjing Youth Olympic Games. Sci. Total Environ. 2022, 807, 150869. [Google Scholar] [CrossRef] [PubMed]
- Sun, W.; Wang, D.; Yao, L.; Fu, H.; Fu, Q.; Wang, H.; Li, Q.; Wang, L.; Yang, X.; Xian, A.; et al. Chemistry-triggered events of PM2.5 explosive growth during late autumn and winter in Shanghai, China. Environ. Pollut. 2019, 254, 112864. [Google Scholar] [CrossRef] [PubMed]
- Li, R.; Hu, Y.; Li, L.; Fu, H.; Chen, J. Real-time aerosol optical properties, morphology and mixing states under clear, haze and fog episodes in the summer of urban Beijing. Atmos. Chem. Phys. 2017, 17, 5093. [Google Scholar] [CrossRef] [Green Version]
- Xuan, X.; Chen, Z.; Gong, Y.; Shen, H.; Shiyi, C. Partitioning of hydrogen peroxide in gas-liquid and gas-aerosol phases. Atmos. Chem. Phys. 2020, 20, 5513–5526. [Google Scholar] [CrossRef]
- Leng, C.; Duan, J.; Xu, C.; Zhang, H.; Wang, Y.; Wang, Y.; Li, X.; Kong, L.; Tao, J.; Zhang, R.; et al. Insights into a historic severe haze event in Shanghai: Synoptic situation, boundary layer and pollutants. Atmos. Chem. Phys. 2016, 16, 9221–9234. [Google Scholar] [CrossRef] [Green Version]
- Sun, W.; Huo, J.; Li, R.; Wang, D.; Yao, L.; Fu, Q.; Feng, J. Effects of energy structure differences on chemical compositions and respiratory health of PM2.5 during late autumn and winter in China. Sci. Total Environ. 2022, 824, 153850. [Google Scholar] [CrossRef]
- Wang, Y.; Yao, L.; Wang, L.; Liu, Z.; Ji, D.; Tang, G.; Zhang, J.; Sun, Y.; Hu, B.; Xin, J. Mechanism for the formation of the January 2013 heavy haze pollution episode over central and eastern China. Sci. China Earth Sci. 2013, 57, 14–25. [Google Scholar] [CrossRef]
- Zhang, R.; Jing, J.; Tao, J.; Hsu, S.C.; Wang, G.; Cao, J.; Lee, C.S.L.; Zhu, L.; Chen, Z.; Zhao, Y.; et al. Chemical characterization and source apportionment of PM2.5 in Beijing: Seasonal perspective. Atmos. Chem. Phys. 2013, 13, 7053–7074. [Google Scholar] [CrossRef] [Green Version]
- Fang, X.; Fan, Q.; Liao, Z.; Xie, J.; Xu, X.; Fan, S. Spatial-temporal characteristics of the air quality in the Guangdong–Hong Kong–Macau Greater Bay Area of China during 2015–2017. Atmos. Environ. 2019, 210, 14–34. [Google Scholar] [CrossRef]
- Zhou, S.; Yang, L.; Gao, R.; Wang, X.; Gao, X.; Nie, W.; Xu, P.; Zhang, Q.; Wang, W. A comparison study of carbonaceous aerosols in a typical North China Plain urban atmosphere: Seasonal variability, sources and implications to haze formation. Atmos. Environ. 2017, 149, 95–103. [Google Scholar] [CrossRef]
- Tao, J.; Zhang, L.; Gao, J.; Wang, H.; Chai, F.; Wang, S. Aerosol chemical composition and light scattering during a winter season in Beijing. Atmos. Environ. 2015, 110, 36–44. [Google Scholar] [CrossRef]
- Hao, J.M.; Wang, L.T.; Li, L.; Hu, J.N.; Yu, X.C. Air pollutants contribution and control strategies of energy-use related sources in Beijing. Sci. China Ser. D 2005, 48, 138–146. [Google Scholar]
- Duan, F.K.; Liu, X.D.; He, K.B.; Lu, Y.Q.; Wang, L. Atmospheric aerosol concentration level and chemical characteristics of water-soluble ionic species in wintertime in Beijing, China. J. Environ. Monit. 2003, 5, 569–573. [Google Scholar] [CrossRef] [PubMed]
- Zhang, X.Y.; Wang, Y.Q.; Zhang, X.C.; Guo, W.; Gong, S.L. Carbonaceous aerosol composition over various regions of China during 2006. J. Geophys. Res. Atmos. 2008, 113, D14111. [Google Scholar] [CrossRef]
- Wang, H.; Tian, M.; Chen, Y.; Shi, G.; Liu, Y.; Yang, F.; Zhang, L.; Deng, L.; Yu, J.; Peng, C.; et al. Seasonal characteristics, formation mechanisms and source origins of PM2.5 in two megacities in Sichuan Basin, China. Atmos. Chem. Phys. 2018, 18, 865–881. [Google Scholar] [CrossRef] [Green Version]
- Zhao, M.; Huang, Z.; Qiao, T.; Zhang, Y.; Xiu, G.; Yu, J. Chemical characterization, the transport pathways and potential sources of PM2.5 in Shanghai: Seasonal variations. Atmos. Res. 2015, 158, 66–78. [Google Scholar] [CrossRef]
- Zheng, X.Y.; Liu, X.D.; Zhao, F.H.; Duan, F.K.; Yu, T.; Cachier, H. Seasonal characteristics of biomass burning contribution to Beijing aerosol. Sci. China Ser. B 2005, 48, 481–488. [Google Scholar] [CrossRef]
- He, K.; Zhao, Q.; Ma, Y.; Duan, F.; Yang, F.; Shi, Z.; Chen, G. Spatial and seasonal variability of PM2.5 acidity at two Chinese megacities: Insights into the formation of secondary inorganic aerosols. Atmos. Chem. Phys. 2012, 12, 1377–1395. [Google Scholar] [CrossRef] [Green Version]
- Wang, H.; Peng, Y.; Zhang, X.; Liu, H.; Zhang, M.; Che, H.; Cheng, Y.; Zheng, Y. Contributions to the explosive growth of PM2.5 mass due to aerosol–radiation feedback and decrease in turbulent diffusion during a red alert heavy haze in Beijing–Tianjin–Hebei, China. Atmos. Chem. Phys. 2018, 18, 17717–17733. [Google Scholar] [CrossRef] [Green Version]
- Li, R.; Zhao, Y.; Zhou, W.; Meng, Y.; Zhang, Z.; Fu, H. Developing a novel hybrid model for the estimation of surface 8 h ozone (O-3) across the remote Tibetan Plateau during 2005–2018. Atmos. Chem. Phys. 2020, 20, 6175. [Google Scholar] [CrossRef]
- Squizzato, S.; Masiol, M.; Brunelli, A.; Pistollato, S.; Tarabotti, E.; Rampazzo, G.; Pavoni, B. Factors determining the formation of secondary inorganic aerosol: A case study in the Po Valley (Italy). Atmos. Chem. Phys. 2013, 13, 1927–1939. [Google Scholar] [CrossRef] [Green Version]
- Wang, D.; Zhou, B.; Fu, Q.; Zhao, Q.; Zhang, Q.; Chen, J.; Yang, X.; Duan, Y.; Li, J. Intense secondary aerosol formation due to strong atmospheric photochemical reactions in summer: Observations at a rural site in eastern Yangtze River Delta of China. Sci. Total Environ. 2016, 571, 1454–1466. [Google Scholar] [CrossRef] [PubMed]
- Yassaa, N.; Meklati, B.Y.; Cecinato, A.; Marino, F. Organic aerosols in urban and waste landfill of Algiers metropolitan area: Occurrence and sources. Environ. Sci. Technol. 2001, 35, 306–311. [Google Scholar] [CrossRef] [PubMed]
- Chow, J.C.; Watson, J.G.; Lu, Z.Q.; Lowenthal, D.H.; Frazier, C.A.; Solomon, P.A.; Thuillier, R.H.; Magliano, K. Descriptive analysis of PM2.5 and PM10 at regionally representative locations during SJVAQS/AUSPEX. Atmos. Environ. 1996, 30, 2079–2112. [Google Scholar] [CrossRef]
- Cesari, D.; Donateo, A.; Conte, M.; Merico, E.; Giangreco, A.; Giangreco, F.; Contini, D. An inter-comparison of PM2.5 at urban and urban background sites: Chemical characterization and source apportionment. Atmos. Res. 2016, 174, 106–119. [Google Scholar] [CrossRef]
- Strader, R.; Lurmann, F.; Pandis, S.N. Evaluation of secondary organic aerosol formation in winter. Atmos. Environ. 1999, 33, 4849–4863. [Google Scholar] [CrossRef]
- Zhang, Y.; Huang, W.; Cai, T.; Fang, D.; Wang, Y.; Song, J.; Hu, M.; Zhang, Y. Concentrations and chemical compositions of fine particles (PM2.5) during haze and non-haze days in Beijing. Atmos. Res. 2016, 174, 62–69. [Google Scholar] [CrossRef]
- Zheng, G.J.; Duan, F.K.; Su, H.; Ma, Y.L.; Cheng, Y.; Zheng, B.; Zhang, Q.; Huang, T.; Kimoto, T.; Chang, D.; et al. Exploring the severe winter haze in Beijing: The impact of synoptic weather, regional transport and heterogeneous reactions. Atmos. Chem. Phys. 2015, 15, 2969–2983. [Google Scholar] [CrossRef] [Green Version]
- Zhao, X.J.; Zhao, P.S.; Xu, J.; Meng, W.; Pu, W.W.; Dong, F.; He, D.; Shi, Q.F. Analysis of a winter regional haze event and its formation mechanism in the North China Plain. Atmos. Chem. Phys. 2013, 13, 5685–5696. [Google Scholar] [CrossRef] [Green Version]
- Hua, W.; Chen, Z.M.; Jie, C.Y.; Kondo, Y.; Hofzumahaus, A.; Takegawa, N.; Chang, C.C.; Lu, K.D.; Miyazaki, Y.; Kita, K.; et al. Atmospheric hydrogen peroxide and organic hydroperoxides during PRIDE-PRD’06, China: Their concentration, formation mechanism and contribution to secondary aerosols. Atmos. Chem. Phys. 2008, 8, 6755–6773. [Google Scholar] [CrossRef] [Green Version]
- Tian, M.; Wang, H.; Chen, Y.; Yang, F.; Zhang, X.; Zou, Q.; Zhang, R.; Ma, Y.; He, K. Characteristics of aerosol pollution during heavy haze events in Suzhou, China. Atmos. Chem. Phys. 2016, 16, 7357–7371. [Google Scholar] [CrossRef] [Green Version]
- Tian, M.; Wang, H.; Chen, Y.; Zhang, L.; Shi, G.; Liu, Y.; Yu, J.; Zhai, C.; Wang, J.; Yang, F. Highly time-resolved characterization of water-soluble inorganic ions in PM2.5 in a humid and acidic mega city in Sichuan Basin, China. Sci. Total Environ. 2017, 580, 224–234. [Google Scholar] [CrossRef] [PubMed]
- Chen, D.; Cui, H.; Zhao, Y.; Yin, L.; Lu, Y.; Wang, Q. A two-year study of carbonaceous aerosols in ambient PM2.5 at a regional background site for western Yangtze River Delta, China. Atmos. Res. 2017, 183, 351–361. [Google Scholar] [CrossRef]
Figure 1.
Concentrations and contributions of the chemical PM2.5 components for each season.

Figure 2.
Seasonal distributions of chemical PM2.5 components and gas pollutants. Note that the middle horizontal line, small rectangle, up-line, and the down-line of each histogram denotes the median, average, 25% quantile, and 75% quantile, respectively. The short lines, located above and below each histogram, represent the maximum and minimum values, respectively.

Figure 3.
Concentrations of PM2.5, ions, carbonaceous compounds, and gas precursors (a); and contributions of chemical PM2.5 components (b) during CDs and EG.
Figure 3.
Concentrations of PM2.5, ions, carbonaceous compounds, and gas precursors (a); and contributions of chemical PM2.5 components (b) during CDs and EG.

Figure 4.
Concentrations and contributions of chemical PM2.5 components during EG.

Figure 5.
Time trend of PM2.5, chemical components, and gas compounds during EG.

Figure 6.
Horizontal ground meteorological conditions during EG.


Table 1.
Meteorological factors and PM2.5 concentration during CDs and EG.
| T (°C) | RH (%) | WS (m s−1) | PM2.5 (μg m−3) | |
|---|---|---|---|---|
| Ep1 | 9.7 | 64.3 | 0.82 | 82.3 |
| Ep2 | 6.1 | 88.1 | 1.9 | 129.6 |
| Ep3 | 15.7 | 78.8 | 1.7 | 135.7 |
| CDs | 18.4 | 76.7 | 2.2 | 32.1 |
Publisher’s Note: MDPI stays neutral with regard to jurisdictional claims in published maps and institutional affiliations. |
© 2022 by the authors. Licensee MDPI, Basel, Switzerland. This article is an open access article distributed under the terms and conditions of the Creative Commons Attribution (CC BY) license (https://creativecommons.org/licenses/by/4.0/).
Share and Cite
MDPI and ACS Style
Sun, W.; Huo, J.; Fu, Q.; Zhang, Y.; Lin, X. Influence of Meteorological Factors and Chemical Processes on the Explosive Growth of PM2.5 in Shanghai, China. Atmosphere 2022, 13, 1068. https://0-doi-org.brum.beds.ac.uk/10.3390/atmos13071068
AMA Style
Sun W, Huo J, Fu Q, Zhang Y, Lin X. Influence of Meteorological Factors and Chemical Processes on the Explosive Growth of PM2.5 in Shanghai, China. Atmosphere. 2022; 13(7):1068. https://0-doi-org.brum.beds.ac.uk/10.3390/atmos13071068
Chicago/Turabian StyleSun, Wenwen, Juntao Huo, Qingyan Fu, Yuxin Zhang, and Xiangde Lin. 2022. "Influence of Meteorological Factors and Chemical Processes on the Explosive Growth of PM2.5 in Shanghai, China" Atmosphere 13, no. 7: 1068. https://0-doi-org.brum.beds.ac.uk/10.3390/atmos13071068
Note that from the first issue of 2016, this journal uses article numbers instead of page numbers. See further details here.