
Stratospheric Chemical Lifetime of Aviation Fuel Incomplete Combustion Products


1
Department of Earth, Atmospheric and Planetary Sciences, Massachusetts Institute of Technology, 77 Massachusetts Avenue, Cambridge, MA 02139, USA
2
School of Physics & Astronomy, Cardiff University, 4 The Parade, Cardiff CF24 3AA, UK
3
Rufus Scientific Ltd., 37 The Moor, Melbourn, Royston, Herts SG8 6ED, UK
4
Department of Physics, Massachusetts Institute of Technology, 77 Massachusetts Avenue, Cambridge, MA 02139, USA
5
Department of Aeronautics and Astronautics, Massachusetts Institute of Technology, 77 Massachusetts Avenue, Cambridge, MA 02139, USA
*
Author to whom correspondence should be addressed.
Atmosphere 2022, 13(8), 1209; https://0-doi-org.brum.beds.ac.uk/10.3390/atmos13081209
Submission received: 22 March 2022
/
Revised: 26 July 2022
/
Accepted: 26 July 2022
/
Published: 1 August 2022
(This article belongs to the Section Upper Atmosphere)
Abstract
:The stratosphere contains haze rich in sulfuric acid, which plays a significant role in stratospheric chemistry and in global climate. Commercial aircraft deposit significant amounts of incomplete combustion products into the lower stratosphere. We have studied the stability of these incomplete combustion products to reaction with sulfuric acid, using a predictive model based on experimental reaction kinetics. We demonstrate that sulfuric acid chemistry is likely to be a significant component of the chemistry of organics in the stratosphere. We find that at least 25 of the 40 known incomplete combustion products from aviation fuel have lifetimes to reaction with aerosol sulfuric acid of at least months. We estimate that ~109 kg of long-lived products could be deposited per year in the lower stratosphere. We suggest that the high molecular weight organic compounds formed as incomplete combustion products of commercial long-haul aviation could play a significant role in the stratosphere.
1. Introduction
The stratosphere between the tropopause and ~30 km altitude contains aerosol particles that play a significant role in stratospheric chemistry and climate [1]. The aerosol particles are composed primarily of concentrated sulfuric acid [2] derived from oxidation of volcanic SO2 [3,4,5]. Most of these are spherical and hence likely to be liquid [6,7], even at the poles [8] where the conventional phase diagram suggests they should freeze [9], suggesting the persistence of super-cooled droplets. While the aerosol droplets are mainly sulfuric acid, minor components such as nitric acid, halogen compounds [10], amines and organics can have a dramatic effect on the chemistry of the aerosols, and hence on the overall chemistry of the stratosphere (e.g., [11]).
The chemistry and fate of low molecular weight organic chemicals in stratospheric aerosols has been studied extensively [1,2,3,4,10,12,13]. Jet exhausts have been considered as source of such chemicals, but studies both on the ground and in flight generally focus on measuring low molecular weight oxidation products, such as CO, NOx, H2SO4, HNO3 and O3 (e.g., [14,15,16,17]). Although hydrocarbons are often listed among the emissions of commercial aircraft (e.g., [18]) only a few, low molecular weight organics such as methane, acetone and acetaldehyde [19] have been measured. Measurement of molecules of higher molecular weight than NOx, H2SO4, acetone, etc., is confined to contrasting the numbers and/or sizes of volatile vs. involatile aerosol particles or condensation nuclei (e.g., [14,16,20,21,22]). Interplanetary grains collected from higher altitudes are reported to have a surface of organic ‘glue’, but the nature of this coating is hard to determine [23]. Soot is present in jet exhaust [24] but there is no explicit chemical analysis of what the volatile particles are. Thus Renard et al. [25] review the sources of organics in the stratosphere and considers only soot as an aircraft source of carbon. However, ground-level studies suggest that a range of high molecular weight organics may be generated by commercial jet engines in cruise flight [26,27]. The fate of these chemicals would therefore be of significance to stratospheric chemistry.
We have recently compiled a detailed model of the reactivity of organic chemicals to sulfuric acid [28], which is applicable over a wide range of conditions. In this paper we apply this model to the combustion products of aviation fuel, to explore the extent to which the organics generated by incomplete combustion of aviation fuel could persist under stratospheric conditions. Aviation fuel combustion products are expected to be injected directly into the lower stratosphere by long-distance air travel, unlike other anthropogenic chemicals. We apply our model to test if combustion products could be a source of long-lived pollutants in the lower stratosphere. We find that 25 out of 40 jet fuel combustion products have a predicted half-life to destruction by sulfuric acid of >107 s, and so could remain in the stratosphere for months or longer.
2. Materials and Methods
2.1. Concentration of Sulfuric Acid in Stratospheric Droplets
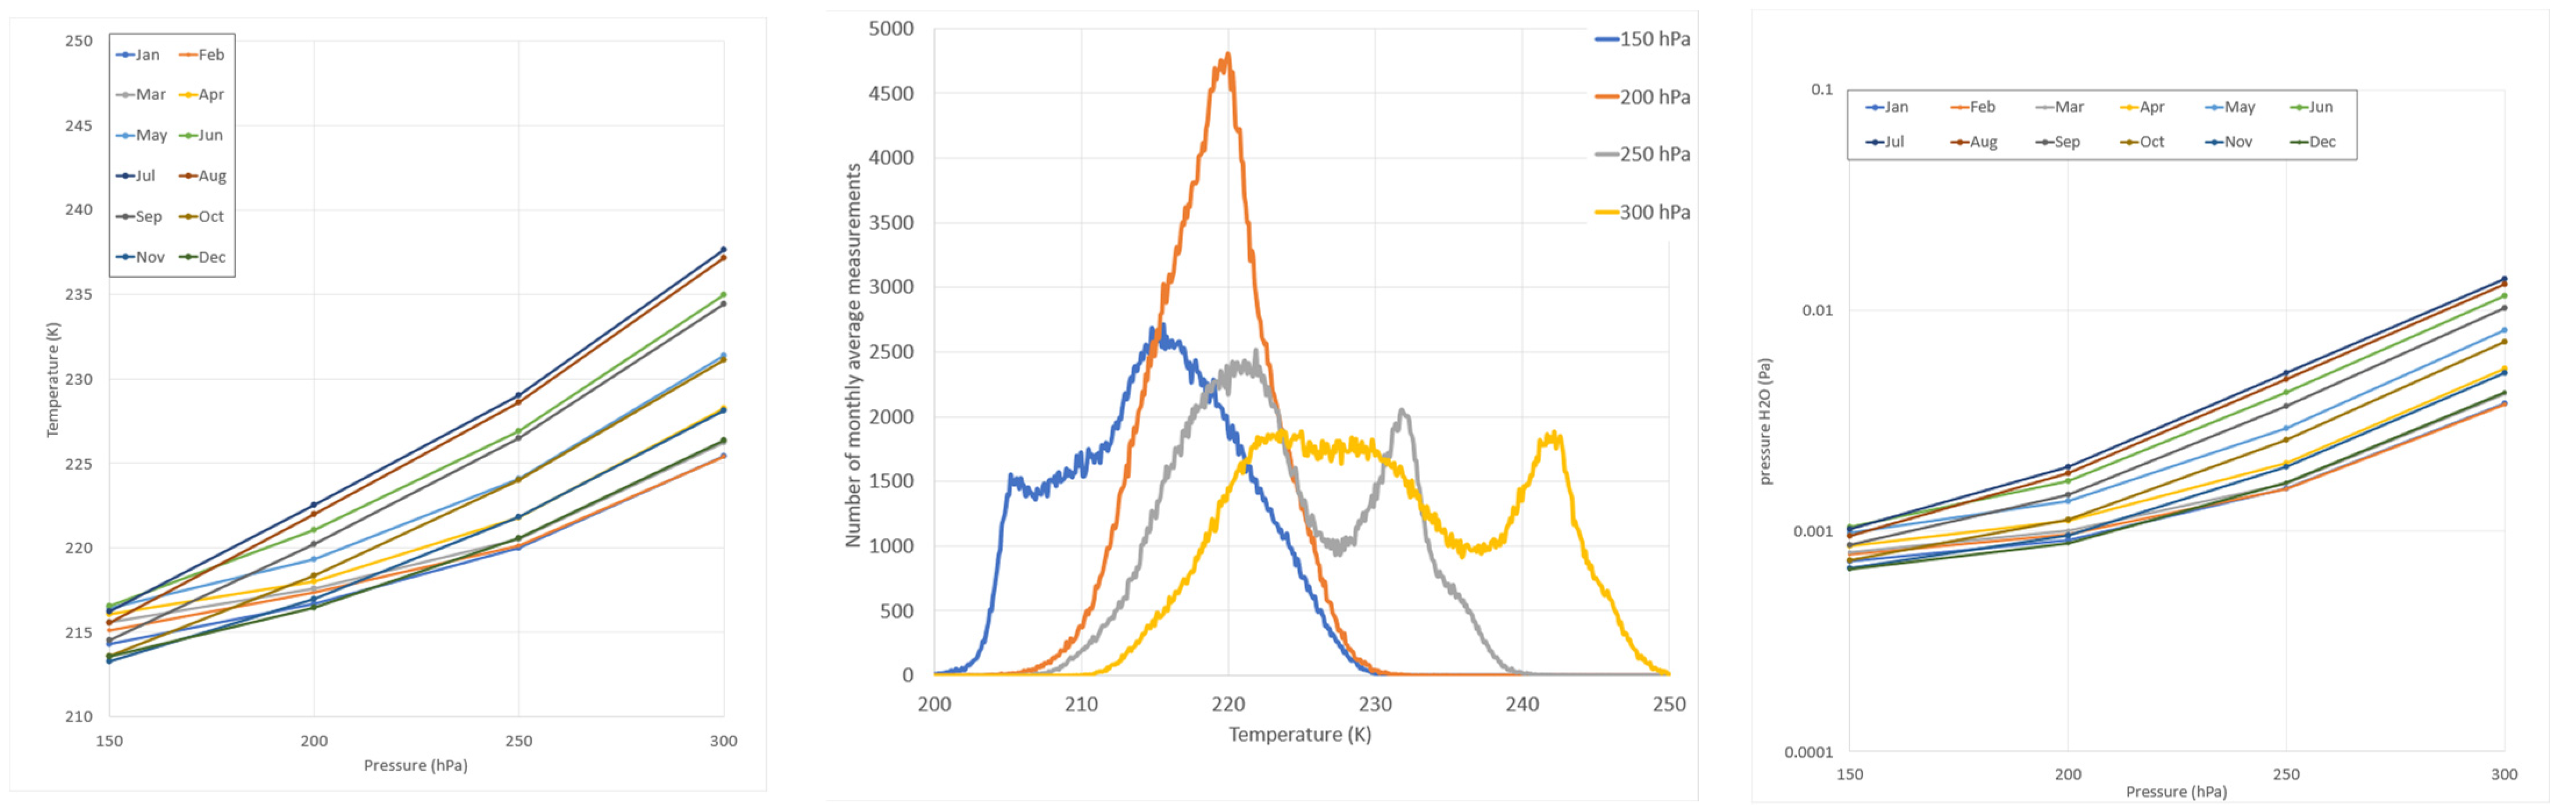
The concentration of sulfuric acid in a droplet may be inferred from the concentration of water or the concentration of sulfuric acid in the gas phase in which the droplet is suspended. The details of the method of calculation, its accuracy and its AI-based derivation is provided in Appendix A. Pressure, temperature and partial pressure of water were taken from the Integrated Global Radiosonde Archive (IGRS) database [29] at NOAA (https://www.ncei.noaa.gov/pub/data/igra/, accessed on 2 May 2022). Seasonal variation was captured by averaging values for each month for all datasets collected for latitudes between 0° and 70° (as commercial aircraft infrequently fly further North than 70°, illustrated in [30]). This excludes the polar vortex, where temperatures can be substantially lower than in the mid-latitude stratosphere. The large majority of long-haul commercial flights are in the Northern hemisphere, southern flights can be captured by assuming that the seasonal average measurements in the Southern hemisphere correspond to those of the same season (but different month) in the Northern hemisphere. The data collected for standard pressure values of 150, 200, 250 and 300 hPa, corresponding to ~9–14 km altitude, which cover the cruising altitudes of commercial aircraft. The pressure and temperature averages for each of 12 months are shown in Figure 1, together with the distribution of monthly temperature averages across the whole dataset.
The concentration of sulfuric acid in an aerosol droplet that is composed solely of sulfuric acid and water can be calculated from the vapour pressure of either water or of sulfuric acid above that droplet. We used both methods in this work, using the methods described in more detail in Appendix A. We used the average temperature and water vapour values for each of the 12 months as shown in Figure 1 for this calculation, and the sulfuric acid vapour values from [14,31,32].
2.2. Chemical Data Sources
Compounds found in the combustion products of commercial aviation engines were taken from [26,27], and are listed in Table 1. Only products from commercial engines were considered, as military aircraft have different performance and exhaust emission requirements. Studies of the composition of stratospheric aerosols frequently distinguish ‘volatile’ from ‘non-volatile’ populations by passing the aerosols through a pathway heated to >250 °C [20,25]; any compound that evaporated fast at 250 °C would therefore be considered ‘volatile’. The known or estimated boiling point at one bar of each compound in Table 1 is included as an indication of volatility; for comparison, water boils at 100 °C and pure sulfuric acid at 337 °C, so all these compounds with the exceptions of the poly-aromatics Benzo(a)anthracene, Benzo(a)pyrene, Chrysene and Pyrene are as volatile as sulfuric acid, and hence plausible components of the ‘volatile’ component of the stratospheric aerosol, as discussed below.
The chemicals listed in Table 1 are likely to be from two sources; incomplete combustion of the aviation fuel, and breakdown of lubricating oil [34,35]. In both cases incomplete breakdown will result in unsaturated organics and organic radicals which will recombine with each other and with other exhaust components to form a spectrum of products. As such, this is likely to be influenced by pressure, flow rates and temperatures inside the engine and in the immediate downstream plume. It is therefore unknown if these organics are representative of the full spectrum of substances emitted by commercial engines in cruise flight; as noted above, complex organics have not been analysed in in-flight jet exhaust.
2.3. Calculating Reaction Rates in Sulfuric Acid
The rate of reaction of a compound in sulfuric acid was calculated following the method and data of [28,36]. In brief, a database of 580 rates of reaction of individual organic compounds with concentrated sulfuric acid was curated from the research literature, and classified by the reacting functional group (FG). As papers studying the kinetics of reaction are almost exclusively concerned with mechanism of reaction, only one FG within each molecule was reacting in each study. The compounds were grouped by FG, and the rate of reaction of that FG as a function of temperature and acid concentration was averaged from the data. For each of the molecules to be modelled, the rate of reaction was calculated for each FG present in that molecule for all of the temperatures and acid concentrations specified (see Results Section 3.1 for the specific conditions used in this study). For many molecules there will be more than one FG in that molecule. The rate of reaction of the molecule is assumed to be the rate of reaction of the fastest-reacting FG in that molecule. Formally, such an approach under-estimates the rate of reaction. However, rates for each functional group typically differ by at least an order of magnitude, so the under-estimation is less than the uncertainty in the modelling.
We emphasize that this is a model of the ‘dark’ chemistry of sulfuric acid only. Photochemistry plays a substantial role in the chemistry of the stratosphere, and is likely to affect unsaturated organic compounds in particular, as these absorb UV light.
2.4. Chemical Space of Carbon and Oxygen Compounds
The space of possible organic chemicals made from carbon and oxygen was generated to explore how the composition of chemicals will change under prolonged exposure to sulfuric acid. The space of possible organic chemicals was computed using Combimol-B [37,38]. In brief, a set of molecular topologies (here between 3 and 9 non-hydrogen atoms) is defined as the space of all saturated hydrocarbons that are straight chains, branched chains, rings of no fewer than 5 carbon atoms (i.e., not cyclopropane or cyclobutene), fused rings and rings with substituent alkane chains. A set of atoms is defined which can be used to replace carbon, here just oxygen, and a set of bonding conditions under which a carbon can be replaced by each substituting atom. The program then generates a set of ‘core’ structures by systematically replacing single carbon-carbon bonds with double or triple bonds, and then tries to replace as many carbons in the original molecule and in the derived ‘core’ structures with the substituting atoms as possible. Peroxides were excluded as no data for the rate of reaction of peroxides was included in our reaction rate model. Output molecules are determined to be unique on the basis of InChI Codes [39].
The average O/C ratio of the chemical space was computed as the average of the individual O/C content of the molecules in that space. The average O/C ratio after reaction with sulfuric acid was calculated according to Equation (1):
where Oa is the average O/C ratio, On is the O/C ratio of molecule n, kn is the geometric mean of the rate constants for reaction of molecule n under stratospheric conditions, t is time, and N is the total number of molecules.
3. Results
3.1. Reaction Conditions
In order to predict the rate of reaction of any compound in concentrated sulfuric acid, the concentration of the acid and the temperature must be defined. For this work, we assume that the droplets are pure sulfuric acid. We discuss how our conclusions could be applicable to droplets of mixed composition below in Section 4.2. The concentration of sulfuric acid in stratospheric droplets may be calculated from the gas phase abundance of water or of sulfuric acid, as described above in Materials and Methods.
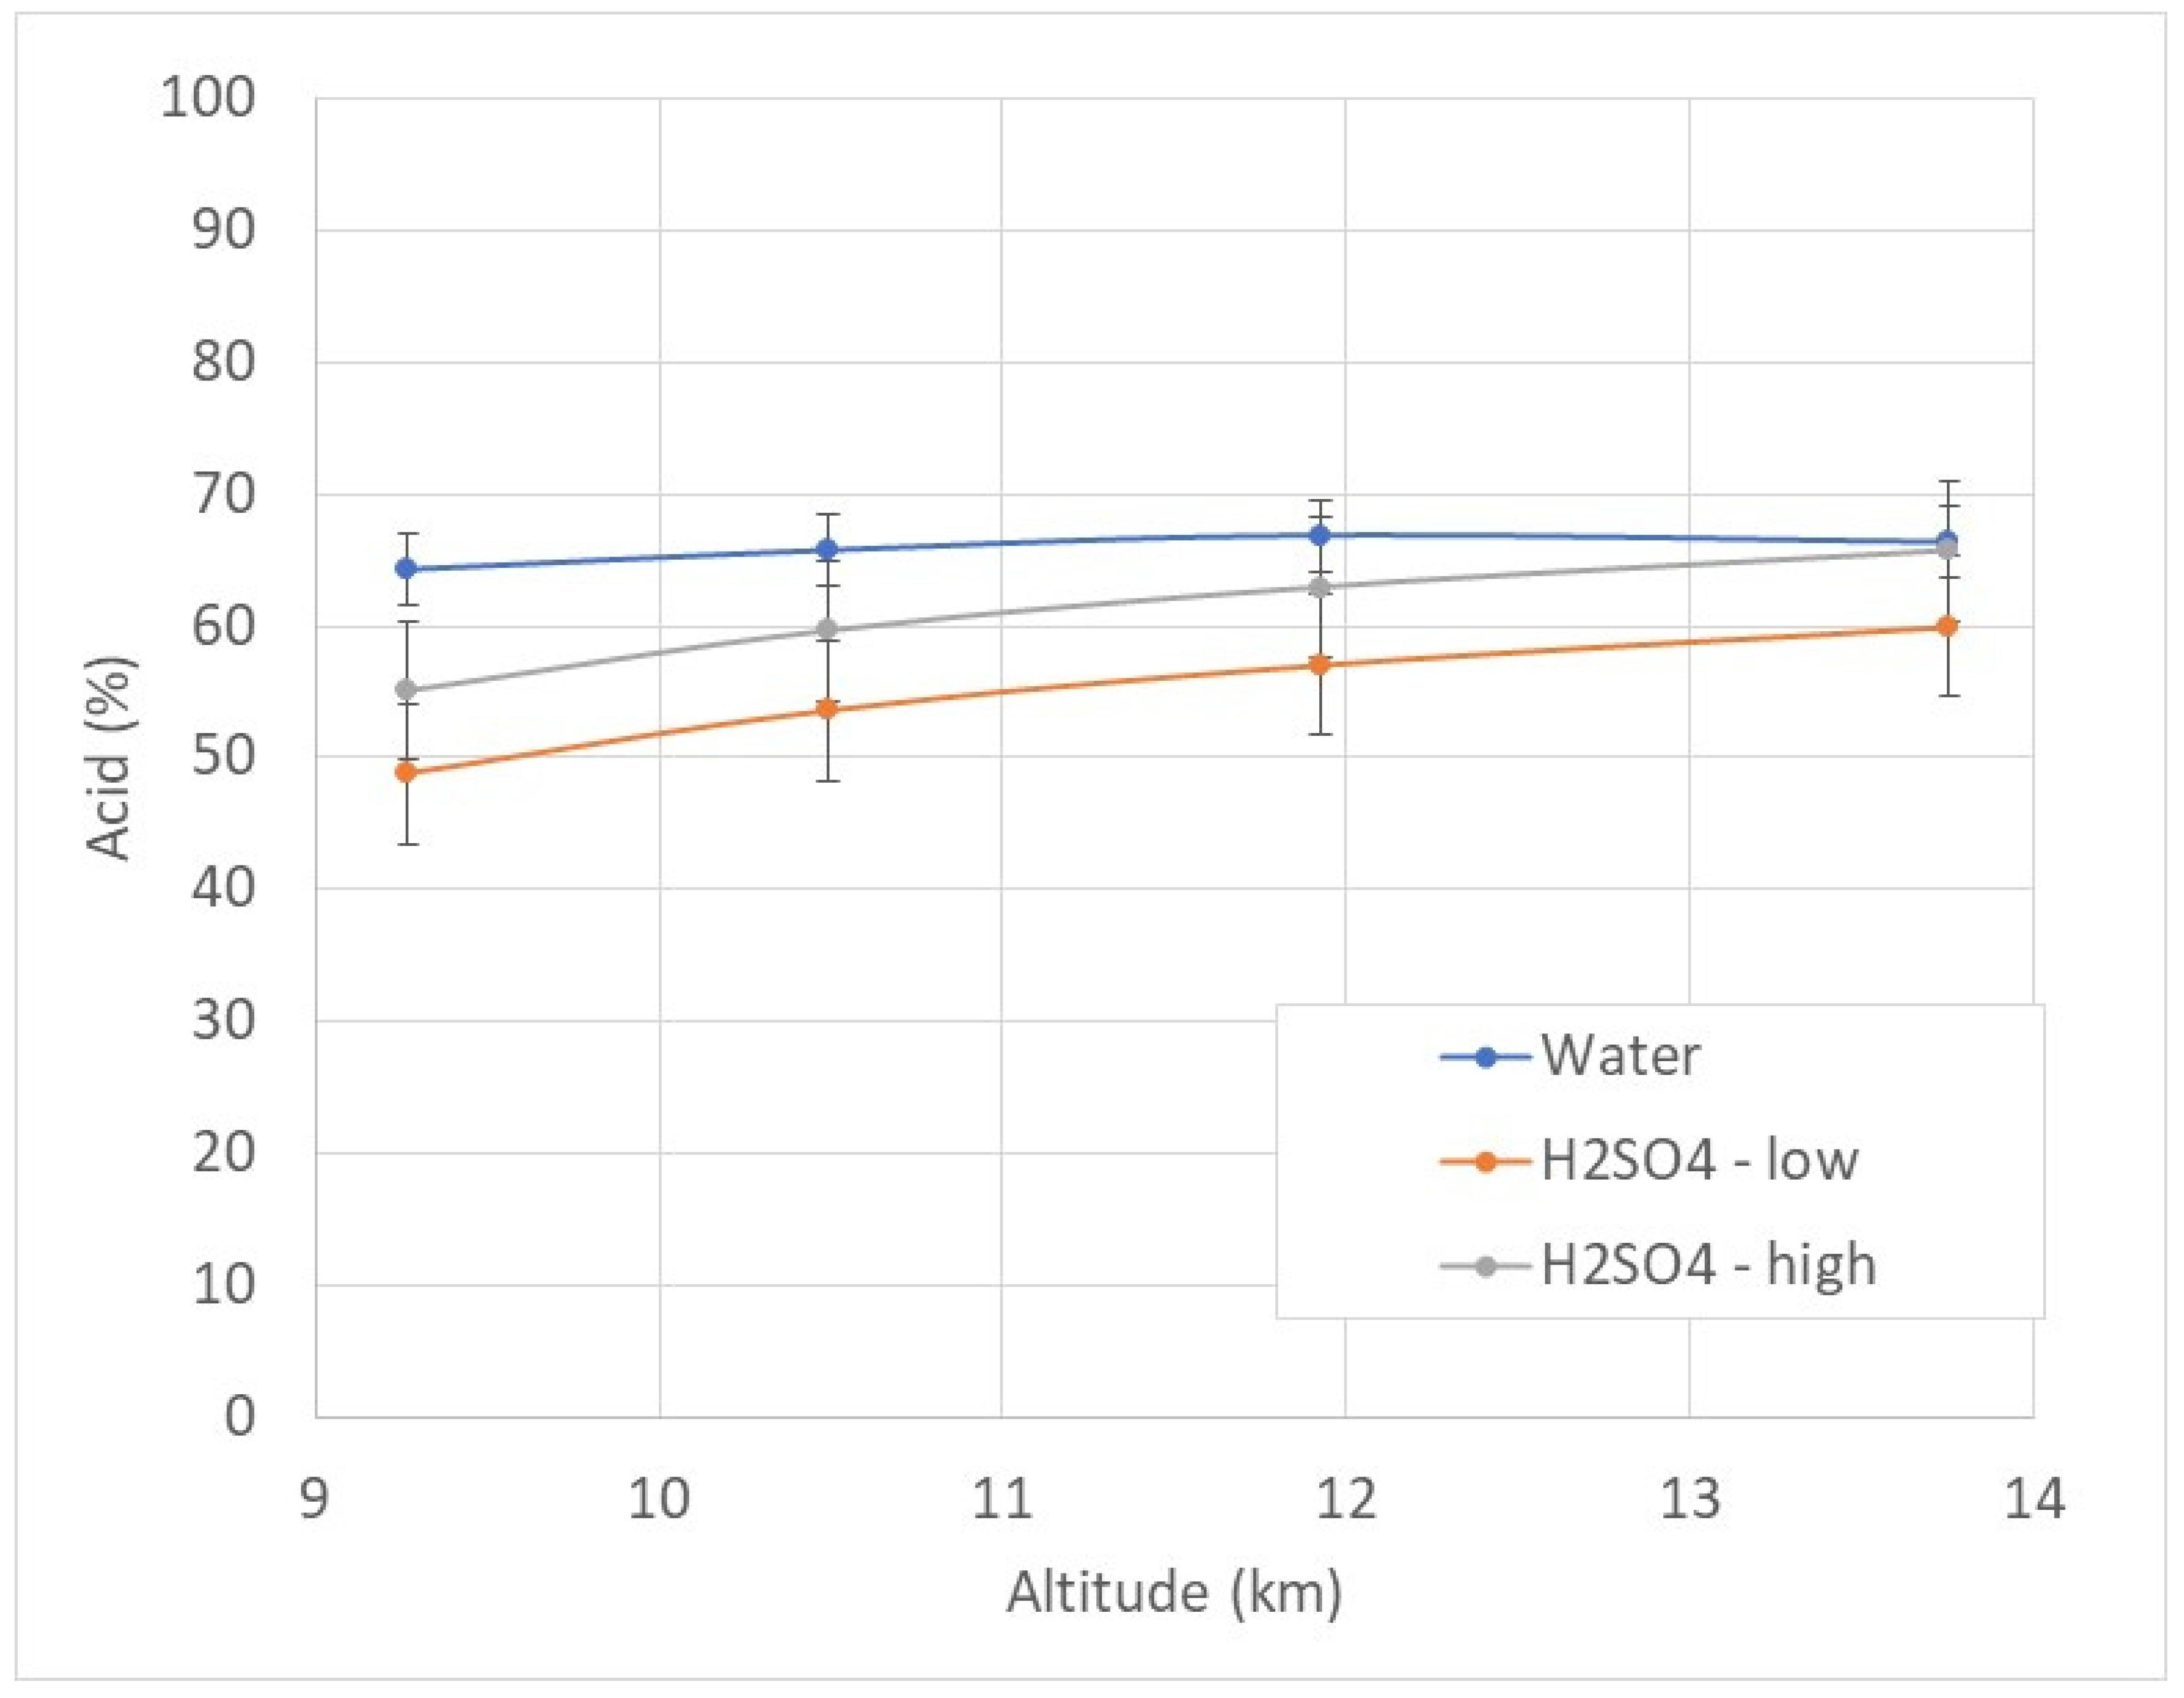
Figure 2 shows that predictions for the lower stratosphere. As cloud or haze particles are extremely rare in the upper stratosphere, and commercial aircraft rarely fly above 13 km altitude, we only considered conditions in the lower stratosphere and upper troposphere here. There is substantial range in the values for water and sulfuric acid abundances available in the literature. These values represent real variability in the abundance of water vapour and of gas phase sulfuric acid. The higher end estimates of sulfuric acid concentration in aerosol above 12.5 km are consistent with [40] estimate of 65–70%.
To cover the range of plausible conditions, we calculated compound reaction kinetics for all combinations of temperatures and concentrations as shown in Figure 1 and Figure 2, which are summarized in Table 2. The reaction rate was calculated for all combinations of average, maximum and minimum temperature and acid concentration for each of the four altitude level ranges.
3.2. Relevance of Sulfuric Acid Chemistry
We first show that sulfuric acid chemistry is important to the lifetime of organic chemicals in stratospheric haze droplets. Specifically, we show that the oxygen to carbon (O/C) ratio in stratospheric droplets is unexpectedly low compared to the source of organics in those droplets, and that the low O/C ratio can be explained by sulfuric acid chemistry but not by photochemistry.
The carbon in organic stratospheric aerosol is likely derived primarily from aerosols or organic volatiles derived from the troposphere [1,25]. While there is significant meteoritic input to mid stratospheric aerosols, this is primarily minerals and metals with little organic content [3]. The oxygen content of carbonaceous material in stratospheric aerosol decreases rapidly above the tropopause [41], with O/C ratios of 0.15–0.3 depending on the degree of influence of the upper troposphere on the lower stratosphere. The source materials for stratospheric haze however typically have O/C ratios of between 0.5 and 1. Primary urban haze typically has O/C ratios of 0.1–0.3, becoming more oxidized with increased residence time [42,43,44], and aged aerosols formed from natural organics have O/C ratios of up to 1 [45]. Atmospheric volatiles have O/C in the 0.3–1 range [46,47], even though the source molecules are oxygen-poor [47]. Primary aerosols from biomass burning typically have O/C ranging from 0.5 to greater than 1 [48,49,50], and can be a major source of stratospheric carbonaceous aerosols (e.g., [51]).
A reduced O/C ratio is unlikely to be the result of photochemical processing of source organics. ‘Ageing’ (i.e., continued atmospheric and photochemical processing) of these aerosols uniformly increases their O/C ratio [52]. If such aged tropospheric arrosols are the primary supplies of organic material to stratospheric aerosols, this suggests that processes in the stratosphere reduce the O/C ratio. This is surprising given that the stratosphere is an oxygen-rich, UV-rich environment which should drive the photochemical addition of oxygen atoms to any molecule (and indeed it does so in the formation of sulfuric acid itself) [52].
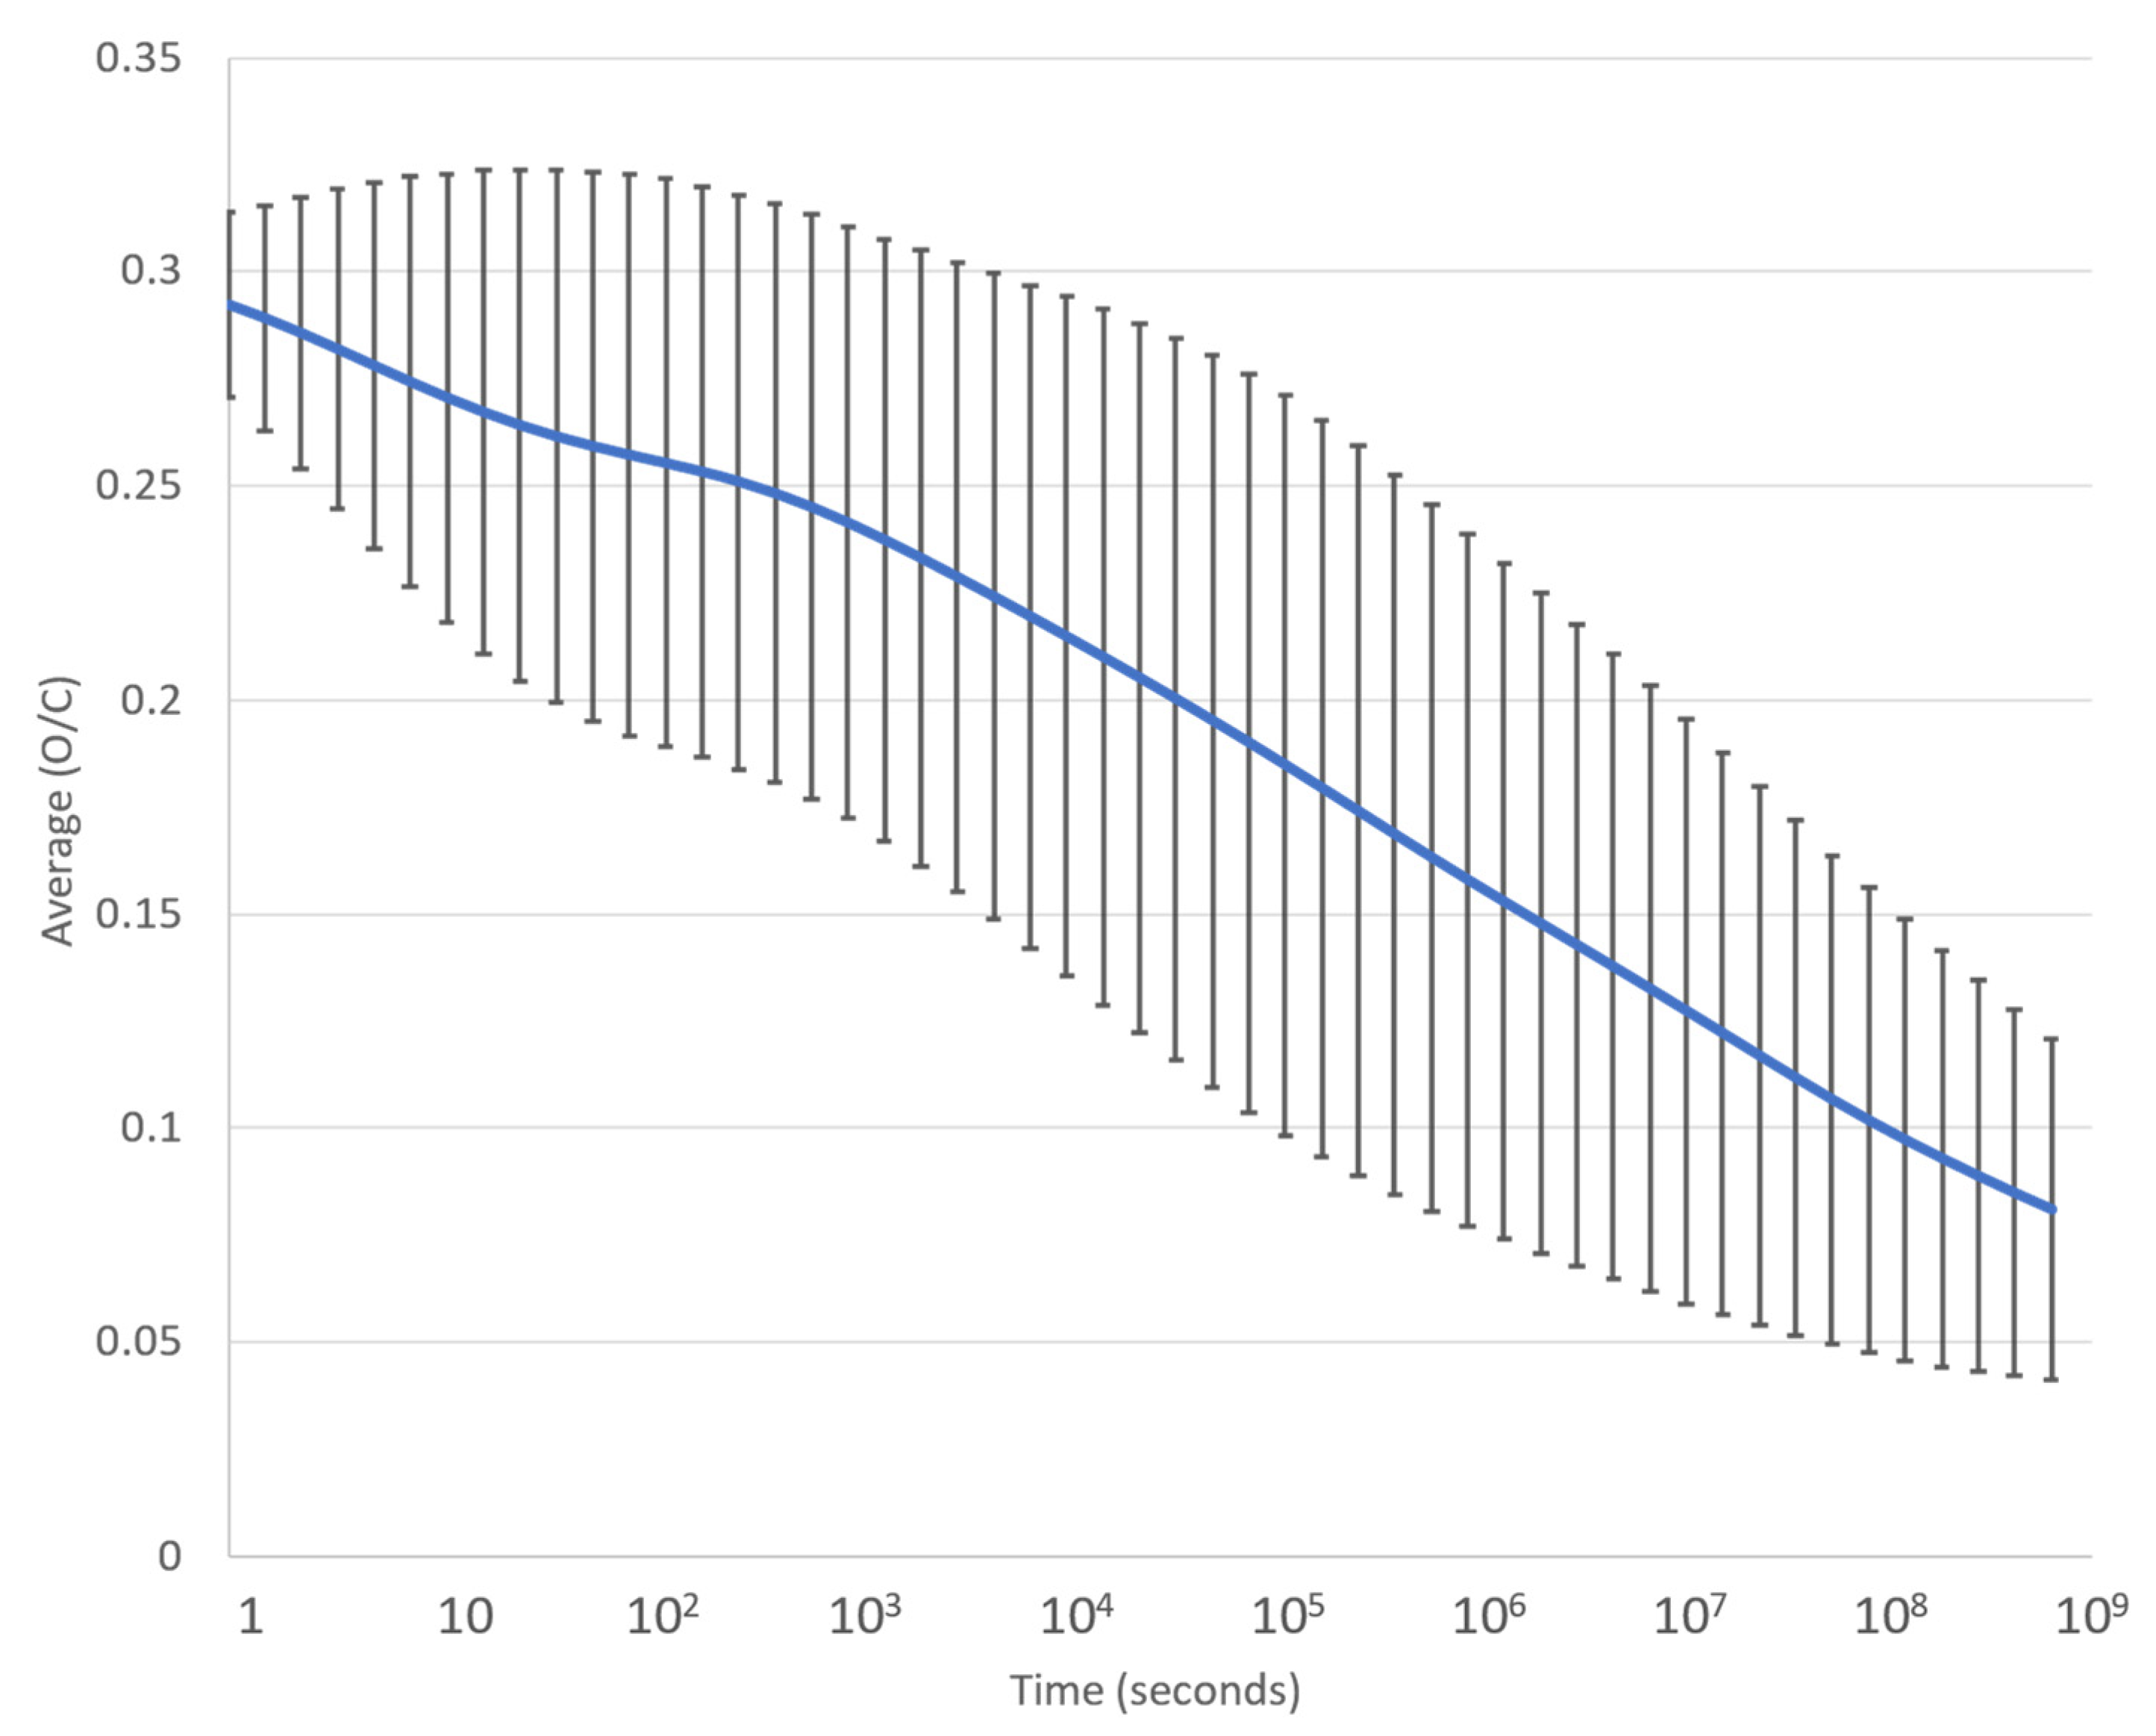
Oxygen-containing organic species are generally reactive in sulfuric acid due to the ready protonation of oxygen to form reactive oxonium ions. To illustrate the effect of this on a mixed population of molecules, we generated a systematic set of 88,543 chemical structures containing 3 through 9 carbon or oxygen atoms, and modelled their breakdown in sulfuric acid under stratospheric conditions. Figure 3 shows the average O/C ratio in this population with time.
The analysis summarized in Figure 3 suggests that the overall O/C content of this large collection of structures comprising only carbon, oxygen and hydrogen atoms would decline with time in sulfuric acid in the absence of photochemistry as oxygen-rich compounds are preferentially attacked. By contrast, as noted above, we would expect photochemistry to increase the O/C content of organic molecules, especially unsaturated organics which would be attacked by the oxygen atoms and hydroxyl radicals generated by UV action on water and O2 to form oxygen-containing products (as has been worked out in some detail for some specific organics, such as isoprene [53]). The observation that stratospheric aerosol contains organics with a lower O/C ratio than its main putative input sources therefore suggests that sulfuric acid chemistry may play a significant role in the chemistry of higher molecular weight organics in stratospheric aerosols.
This is not a proof however of the role of sulfuric acid chemistry in stratospheric aerosol. The source of carbon could itself be highly oxygen-poor, and the compounds could be resistant to photochemical oxidation. However, it encourages us to consider sulfuric acid chemistry as potentially relevant to the chemistry of the stratospheric aerosol.
3.3. Jet Fuel Combustion Product Stability in Stratospheric Droplets
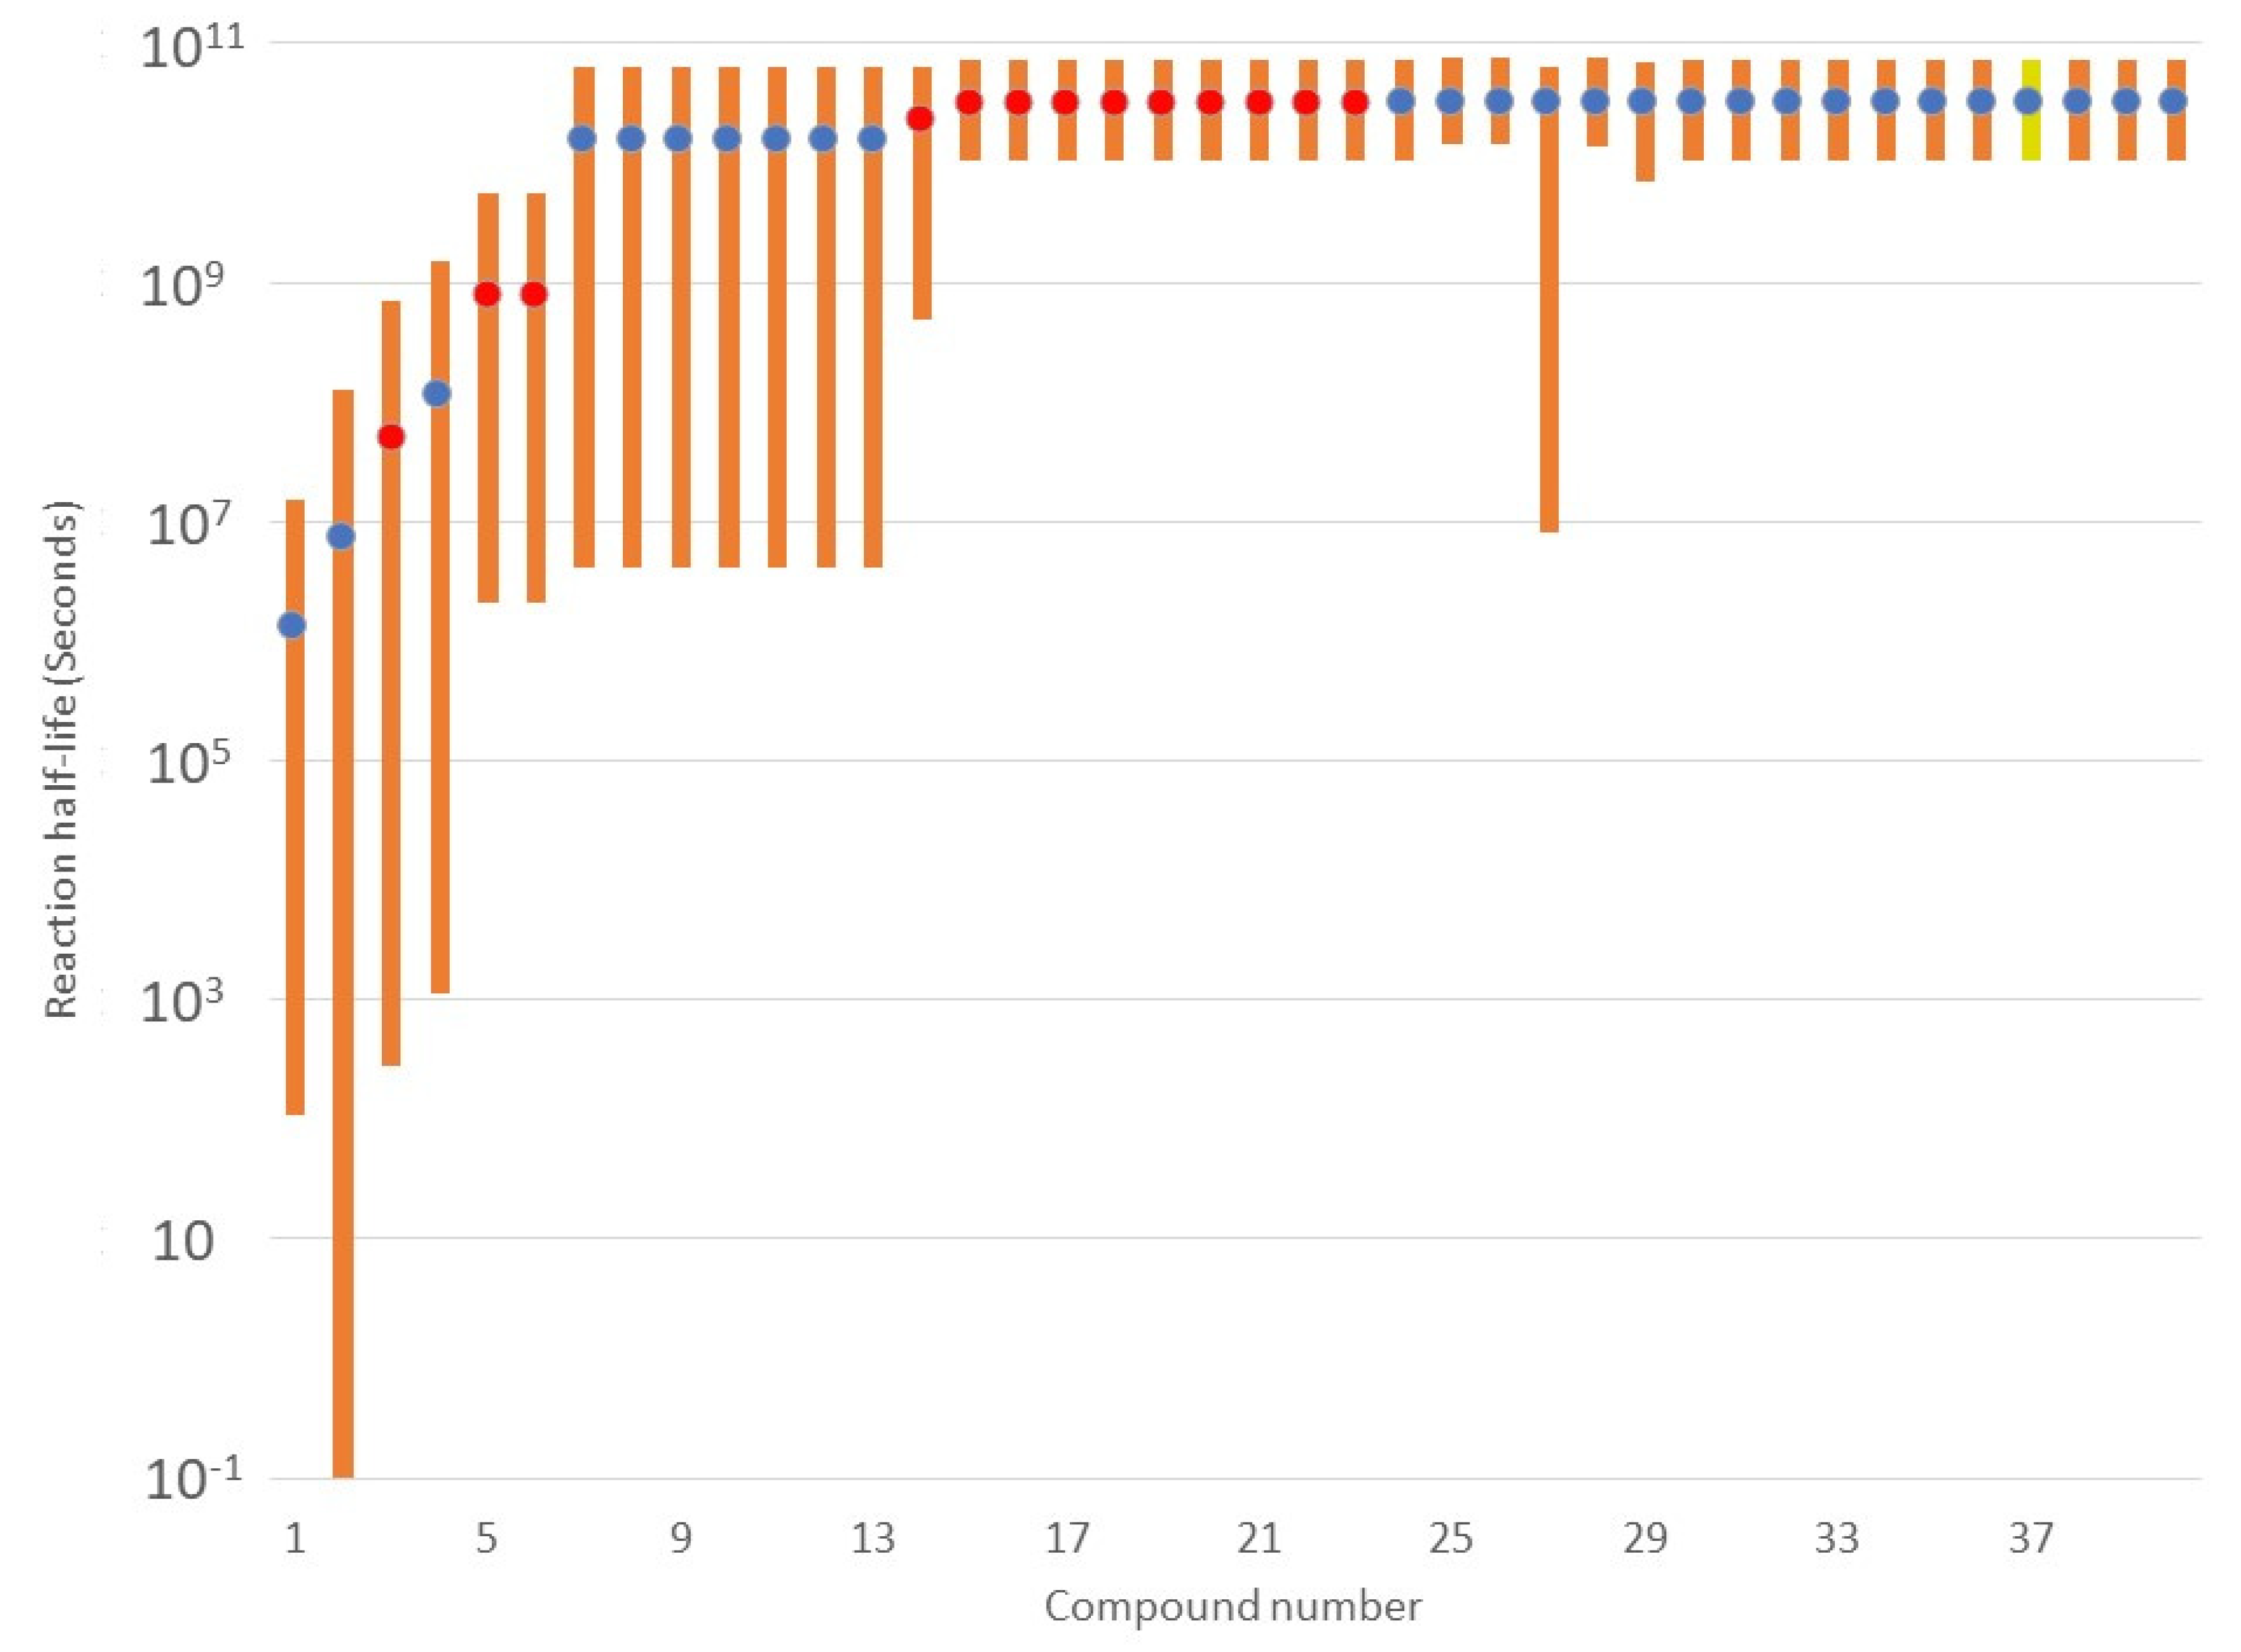
The stability of the compounds listed in Table 1 was calculated for the conditions derived in Section 3.1. The result is summarized in Figure 4.
The model predicts that 26 out of 40 compounds will have a minimum half-life of over 107 s (115 days), and some will have half-lives to reaction by sulfuric acid of >1011 s (3000 years). One of these (Pyrene–compound 37, colored yellow in Figure 3) is known to be unstable to attack at 25 °C in 95% sulfuric acid, due to mechanisms not encompassed in our model [54]; it may be less stable than predicted here under stratospheric conditions. Thus, we conclude that 25 of the 40 compounds modelled have half-lives to reaction with sulfuric acid of at least several months.
This does not suggest that such compounds will necessarily reside for this time in the stratosphere; it only provides an estimate of how fast sulfuric acid chemistry in stratospheric droplets could destroy the compounds. We discuss this in the context of other destruction mechanisms in Section 4.2 below.
4. Discussion
4.1. Survival of Compounds in the Stratosphere
We use a predictive model of sulfuric acid reactivity to predict the stability of organic chemicals under stratospheric conditions. We applied the model to the incomplete combustion products of aviation fuel to test if they are likely to be long-term pollutants to the stratosphere that could contribute to its chemical or climatic properties. 25 out of 40 jet fuel combustion products were found to have a minimum predicted half-life to destruction by sulfuric acid of >107 s, and so could remain in the stratosphere for months or longer.
This model may over-estimate the stability of chemicals in the stratosphere for two reasons, Firstly, compounds containing double bonds, especially alkenes, are liable to light-induced breakdown through absorption of UV light. Secondly, all compounds will be liable to photooxidation by hydroxyl and other radicals generated by UV light, a process that is likely to remove aerosol particles on a timescale of months [3]. However, our results do suggest that a substantial fraction of the combustion products of commercial airliners could be stable to chemical attack on a timescale of months. This could materially affect the chemistry of stratospheric aerosols in heavily trafficked airspace.
4.2. Effect of Impure Sulfuric Acid Droplets
In this model, we have assumed that the stratospheric haze droplets are pure sulfuric acid. This is unlikely to be true, as other materials, especially ammonia and amines, will neutralize acid droplets forming ammonium salts of higher pH than pure acid droplets. A notable example of this is the formation of ammonium nitrate in the upper troposphere during monsoon season over Asia [55]. Neutralization of acid will slow the rate of the reactions modelled here, and hence increase the lifetime of chemicals. The degree of extension of lifetime is not readily determined. At low temperature ammonium salts are liable to precipitate out from solution in acid droplets, leaving a concentrated acid liquid phase. It is also likely that a partially neutralized droplet will act as a condensation nucleus for both sulfuric acid and water in the gas phase.
Conversely, stratospheric droplets are proposed to contain a significant concentration of nitric acid. Mixed droplets of HNO3, H2SO4, NH3 and H2O may form preferentially over H2SO4 + H2O droplets over the Asian monsoon [56]. This will make the droplets more oxidizing, and also allow nitration reactions, especially on aromatic centers [57]. Both oxidation and nitration reactions will decrease the lifetime of compounds in the droplets. In addition, even stratospheric particles composed mostly of sulfuric acid are likely to contain metals [3,25], which could have a catalytic effect on the reaction chemistry [57].
Thus, our models act as a base case to which different scenarios of droplet evolution can be applied.
4.3. Testing the Model
Mass spectral (MS) measurements of individual aerosols developed over the last 30 years (reviewed in [58]) have been applied to the analysis of stratospheric aerosols (e.g., [3,59]). Stratospheric aerosol analysis using MS instruments such as PALMS could in principle identify high molecular weight organics in stratospheric aerosols. However, current instrumentation is not configured to detect substances such as those in Table 1. The MS in PALMS compresses spectra to 0.25 amu resolution [60,61] and consequently is not able to distinguish whether many peaks with m/e of >50 are clusters of smaller molecules [62] or single larger molecules. For example, the peak identified as H3SO4.H2O+ in [59] cannot be distinguished from the C7H15+ (protonated heptene) ion at 0.25 amu resolution (mass of H3SO4.H2O+ = 99.11737548, mass of C7H15+ = 98.97520475). In addition, the huge amount of data gathered in PALMS runs is usually reduced by classifying particles as having or not having a carbonaceous component [63,64], rather than being analysed for anomalous peaks. Our initial analysis suggests that few of the higher molecular weight species in Table 1 can be distinguished from clusters of nitric acid, sulfuric acid and/or water molecules at 0.25 amu resolution, but increasing resolution to the 0.1 amu of the raw PALMS MS output could uniquely identify ~70% of the molecules. In principle this should only require modification of the data handling software for the PALMS instrument. Using a higher resolution mass spectrometer could uniquely identify almost all of the molecules in Table 1. We suggest that this could be fruitful approach to confirming that stratospheric aerosols contain long-lived high molecular weight organic compounds.
5. Conclusions
We have modelled the reaction of the incomplete combustion products of commercial aviation fuel with sulfuric acid under stratospheric conditions. We find that 25 of the 40 incomplete combustion products of commercial jet engines are predicted to be stable to reaction with sulfuric acid under stratospheric conditions for a year or more. Previous studies have estimated that commercial aircraft have only a small effect on stratospheric aerosols, and hence on those aerosol’s effect on stratospheric chemistry and on climate [65,66] and ozone depletion [67]. Those works considered the effect of aircraft-derived NOx, SO2, and water vapor. The work presented in this paper suggests that incomplete combustion products may also have a long residence time in the stratosphere. Commercial jet engines in cruise phase are extremely efficient, and only ~1% of fuel is incompletely combusted [68], of which a varying fraction is organic material. If the 99% that is efficiently combusted is converted to CO2, then a ratio of incomplete combustion products/CO2 will be ~0.3/100 by mass. 81% of the 9.18 × 10¹¹ kg of CO2 emitted by commercial aircraft in 2018 (pre-pandemic) was in flights over 1000 km long [69], implying a plausible stratospheric deposition of ~109 kg of the products listed in Table 1 per year, which suggests that incomplete combustion products could have a material effect on stratospheric chemistry and on the effect of the stratospheric aerosols on climate. We encourage others to extend this work in four directions. Firstly, existing mass spectrometry aerosol analytical platforms are capable in principle of identifying many of the substances in Table 1, if they are operated to identify relevant peaks in raw data without compression. Software changes to such instruments could enable such detection without changes to the instrument. Secondly, we have considered only reactions of jet fuel combustion products with sulfuric acid. Other organics may be transported to the stratosphere in significant amounts, and hence be subject to sulfuric acid chemistry (e.g., [70]). Thirdly, we have not considered mixed nitric and sulfuric acid chemistry, as noted above. The literature on the kinetics of reaction of mixtures of nitric and sulfuric acid other than in aromatic nitration reactions [57] is sparse, but there may be sufficient information to model such chemistry. Detailed modelling of real-world cloud compositions will need to include the kinetics of reaction in mixed sulfuric and nitric acid droplets. Lastly, a more global approach to modelling stratospheric chemistry that integrated the chemistry discussed here with other chemistries and with transport mechanism, as reviewed by [71] and done by [72], would be important to give a more reliable estimate of the importance of jet fuel incomplete combustion products to the overall physics and chemistry of the stratosphere.
Supplementary Materials
The following supporting information can be downloaded at: https://0-www-mdpi-com.brum.beds.ac.uk/article/10.3390/atmos13081209/s1, Table S1: Expansion of the data used to compile Figure 3.
Author Contributions
Conceptualization, E.V., W.B. and J.J.P.; methodology, W.B.; software, W.B. and E.V.; investigation, W.B. and E.V.; data curation, W.B.; writing—original draft preparation, W.B.; writing—review and editing, W.B., J.J.P. and S.S.; funding acquisition, S.S. All authors have read and agreed to the published version of the manuscript.
Funding
MIT John Jarve Fund.
Institutional Review Board Statement
Not applicable.
Informed Consent Statement
Not applicable.
Data Availability Statement
All data are available in the Supplementary Materials.
Acknowledgments
We are grateful to Susan Solomon (MIT) for initial comments on this project, and to two anonymous referees whose detailed comments helped substantially improve both this research and it’s write-up in this paper.
Conflicts of Interest
The authors declare no conflict of interest.
Appendix A. Calculation of Concentration of Sulfuric Acid in Lower Stratospheric Aerosols
Appendix A.1. Background
The rate of reaction of almost all chemical species with sulfuric acid is strongly dependent on temperature and acid concentration.
While the presence of sulfuric acid in aerosols in the upper troposphere and lower stratosphere is well established, the concentration of acid has not been measured directly, as discussed in the main text. We therefore inferred the concentration of acid from the partial pressures of water and sulfuric acid in the vapour phase, which have been measured, and the assumption that the aerosol droplets are in equilibrium with the vapour phase.
The vapour pressure of water and sulfuric acid over sulfuric acid + water mixtures is a complex result of the thermodynamics of interaction of sulfuric acid and water in vapour and liquid phases, including the existence of distinct sulfuric acid hydrates in both phases. We have derived empirical formulae for both vapour pressures as a function of the weight percentage of the acid from experimental data, rather than attempt a full thermodynamic model. Such models have to be parameterized with experimental data, and the thermodynamic parameters so values derived vary significantly between studies.
We predict the concentration of sulfuric acid independently from the vapour pressure of water and of sulfuric acid, as an internal check for consistency. We therefore derived equations for the relationship between the vapour pressure of water and of sulfuric acid over liquid acid and the concentration of that acid.
Appendix A.2. Concentration Derived from Vapour Pressure of Sulfuric Acid
Measured values for the vapour pressure of sulfuric acid over sulfuric acid liquid were derived from [73,74,75,76]. Inspection suggested a simple relationship between the vapour pressure of H2SO4 (Vps) and the vapour pressure over pure H2SO4. The vapour pressure over pure liquids was calculated from the extended Antoinine equation listed in [77] (downloaded from knovel.com on 5 February 2016), using Equation (A1) and the Antoinine constants listed in Table A1.
where Svp is the saturated vapour pressure in mmHg over pure liquid at absolute temperature T, and the Antoinine coefficients are as listed in Table A1.

Table A1.
Antoinine equation coefficients for the equation for the saturated vapour pressure over water and pure sulfuric acid.
Table A1.
Antoinine equation coefficients for the equation for the saturated vapour pressure over water and pure sulfuric acid.
| Antoine Coefficient | Value for Water | Value for H2SO4 |
|---|---|---|
| A | 29.8605 | 2.0582 |
| B | 3152.2 | −4192.4 |
| C | 7.3037 | 3.2578 |
| D | 2.4247 × 10⁻⁹ | −1.12 × 10⁻³ |
| E | 1.809 × 10⁻⁶ | 5.54 × 10⁻⁷ |
The acid concentration is then calculated from Equation (A2):
where P is the weight percentage of acid and Vp is the observed vapour pressure of sulfuric acid over the acid. This gave an RMS error of prediction of the percentage of acid of 5.3% over a range of 0–100% acid and 220–430 K.
The concentration of sulfuric acid in the vapour phase has not been measured extensively. Ref. [31] report 8 × 10⁴–4 × 10⁵/cm3 around the arctic tropopause. Ref. [14] report 2 × 10⁴–9 × 10⁵ molecules/cm3 at altitudes of between 18–25 km. Ref. [32] report 8 × 10⁴–2 × 10⁵ molecules/cm3 between 15 km and 25 km. We therefore modelled H2SO4 concentrations based on atmospheric concentrations of 4 × 10⁴ (low) and 8 × 10⁵ (high) molecules/cm3, equivalent to 4.9 × 10⁻¹⁵ Pa and 9.9 × 10⁻¹⁴ Pa partial pressure at 220 K. At altitudes around 20 km number densities can be as high as 109 molecules/cm3[14,32,78,79,80], but this is above the altitudes considered in this study.
Appendix A.3. Concentration Derived from Wapour Pressure of Water
Inspection did not show any simple relationship between the vapour pressure of water over sulfuric acid and the concentration of that acid, so we used the Genetic Programming machine learning technique to derive a relationship between water vapour pressure and acid concentration. Genetic Programming has the advantage over other deep learning techniques in that it produces an output in algebraic form that can readily be implemented in other programs [81]. We used the LilGP implementation of Koza’s original LISP code [82] as described in [83]. 302 triples of temperature, acid concentration and water vapour pressure were collected from [9,84,85,86] and from the Antoinine Equation (A1) above. The data set was split randomly into training, test and validation sets, and the model trained on the training set only. Successful models were tested on the test set. The best model is summarized in Equation (A3):
where P is the concentration of acid in weight percent, H is the relative humidity (observed vapour pressure of water divided by the saturated vapour pressure as calculated from Equation (A1)) and T is the absolute temperature. This gives an RMS error across the whole dataset of 2.69% over a range of 220–420 K and 0–98% sulfuric acid. The algorithm over-predicts the concentration of sulfuric acid from the vapour pressure of water over that acid concentrations of acid above 98%, but as stratospheric aerosol droplets do not have concentrations about 80%, this limitation did not affect the results.
References
- Martinsson, B.G.; Friberg, J.; Sandvik, O.S.; Hermann, M.; van Velthoven, P.F.J.; Zahn, A. Formation and composition of the UTLS aerosol. NPJ Clim. Atmos. Sci. 2019, 2, 40. [Google Scholar] [CrossRef]
- Junge, C.E.; Chagnon, C.W.; Manson, J.E. Stratospheric aerosols. J. Atmos. Sci. 1961, 18, 81–108. [Google Scholar] [CrossRef]
- Murphy, D.M.; Cziczo, D.J.; Hudson, P.K.; Thomson, D.S. Carbonaceous material in aerosol particles in the lower stratosphere and tropopause region. J. Geophys. Res. Atmos. 2007, 112, D04203. [Google Scholar] [CrossRef]
- Brühl, C.; Lelieveld, J.; Crutzen, P.; Tost, H. The role of carbonyl sulphide as a source of stratospheric sulphate aerosol and its impact on climate. Atmos. Chem. Phys. 2012, 12, 1239–1253. [Google Scholar] [CrossRef] [Green Version]
- Neely, R.R., III; Toon, O.; Solomon, S.; Vernier, J.P.; Alvarez, C.; English, J.; Rosenlof, K.; Mills, M.; Bardeen, C.; Daniel, J. Recent anthropogenic increases in SO2 from Asia have minimal impact on stratospheric aerosol. Geophys. Res. Lett. 2013, 40, 999–1004. [Google Scholar] [CrossRef]
- Toon, O.B.; Browell, E.; Kinne, S.; Jordan, J. An analysis of lidar observations of polar stratospheric clouds. Geophys. Res. Lett. 1990, 17, 393–396. [Google Scholar] [CrossRef]
- Beyerle, G.; Neuber, R.; Schrems, O.; Wittrock, F.; Knudsen, B. Multiwavelength lidar measurements of stratospheric aerosols above Spitsbergen during winter 1992/93. Geophys. Res. Lett. 1994, 21, 57–60. [Google Scholar] [CrossRef]
- Tabazadeh, A.; Toon, O.B.; Clegg, S.L.; Hamill, P. A new parameterization of H2SO4/H2O aerosol composition: Atmospheric implications. Geophys. Res. Lett. 1997, 24, 1931–1934. [Google Scholar] [CrossRef]
- Steele, H.M.; Hamill, P. Effects of temperature and humidity on the growth and optical properties of sulphuric acid—Water droplets in the stratosphere. J. Aerosol Sci. 1981, 12, 517–528. [Google Scholar] [CrossRef]
- Carslaw, K.S.; Peter, T.; Clegg, S.L. Modeling the composition of liquid stratospheric aerosols. Rev. Geophys. 1997, 35, 125–154. [Google Scholar] [CrossRef]
- Solomon, S. The mystery of the Antarctic ozone “hole”. Rev. Geophys. 1988, 26, 131–148. [Google Scholar] [CrossRef]
- Iraci, L.T.; Tolbert, M.A. Heterogeneous interaction of formaldehyde with cold sulfuric acid: Implications for the upper troposphere and lower stratosphere. J. Geophys. Res. Atmos. 1997, 102, 16099–16107. [Google Scholar] [CrossRef]
- Singh, H.; Chen, Y.; Tabazadeh, A.; Fukui, Y.; Bey, I.; Yantosca, R.; Jacob, D.; Arnold, F.; Wohlfrom, K.; Atlas, E. Distribution and fate of selected oxygenated organic species in the troposphere and lower stratosphere over the Atlantic. J. Geophys. Res. Atmos. 2000, 105, 3795–3805. [Google Scholar] [CrossRef]
- Schlager, H.; Arnold, F. Balloon-borne composition measurements of stratospheric negative ions and inferred sulfuric acid vapor abundances during the MAP/GLOBUS 1983 campaign. Planet. Space Sci. 1987, 35, 693–701. [Google Scholar] [CrossRef]
- Jurkat, T.; Voigt, C.; Arnold, F.; Schlager, H.; Kleffmann, J.; Aufmhoff, H.; Schäuble, D.; Schaefer, M.; Schumann, U. Measurements of HONO, NO, NOy and SO2 in aircraft exhaust plumes at cruise. Geophys. Res. Lett. 2011, 38, L10807. [Google Scholar] [CrossRef] [Green Version]
- Fahey, D.W.; Keim, E.R.; Woodbridge, E.L.; Gao, R.S.; Boering, K.A.; Daube, B.C.; Wofsy, S.C.; Lohmann, R.P.; Hintsa, E.J.; Dessler, A.E.; et al. In situ observations in aircraft exhaust plumes in the lower stratosphere at midlatitudes. J. Geophys. Res. Atmos. 1995, 100, 3065–3074. [Google Scholar] [CrossRef]
- Schumann, U.; Arnold, F.; Busen, R.; Curtius, J.; Kärcher, B.; Kiendler, A.; Petzold, A.; Schlager, H.; Schröder, F.; Wohlfrom, K.H. Influence of fuel sulfur on the composition of aircraft exhaust plumes: The experiments SULFUR 1–7. J. Geophys. Res. Atmos. 2002, 107, AAC 2-1–AAC 2-27. [Google Scholar] [CrossRef] [Green Version]
- Brasseur, G.; Cox, R.; Hauglustaine, D.; Isaksen, I.; Lelieveld, J.; Lister, D.; Sausen, R.; Schumann, U.; Wahner, A.; Wiesen, P. European scientific assessment of the atmospheric effects of aircraft emissions. Atmos. Environ. 1998, 32, 2329–2418. [Google Scholar] [CrossRef] [Green Version]
- Arnold, F.; Hauck, G. Lower stratosphere trace gas detection using aircraft-borne active chemical ionization mass spectrometry. Nature 1985, 315, 307–309. [Google Scholar] [CrossRef]
- Hagen, D.E.; Whitefield, P.D.; Schlager, H. Particulate emissions in the exhaust plume from commercial jet aircraft under cruise conditions. J. Geophys. Res. Atmos. 1996, 101, 19551–19557. [Google Scholar] [CrossRef]
- Schröder, F.; Brock, C.A.; Baumann, R.; Petzold, A.; Busen, R.; Schulte, P.; Fiebig, M. In situ studies on volatile jet exhaust particle emissions: Impact of fuel sulfur content and environmental conditions on nuclei mode aerosols. J. Geophys. Res. Atmos. 2000, 105, 19941–19954. [Google Scholar] [CrossRef]
- Tran, S.; Brown, A.; Olfert, J.S. Comparison of particle number emissions from in-flight aircraft fueled with jet A1, JP-5 and an alcohol-to-jet fuel blend. Energy Fuels 2020, 34, 7218–7222. [Google Scholar] [CrossRef]
- Flynn, G.J.; Wirick, S.; Keller, L.P. Organic grain coatings in primitive interplanetary dust particles: Implications for grain sticking in the Solar Nebula. Earth Planets Space 2013, 65, 13. [Google Scholar] [CrossRef] [Green Version]
- Chauvigné, A.; Jourdan, O.; Schwarzenboeck, A.; Gourbeyre, C.; Gayet, J.F.; Voigt, C.; Schlager, H.; Kaufmann, S.; Borrmann, S.; Molleker, S. Statistical analysis of contrail to cirrus evolution during the Contrail and Cirrus Experiment (CONCERT). Atmos. Chem. Phys. 2018, 18, 9803–9822. [Google Scholar] [CrossRef] [Green Version]
- Renard, J.-B.; Berthet, G.; Levasseur-Regourd, A.-C.; Beresnev, S.; Miffre, A.; Rairoux, P.; Vignelles, D.; Jégou, F. Origins and Spatial Distribution of Non-Pure Sulfate Particles (NSPs) in the Stratosphere Detected by the Balloon-Borne Light Optical Aerosols Counter (LOAC). Atmosphere 2020, 11, 1031. [Google Scholar] [CrossRef]
- Timko, M.T.; Herndon, S.C.; De La Rosa Blanco, E.; Wood, E.C.; Yu, Z.; Miake-Lye, R.C.; Knighton, W.B.; Shafer, L.; DeWitt, M.J.; Corporan, E. Combustion products of petroleum jet fuel, a Fischer–Tropsch synthetic fuel, and a biomass fatty acid methyl ester fuel for a gas turbine engine. Combust. Sci. Technol. 2011, 183, 1039–1068. [Google Scholar] [CrossRef]
- Tesseraux, I. Risk factors of jet fuel combustion products. Toxicol. Lett. 2004, 149, 295–300. [Google Scholar] [CrossRef]
- Bains, W.; Petkowski, J.J.; Seager, S. A Data Resource for Sulfuric Acid Reactivity of Organic Chemicals. Data 2021, 6, 24. [Google Scholar] [CrossRef]
- Durre, I.; Vose, R.S.; Wuertz, D.B. Overview of the integrated global radiosonde archive. J. Clim. 2006, 19, 53–68. [Google Scholar] [CrossRef] [Green Version]
- Solutions, A. Map of Scheduled Airline Traffic Around the World. Available online: https://www.aqtsolutions.com/map-of-scheduled-airline-traffic-around-the-world/ (accessed on 12 May 2022).
- Möhler, O.; Arnold, F. Gaseous Sulfuric Acid and Sulfur Dioxide Measurements in the Arctic Troposphere and Lower Stratosphere: Implications for Hydroxyl Radical Abundances. Ber. Der Bunsenges. Für Phys. Chem. 1992, 96, 280–283. [Google Scholar] [CrossRef]
- Viggiano, A.; Arnold, F. Extended sulfuric acid vapor concentration measurements in the stratosphere. Geophys. Res. Lett. 1981, 8, 583–586. [Google Scholar] [CrossRef]
- Weininger, D. SMILES, a chemical language and information system. 1. Introduction to methodology and encoding rules. J. Chem. Inf. Comput. Sci. 1988, 28, 31–36. [Google Scholar] [CrossRef]
- Fushimi, A.; Saitoh, K.; Fujitani, Y.; Takegawa, N. Identification of jet lubrication oil as a major component of aircraft exhaust nanoparticles. Atmos. Chem. Phys. 2019, 19, 6389–6399. [Google Scholar] [CrossRef] [Green Version]
- Yu, Z.; Herndon, S.C.; Ziemba, L.D.; Timko, M.T.; Liscinsky, D.S.; Anderson, B.E.; Miake-Lye, R.C. Identification of lubrication oil in the particulate matter emissions from engine exhaust of in-service commercial aircraft. Environ. Sci. Technol. 2012, 46, 9630–9637. [Google Scholar] [CrossRef]
- Bains, W.; Petkowski, J.J.; Zhan, Z.; Seager, S. Evaluating Alternatives to Water as Solvents for Life: The Example of Sulfuric Acid. Life 2021, 11, 400. [Google Scholar] [CrossRef]
- Bains, W.; Seager, S. A combinatorial approach to biochemical space: Description and application to the redox distribution of metabolism. Astrobiology 2012, 12, 271–281. [Google Scholar] [CrossRef]
- Petkowski, J.J.; Bains, W.; Seager, S. On the Potential of Silicon as a Building Block for Life. Life 2020, 10, 84. [Google Scholar] [CrossRef]
- Heller, S.R.; McNaught, A.; Pletnev, I.; Stein, S.; Tchekhovskoi, D. InChI, the IUPAC International Chemical Identifier. J. Cheminf. 2015, 7, 23. [Google Scholar] [CrossRef] [Green Version]
- Yue, G.K.; Poole, L.R.; Wang, P.-H.; Chiou, E.W. Stratospheric aerosol acidity, density, and refractive index deduced from SAGE II and NMC temperature data. J. Geophys. Res. Atmos. 1994, 99, 3727–3738. [Google Scholar] [CrossRef]
- Murphy, D.M.; Thomson, D.S.; Mahoney, M.J. In Situ Measurements of Organics, Meteoritic Material, Mercury, and Other Elements in Aerosols at 5 to 19 Kilometers. Science 1998, 282, 1664–1669. [Google Scholar] [CrossRef]
- Lambe, A.T.; Ahern, A.T.; Williams, L.R.; Slowik, J.G.; Wong, J.P.S.; Abbatt, J.P.D.; Brune, W.H.; Ng, N.L.; Wright, J.P.; Croasdale, D.R.; et al. Characterization of aerosol photooxidation flow reactors: Heterogeneous oxidation, secondary organic aerosol formation and cloud condensation nuclei activity measurements. Atmos. Meas. Tech. 2011, 4, 445–461. [Google Scholar] [CrossRef] [Green Version]
- Pourkhesalian, A.M.; Stevanovic, S.; Rahman, M.M.; Faghihi, E.M.; Bottle, S.E.; Masri, A.R.; Brown, R.J.; Ristovski, Z.D. Effect of atmospheric aging on volatility and reactive oxygen species of biodiesel exhaust nano-particles. Atmos. Chem. Phys. 2015, 15, 9099–9108. [Google Scholar] [CrossRef] [Green Version]
- Wang, J.; Song, Y.; Zuo, J.; Wu, H. Compositions and pollutant sources of haze in Beijing urban sites. Environ. Sci. Pollut. Res. 2016, 23, 8827–8836. [Google Scholar] [CrossRef] [PubMed]
- Zhang, X.; Lambe, A.T.; Upshur, M.A.; Brooks, W.A.; Gray Bé, A.; Thomson, R.J.; Geiger, F.M.; Surratt, J.D.; Zhang, Z.; Gold, A.; et al. Highly Oxygenated Multifunctional Compounds in α-Pinene Secondary Organic Aerosol. Environ. Sci. Technol. 2017, 51, 5932–5940. [Google Scholar] [CrossRef]
- Mohr, C.; Thornton, J.A.; Heitto, A.; Lopez-Hilfiker, F.D.; Lutz, A.; Riipinen, I.; Hong, J.; Donahue, N.M.; Hallquist, M.; Petäjä, T.; et al. Molecular identification of organic vapors driving atmospheric nanoparticle growth. Nat. Commun. 2019, 10, 4442. [Google Scholar] [CrossRef] [Green Version]
- Ylisirniö, A.; Buchholz, A.; Mohr, C.; Li, Z.; Barreira, L.; Lambe, A.; Faiola, C.; Kari, E.; Yli-Juuti, T.; Nizkorodov, S.A.; et al. Composition and volatility of secondary organic aerosol (SOA) formed from oxidation of real tree emissions compared to simplified volatile organic compound (VOC) systems. Atmos. Chem. Phys. 2020, 20, 5629–5644. [Google Scholar] [CrossRef]
- Fang, Z.; Deng, W.; Zhang, Y.; Ding, X.; Tang, M.; Liu, T.; Hu, Q.; Zhu, M.; Wang, Z.; Yang, W.; et al. Open burning of rice, corn and wheat straws: Primary emissions, photochemical aging, and secondary organic aerosol formation. Atmos. Chem. Phys. 2017, 17, 14821–14839. [Google Scholar] [CrossRef] [Green Version]
- Hodshire, A.L.; Akherati, A.; Alvarado, M.J.; Brown-Steiner, B.; Jathar, S.H.; Jimenez, J.L.; Kreidenweis, S.M.; Lonsdale, C.R.; Onasch, T.B.; Ortega, A.M.; et al. Aging Effects on Biomass Burning Aerosol Mass and Composition: A Critical Review of Field and Laboratory Studies. Environ. Sci. Technol. 2019, 53, 10007–10022. [Google Scholar] [CrossRef]
- Hartikainen, A. Transformation of Organic Aerosol from Residential Wood Combustion during Atmospheric Aging Processes. Doctoral Dissertation, University of Eastern Finland, Kuopio, Finland, 2020. [Google Scholar]
- Torres, O.; Bhartia, P.K.; Taha, G.; Jethva, H.; Das, S.; Colarco, P.; Krotkov, N.; Omar, A.; Ahn, C. Stratospheric injection of massive smoke plume from Canadian boreal fires in 2017 as seen by DSCOVR-EPIC, CALIOP, and OMPS-LP observations. J. Geophys. Res. Atmos. 2020, 125, e2020JD032579. [Google Scholar] [CrossRef]
- Hallquist, M.; Wenger, J.C.; Baltensperger, U.; Rudich, Y.; Simpson, D.; Claeys, M.; Dommen, J.; Donahue, N.M.; George, C.; Goldstein, A.H.; et al. The formation, properties and impact of secondary organic aerosol: Current and emerging issues. Atmos. Chem. Phys. 2009, 9, 5155–5236. [Google Scholar] [CrossRef] [Green Version]
- Zhan, Z.; Seager, S.; Petkowski, J.J.; Sousa-Silva, C.; Ranjan, S.; Huang, J.; Bains, W. Assessment of isoprene as a possible biosignature gas in exoplanets with anoxic atmospheres. Astrobiology 2021, 21, 765–792. [Google Scholar] [CrossRef]
- Kon, H.; Blois, M., Jr. Paramagnetism of Hydrocarbon-Conc. H2SO4 Systems. J. Chem. Phys. 1958, 28, 743–744. [Google Scholar] [CrossRef]
- Höpfner, M.; Ungermann, J.; Borrmann, S.; Wagner, R.; Spang, R.; Riese, M.; Stiller, G.; Appel, O.; Batenburg, A.M.; Bucci, S.; et al. Ammonium nitrate particles formed in upper troposphere from ground ammonia sources during Asian monsoons. Nat. Geosci. 2019, 12, 608–612. [Google Scholar] [CrossRef]
- Wang, M.; Xiao, M.; Bertozzi, B.; Marie, G.; Rörup, B.; Schulze, B.; Bardakov, R.; He, X.-C.; Shen, J.; Scholz, W.; et al. Synergistic HNO3–H2SO4–NH3 upper tropospheric particle formation. Nature 2022, 605, 483–489. [Google Scholar] [CrossRef]
- Liler, M. Reaction Mechanisms in Sulphuric Acid and Other Strong Acid Solutions; Academic Press: London, UK, 1971. [Google Scholar]
- Johnston, M.V. Sampling and analysis of individual particles by aerosol mass spectrometry. J. Mass Spectrom. 2000, 35, 585–595. [Google Scholar] [CrossRef]
- Murphy, D.M.; Froyd, K.D.; Schwarz, J.P.; Wilson, J.C. Observations of the chemical composition of stratospheric aerosol particles. Q. J. R. Meteorol. Soc. 2014, 140, 1269–1278. [Google Scholar] [CrossRef]
- Thomson, D.S.; Schein, M.E.; Murphy, D.M. Particle Analysis by Laser Mass Spectrometry WB-57F Instrument Overview. Aerosol Sci. Technol. 2000, 33, 153–169. [Google Scholar] [CrossRef] [Green Version]
- Mauersberger, K. Mass spectrometry in the stratosphere. Adv. Space Res. 1982, 2, 287–290. [Google Scholar] [CrossRef]
- Arnold, F.; Heitmann, H.; Oberfrank, K. First composition measurements of positive ions in the upper troposphere. Planet. Space Sci. 1984, 32, 1567–1576. [Google Scholar] [CrossRef]
- Middlebrook, A.; Murphy, D.; Lee, S.; Lee, S.; Lee, S.; Thomson, D.; Thomson, D. Classification of the PALMS single particle mass spectral data from Atlanta by regression tree analysis. In Proceedings of the AGU Fall Meeting Abstracts; American Geophysical Union: Washington, DC, USA, 2001; p. A11B-07. [Google Scholar]
- Chemical Sciences Laboratory. PALMS Spectra Categories. Available online: https://csl.noaa.gov/groups/csl2/instruments/palms/cat.html#wam (accessed on 17 July 2022).
- Pollack, J.B.; Toon, O.B.; Summers, A.; Van Camp, W.; Baldwin, B. Estimates of the climatic impact of aerosols produced by space shuttles, SST’s, and other high flying aircraft. J. Appl. Meteorol. Climatol. 1976, 15, 247–258. [Google Scholar] [CrossRef] [Green Version]
- Schumann, U. On the Effect of Emissions from Aircraft Engines on the State of the Atmosphere; Institut für Physik der Atmosphäre: Oberpfaffenhofen, Germany, 1993. [Google Scholar]
- Tie, X.X.; Brasseur, G.; Lin, X.; Friedlingstein, P.; Granier, C.; Rasch, P. The impact of high altitude aircraft on the ozone layer in the stratosphere. J. Atmos. Chem. 1994, 18, 103–128. [Google Scholar] [CrossRef]
- Grobman, J. Review of Jet Engine Emissions. NASA TM X-68064. In Proceedings of the Department of Transportatiion Survey Conference: Climatic Impact Assessment Program, Cambridge, MA, USA, 15–16 February 1972. [Google Scholar]
- Graver, B.; Zhang, K.; Ructherford, D. CO2 Emissions from Commercial Aviation, 2018; ICCT Working Paper 2019-16; International Council on Clean Transportation: Washington, DC, USA, 2019. [Google Scholar]
- Yu, P.; Rosenlof, K.H.; Liu, S.; Telg, H.; Thornberry, T.D.; Rollins, A.W.; Portmann, R.W.; Bai, Z.; Ray, E.A.; Duan, Y.; et al. Efficient transport of tropospheric aerosol into the stratosphere via the Asian summer monsoon anticyclone. Proc. Natl. Acad. Sci. USA 2017, 114, 6972–6977. [Google Scholar] [CrossRef] [PubMed] [Green Version]
- Tait, K.N.; Khan, M.A.H.; Bullock, S.; Lowenberg, M.H.; Shallcross, D.E. Aircraft Emissions, Their Plume-Scale Effects, and the Spatio-Temporal Sensitivity of the Atmospheric Response: A Review. Aerospace 2022, 9, 355. [Google Scholar] [CrossRef]
- Bossolasco, A.; Jegou, F.; Sellitto, P.; Berthet, G.; Kloss, C.; Legras, B. Global modeling studies of composition and decadal trends of the Asian Tropopause Aerosol Layer. Atmos. Chem. Phys. 2021, 21, 2745–2764. [Google Scholar] [CrossRef]
- Ayers, G.P.; Gillett, R.W.; Gras, J.L. On the vapor pressure of sulfuric acid. Geophys. Res. Lett. 1980, 7, 433–436. [Google Scholar] [CrossRef]
- Luo, B.P.; Peter, T.; Crutzen, P.J. Maximum Supercooling of H2SO4 Acid Aerosol Droplets. Ber. Der Bunsenges. Für Phys. Chem. 1992, 96, 334–338. [Google Scholar] [CrossRef]
- McGraw, R.; Weber, R.J. Hydrates in binary sulfuric acid-water vapor: Comparison of CIMS measurements with the Liquid-Drop Model. Geophys. Res. Lett. 1998, 25, 3143–3146. [Google Scholar] [CrossRef]
- Marti, J.J.; Jefferson, A.; Cai, X.P.; Richert, C.; McMurry, P.H.; Eisele, F. H2SO4 vapor pressure of sulfuric acid and ammonium sulfate solutions. J. Geophys. Res. Atmos. 1997, 102, 3725–3735. [Google Scholar] [CrossRef]
- Yaws, C.L. Chemical Properties Handbook: Physical, Thermodynamic, Environmental, Transport, Safety and Health Related Properties for Organic and Inorganic Chemicals. J. Chem. Eng. Jpn. 1999, 39, 1057–1064. [Google Scholar]
- Arnold, F.; Fabian, R.; Joos, W. Measurements of the height variation of sulfuric acid vapor concentrations in the stratosphere. Geophys. Res. Lett. 1981, 8, 293–296. [Google Scholar] [CrossRef]
- Turco, R.; Hamill, P.; Toon, O.; Whitten, R.; Kiang, C. A one-dimensional model describing aerosol formation and evolution in the stratosphere: I. Physical processes and mathematical analogs. J. Atmos. Sci. 1979, 36, 699–717. [Google Scholar] [CrossRef] [Green Version]
- Arnold, F.; Curtius, J.; Spreng, S.; Deshler, T. Stratospheric aerosol sulfuric acid: First direct in situ measurements using a novel balloon-based mass spectrometer apparatus. J. Atmos. Chem. 1998, 30, 3–10. [Google Scholar] [CrossRef]
- Koza, J.R. Genetic Programming: On the Programming of Computers by Means of Natural Selection; MIT Press: Cambridge, MA, USA, 1992. [Google Scholar]
- Punch, W.F.; Zongker, D.; Goodman, E.D. The Royal Tree Problem, a Benchmark for Single and Multiple Population Genetic Programming. In Advances in Genetic Programming; MIT Press: Cambridge, MA, USA, 1996; Volume 2. [Google Scholar] [CrossRef]
- Bains, W.; Gilbert, R.; Sviridenko, L.; Gascon, J.-M.; Scoffin, R.; Birchall, K.; Harvey, I.; Caldwell, J. Evolutionary computational methods to predict oral bioavailability QSPRs. Curr. Opin. Drug Discov. Dev. 2002, 5, 44–51. [Google Scholar]
- Zhang, R.; Wooldridge, P.J.; Abbatt, J.P.D.; Molina, M.J. Physical chemistry of the sulfuric acid/water binary system at low temperatures: Stratospheric implications. J. Phys. Chem. 1993, 97, 7351–7358. [Google Scholar] [CrossRef]
- Mund, C.; Zellner, R. Raman- and Mie-Spectroscopic Studies of the Cooling Behaviour of Levitated, Single Sulfuric Acid/H2O Microdroplets. ChemPhysChem 2003, 4, 638–645. [Google Scholar] [CrossRef]
- Gmitro, J.I.; Vermeulen, T. Vapor-liquid equilibria for aqueous sulfuric acid. AIChE J. 1964, 10, 740–746. [Google Scholar] [CrossRef] [Green Version]
Figure 1.
Summary of data from the monthly average values from the IGRS database, for measurements between 0° and 70° degrees latitude. Left–average temperature at each of the four pressure standards reported, graphed per month. Centre–distribution of the monthly average temperatures across the whole dataset of 1,629,727 monthly average measurements, by altitude band. Right–average water vapour pressure, as a function of atmospheric measurement pressure.

Figure 2.
Predicted concentration of sulfuric acid in aerosol droplets as a function of altitude. x axis: altitude (km). y axis: predicted percentage sulfuric acid in droplets at equilibrium with gas phase water and sulfuric acid at that altitude. Plotted are the predicted concentrations calculated from two sulfuric acid gas phase abundances and the seasonal distribution of water gas phase abundances. Error bars are estimated errors in prediction of H2SO4 concentration from gas phase concentrations, as described in Appendix A.

Figure 3.
Oxygen content of the chemical space of stable compounds declines with exposure to concentrated sulfuric acid. y axis: Average of O/C content of the chemical space after reaction in sulfuric acid under proposed stratospheric conditions. x axis: time. Error bars are the standard deviation of the average O/C value across the range of conditions considered.

Figure 4.
Half of jet fuel combustion products are expected to have half-lives of over 100 days. x axis: compound number as listed in Table 1. y axis: half-time to reaction with sulfuric acid under stratospheric conditions. Amber bars—range of estimated values for range of conditions. Yellow bar—values for pyrene, whose stability is over-estimated by this model. Circles: average values–red = compounds containing no carbon-carbon double bonds (e.g., alkanes). Blue = compounds containing carbon-carbon double bonds (e.g., alkenes). The full table of data is provided in Supplementary Information.

Table 1.
Incomplete combustion products of commercial jet fuel.
| Number | SMILES 1 | Name | BP (°C) | Ref. |
|---|---|---|---|---|
| 1 | C=CC1=CC=CC=C1 | Styrene | 145 | 2 |
| 2 | O=CC(C)=C | Methylacrolein | 69 | 1 |
| 3 | CC(=O)C | Acetone | 56 | 1 |
| 4 | O=CC=C | Acrolein | 53 | 1,2 |
| 5 | CC=O | Acetaldehyde | 20.2 | 1,2 |
| 6 | C=O | formaldehyde | −19 | 2 |
| 7 | C=CCCCCC | 1-heptene | 94 | 2 |
| 8 | C=CCCCCCCC | 1-nonene | 147 | 2 |
| 9 | C=CCCCCCC | 1-octene | 121 | 2 |
| 10 | C=CCC | Butene | −6.47 | 1 |
| 11 | C=C | Ethylene | −103.7 | 1 |
| 12 | C=CCCC | Pentene | 123 | 1 |
| 13 | C=CC | Propene | −47.6 | 1 |
| 14 | CO | Methanol | 64.7 | 1 |
| 15 | CCCCCCCCCCCCCCCC | n-hexadecane | 286.9 | 2 |
| 16 | CCCCCCCCCCCCCCC | n-pentadecane | 270 | 2 |
| 17 | CCCCCCCCCCCCC | n-tridecane | 234 | 2 |
| 18 | CCCCCCCCCCCC | n-dodecane | 216 | 2 |
| 19 | CCCCCCCCCCC | n-undecane | 195 | 2 |
| 20 | CCCCCCCCCC | n-decane | 173.8 | 2 |
| 21 | CCCCCCC | n-heptane | 98.4 | 2 |
| 22 | CCCCCCCCC | n-nonane | 150.4 | 2 |
| 23 | CCCCCCCC | n-octane | 125.1 | 2 |
| 24 | CCCCC1=CC=CC=C1 | 1-phenylbutane | 183.3 | 2 |
| 25 | CC1=C2C=CC=CC2=CC=C1 | 1-methylnaphthalene | 241.5 | 2 |
| 26 | CC1=CC=C2C=CC=CC2=C1 | 2-methylnaphthalene | 241 | 2 |
| 27 | C12=CC=CC=C1C=C3C=CC4=CC=CC5=CC=C2C3=C45 | Benzo(a)pyrene | 495 | 2 |
| 28 | C12=CC=CC=C1C=CC=C2 | Naphthalene | 218 | 2 |
| 29 | OC1=CC=CC=C1 | Phenol | 181.7 | 2 |
| 30 | C12=CC=CC=C1C=C3C=CC=CC3=C2 | Anthracene | 341.3 | 2 |
| 31 | C12=CC=CC=C1C=CC3=CC4=CC=CC=C4C=C32 | Benzo(a)anthracene | 438 | 2 |
| 32 | C12=CC=CC=C1C=CC3=C4C=CC=CC4=CC=C23 | Chrysene | 448 | 2 |
| 33 | CCC1=CC=CC=C1 | ethylbenzene | 136 | 2 |
| 34 | C12=CC=CC(C3=C4C=CC=C3)=C1C4=CC=C2 | Fluoranthene | 375 | 2 |
| 35 | CC1=CC=CC=C1C | O-xylene | 144 | 2 |
| 36 | C12=CC=CC=C1C=CC3=CC=CC=C23 | Phenanthrene | 332 | 2 |
| 37 | C12=CC=C3C=CC=C4C=CC(C2=C34)=CC=C1 | Pyrene | 404 | 2 |
| 38 | CC1=CC=CC=C1 | Toluene | 111 | 1,2 |
| 39 | CC1=CC=C(C)C=C1 | P-xylene | 138 | 2 |
| 40 | C1=CC=CC=C1 | Benzene | 80.1 | 1,2 |
Table 2.
Conditions used to model the reaction of compounds to sulfuric acid. Measurements by balloon sonde listed in the Integrated Global Radiosonde Archive (IGRS) database [29] at NOAA (https://www.ncei.noaa.gov/pub/data/igra/ (Accessed on 2 May 2022) are listed for specific pressure, not specific altitude; the pressure is listed in column 1, the altitude and temperature ranges over 0–70° Latitude and January–December monthly averages (See Figure 1) are listed in columns 2 and 3, and the range of inferred sulfuric acid concentrations in aerosol droplets (See Figure 1) in column 4.
| Pressure Bin (hPa) | Altitude Range (km) | Temperature Range (K) | Sulfuric Acid Concentration Range (%) |
|---|---|---|---|
| 150 | 13.53–14.04 | 204.6–225.7 | 48.8–73.3 |
| 200 | 11.10–12.20 | 210.9–226.3 | 42.8–72.0 |
| 250 | 10.29–10.74 | 212.2–235.8 | 35.9–71.5 |
| 300 | 9.08–9.49 | 215.8–245.5 | 32.9–69.6 |
Publisher’s Note: MDPI stays neutral with regard to jurisdictional claims in published maps and institutional affiliations. |
© 2022 by the authors. Licensee MDPI, Basel, Switzerland. This article is an open access article distributed under the terms and conditions of the Creative Commons Attribution (CC BY) license (https://creativecommons.org/licenses/by/4.0/).
Share and Cite
MDPI and ACS Style
Bains, W.; Viita, E.; Petkowski, J.J.; Seager, S. Stratospheric Chemical Lifetime of Aviation Fuel Incomplete Combustion Products. Atmosphere 2022, 13, 1209. https://0-doi-org.brum.beds.ac.uk/10.3390/atmos13081209
AMA Style
Bains W, Viita E, Petkowski JJ, Seager S. Stratospheric Chemical Lifetime of Aviation Fuel Incomplete Combustion Products. Atmosphere. 2022; 13(8):1209. https://0-doi-org.brum.beds.ac.uk/10.3390/atmos13081209
Chicago/Turabian StyleBains, William, Eleanor Viita, Janusz J. Petkowski, and Sara Seager. 2022. "Stratospheric Chemical Lifetime of Aviation Fuel Incomplete Combustion Products" Atmosphere 13, no. 8: 1209. https://0-doi-org.brum.beds.ac.uk/10.3390/atmos13081209
Note that from the first issue of 2016, this journal uses article numbers instead of page numbers. See further details here.