Article

GIS-Based Spatial Modeling of Snow Avalanches Using Analytic Hierarchy Process. A Case Study of the Šar Mountains, Serbia

1
Faculty of Geography, University of Belgrade, Studentski Trg 3/III, 11000 Belgrade, Serbia
2
Geographical Institute “Jovan Cvijić” SASA, Đure Jakšića 9, 11000 Belgrade, Serbia
3
Faculty of Sciences and Mathematics, University of Priština in Kosovska Mitrovica, Lole Ribara 29, 38220 Kosovska Mitrovica, Serbia
4
Department of Geography, Tourism and Territorial Planning, University of Oradea, 410087 Oradea, Romania
5
Department of International Relations and European Studies, Faculty of History, International Relations, Political and Communication Sciences, University of Oradea, 410087 Oradea, Romania
6
Primary School of Husino, 27. Jula, 9, 75000 Tuzla, Bosnia and Herzegovina
7
Department of Geography, Tourism and Hotel Management, Faculty of Sciences, University of Novi Sad, Trg Dositeja Obradovića 3, 21000 Novi Sad, Serbia
*
Author to whom correspondence should be addressed.
Submission received: 22 June 2022 / Revised: 30 July 2022 / Accepted: 1 August 2022 / Published: 3 August 2022

Abstract

:
Snow avalanches are one of the most devastating natural hazards in the highlands that often cause human casualties and economic losses. The complex process of modeling terrain susceptibility requires the application of modern methods and software. The prediction of avalanches in this study is based on the use of geographic information systems (GIS), remote sensing, and multicriteria analysis—analytic hierarchy process (AHP) on the territory of the Šar Mountains (Serbia). Five indicators (lithological, geomorphological, hydrological, vegetation, and climatic) were processed, where 14 criteria were analyzed. The results showed that approximately 20% of the investigated area is highly susceptible to avalanches and that 24% of the area has a medium susceptibility. Based on the results, settlements where avalanche protection measures should be applied have been singled out. The obtained data can will help local self-governments, emergency management services, and mountaineering services to mitigate human and material losses from the snow avalanches. This is the first research in the Republic of Serbia that deals with GIS-AHP spatial modeling of snow avalanches, and methodology and criteria used in this study can be tested in other high mountainous regions.

1. Introduction

Snow avalanche is a natural disaster caused by large snow masses sliding down mountain slopes under the influence of gravity [1,2,3]. This is a typical phenomenon for mountainous regions worldwide [4,5,6]. In addition to snow, avalanches often contain other materials (rock debris, soil, plants) which are transported and accumulated in the lower areas. The aftermaths of avalanches include loss of human lives and impact on the human environment, settlements and transport infrastructure, biodiversity, landscape, etc. [7,8,9,10,11,12,13,14,15,16,17,18,19,20,21,22,23]. A large number of human casualties have been reported in Switzerland, Austria, Italy, Türkiye, Afghanistan, Pakistan, Tajikistan and Canada [14,24,25,26,27,28,29].
These worldwide studies of snow avalanches considers this type of hazard in a rather multidisciplinary way, combining the data associated with regional climatic conditions with advanced methods in remote sensing and Geographical Information System (GIS) methods. The work of Fazzini et al. [4] examined the existing relationships between climate extremization and environmental risk in a mass-movement prone area of Prati di Tivo area (Italy) and provided tools for civil protection activities and territorial planning in accordance with emergency management and mitigation measures. Košová et al. [5] performed an in-depth analysis of the snow avalanche risk within the Král’ova Hol’a area (Low Tatra Mountains in Slovakia) by modeling the trigger areas and simulating avalanche movements and their maximum impact by using GIS and the RAMMS simulation model. Sanz-Ramos et al. [6] reconstructed the snow avalanches of the Coll de Pal area in SE Pyrenees range by utilizing approaches such as field recognition, snow and weather characterization and numerical modeling. Bühler et al. [24] analyzed avalanche data from three different ski resorts in the vicinity of Davos, Switzerland by using an object-based approach for large-scale hazard indication mapping thus opening the door for large-scale avalanche hazard indication mapping in all regions where high-quality and high-resolution digital terrain models and snow data are available. Gruber and Bartelt [30] performed snow avalanche hazard modeling over the mountainous region of Switzerland. Respective authors used numerical and GIS-based methods to delineate forests with protective function against avalanches.
Durlević et al. [12] performed multi-hazard susceptibility assessment for the municipality of Štrpce (Southern Serbia, Western Balkans), an area located within the Šar Mountain National Park. These authors partly outlined the problems associated with snow avalanches. By using the Avalanches Potential Index method authors indicated that favorable conditions for the formation of avalanches occur within the 9.1 km2 of the municipality area (in southern and western parts of the analyzed municipality). The paper provided by Aydin et al. [27] assessed avalanche situation in Türkiye by examining the proportion of avalanche fatalities and using the numerical avalanche simulation software RAMMS and DEM (digital elevation model). On the other hand, Bair et al. [28] performed an analysis mainly related to the snow properties (with high potential to cause snow avalanches) in northwestern High Mountain Asia (regions in Afghanistan, Pakistan, and Tajikistan) by using the numerical snow cover modeling. The work of Caiserman et al. [29] provided snow avalanche frequency estimation by using 32 years of remote sensing data in Afghanistan. The obtained results indicated that a total of 810,000 large avalanches occurred since 1990 within an area of 28,500 km2 with a mean frequency of 0.88 avalanches/km²yr−1, damaging villages and blocking roads and streams.
In the eastern parts of Canada, Germain et al. [14] studied snow avalanche regime and climatic conditions in the Chic-Choc Range. The results of this study emphasized the sensitivity to regional climatic conditions (e.g., frequency of snowstorms, significant rise in air temperature, heavy snowfall and strong winds), as well as local factors such as snow drifting, cornices and slope aspect for the period between 1895 and 1999.
Factors influencing the formation of avalanches can be divided into two groups: natural and anthropogenic. Natural factors are vital for studying and identifying terrains susceptible to avalanches. These factors include geomorphological, climatic, biogeographical (vegetation), hydrological and lithological conditions.
The anthropogenic factors are reflected in various activities that are very sensitive to avalanche formation, such as deforestation, excessive construction, and the movement of skiers and snowboarders on the slopes.
The lack of data and studies on avalanches and their spatial distribution is a major problem in some countries. As indicated by Gruber and Bartelt [30], potential avalanche release areas are strongly related to the slope inclination of the terrain in general. Therefore, GIS and remote sensing based techniques can be used to automatically and efficiently determine potential avalanche release areas and other natural hazards [31,32,33,34,35,36,37,38,39,40,41,42].
Remote sensing-based and other modern methodologies allow the identification of terrains most susceptible to avalanches. Since both socio-economic and climatic factors are contributing to a significant increase in losses associated with natural hazards (including snow avalanches), decision makers and managers are striving to apply the most robust and user friendly models for the vulnerability assessment, reconstruction and rehabilitation of different structures affected by the given hazard. Due to the given demands, the Analytical Hierarchy Process (AHP) was developed in the 1970s and has been extensively studied and refined since then [43,44,45,46,47]. Users of the AHP first decompose their decision problem into a hierarchy of more easily comprehended sub-problems while each of them can be observed independently. This method usually helps the problem of multi-criteria decision making in the situation where there is a necessity for a prioritization of certain criteria. That was the reason why this model is widely used in the science of natural hazards and disasters. The AHP model uses hazard/disaster weights, which are comprised of numerical values evaluated for each structure when the influence of specific hazard/disaster is considered. Hence, the result of multiple sets of pair-wise comparisons at each level is a weighted value hierarchy, with all of the priorities in the decision concisely captured and expressed as numerical values [48]. Therefore, the AHP method stands as a structured technique for dealing with complex decisions, which is especially useful when dealing with hazard such as snow avalanches. Combining the analytic hierarchy process (AHP), GIS and field research makes it possible to identify avalanche-prone areas within a given area.
There is no integrated inventory of avalanches for the territory of Serbia, but previous research has identified the mountain ranges where this natural disaster has caused human and material losses. The Šar Mountains are among the most avalanche-prone mountainous areas on the Balkan Peninsula. As pointed out by Durlević et al. [12], data collection from 1800 until today reports that more than 100 people have lost their lives due to avalanches in this area. The Brezovica ski center situated in the Šar Mountains is visited by tens of thousands of tourists enjoying winter sports every year, which leads to a great need to single out the most susceptible areas to protect human lives, infrastructure, and the rich biodiversity [49].
This research aims to apply a multi-criteria decision analysis to identify the potential spatial distribution of avalanches. The AHP method has found great application in studying natural hazards and other phenomena and processes in the world [50,51,52,53]. The susceptibility of terrain to snow avalanches depends on a large number of natural conditions that do not have the same influence on their formation and movement. Geomorphological and climatic conditions are more significant than lithological ones. Applying the AHP method gives greater importance to the main factors, so that the results obtained by this method give a more objective review of the state of the field, unlike methods that give the same importance to all factors.
After obtaining the results and synthesis maps, organizational, administrative and biological measures can be proposed to ban the movement of skiers and snowboarders outside the marked and secured trails and restrict the construction and deforestation, which would significantly improve the environment. This can be the first step in defining the safety services and the preliminary risk mitigation protocols that can be of interest to respective stakeholders involved in the decision making and territorial planning over a ski facilities area prone to a mass movement hazard. For the analysis of avalanches in this research, we used geographical approaches. The AHP approaches used in this research are presented by methods and algorithms established in previous respective investigations.

2. Study Area

The Šar Mountains are one of the largest mountain systems on the Balkan Peninsula. They stretch over about 1600 km2 and cover parts of three countries: Serbia, North Macedonia, and Albania. In Serbia, the Šar Mountains spread in the extreme south of the Republic, on the territory of the Autonomous Province of Kosovo and Metohija. This territory declared independence (which was partially recognized worldwide), but is officially under the temporary administration of the United Nations based on the Resolution 1244. In this paper, we analyzed the total area of 969.52 km2 of the Šar Mountains within Serbian territory (Figure 1).
The Šar Mountains were declared a national park (NP) back in 1993. Although the permanent NP boundaries are planned to cover an area of 970 km2, only 228 km2 are currently protected [54]. Due to their extremely rich geodiversity (geological, geomorphological, speleological, climatic, and hydrological values) and biodiversity, the Šar Mountains are an ideal area for geographical and ecological research. Administratively, it fully or partially covers the territories of the municipalities of Gora, Prizren, Suva Reka, Štrpce, and Kačanik.
Geologically, the most common rock formations in the Šar Mountains are metamorphic rocks, mainly represented by Paleozoic shales, covering almost half of the protected area (48.11%). Mesozoic carbonate platforms are present in the lower parts and near rivers. Moraines, fluvioglacial deposits and Pleistocene lake sediments are evidence of the specific Quaternary past in these areas.
From the geomorphological and morphometric aspects, the Šar Mountains are one of the highest terrains in Serbia, with an average altitude of 1421 m and an average slope of 18.16°. The highest peak of Serbia, Velika Rudoka (2660 m), is located on the Šar Mountains. One of the characteristic shapes in the relief of this area is the glacial relief.
During the Pleistocene, the highest parts of the Šar Mountains (above 2000 m) were periodically under snow cover, which resulted in the formation of glaciers that played a significant role in the morphological terrain formation.
Due to the formation and movement of glaciers, cirques, glacial valleys, moraines, and other characteristic forms of glacial relief were formed [55]. Today, most of the cirques are filled with water, so they transformed into glacial lakes, counting more than 60 on the Šar Mountains. In addition to the glacial reliefs, in this territory periglacial, slope, fluvial and karst reliefs are also found.
Climatic properties differ significantly due to the vertical relief (Figure 2). The highest mean annual air temperature (>12 °C) and the lowest precipitation (<800 mm) were measured in the northwestern part of the investigated area (near the city of Prizren), which can be explained with the Mediterranean influence that reaches the valley of Beli Drim River from the Adriatic Sea. Terrains with the lowest air temperature (<1 °C) and the highest precipitation (>1800 mm) are characterized by alpine climate, and these zones are above 2000 m, where the snow cover often lasts over 200 days a year [49]. During six months, the average snow layer can be deeper than 30 cm in these areas. The Šar Mountains are very rich in lakes, springs, and rivers. The most famous glacial lakes on the Serbian side of the Šar Mountains are Livadičko, Veliko Jažinačko, Gornje Bukorovačko, Veliko Šutmansko and Kuatovo Lakes. The most important watercourses are the Lepenac River (75 km long), which flows into the Vardar River, belonging to the Aegean Basin. Then, there are Plavska River (47.5 km long) and Prizrenska Bistrica River (35 km long) flowing into Beli Drim River belonging to the Adriatic Basin.
According to the Institute for Nature Conservation of Serbia, the Šar Mountains have one of the highest degrees of biodiversity in Europe: 1800 plant species (of which 339 are endemic to the Balkan and 18 are endemic to the Šar Mountains), 147 species of butterflies, 200 species of birds and about 45 species of reptiles and amphibians inhabit this mountain massif [54].

3. Implementation of the Analytical Hierarchy Process (AHP) Method

3.1. Methodology

The analytic-hierarchy process (AHP) was used for the needs of multicriteria analysis and obtaining a synthesis map. The method was developed by Thomas Saaty [56,57]. Its goal is to quantify the criteria differently, i.e., to make a hierarchy of criteria by priority [58,59,60]. To approach the AHP method and assign weight coefficients, it is necessary to know the research space, to understand the processes and physical laws in order to make the hierarchy of priority criteria more relevant [61,62,63].
The main characteristic of the AHP (Analytical Hierarchy Process) method is the influence of the subjective attitude in determining the weight of the criteria [46]. The subjective attitude in terms of assigning importance to different criteria is based on the results of previous research in the same field. In that case, the user’s subjectivity regarding the hierarchy of natural conditions by importance can bring a more objective presentation of the results. The Analytical Hierarchy Process is considered one of the best methods of expert scenario analysis and decision-making by consistently evaluating the hierarchy of objectives, criteria, sub-criteria and alternatives. In the process of avalanche research, all criteria are not equally important. The main reason for applying the AHP method is to add a different coefficient to each parameter, which would put the essential parameters first, while the less important ones would have a lower coefficient.
For the purposes of judging pairwise comparisons, a numerical scale of 9 degrees is used, according to values from 1 (equal importance) to 9 (extreme importance). AHP scale: 1, equal importance; 3, moderate importance; 5, strong importance; 7, very strong importance; and 9, extreme importance (2, 4, 6, 8 values in-between) [56,57].
In this study, numerical values from 1 to a maximum of 5 were used because it is considered that increasing the numerical values would lead to a large difference in the weighting coefficients, which would significantly increase the subjectivity of the priority assessment. The criterion with a value of 1 is marked as the most significant in its matrix, while the criterion with the highest value is the least significant. For the needs of research and data processing, the QGIS 3.8 open-access software was used [64].
Checking the consistency between the weightings of criteria resulting from the matrix of pair-wise comparisons was done through estimating the consistency ratio (CR) and consistency index (CI) [44]. The consistency index (CI) is obtained by the formula [65]:
CI = λ max n n 1
where: λmax—maximum eigenvalue of the matrix; n—number of criteria.
The consistency ratio (CR) is obtained by the formula [65]:
CR = CI RI
where: CI—consistency index; and RI—random consistency index (Table 1). RI is the value of the random index and depends on the number of criteria used in the matrix [65]. If the value of CR is smaller or equal to 0.1, the inconsistency is acceptable. In this study, all matrices have a CR of less than 0.05.
Since degrees of influence of natural factors on the formation and movement of avalanches are different, natural conditions were classified by importance: geomorphological, climatic, vegetation, hydrological and lithological conditions (Table 2). A large number of previous studies indicate that geomorphological and climatic factors are the most important for evaluating the spatial modeling of snow avalanches.
If it is confirmed that avalanches occur in a certain territory, a geomorphological study is an indispensable factor in determining their geography. The morphometric characteristics of the relief (elevation, slope, curvature, roughness, aspect) determine the place of avalanche formation, its movement and stopping.
Considering susceptibility, the presence and height of the snow cover is a prerequisite for analyzing the terrain. Climatic characteristics affect the appearance of snow cover, its duration, melting, freezing, falling again, recrystallization, etc. [49].
Due to characteristics of the high-mountain relief, the vegetation is differentiated into numerous altitude zones, of which the most significant for the occurrence of avalanches are the mountain pasture zones, as well as the frigophilous vegetation. On the northern slopes of the Šar Mountains, a large part of the territory is covered with grass vegetation representing an ideal base for the appearance and movement of avalanche masses.
The hydrological condition (distance from stream) plays a very important role, especially when it comes to wet avalanches. This type of avalanche can increase the amount of water in the rivers, which could later cause flash floods that would threaten the environment far from the place of avalanche’s occurrence.
Lithological characteristics represent the basis of the avalanche process. For the territory of the Šar Mountains, among the features important for the occurrence of avalanches, metamorphic rocks stand out, because they disintegrate relatively easily and form a loose cover of different thickness on the surface. When it comes to resistant rocks, selective erosion led to the creation of ridges, sharper parts of ridges, vertical fragments of slopes, and exactly these forms are one of the causes of avalanches [49].
For the needs of previous researches, different factors were used (Table 3). It is noted that terrain slope, aspect and curvature are indispensable factors in avalanche research.
Geomorphological factors and climatic properties have been most frequently used in research by numerous authors and are considered to be the most important criteria for the occurrence of snow avalanches [
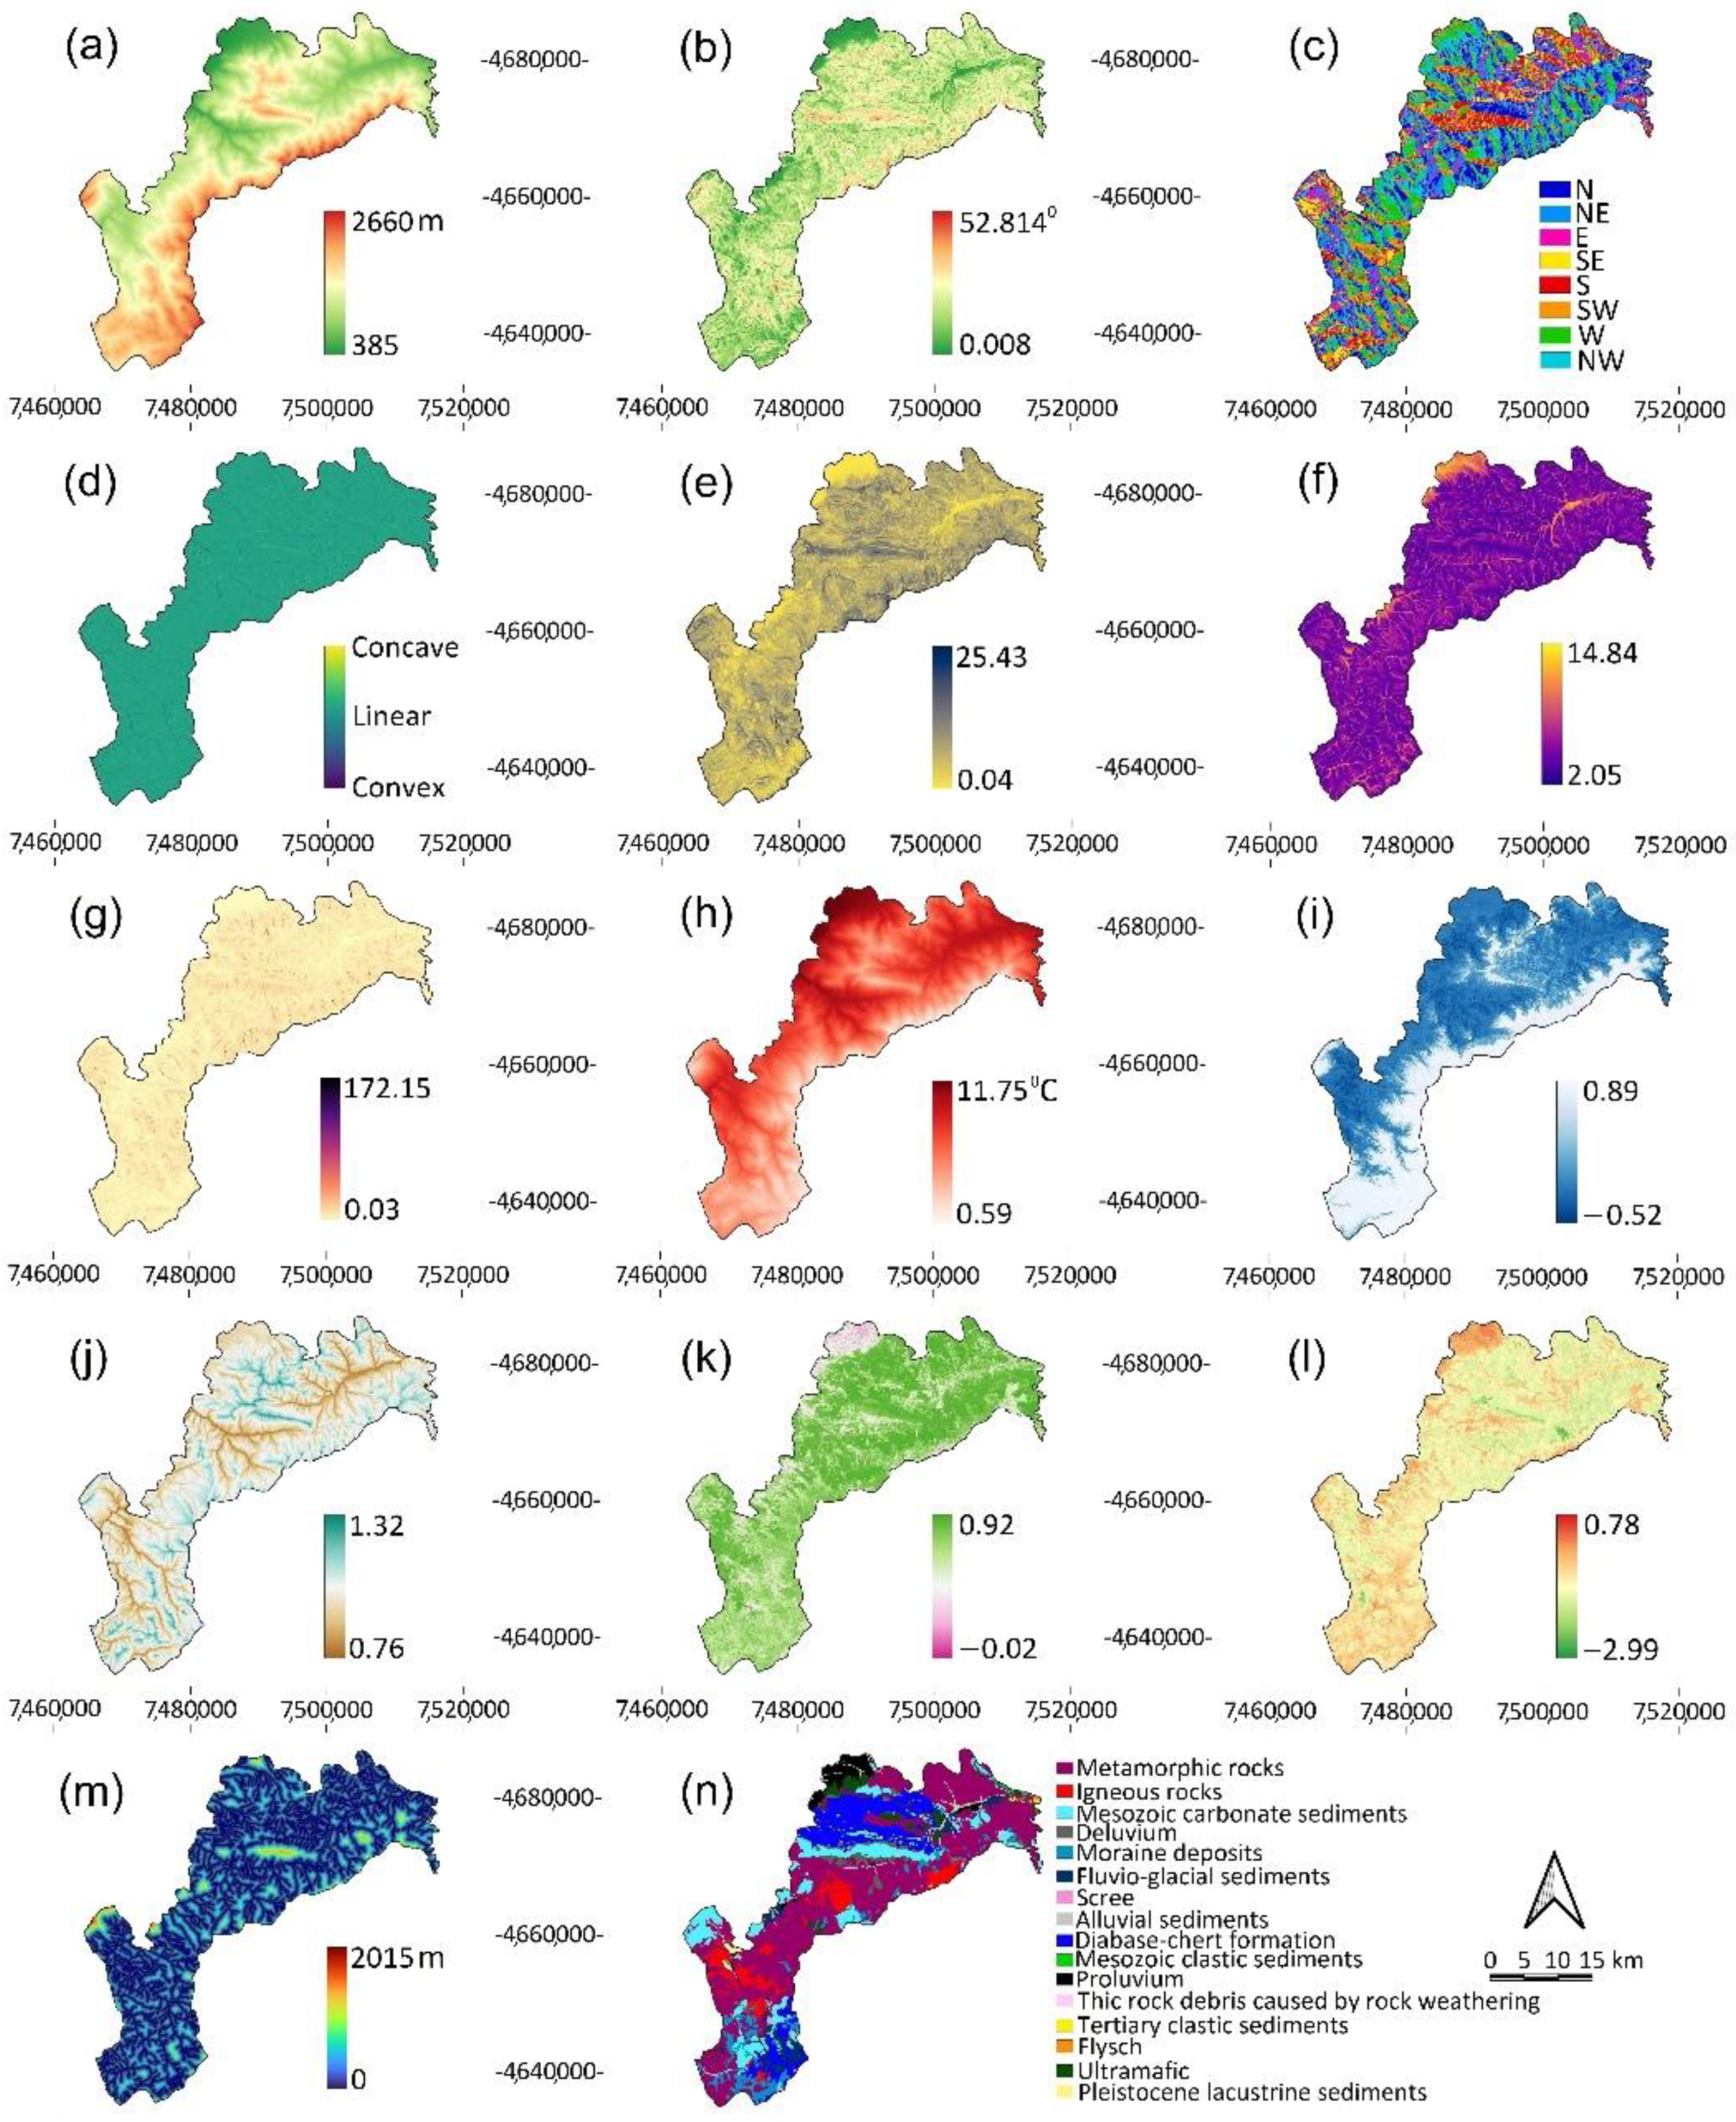
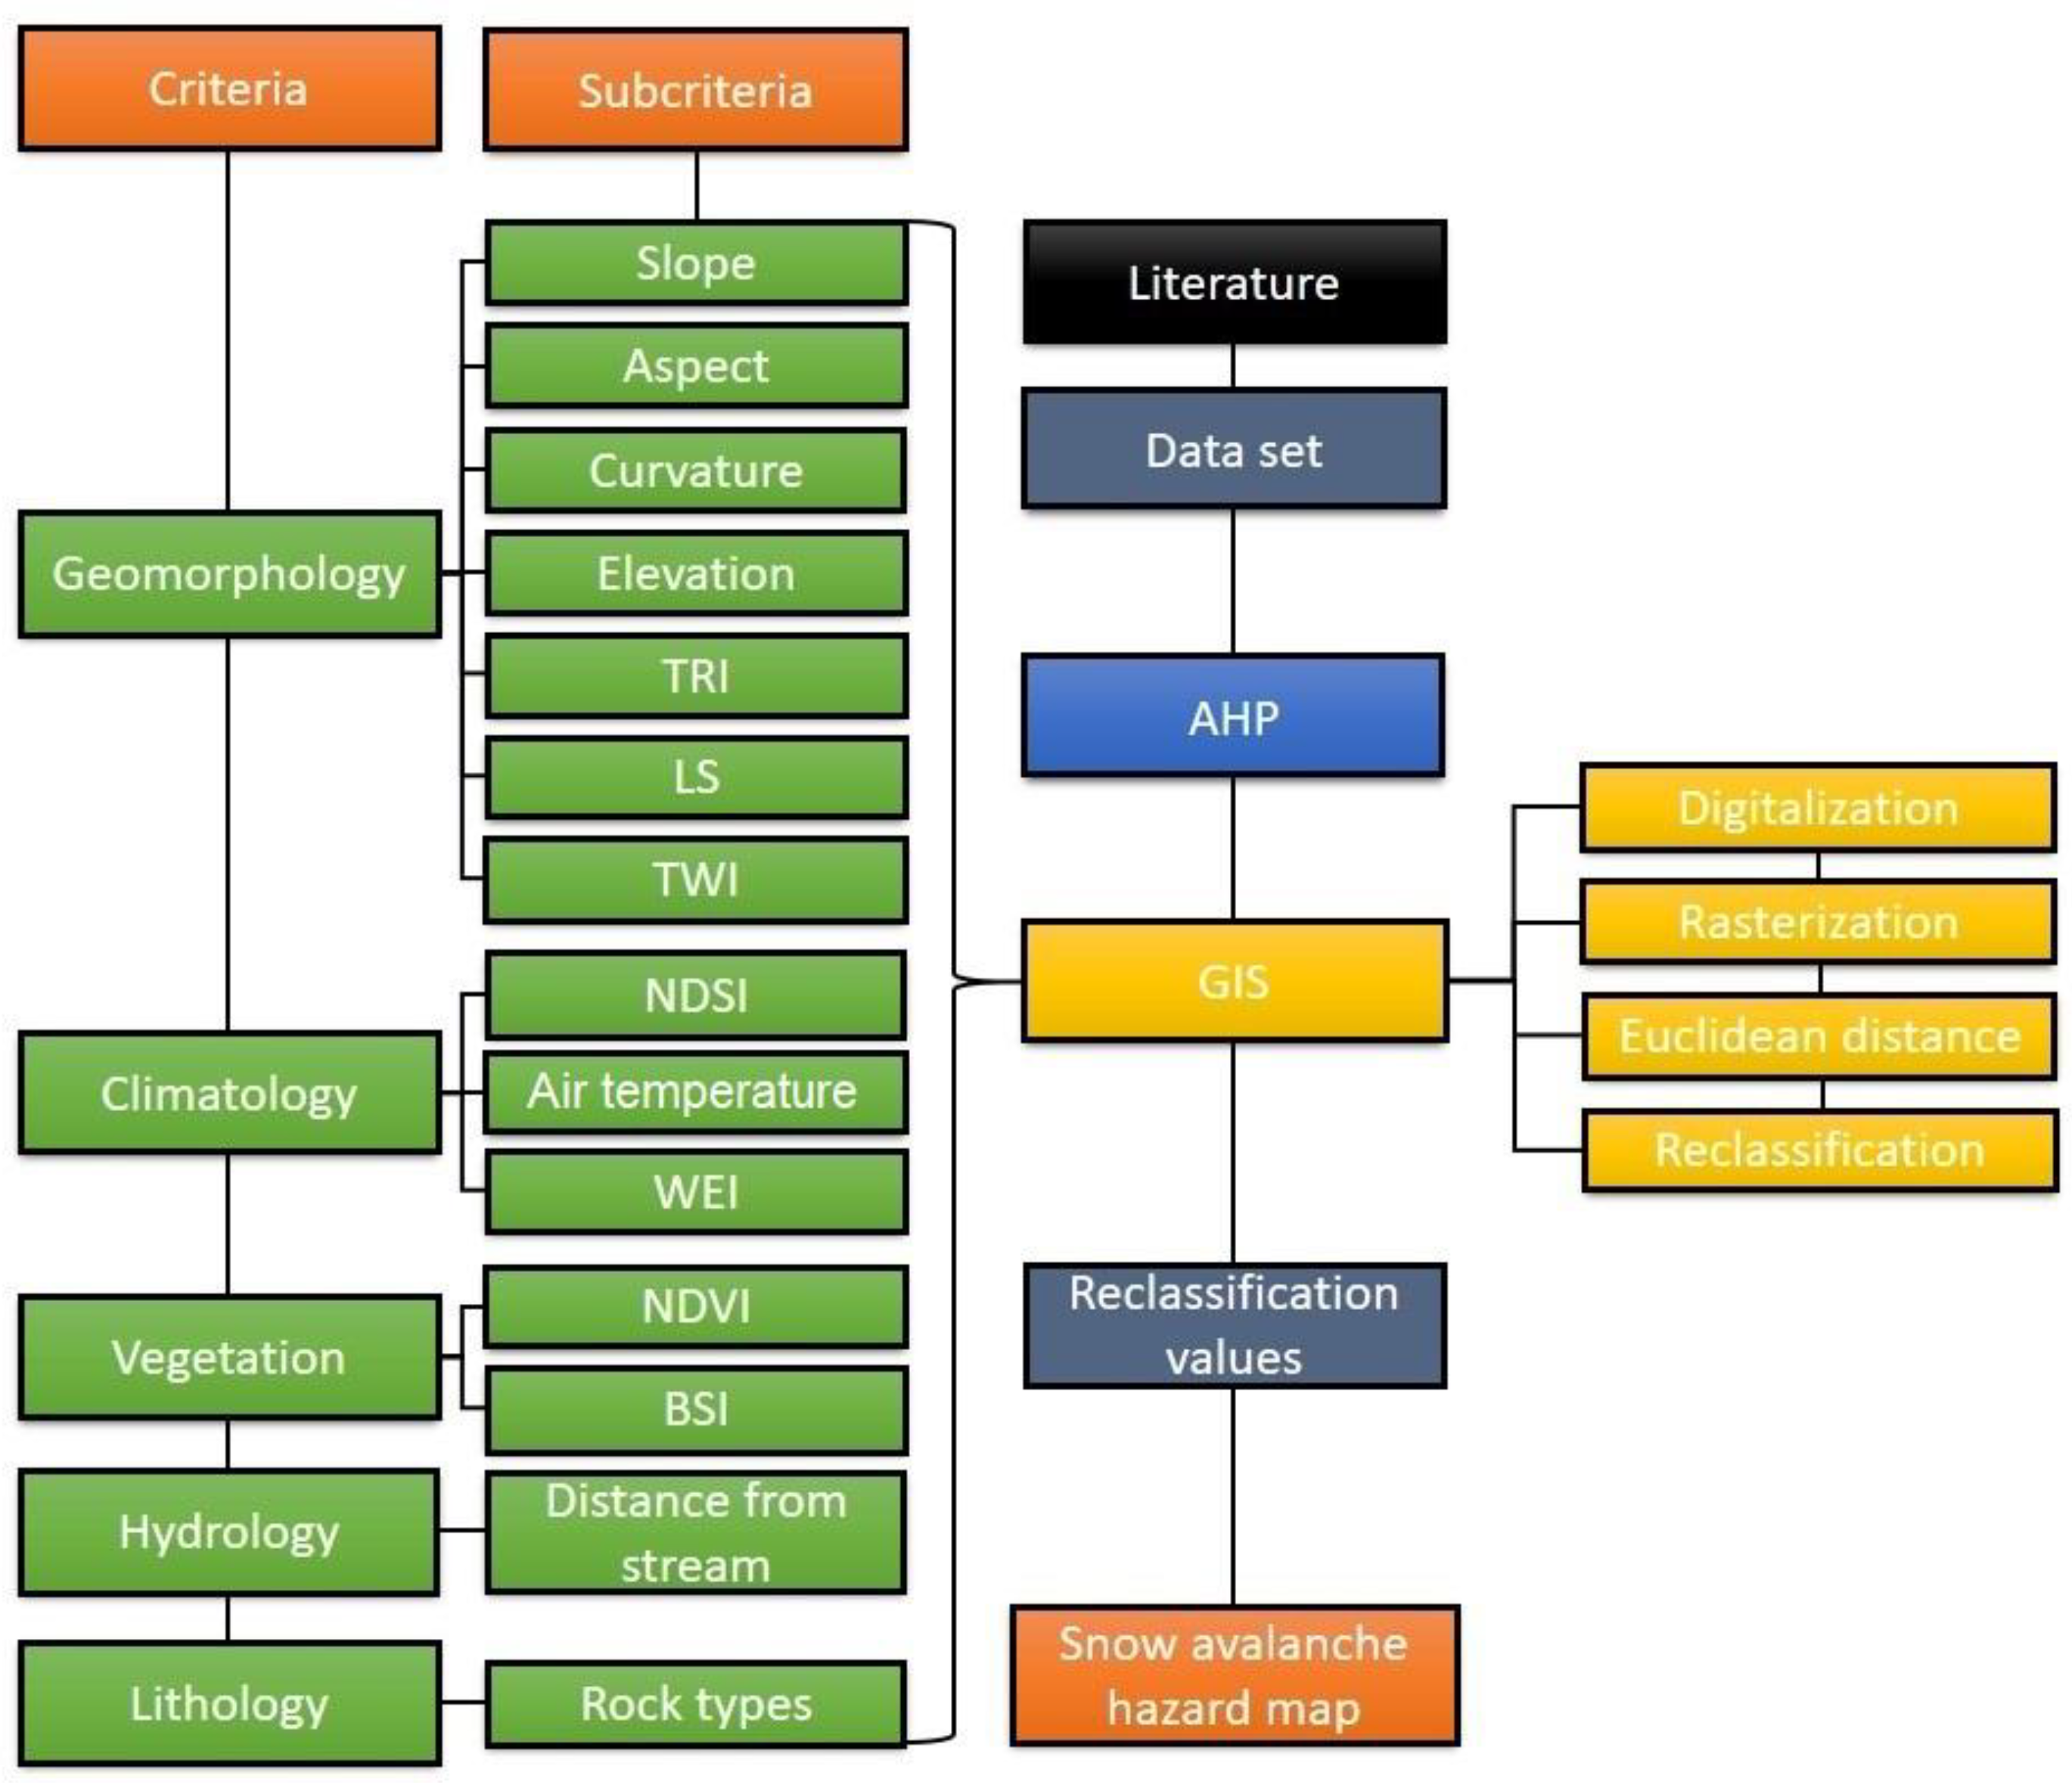
69]. From the geomorphological aspect, seven factors were used for the terrain analysis: slope, aspect, profile curvature (PC), elevation, topographic ruggedness index (TRI), topographic wetness index (TWI), and length–slope factor (LS) (Table 4).
Data for geomorphological characteristics were obtained through a digital elevation model (EU-DEM) with 25 m spatial resolution, taken from the website of the European Environment Agency (EEA)—Copernicus program, Land Monitoring Service [70]. All geomorphological parameters were obtained by processing DEM in the QGIS program in combination with SAGA additional functions and indices [64].
Climate factors are essential in terms of snowfall, wind effect (Wind exposition index—WEI), and air temperature. The index considered the most significant is the Normalized Difference Snow Index (NDSI) (Table 5).
The Wind Exposition Index (WEI) was obtained by processing DEM in QGIS software using SAGA plugins.
The Normalized Difference Vegetation Index (NDVI) and the Bare Soil Index (BSI) were used to process vegetation conditions (Table 6).

3.2. Criteria Selection

Elevation—The elevation does not have a direct influence on the development of snow avalanches, but it is closely related to climatic elements whose values vary depending on the altitude. With the increase in altitude, the air temperature drops, the wind speed increases and the snow cover stays longer than at lower altitudes [71]. The synergy of the mentioned factors creates ideal conditions for triggering snow avalanches [
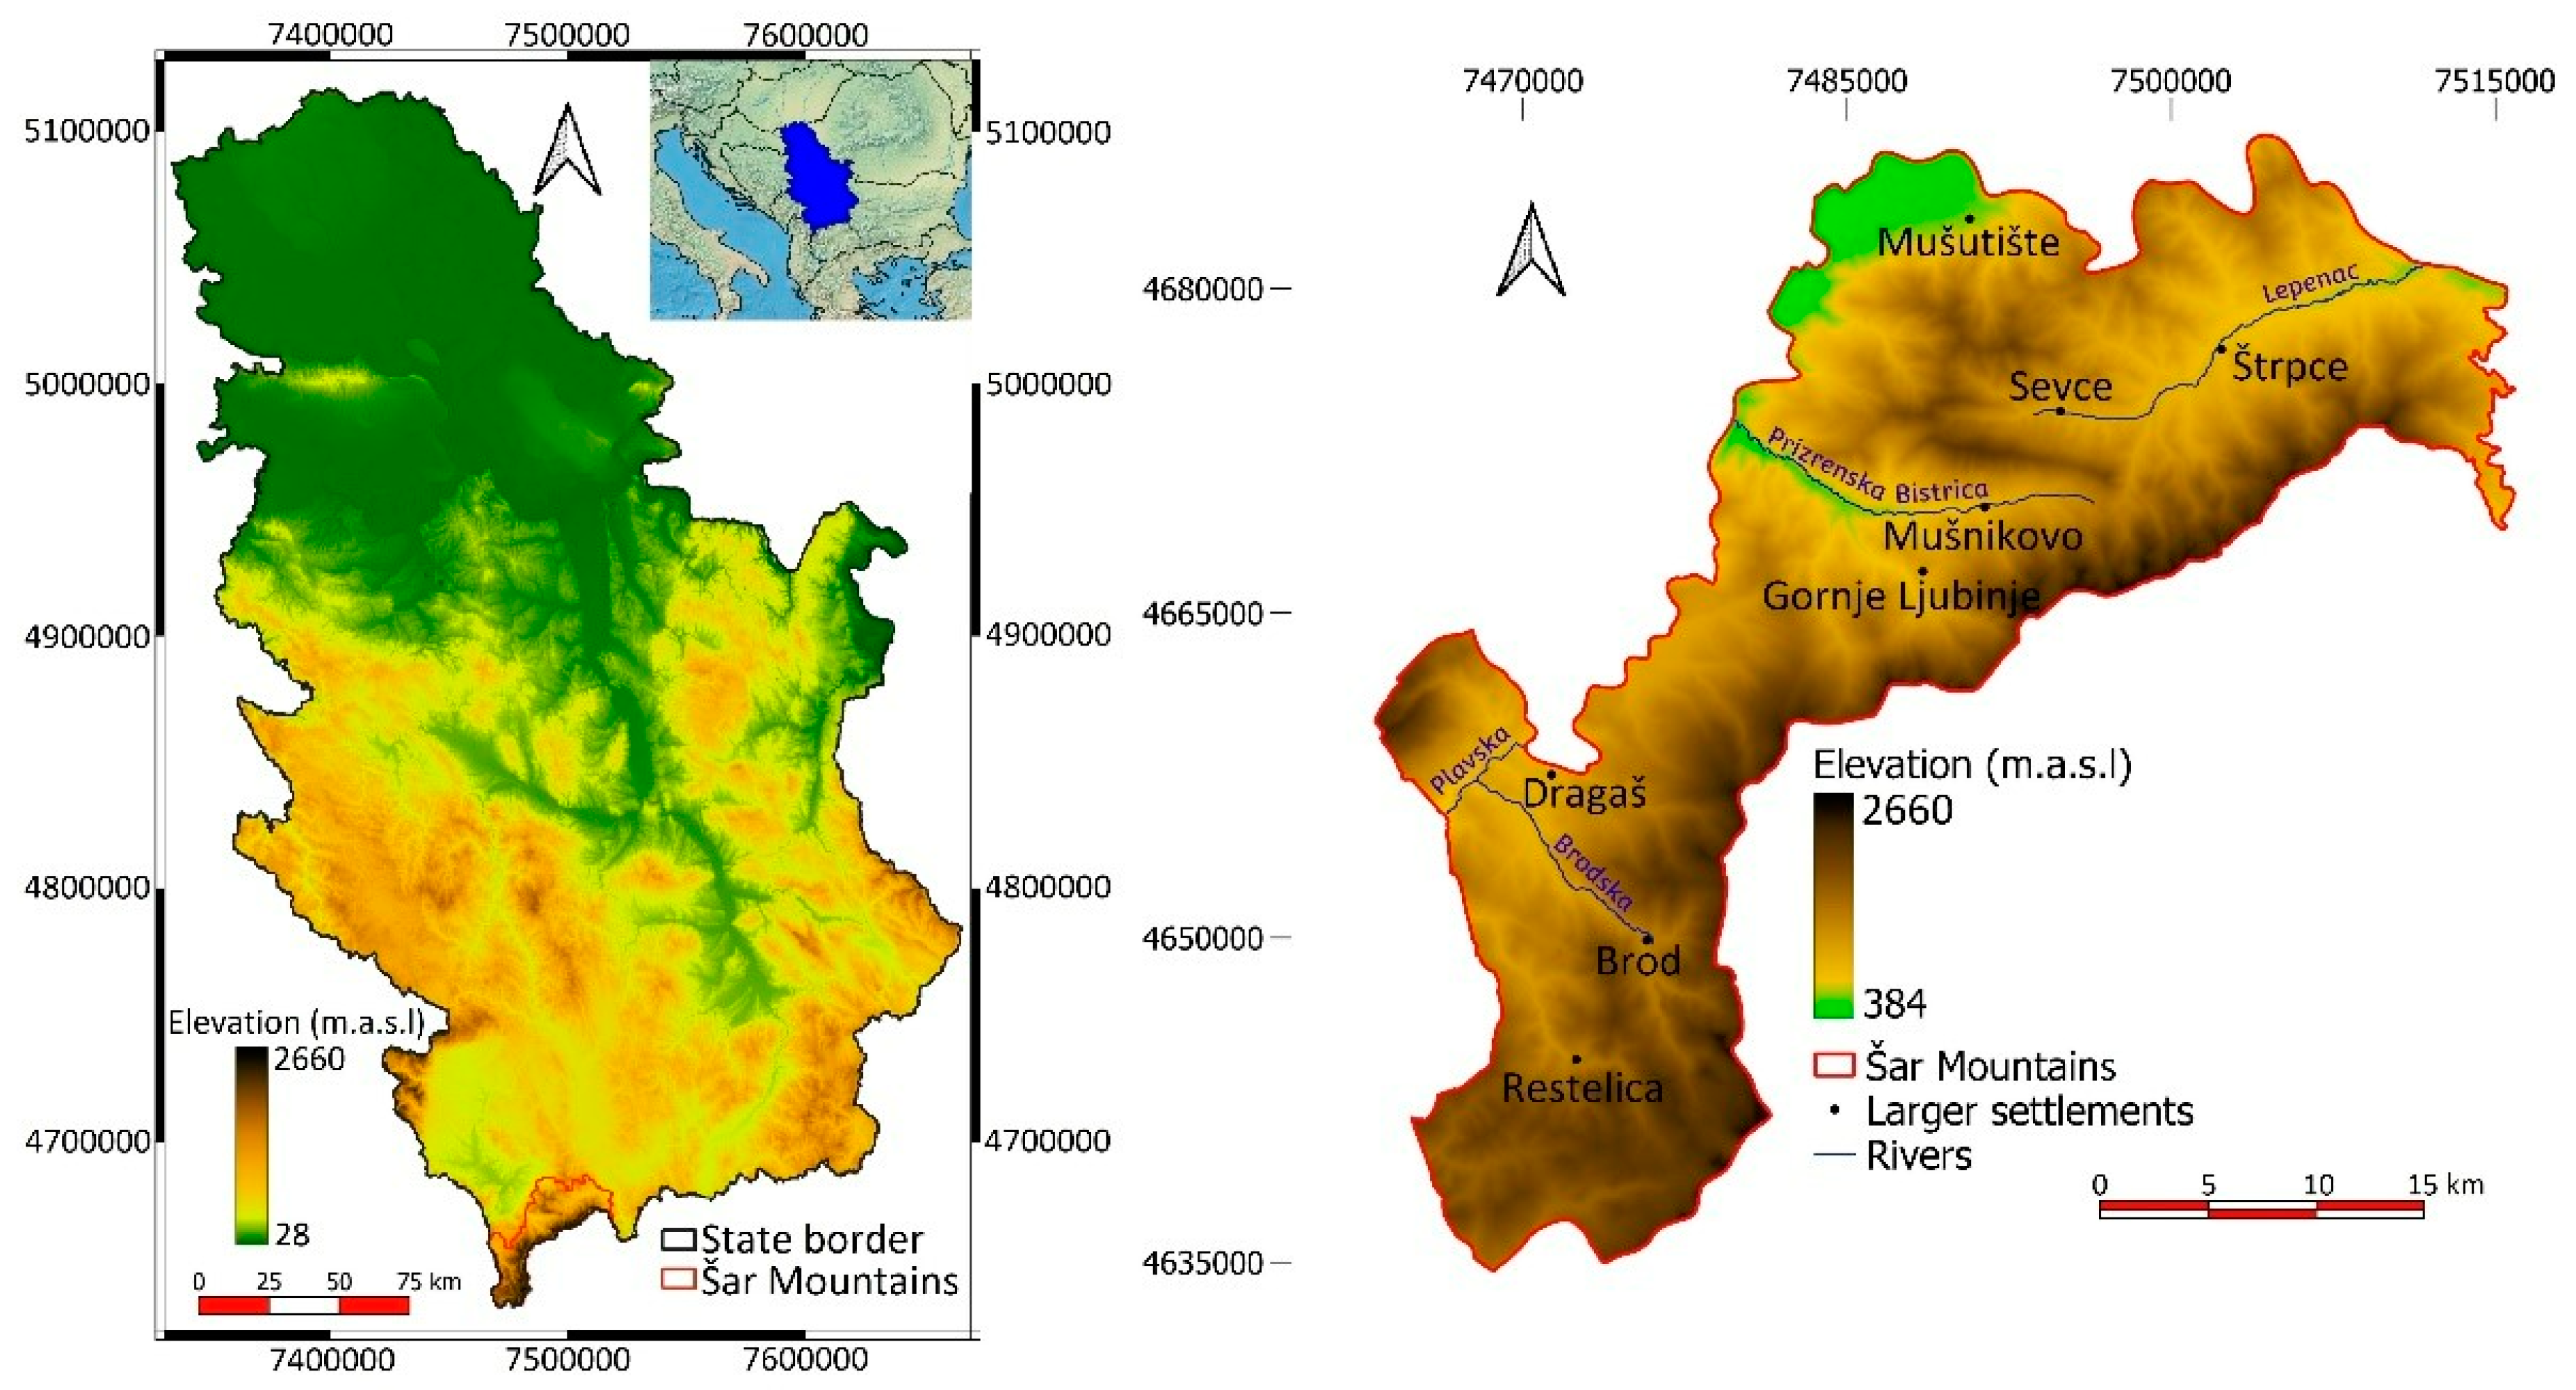
72]. On the Šar Mountains, the altitude varies from 384 to 2660 m.
Slope—The slope is the most important geomorphological factor for mapping the terrain’s vulnerability to snow avalanches. Combined with the forces of gravity and friction, the slope can be identified as the main initiator of avalanches [73]. The values of the slope of the terrain where the avalanche occurs can be different, it depends on which part of the avalanche is being investigated. Snow avalanches consist of three zones: the starting zone, the avalanche track and the runout zone. The starting zones are generally characterized by a large slope, which (as the avalanche moves) decreases in the avalanche track, and is the smallest during the avalanche runout (zone of deposition).
Aspect—Exposure of the terrain plays an important role in maintaining the snow cover. The sides that are facing the Sun due to pronounced insolation and higher temperature do not retain a large amount of snow during the year, warmer snow compacts more rapidly and weak layers tend to disappear quickly. Due to the higher probability of persistent weak layers, slopes facing the north side are considered more vulnerable to the occurrence of avalanches.
Profile curvature (PC)—The profile curvature is considered to be a significant factor that affects shear stress and snowpack movement [67]. Profile curvature is strongest at slope breaks. At such locations, stresses in the snow cover tend to be highest, thus the probability of an initial fracture increases. Avalanches may occur on concave, convex and linear sides of slopes.
Terrain ruggedness index (TRI)—The terrain ruggedness index is applied to obtain a representation of the height difference between adjacent cells in the digital elevation model [74]. TRI was developed by Riley [75] and can be computed with:
TRI = | x | ( m a x 2 m i n 2 )
where: x is the elevation of each neighboring cell and max and min are the highest and lowest elevations in the eight neighboring cells.
Terrains with lower values indicate smooth surfaces represented by river valleys or plains. On extremely sharp ridges and shoulders, the wind usually blows away all the snow so the chances of avalanche release are weak. However, the blowing snow is deposited in concave areas nearby, increasing the local stresses and fracture probability.
Topographic wetness index (TWI)—This factor derived from the digital elevation model quantifies terrain driven variation in soil moisture [76]. It can be calculated by the formula [77]:
TWI = ln ( α t a n β )
where α denotes upslope area which drains to a point, and β is the slope angle at the pixel. The highest values indicate areas with the highest percentage of humidity (river valleys). In this case, the areas with the lowest values are designated as vulnerable terrains because ridges and steep terrains are characterized by lower humidity, which increases the instability of the snow cover.
Length-slope factor (LS)—Geomorphological factor representing the distance from the origin of overland flow along its flow path to the location of either concentrated flow or deposition [78]. LS factor is based on an algorithm in SAGA-GIS software that uses a digital elevation model (DEM) as input data [64]. In the case of this index, the values vary depending on the length of the slopes.
Air temperature—One of the three analyzed meteorological parameters is the mean annual air temperature. The air temperature was calculated based on the estimate of the average annual air temperature for the Gora region, according to the formula [79]:
T = −0.0050 · H + 13.68
where: T—the average annual air temperature; and H is the digital elevation model.
Territories with a high annual air temperature are subject to more intense melting of the snow cover, which minimizes the chances of snow avalanches. Low air temperatures cause the snow to remain on the surface longer and give the possibility of accumulating new snow deposits, which reduces its stability [3]. On the Šar Mountains, the average annual air temperature varies from 0.59–11.75 °C.
Normalized difference snow index (NDSI)—an index of essential importance for the study of snow cover distribution. The Normalized Difference Snow Index was obtained by processing satellite images from the Sentinel-2 satellite. Since the snow cover varies each season, the images from three periods were analyzed: 27 January 2019, 17 March 2020, and 7 March 2021, so that finally, the average values from three images were taken. Normalized Difference Snow Index (NDSI) is obtained by the formula [80]:
NDSI =   ( G r e e n S W I R ) ( G r e e n + S W I R )
where: Green is the green spectral band, while SWIR is the shortwave infrared spectral band. The highest values of the index indicate areas covered with snow, while negative values show territories without snow cover.
Wind exposition index (WEI)—a significant parameter that plays a role in the process of snow accumulation. Sides that are constantly exposed to strong winds are less susceptible to the formation of snow avalanches because there is no major accumulation of snow deposits [67]. The wind exposition index (WEI) was calculated and mapped in SAGA-GIS based on DEM [64]. This tool calculates the average WEI for all directions using an angular step [81]. Values below 1 indicate wind shadowed areas whereas values above 1 indicate areas exposed to wind.
Normalized difference vegetation index (NDVI)—a vegetation parameter that is widely used in the analysis of natural hazards. NDVI was obtained by processing Sentinel-2 satellite images from July 30, 2021, and is calculated by the formula [82,83,84]:
NDVI = ( N I R R E D ) ( N I R + R E D )
where: NIR is the near-infrared spectral band; and RED is the red spectral band. Low vegetation (meadows and pastures) is much more suitable for the movement of avalanches, in contrast to the forest cover, which to a certain extent hinders the formation of the avalanche process.
Bare-soil index (BSI)—Using this index, it is possible to identify bare lands and low vegetation whose soil is vulnerable to the occurrence of avalanches. BSI was also obtained based on Sentinel-2 satellite images from 30 July 2021, and is calculated by the formula [85]:
BSI = ( S W I R + R E D ) ( N I R + B L U E ) ( S W I R + R E D ) + ( N I R + B L U E )
where: SWIR is the shortwave infrared spectral band; RED is the red spectral band; NIR is the near-infrared spectral band; and BLUE is the blue spectral channel. High values indicate a higher degree of soil bareness.
Distance from stream—A hydrological factor that finds its application in the analysis of spatial patterns of soil moisture and subsurface runoff dynamics, which affect the types of vegetation present in a landscape and their conditions [67]. If the threatened areas are closer to watercourses, wet-snow avalanches can increase the amount of water in rivers. In the analysis of hydrological conditions, first river flows from 1:25,000 topographic maps were digitized [86], and after that, the distance from stream (DFS) was obtained in GIS by processing DEM and watercourses in SAGA plugins.
Lithology—Although they do not play a crucial role in the formation of avalanches, rock types are used in the analysis in order to mark off the territories that are lithologically most vulnerable to the formation of avalanches [68]. In the absence of precise spatial resolution data, lithology can be used to extract rough surfaces. On the example of the Šar Mountains, 16 geological formations were marked off, most of which are highly susceptible to the spatial distribution of snow avalanches (Figure 3). Rock types were obtained by digitizing content from 1:100,000 geological maps [87].

3.3. Data Reclassification

After obtaining the thematic maps, the values were reclassified. An important factor in value reclassification is the inventory of avalanches, which was partially digitized so that several locations where avalanches appeared in the past were singled out. Relative to spatial distribution, the highest susceptibility classes were assigned. Grade 4 shows the values that are most susceptible to avalanches (Table 7).
Decreasing grades indicate decreasing chances of their occurrence. Snow avalanches occur at higher altitudes, with a more pronounced terrain slope, mainly facing the shady sides (north, northeast, northwest).
The most important climatological property is the presence and level of snow cover (Table 8).
Low air temperatures and more frequent winds increase the chances of avalanches. Vegetation cannot stop an avalanche flow, but can have a significant impact on mitigating its intensity (Table 9).
Bare soil areas and low vegetation are suitable terrains for the creation and movement of this natural hazard. Areas closer to mountain rivers are rated as the most susceptible because the river fall and the curvature of the space around the watercourses are suitable for the movement of most avalanches (Table 10).
Rock types do not play a crucial role in the formation of avalanches, but can affect their movement. Metamorphic and igneous rocks, as well as most sedimentary rocks, have proven to be the parent substrate that increases terrain susceptibility (Table 11).
After reclassification, the sub indicators were multiplied by their weight coefficients (Table 12):
All procedures and approaches used for the purpose of this research are presented in the flow chart given in Figure 4.

4. Results and Discussion

By processing five indicators and 14 sub-indicators, assigning weight coefficients, and then multiplying them, a synthetic map of terrain susceptibility to snow avalanches was obtained (Figure 5).
According to the obtained hazard map, approximately 20% of the total planned territory of the National Park is highly susceptible to the occurrence and movement of avalanches, while 24% of the terrain is moderately susceptible. The high susceptibility of the terrain indicates the presence of natural conditions that are extremely favorable for the formation and movement of snow avalanches. The greatest part of the study area, i.e., 1/2 belongs to low susceptible terrains, while 6% of the territory has a very low chance of avalanche formation (Table 13).
Previous investigations of avalanches on the Šar Mountains refer to the smaller, eastern part of the study area. Using the AVAPI method, the areas that are threatened by avalanches were marked in that part on the surface of 9.1 km2 [12]. The AVAPI method includes five criteria, of which the terrain slope values are eliminatory. Other factors have different coefficients, aspect has the greatest weight, while vegetation has the least importance. The results of both studies point to a highly susceptibility terrain with snow avalanches in the mountainous part of the research area not far from the ski center Brezovica.
The highly susceptible terrains are characterized by specific natural conditions. High altitude (>600 m), pronounced terrain slope (>20°), linear curvature, and low terrain ruggedness are the most critical geomorphological factors for avalanches. Low annual air temperature (0–5.7 °C), high level and retention of snow cover, and terrain exposure to wind are favorable climatic conditions for increasing territory susceptibility. Terrains with sparse vegetation (without forests), bare land, and a short distance from watercourses increase the chances of avalanches, mainly formed on metamorphic and igneous rocks, but the risk is also significant when Mesozoic, Tertiary, and Quaternary sediments are the parent substrate.
The identified settlements that are moderately or highly susceptible to avalanches in a greater or smaller part of their territory include: Leštane, Globočica, Kruševo, Zlipotok, Restelica, Brod, Radeša, Plajnik, Zrze, Kukovce, Brodosavce, Stružje, Nebregošte, facilities on the Prevalac pass and Brezovica ski center. Numerical modeling combined with field research, gathering information on snow conditions and past events in the local environment can provide results and simulation of potential avalanches [88]. To validate the results, it is necessary to map the most susceptible areas and collect the data in the field to confirm the obtained results.
In settlements or in their immediate vicinity where there are chances of avalanche formation, it is necessary to determine and implement a set of measures aimed at preventing and mitigating the consequences for the environment. The protection measures applied in the Alpine countries include artificial avalanche triggering, avalanche zoning, afforestation, and structural measures. A widely used and economically justified method for protecting ski slopes, roads, and railways is the artificial avalanche triggering with explosives aimed at preventing the occurrence of big avalanches. Avalanche hazard mapping and land-use planning are applied throughout many countries. Compared to other mitigation measures, implementing hazard mapping and land-use planning is usually the least costly and most cost-effective method. Afforestation is one of the oldest and most commonly used measures to mitigate avalanches [89]. Forest complexes affect the snow cover structure, and susceptible areas near settlements should be afforested and then monitored, as any deforestation could be detrimental to the ecosystem and the environment. Structural measures include constructing supporting steel structures and stone walls that slow down and prevent avalanches.
Geospatial terrain conditions (slope, aspect, curvature, ruggedness) are easy to process in geographic information systems [90,91,92,93], so geomorphological factors are most often used in this kind of studies. Besides geomorphological, climatological factors (air temperature, snow cover, wind direction and speed) are also important for avalanche susceptibility analysis. Influenced by climate change and sudden air temperature changes, the remnants of avalanches can cause other natural disasters, such as floods. As for the snow cover structure, it is important to investigate the stability of snow layers, the crystallization process, and the liquid water content [94]. Biogeographical factors are reflected primarily in the analysis of vegetation cover, forest cover, and the degree of soil bareness. Degraded areas and areas with sparse vegetation are at higher risk than forest complexes. The proximity of the area to watercourses can be a significant hydrological factor due to similarities in the terrain configuration of avalanches and mountain rivers movement. In lithological terms, the numerous types of rocks represented on the Šar Mountains are a suitable geological basis for the avalanche process. Taking into account the spatial distribution of snow avalanches, physical processes and the need of knowledge for mitigation purposes, three categories can be distinguished in the science of avalanches: avalanche geography, avalanche formation and avalanche dynamics [95]. In this study, the emphasis is on the geography of avalanches, that is, locations where there is a possibility for their formation and movement.
In studies with the same topic that have been done around the world, different methods have been used based on the treatment of a large number of natural conditions. In Turkey, the authors investigated the susceptibility of the terrain to snow avalanches using the AHP method and the analysis of five criteria.
On the example of the province of Van, it was determined that 2% of the territory is very highly susceptible to avalanches [73], while in the Uzungol region, 28.15% of the terrain has a very high susceptibility [63]. In the Western Indian Himalaya (Siachen region) using the AHP method, it was determined that 12.32% of the territory is very highly susceptible to snow avalanches [71]. In the territories of China [1,2] and Iran [66,67], the methods are based on machine learning, while in Slovakia, the authors used the GIS and RAAMS simulation model [5]. For the run-out calculations, the NAKSIN script calls MoT-Voellmy, a simple quasi-3D model developed at Norwegian Geotechnical Institute [96]. Researchers from Switzerland are using a new algorithm based on object-based image analysis (OBIA) [24]. With detailed data on the average depth of the snow cover, it is possible to use shallow water numerical methods to evaluate snow avalanche modeling [30].
In high mountain areas that have significant tourist potential, environmental monitoring through remote sensing and GIS tools can serve as an additional measure to preserve the safety of tourists and infrastructure [97,98,99].

5. Limitations and Future Research Directions

All scientific approaches (even the advanced ones) in the study of snow avalanches, has certain weaknesses and limitations. This study was based on a few applicable methodologies and procedures following the geographical approaches. The main sources are connected with representative data obtained from the adequate databases, as well as geomorphological and geographical studies respectively. The other data used in this research was comprised of regional hydro-meteorological data and historical data (with some historical evidence of avalanches in the Šar Mountains). The leading methodology within this research is the use of AHP (Analytic Hierarchy Process). The given approach in this research enabled us to geospatially assess and analyze avalanche properties in the case study.
The main algorithms (procedures) of the AHP used in this research encompassed: Elevation, Slope, Aspect, Profile curvature; TRI index, TWI index, LS factor; Annual air temperature, NDSI index, WEI index, NDVI index, BSI index, Distance from the stream, and basic Lithology. All of these procedures are associated with the geographical approaches in snow avalanches research. On the other hand, the dynamical and geotechnical analysis are more suitable and precise, but rather highly complex and challenging approaches. In the future studies, the dynamical analysis supported by LIDAR data may provide more respectable results [100]. This pioneer research has one goal, and this goal is to start with the analysis of avalanches and their occurrence on the Šar Mountains. The climate change effects will make these changes more dangerous, thus emphasizing the importance of snow avalanche research as an environmental problem on local, national and regional scales.

6. Conclusions

Due to the numerous snow avalanches that occur in the area of the Šar Mountains in the winter and early spring period, terrain susceptibility to avalanches was investigated using the AHP, GIS, and remote sensing methods. The analysis used five indicators with different weight coefficients (geomorphological, climatic, vegetation, hydrological and lithological), where 14 subindicators were analyzed with different weight coefficients depending on the significance for the avalanche formation process. For the needs of the research, the inventory of avalanches was used to form the classes of natural conditions that most affect territory susceptibility.
The final result of data processing was a synthetic map of benefits, based on which it is concluded that approximately 20% of the Šar Mountains territory is highly susceptible, and 24% is moderately susceptible to snow avalanches. Susceptible settlements requiring protection measures have been singled out, i.e., the process of afforestation should be combined with the construction of protective walls to minimize the chances of hazard. As seen from the practice of the Alpine zone countries, artificial triggering of avalanches will help avoid more significant avalanches on the main roads. In uninhabited places that are moderately and highly susceptible, it is necessary to adopt a measure banning the construction of any buildings to protect the environment and avoid potential aftermaths. The given research can serve as a preliminary step in defining the safety services, risk mitigation protocols, as well as future geospatial forecasting of potential snow avalanches. This can be of interest to respective stakeholders involved in the decision-making and spatial planning over a ski facilities area prone to a mass movement hazard. In this way settlements vulnerable to potential avalanche occurrences may be better adapted for this hazardous threat. In the end, the data from this research can be used in the creation of the snow avalanches database as an integrative part of the cadastre of natural hazards. This database could be useful for better planning activities related to avalanche mitigation within the area of the Šar Mountains National Park.

Author Contributions

Conceptualization, U.D.; methodology, A.V. and C.M.; software, I.N. and U.D.; validation, N.B.Ć.; formal analysis, T.L., M.S. and D.B.; investigation, A.V. and T.L.; resources, C.M., M.S. and U.D.; data curation, A.S. and N.B.Ć.; writing—original draft preparation, U.D. and A.V.; writing—review and editing, T.L. and I.N.; visualization, U.D. and A.S. All authors have read and agreed to the published version of the manuscript.

Funding

This research received no external funding.

Institutional Review Board Statement

Not applicable.

Informed Consent Statement

Not applicable.

Data Availability Statement

To obtain the data for this study, please contact the authors via email.

Acknowledgments

We are grateful to colleague and co-author Aleksandar Valjarević for the invitation to participate in the Special Issue ‘’The Connection between Land, Forest, and Atmosphere and Analysis using the Advanced Techniques’’. The authors are grateful to the anonymous reviewers whose comments and suggestions greatly improved the manuscript. Tin Lukić acknowledges partial support of the H2020 WIDESPREAD-05-2020–Twinning: ExtremeClimTwin under grant agreement No. 952384.

Conflicts of Interest

The authors declare no conflict of interest.

References

  1. Hao, J.; Mind’je, R.; Liu, Y.; Huang, F.; Zhou, H.; Li, L. Characteristics and hazards of different snow avalanche types in a continental snow climate region in the Central Tianshan Mountains. J. Arid Land 2021, 13, 317–331. [Google Scholar] [CrossRef]
  2. Wen, H.; Wu, X.; Liao, X.; Wang, D.; Huang, K.; Wünnemann, B. Application of machine learning methods for snow avalanche susceptibility mapping in the Parlung Tsangpo catchment, southeastern Qinghai-Tibet Plateau. Cold Reg. Sci. Technol. 2022, 198, 103535. [Google Scholar] [CrossRef]
  3. Yariyan, P.; Avand, M.; Abbaspour, A.R.; Karami, M.; Tiefenbacher, P.J. GIS-based spatial modeling of snow avalanches using four novel ensemble models. Sci. Total Environ. 2020, 745, 141008. [Google Scholar] [CrossRef]
  4. Fazzini, M.; Cordeschi, M.; Carabella, C.; Paglia, G.; Esposito, G.; Miccadei, E. Snow Avalanche Assessment in Mass Movement-Prone Areas: Results from Climate Extremization in Relationship with Environmental Risk Reduction in the Prati di Tivo Area (Gran Sasso Massif, Central Italy). Land 2021, 10, 1176. [Google Scholar] [CrossRef]
  5. Košová, V.; Molokáč, M.; Čech, V.; Jesenský, M. Avalanche Hazard Modelling within the Kráľova Hoľa Area in the Low Tatra Mountains in Slovakia. Land 2022, 11, 766. [Google Scholar] [CrossRef]
  6. Sanz-Ramos, M.; Andrade, C.A.; Oller, P.; Furdada, G.; Bladé, E.; Martínez-Gomariz, E. Reconstructing the Snow Avalanche of Coll de Pal 2018 (SE Pyrenees). GeoHazards 2021, 2, 196–211. [Google Scholar] [CrossRef]
  7. Kumar, S.; Srivastava, K.P.; Snehmani; Bhatiya, S. Geospatial probabilistic modelling for release area mapping of snow avalanches. Cold Reg. Sci. Technol. 2019, 165, 102813. [Google Scholar] [CrossRef]
  8. Veitinger, J.; Purves, S.R.; Sovilla, B. Potential slab avalanche release area identification from estimated winter terrain: A multi-scale, fuzzy logic approach. Nat. Hazards Earth Syst. Sci. 2016, 16, 2211–2225. [Google Scholar] [CrossRef] [Green Version]
  9. Yang, J.; Li, C.; Li, L.; Ding, J.; Zhang, R.; Han, T.; Liu, Y. Automatic Detection of Regional Snow Avalanches with Scattering and Interference of C-band SAR Data. Remote Sens. 2020, 12, 2781. [Google Scholar] [CrossRef]
  10. Baggio, T.; Brožová, N.; Bast, A.; Bebi, P.; D’Agostino, V. Novel indices for snow avalanche protection assessment and monitoring of wind-disturbed forests. Ecol. Eng. 2022, 181, 106677. [Google Scholar] [CrossRef]
  11. De Scally, F.A.; Gardner, J.S. Characteristics and mitigation of the snow avalanche hazard in Kaghan Valley, Pakistan Himalaya. Nat. Hazards 1994, 9, 197–213. [Google Scholar] [CrossRef]
  12. Durlević, U.; Novković, I.; Lukić, T.; Valjarević, A.; Samardžić, I.; Krstić, F.; Batoćanin, N.; Mijatov, M.; Ćurić, V. Multihazard susceptibility assessment: A case study – Municipality of Štrpce (Southern Serbia). Open Geosci. 2021, 13, 1414–1431. [Google Scholar] [CrossRef]
  13. Eckerstorfer, M.; Oterhals, D.H.; Müller, K.; Malnes, E.; Grahn, J.; Langeland, S.; Velsand, P. Performance of manual and automatic detection of dry snow avalanches in Sentinel-1 SAR images. Cold Reg. Sci. Technol. 2022, 198, 103549. [Google Scholar] [CrossRef]
  14. Germain, D.; Filion, L.; Hétu, B. Snow avalanche regime and climatic conditions in the Chic-Choc Range, eastern Canada. Clim. Chang. 2009, 92, 141–167. [Google Scholar] [CrossRef]
  15. Hao, J.; Zhang, Z.; Li, L. Timing and identification of potential snow avalanche types: A case study of the central Tianshan Mountains. Landslides 2021, 18, 3845–3856. [Google Scholar] [CrossRef]
  16. Ivanova, K.; Caviezel, A.; Bühler, Y.; Bartelt, P. Numerical modelling of turbulent geophysical flows using a hyperbolic shear shallow water model: Application to powder snow avalanches. Comput. Fluids 2022, 233, 105211. [Google Scholar] [CrossRef]
  17. Jamieson, B.; Stethem, C. Snow Avalanche Hazards and Management in Canada: Challenges and Progress. Nat. Hazards 2002, 26, 35–53. [Google Scholar] [CrossRef]
  18. Kyburz, L.M.; Sovilla, B.; Gaume, J.; Ancey, C. Physics-based estimates of drag coefficients for the impact pressure calculation of dense snow avalanches. Eng. Struct. 2022, 254, 113478. [Google Scholar] [CrossRef]
  19. Liu, Y.; Chen, X.; Qiu, Y.; Hao, J.; Yang, J.; Li, L. Mapping snow avalanche debris by object-based classification in mountainous regions from Sentinel-1 images and causative indices. Catena 2021, 206, 105559. [Google Scholar] [CrossRef]
  20. Meseșan, F.; Gavrilă, I.G.; Pop, O.T. Calculating snow-avalanche return period from tree-ring data. Nat. Hazards 2018, 94, 1081–1098. [Google Scholar] [CrossRef]
  21. Oshiro, K.; Tanioka, Y.; Schweizer, J.; Zafren, K.; Brugger, H.; Paal, P. Prevention of Hypothermia in the Aftermath of Natural Disasters in Areas at Risk of Avalanches, Earthquakes, Tsunamis and Floods. Int. J. Environ. Res. Public Health 2022, 19, 1098. [Google Scholar] [CrossRef] [PubMed]
  22. Singh, D.K.; Mishra, V.D.; Gusain, H.S. Simulation and Analysis of a Snow Avalanche Accident in Lower Western Himalaya, India. J. Indian Soc. Remote Sens. 2020, 48, 1555–1565. [Google Scholar] [CrossRef]
  23. Voiculescu, M. Snow avalanche hazards in the Făgăraş massif (Southern Carpathians): Romanian Carpathians—Management and perspectives. Nat. Hazards 2009, 51, 459–475. [Google Scholar] [CrossRef]
  24. Bühler, Y.; Von Rickenbach, D.; Stoffel, A.; Margreth, S.; Stoffel, L.; Christen, M. Automated snow avalanche release area delineation—Validation of existing algorithms and proposition of a new object-based approach for large-scale hazard indication mapping. Nat. Hazards Earth Syst. Sci. 2018, 18, 3235–3251. [Google Scholar] [CrossRef] [Green Version]
  25. Pistocchi, A.; Notarnicola, C. Data-driven mapping of avalanche release areas: A case study in South Tyrol, Italy. Nat. Hazards 2013, 65, 1313–1330. [Google Scholar] [CrossRef]
  26. Techel, F.; Zweifel, B.; Winkler, K. Analysis of avalanche risk factors in backcountry terrain based on usage frequency and accident data in Switzerland. Nat. Hazards Earth Syst. Sci. 2015, 15, 1985–1997. [Google Scholar] [CrossRef] [Green Version]
  27. Aydın, A.; Bühler, Y.; Christen, M.; Gürer, I. Avalanche situation in Turkey and back-calculation of selected events. Nat. Hazards Earth Syst. Sci. Discuss. 2014, 2, 581–611. Available online: https://nhess.copernicus.org/preprints/2/581/2014/nhessd-2-581-2014.pdf (accessed on 3 March 2022). [CrossRef] [Green Version]
  28. Bair, E.H.; Rittger, K.; Ahmad, J.A.; Chabot, D. Comparison of modeled snow properties in Afghanistan, Pakistan, and Tajikistan. Cryosphere 2020, 14, 331–347. [Google Scholar] [CrossRef] [Green Version]
  29. Caiserman, A.; Sidle, R.C.; Gurung, D.R. Snow Avalanche Frequency Estimation (SAFE): 32 years of remote hazard monitoring in Afghanistan. Cryosphere 2022, 1–26. [Google Scholar] [CrossRef]
  30. Gruber, U.; Bartelt, P. Snow avalanche hazard modelling of large areas using shallow water numerical methods and GIS. Environ. Model. Softw. 2007, 22, 1472–1481. [Google Scholar] [CrossRef]
  31. Novkovic, I.; Markovic, G.B.; Lukic, D.; Dragicevic, S.; Milosevic, M.; Djurdjic, S.; Samardzic, I.; Lezaic, T.; Tadic, M. GIS-Based Forest Fire Susceptibility Zonation with IoT Sensor Network Support, Case Study—Nature Park Golija, Serbia. Sensors 2021, 21, 6520. [Google Scholar] [CrossRef] [PubMed]
  32. Valjarević, A.; Morar, C.; Živković, J.; Niemets, L.; Kićović, D.; Golijanin, J.; Gocić, M.; Bursać, N.M.; Stričević, L.; Žiberna, I.; et al. Long Term Monitoring and Connection between Topography and Cloud Cover Distribution in Serbia. Atmosphere 2021, 12, 964. [Google Scholar] [CrossRef]
  33. Valjarević, A.; Milanović, M.; Valjarević, D.; Basarin, B.; Gribb, W.; Lukić, T. Geographical information systems and remote sensing methods in the estimation of potential dew volume and its utilization in the United Arab Emirates. Arab. J. Geosci. 2021, 14, 1430. [Google Scholar] [CrossRef]
  34. Valjarević, A.; Radovanović, D.; Šoškić, S.; Bačević, N.; Milentijević, N.; Golijanin, J.; Ivanović, M. GIS and geographical analysis of the main harbors in the world. Open Geosci. 2021, 13, 639–650. [Google Scholar] [CrossRef]
  35. Lukić, T.; Micić Ponjiger, T.; Basarin, B.; Sakulski, D.; Gavrilov, M.; Marković, S.; Zorn, M.; Komac, B.; Milanović, M.; Pavić, D.; et al. Application of Angot precipitation index in the assessment of rainfall erosivity: Vojvodina Region case study (North Serbia). Acta Geogr. Slov. 2021, 61, 123–153. [Google Scholar] [CrossRef]
  36. Manojlović, S.; Sibinović, M.; Srejić, T.; Novković, I.; Milošević, V.M.; Gatarić, D.; Carević, I.; Batoćanin, N. Factors Controlling the Change of Soil Erosion Intensity in Mountain Watersheds in Serbia. Front. Environ. Sci. 2022, 10, 888901. [Google Scholar] [CrossRef]
  37. Ćurić, V.; Durlević, U.; Ristić, N.; Novković, I.; Čegar, N. GIS application in analysis of threat of forest fires and landslides in the Svrljiški Timok Basin (Serbia). Bull. Serb. Geogr. Soc. 2022, 102, 107–130. [Google Scholar] [CrossRef]
  38. Durlević, U. Assessment of torrential flood and landslide susceptibility of terrain: Case study—Mlava River Basin (Serbia). Bull. Serb. Geogr. Soc. 2021, 101, 49–75. [Google Scholar] [CrossRef]
  39. Luo, S.; Xiong, J.; Liu, S.; Hu, K.; Cheng, W.; Liu, J.; He, Y.; Sun, H.; Cui, X.; Wang, X. New Insights into Ice Avalanche-Induced Debris Flows in Southeastern Tibet Using SAR Technology. Remote Sens. 2022, 14, 2603. [Google Scholar] [CrossRef]
  40. Langović, M.; Dragićević, S.; Novković, I.; Živković, N.; Tošić, R.; Milojković, B.; Čvorović, Z. Assessment of the soil loss caused by riverbank erosion in Serbia. Bull. Serb. Geogr. Soc. 2021, 101, 31–47. [Google Scholar] [CrossRef]
  41. Morar, C.; Lukić, T.; Valjarević, A.; Niemets, L.; Kostrikov, S.; Sehida, K.; Telebienieva, I.; Kliuchko, L.; Kobylin, P.; Kravchenko, K. Spatiotemporal Analysis of Urban Green Areas Using Change Detection: A Case Study of Kharkiv, Ukraine. Front. Environ. Sci. 2022, 10, 823129. [Google Scholar] [CrossRef]
  42. Potić, I.M.; Ćurčić, N.B.; Radovanović, M.M.; Stanojević, G.B.; Malinović-Milićević, S.B.; Yamashkin, S.A.; Yamashkin, A.A. Estimation of soil erosion dynamics using remote sensing and swat in Kopaonik national park. J. Geogr. Inst. Jovan Cvijic SASA 2021, 71, 231–247. [Google Scholar] [CrossRef]
  43. Saaty, T.L. Relative Measurement and its Generalization in Decision Making: Why Pairwise Comparisons are Central in Mathematics for the Measurement of Intangible Factors. Rev. R. Acad. Cien. Ser. A Mat. 2008, 102, 251–318. [Google Scholar] [CrossRef]
  44. Chabuk, A.; Al-Ansari, N.; Hussain, H.M.; Knutsson, S.; Pusch, R.; Laue, J. Combining GIS Applications and Method of Multi-Criteria Decision-Making (AHP) for Landfill Siting in Al-Hashimiyah Qadhaa, Babylon, Iraq. Sustainability 2017, 9, 1932. [Google Scholar] [CrossRef] [Green Version]
  45. Benítez, J.; Carpitella, S.; Certa, A.; Izquierdo, J. Constrained consistency enforcement in AHP. Appl. Math. Comput. 2020, 380, 125273. [Google Scholar] [CrossRef]
  46. Liang, J.; Yang, J. Application of the AHP method on the optimization with undesirable priorities. Eng. Comput. 2021. [Google Scholar] [CrossRef]
  47. Maceika, A.; Bugajev, A.; Šostak, O.R.; Vilutienė, T. Decision Tree and AHP Methods Application for Projects Assessment: A Case Study. Sustainability 2021, 13, 5502. [Google Scholar] [CrossRef]
  48. Pine, C.J. Natural Hazard Analysis, Reducing the Impact of Disasters; Taylor & Francis: Abingdon, UK, 2009. [Google Scholar]
  49. Dinić, J. Commune Štrpce, Sirinićka Župa. Trait of Natural Environment; Geographical Institute ‘‘Jovan Cvijić’’ SASA: Belgrade, Serbia, 1990. [Google Scholar]
  50. Ali, F.; Bennui, A.; Chowdhury, S.; Techato, K. Suitable Site Selection for Solar-Based Green Hydrogen in Southern Thailand Using GIS-MCDM Approach. Sustainability 2022, 14, 6597. [Google Scholar] [CrossRef]
  51. Cai, S.; Fan, J.; Yang, W. Flooding Risk Assessment and Analysis Based on GIS and the TFN-AHP Method: A Case Study of Chongqing, China. Atmosphere 2021, 12, 623. [Google Scholar] [CrossRef]
  52. Milevski, I.; Dragićević, S.; Zorn, M. Statistical and expert-based landslide susceptibility modeling on a national scale applied to North Macedonia. Open Geosci. 2019, 11, 750–764. [Google Scholar] [CrossRef]
  53. Kamaruzzaman, S.N.; Lou, E.C.W.; Wong, P.F.; Wood, R.; Che-Ani, A.I. Developing weighting system for refurbishment building assessment scheme in Malaysia through analytic hierarchy process (AHP) approach. Energy Policy 2018, 112, 280–290. [Google Scholar] [CrossRef]
  54. Institute of Nature Conservation of Serbia. Protected Areas, National Park Šar Planina. Available online: https://www.zzps.rs/wp/np-sar-planina/?lang=en (accessed on 23 February 2022).
  55. Menković, L.; Milivojević, M. Glacial morphology of the Šara Mountains. Bull. Serb. Geogr. Soc. 2021, 101, 1–29. [Google Scholar] [CrossRef]
  56. Saaty, T.L. Analytic Hierarchy Process; McGrawHill: New York, NY, USA, 1980. [Google Scholar]
  57. Saaty, T.L. How to make a decision: The analytic hierarchy process. Eur. J. Oper. Res. 1990, 48, 9–26. [Google Scholar] [CrossRef]
  58. Das, S. Comparison among influencing factor, frequency ratio, and analytical hierarchy process techniques for groundwater potential zonation in Vaitarna basin, Maharashtra, India. Groundw. Sustain. Dev. 2019, 8, 617–629. [Google Scholar] [CrossRef]
  59. Lentswe, G.B.; Molwalefhe, L. Delineation of potential groundwater recharge zones using analytic hierarchy process-guided GIS in the semi-arid Motloutse watershed, eastern Botswana. J. Hydrol. Reg. Stud. 2020, 28, 100674. [Google Scholar] [CrossRef]
  60. Ahmed, A.; Ranasinghe-Arachchilage, C.; Alrajhi, A.; Hewa, G. Comparison of Multicriteria Decision-Making Techniques for Groundwater Recharge Potential Zonation: Case Study of the Willochra Basin, South Australia. Water 2021, 13, 525. [Google Scholar] [CrossRef]
  61. Ghosh, B. Spatial mapping of groundwater potential using data-driven evidential belief function, knowledge-based analytic hierarchy process and an ensemble approach. Environ. Earth Sci. 2021, 80, 625. [Google Scholar] [CrossRef]
  62. Tabarestani, E.S.; Afzalimehr, H. Artificial neural network and multi-criteria decision-making models for flood simulation in GIS: Mazandaran Province, Iran. Stoch. Environ. Res. Risk Assess. 2021, 35, 2439–2457. [Google Scholar] [CrossRef]
  63. Varol, N. Avalanche susceptibility mapping with the use of frequency ratio, fuzzy and classical analytical hierarchy process for Uzungol area, Turkey. Cold Reg. Sci. Technol. 2022, 194, 103439. [Google Scholar] [CrossRef]
  64. QGIS Development Team. QGIS Geographic Information System v3.8.3 with GRASS 7.6.1. Open Source Geospatial Foundation Project. Available online: http://qgis.osgeo.org (accessed on 18 June 2021).
  65. Teknomo, K. Analytic hierarchy process (AHP) tutorial. Revoledu 2006, 1–20. Available online: https://docplayer.net/14799080-Analytic-hierarchy-process-ahp-tutorial.html (accessed on 4 May 2022).
  66. Choubin, B.; Borji, M.; Mosavi, A.; Hosseini, S.F.; Singh, P.V.; Shamshirband, S. Snow avalanche hazard prediction using machine learning methods. J. Hydrol. 2019, 577, 123929. [Google Scholar] [CrossRef]
  67. Rahmati, O.; Ghorbanzadeh, O.; Teimurian, T.; Mohammadi, F.; Tiefenbacher, J.P.; Falah, F.; Pirasteh, S.; Ngo, P.-T.T.; Bui, D.T. Spatial Modeling of Snow Avalanche Using Machine Learning Models and Geo-Environmental Factors: Comparison of Effectiveness in Two Mountain Regions. Remote Sens. 2019, 11, 2995. [Google Scholar] [CrossRef] [Green Version]
  68. Akay, H. Spatial modeling of snow avalanche susceptibility using hybrid and ensemble machine learning techniques. Catena 2021, 206, 105524. [Google Scholar] [CrossRef]
  69. Naaim, M.; Naaim-Bouvet, F.; Faug, T.; Bouchet, A. Dense snow avalanche modeling: Flow, erosion, deposition and obstacle effects. Cold Reg. Sci. Technol. 2004, 39, 193–204. [Google Scholar] [CrossRef]
  70. Copernicus—Land Monitoring Service. EU-DEM v1.1. Available online: https://land.copernicus.eu/imagery-in-situ/eu-dem/eu-dem-v1.1?tab=download (accessed on 15 January 2022).
  71. Kumar, S.; Srivastava, P.K.; Snehmani. Geospatial modelling and mapping of snow avalanche susceptibility. J. Indian Soc. Remote Sens. 2018, 46, 109–119. [Google Scholar] [CrossRef]
  72. Singh, D.K.; Gusain, H.S.; Mishra, V.; Gupta, N.; Das, R.K. Automated mapping of snow/ice surface temperature using Landsat-8 data in Beas River basin, India, and validation with wireless sensor network data. Arab. J. Geosci. 2018, 11, 136. [Google Scholar] [CrossRef]
  73. Nasery, S.; Kalkan, K. Snow avalanche risk mapping using GIS-based multi-criteria decision analysis: The case of Van, Turkey. Arab. J. Geosci. 2021, 14, 782. [Google Scholar] [CrossRef]
  74. Stojilković, B. Towards Transferable Use of Terrain Ruggedness Component in the Geodiversity Index. Resources 2022, 11, 22. [Google Scholar] [CrossRef]
  75. Riley, S.J.; DeGloria, S.D.; Elliot, R. Index that quantifies topographic heterogeneity. Intermt. J. Sci. 1999, 5, 23–27. [Google Scholar]
  76. Kopecký, M.; Macek, M.; Wild, J. Topographic Wetness Index calculation guidelines based on measured soil moisture and plant species composition. Sci. Total Environ. 2021, 757, 143785. [Google Scholar] [CrossRef] [PubMed]
  77. Kumar, S.; Snehmani; Srivastava, P.K.; Gore, A.; Singh, M.K. Fuzzy–frequency ratio model for avalanche susceptibility mapping. Int. J. Digit. Earth 2016, 9, 1168–1184. [Google Scholar] [CrossRef]
  78. Panagos, P.; Borrelli, P.; Meusburger, K. A New European Slope Length and Steepness Factor (LS-Factor) for Modeling Soil Erosion by Water. Geosciences 2015, 5, 117–126. [Google Scholar] [CrossRef] [Green Version]
  79. Živković, N. Average Annual and Seasonal River Runoff in Serbia (In Serbian); University of Belgrade: Belgrade, Serbia, 2009. [Google Scholar]
  80. Riggs, G.; Hall, D.; Salomonson, V. A Snow Index for the Landsat Thematic Mapper and Moderate Resolution Imaging Spectrometer. In Proceedings of the IGARSS’ 94-1994 IEEE International Geoscience and Remote Sensing Symposium, Pasadena, CA, USA, 8–12 August 1994; Volume 4, pp. 1942–1944. [Google Scholar]
  81. Lombardo, L.; Bachofer, F.; Cama, M.; Märker, M.; Rotigliano, E. Exploiting Maximum Entropy method and ASTER data for assessing debris flow and debris slide susceptibility for the Giampilieri catchment (north-eastern Sicily, Italy). Earth Surf. Process. Landf. 2016, 41, 1776–1789. [Google Scholar] [CrossRef] [Green Version]
  82. Rouse, W.J.; Haas, H.R.; Schell, A.J.; Deering, W.D. Monitoring vegetation systems in the Great Plains with ERTS. In Proceedings of the 3rd Earth Resources Technology Satellite-1 Symposium, Washington, DC, USA, 1 January 1974. [Google Scholar]
  83. Tucker, C.J. Red and photographic infrared linear combinations for monitoring vegetation. Remote Sens. Environ. 1979, 8, 127–150. [Google Scholar] [CrossRef] [Green Version]
  84. Zhan, Y.; Fan, J.; Meng, T.; Li, Z.; Yan, Y.; Huang, J.; Chen, D.; Sui, L. Analysis on vegetation cover changes and the driving factors in the midlower reaches of Hanjiang River Basin between 2001 and 2015. Open Geosci. 2021, 13, 675–689. [Google Scholar] [CrossRef]
  85. Diek, S.; Fornallaz, F.; Schaepman, M.; De Jong, R. Barest pixel composite for agricultural areas using landsat time series. Remote Sens. 2017, 9, 1245. [Google Scholar] [CrossRef] [Green Version]
  86. Military Geographical Institute. Map of JNA, Scale 1/25.000. Available online: https://www.topografskakarta.com/ (accessed on 12 August 2021).
  87. Geoliss. Basic Geological Map of Former Yugoslavia. Available online: https://geoliss.mre.gov.rs/OGK/RasterSrbija/ (accessed on 5 February 2022).
  88. Jaedicke, C.; Syre, E.; Sverdrup-Thygeson, K. GIS-aided avalanche warning in Norway. Comput. Geosci. 2014, 66, 31–39. [Google Scholar] [CrossRef]
  89. Brožová, N.; Fischer, J.-T.; Bühler, Y.; Bartelt, P.; Bebi, P. Determining forest parameters for avalanche simulation using remote sensing data. Cold. Reg. Sci. Technol. 2020, 172, 102976. [Google Scholar] [CrossRef]
  90. Cía, C.J.; Andrés, A.J.; Montañés Magallón, A. A proposal for avalanche susceptibility mapping in the Pyrenees using GIS: The Formigal-Peyreget area (Sheet 145-I; scale 1:25.000). J. Maps 2014, 10, 203–210. [Google Scholar] [CrossRef] [Green Version]
  91. Lato, J.M.; Frauenfelder, R.; Bühler, Y. Automated detection of snow avalanche deposits: Segmentation and classification of optical remote sensing imagery. Nat. Hazards Earth Syst. Sci. 2012, 12, 2893–2906. [Google Scholar] [CrossRef] [Green Version]
  92. Munteanu, A.; Nedelea, A.; Comanescu, L. The dynamics of the snow avalanche affected areas in Piatra Mica mountains (Romania). Comptes Rendus Geosci. 2011, 343, 691–700. [Google Scholar] [CrossRef]
  93. Bühler, Y.; Kumar, S.; Veitinger, J.; Christen, M.; Stoffel, A.; Snehmani. Automated identification of potential snow avalanche release areas based on digital elevation models. Nat. Hazards Earth Syst. Sci. 2013, 13, 1321–1335. [Google Scholar] [CrossRef]
  94. Fischer, J.-T.; Kofler, A.; Huber, A.; Fellin, W.; Mergili, M.; Oberguggenberger, M. Bayesian Inference in Snow Avalanche Simulation with r.avaflow. Geosciences 2020, 10, 191. [Google Scholar] [CrossRef]
  95. Nishimura, K.; Barpi, F.; Issler, D. Perspectives on Snow Avalanche Dynamics Research. Geosciences 2021, 11, 57. [Google Scholar] [CrossRef]
  96. Issler, D.; Gisnås, K.; Domaas, U. Approaches to Including Climate and Forest Effects in Avalanche Hazard Indication Maps in Norway; NGI Technical Note Norwegian Geotechnical Institute: Oslo, Norway, 2020. 20150457-10-TN. Available online: https://www.nve.no/media/10589/20150457-10-tn.pdf (accessed on 12 August 2021).
  97. Ćurčić, N.B.; Milinčić, V.U.; Stranjančević, A.; Milinčić, A.M. Can winter tourism be truly sustainable in natural protected areas? J. Geogr. Inst. Jovan Cvijic SASA 2019, 69, 241–252. [Google Scholar] [CrossRef]
  98. Morar, C.; Lukić, T.; Basarin, B.; Valjarević, A.; Vujičić, M.D.; Niemets, L.; Telebienieva, I.; Boros, L.; Nagy, G. Shaping Sustainable Urban Environments by addressing the Hydrological Factors in the Landslide Occurrence: Ciuperca Hill (Oradea, Romania). Health is Int. J. Environ. Res. 2021, 18, 5022. [Google Scholar] [CrossRef]
  99. Stankov, U.; Vasiljević, A.Ð.; Jovanović, V.; Kranjac, M.; Vujičić, M.D.; Morar, C.; Bucur, L. Shared Aerial Drone Videos—Prospects and Problems for Volunteered Geographic Information Research. Open Geosci. 2019, 11, 462–470. [Google Scholar] [CrossRef]
  100. Eckerstorfer, M.; Bühler, Y.; Frauenfelder, R.; Malnes, E. Remote sensing of snow avalanches: Recent advances, potential, and limitations. Cold Reg. Sci. Technol. 2016, 121, 126–140. [Google Scholar] [CrossRef]
Figure 1. Geographical position of the Šar Mountains.
Atmosphere 13 01229 g001
Figure 2. Ski center Brezovica on the Šar Mountains (photo by Jovanović, S., 2022).
Atmosphere 13 01229 g002
Figure 3. Suitability maps of the Šar Mountains—main physical characteristics. (a) Elevation; (b) slope; (c) aspect; (d) profile curvature; (e) TRI; (f) TWI; (g) LS factor; (h) Air temperature; (i) NDSI; (j) WEI; (k) NDVI; (l) BSI; (m) distance from stream; and (n) lithology.
Atmosphere 13 01229 g003
Figure 4. Flow chart with all the procedures and methods used in this research.
Atmosphere 13 01229 g004
Figure 5. Snow avalanche hazard map.
Atmosphere 13 01229 g005
Table 1. Random consistency index (RI) values [56].
1234567
0.580.901.121.241.32
Table 2. Hierarchy of natural conditions by importance.
FactorsGCVHLCoefficient
G123450.418
C0.512340.263
V0.3330.51230.160
H0.250.3330.5120.098
L0.20.250.3330.510.061
Note: G—geomorphological; C—climatic; V—vegetation; H—hydrological; L—lithological.
Table 3. Authors of articles and criteria used.
Authors/CriteriaESACR (TRI)TWILSVTWEIDFSL
Pistocchi and Notarnicola [25] +++ + +
Bühler et al. [24] ++++
Kumar et al. [7]++++ +
Choubin et al. [66]++++ + ++ ++
Rahmati el al. [67]++++++++ +++
Yariyan et al. [3]++++++ ++ ++
Akay [68]+++++ ++ + +
Varol [63]++++ +
Note: E—elevation, S—terrain slope, A—aspect, C—curvature, R (TRI)—roughness (terrain ruggedness index), TWI—topographic wetness index, LS—length-slope, V—vegetation, T—air temperature, WEI—wind exposition index, DFS—distance from stream, L—lithology.
Table 4. Matrix of geomorphological subindicators.
CriteriaSlopeAspectPCElevationTRITWILSCoefficient
Slope11.522.533.540.280
Aspect0.66711.522.533.50.217
PC0.50.66711.522.530.164
Elevation0.40.50.66711.522.50.123
TRI0.3330.40.50.66711.520.092
TWI0.2860.3330.40.50.66711.50.070
LS 0.250.2860.3330.40.50.66710.054
Table 5. Matrix of climatological subindicators.
CriteriaNDSIWEIAir TemperatureCoefficient
NDSI1230.540
WEI0.5120.297
Air temperature0.3330.510.163
Table 6. Matrix of vegetation sub indicators.
CriteriaNDVIBSICoefficient
NDVI11.50.600
BSI0.66710.400
Table 7. Assessment of geomorphological conditions.
CriteriaParameterGradeGradePercent (%)
Elevation (m)384–600134.333.54
600–12002301.5131.10
1200–16003291.6130.08
>16004342.1535.29
Slope (°)0–5 158.776.06
5–10 297.4510.05
10–20 3427.5844.10
>204385.8039.79
AspectS190.419.32
SW, SE2180.3218.60
W, E3231.4623.87
NW, NE, N4467.4148.21
Profile curvatureConvex375.267.76
Linear4827.8785.38
Concave366.476.86
Terrain ruggedness index0–2.5192.569.55
2.5–4.52161.8916.70
4.5–6.5 & >17.53263.6627.19
6.5–17.54451.4846.56
Topographic wetness index2–84872.5589.99
8–10362.386.43
10–12228.142.90
>1216.530.67
Length-slope factor0–4 & >501250.8625.87
4–6 & 35–502242.1924.98
6–8 & 25–353221.7922.87
8–254254.7626.27
Table 8. Assessment of climatic conditions.
CriteriaParameterGradeArea (km2)Percent (%)
Air temperature (°C)0–5.74344.3835.52
5.7–83340.2935.10
8–9.52188.8319.47
>9.5196.109.91
Normalized difference snow index−0.52–01542.2455.99
0–0.25293.569.66
0.25–0.6368.827.11
>0.64263.8027.24
Wind exposition index0.77–0.85 & >1.27134.743.58
0.85–0.9 & 1.2–1.27272.297.46
0.9–0.93 & 1.17–1.2374.667.70
0.93–1.174787.9181.26
Table 9. Assessment of vegetation conditions.
CriteriaValuesGradeArea (km2)Percent (%)
Normalized difference vegetation index−0.02–0.754588.8960.78
0.75–0.923379.9339.22
Bare-soil index−2.99–−0.953 354.5936.6
−0.95–0.784614.2563.4
Table 10. Assessment of hydrological conditions.
CriteriaParameter (m)GradeArea (km2)Percent (%)
Distance from stream (m)0–2004486.3552.07
200–6003381.5840.85
600–1000254.105.79
>1000112.001.29
Table 11. Assessment of lithological conditions.
Rock typesGradeArea (km2)Percent (%)
Metamorphic rocks4466.5748.12
Igneous rocks461.056.30
Mesozoic carbonate sediments4118.2412.19
Deluvium326.042.69
Moraine deposits450.125.17
Fluvio-glacial sediments430.143.11
Scree31.770.18
Alluvial sediments216.061.66
Diabase-chert formation4135.6213.99
Mesozoic clastic sediment41.800.19
Proluvium330.433.14
Thick rock debris caused by rock weathering10.860.09
Tertiary clastic sediments41.940.20
Flysch40.540.06
Ultramafic425.412.62
Pleistocene lacustrine sediments43.010.31
Table 12. Calculation of weight coefficients.
FactorCriteria and Mathematical Procedure
Geomorphological (GF)(0.280 · S) + (0.217 · A) + (0.164 · PC) + (0.123 · E) + (0.092 · TRI) + (0.070 · TWI) + (0.054 · LS)
Climatic (CF)(0.540 · NDSI) + (0.297 · WEI) + (0.163 · T)
Vegetation (VF)(0.600 · NDVI) + (0.400 · BSI)
Hydrological (HF)1
Lithological (LF)1
Final AHP approach(0.418 · GF) + (0.263 · CF) + (0.160 · VF) + (0.098 · HF) + (0.061 · LF)
Table 13. Susceptibility of the terrain to snow avalanches.
SusceptibilityArea (km2)Percent (%)
Very low57.036
Low481.1250
Medium235.2324
High194.4120
Publisher’s Note: MDPI stays neutral with regard to jurisdictional claims in published maps and institutional affiliations.

