Article

Study on Volatile Organic Compound (VOC) Emission Control and Reduction Potential in the Pesticide Industry in China

1
Nanjing Institute of Environmental Science, Ministry of Ecology and Environment of the People’s Republic of China, Nanjing 210042, China
2
Appraisal Center for Environment and Engineering, Ministry of Ecology and Environment of the People’s Republic of China, Beijing 100012, China
*
Authors to whom correspondence should be addressed.
Submission received: 28 June 2022 / Revised: 27 July 2022 / Accepted: 29 July 2022 / Published: 5 August 2022

Abstract

:
The pesticide industry is one of the primary industries with large and complex VOC emissions. The present study examined the emission characteristics and whole-process control of VOCs in the pesticide industry in China by reviewing pollutant discharge permits, questionnaires, and site investigations. After evaluating the effectiveness of current treatment technologies, the potential of VOC emission reduction in China was analyzed. The results indicate that there are 41 key VOC substances in the pesticide industry that should be given considerable attention. Among treatment facilities, incineration was found to be the most efficient technology, with a removal rate of 53–98% and coverage rate of 23.3%. Multistage absorption–adsorption is a universal technology that had a removal rate of 35–95% and coverage rate of 64.14%. Multistage absorption was used most frequently, with a coverage rate of 71.99%, but its removal rate was between 16 and 85%. Pesticide factories were divided into three levels according to their pollution control capability; the comprehensive removal rates of benchmark, moderate, and poor factories were 81%, 46%, and 8%, respectively, and the emission reduction ratios for high, moderate, and low targets were 41.55%, 32.12%, and 24.32% with corresponding emission reduction costs of $0.653, $0.505, and $0.038 billion/year. The results and prospects from this study will provide support for policy development in industrial VOC emission control in China during the “14th Five-Year Plan” period.

1. Introduction

The efforts to mitigate and control air pollution during the 13th Five-Year Plan period in China have achieved remarkable results, as air quality has significantly improved [1]. In 2020, the proportion of days with good air quality nationwide was 87%, which is an increase of 5.8% from 2015 [2]. However, the concentration of fine particles (PM2.5) remains high and the concentration of ozone (O3) is slowly increasing, which are the most important factors affecting air quality [3,4,5]. Volatile organic compounds (VOCs) are the key precursors for the formation of ground-level O3 and atmospheric PM2.5 [6,7]. This implies that the abatement of VOC emissions should be one of the priorities in improving China’s air quality.
A global VOC emission inventory concluded that the organic chemical industry was one of the main sources of emissions [8]. Moreover, industrial emissions are the main source of anthropogenic VOCs in the atmosphere in China [9,10,11]. Many studies have confirmed that solvents dominate among industrial VOCs [12,13], and a large number of solvents are applied during the production of pesticides [14,15]. The pesticide production industry contributes significantly to VOC emissions through the organic chemical industry in China, which is due to to the fact that China is both the largest producer and largest consumer of pesticides worldwide [16]. The chemical synthesis process within the pesticide industry is extremely complex, as large quantities of many organic and inorganic raw materials, organic solvents, and catalysts are used to produce organic products, intermediates, and other substances. There are various volatile and highly toxic substances involved in pesticide manufacturing, including aromatic hydrocarbons, esters, ethers, ketones, and aldehydes, which can cause a plethora of health problems [17,18,19,20].
Recently, a number of studies have focused on establishing VOC emission inventories to quantify and characterize pollutant emissions at national, regional, and city scales [21,22,23,24,25]. In 2021, China issued a notice of accelerating the resolution of the current prominent problems regarding the treatment of VOCs, which regulated that all regions should focus on key VOC emission industries. The emissions of the pesticide factories in China need to comply with the “Emission standard of air pollutants for pesticide industry” (GB 39727-2020) [26]. However, there is still a lack of analysis on the emission characteristics and whole-process control of the key industries in China, such as the pesticide industry. No reports have studied the reduction potential of the pesticide industry in China during the 14th Five-Year period.
The main objectives of this study were (1) to identify the characteristics of VOC emissions and the status of management and control in the pesticide industry in China, (2) to evaluate the effectiveness of current treatment technologies, and (3) to analyze the potential of VOC emission reduction in China. The results and implications from this study will provide support for VOC management for the prevention and control of ozone pollution in China during the “14th Five-Year Plan” period, which demands that new progress in ecological civilization construction be achieved.

2. Materials and Methods

2.1. Study Objects

The number of pesticide manufacturing factories in China is approximately 1500~1700, of which approximately 400~500 are original pesticide manufacturers. At present, pesticide factories are mainly distributed among the four provinces of Jiangsu, Shandong, Henan, and Hebei in the central and eastern regions of China, shown in Figure S1. To ensure the representativeness of the study objects, the selected pesticide production factories covered different production types (chemical original pesticides, biological original pesticides, and pesticide formulations) and regions.

2.2. Data Collection

The data on VOC treatment facilities in pesticide production factories were obtained from pollutant discharge permits for 385 factories, questionnaires and information lists for 48 factories, and site investigations of 16 factories. The basic factory information collected included engineering and construction technical data, daily operation technical data, investment costs, operation costs, and self-monitoring VOC emission data.
When entering a factory, a VOC portable detector, anemometer, and other equipment were used to determine the VOC concentration and wind speed at production units, storage tanks, confined spaces, wastewater treatment plants, and other locations to find weak points in the control of VOCs in pesticide production factories. If a factory lacked environmental monitoring data, a supplementary monitoring plan was developed to obtain the import and export concentrations of the VOC treatment facilities, employing the determination method in the standard entitled “Stationary source emission―Determination of total hydrocarbons, methane and nonmethane hydrocarbons―Gas chromatography” (HJ 38-2017) [27].

2.3. Methodology

2.3.1. Collection Rate of Exhaust Gas

The key steps associated with fugitive emissions were solid–liquid separation and feeding/discharging. Due to the suction effect of the collection system, the air enters from the tuyere from all directions and converges to the external receiving hood. The external receiving hood sucks in the airflow and the harmful gas at the same time. The collection rate of the exhaust-gas collection system is calculated by the formula as follows [28]:
α = Q × C q m × 100 % .  
where α represents the collection rate of exhaust gas, Q represents the volume of the air collecting hood (m3/s), C represents the average concentration of VOCs at the mouth of the hood (kg/m3), and q m . represents surface volatilization rate of VOCs (kg/s).

2.3.2. Facility Removal Rate

There are many types of terminal VOC treatment technologies with different scopes of application and treatment efficiencies. For factories that had a sampling port for exhaust gas before treatment, samples before and after treatment were collected at the same time, and the facility removal rate was calculated according to the quantitative total nonmethane hydrocarbon concentration. The calculation formula is as follows [29]:
β = Q 1 × C 1 Q 2 × C 2 Q 1 × C 1 × 100 %
where β represents the facility removal rate, Q 1 . represents the volume of the inlet exhaust gas (m3/h), C 1 represents the concentration of the inlet exhaust gas (kg/m3), Q 2 represents the volume of the outlet exhaust gas (m3/h), and C 2 . represents the concentration of the outlet exhaust gas (kg/m3).

2.3.3. Facility Commissioning Rate

For factories with online monitoring or central control system facilities, the commissioning rate of the pollution control facilities were verified through online monitoring and central control system data if possible. For treatment facilities equipped with independent electricity meters, the commissioning rate was calculated by the following formula:
γ = P T   ×   W × 100 % .  
where γ represents the facility commissioning rate, which is the ratio of the actual value to the design reference value under the same reference (power or dosage of agent); P represents the power consumption of the management facilities (MKW/a); T represents the facility operation time (h/a); and W represents the device rated power (KW).

2.3.4. Comprehensive Facility Removal Rate

The comprehensive facility removal rate was calculated by the following formula:
η = α   ×   β   ×   γ .
where η represents the comprehensive facility removal rate, α represents the collection rate of exhaust gas, β represents the facility removal rate, and γ represents the facility commissioning rate.

2.4. Design Scenario

According to the different pollution-control capabilities of pesticide manufacturing factories, the grading standards are determined by the aspects of equipment level, collection method of exhaust gas, treatment facilities, and daily management. Factories were divided into three levels, including benchmark factories (referred to as “benchmark”), medium governance level factories (referred to as “moderate”), and factories with poor governance (referred to as “poor”), which are used to reasonably estimate the exhaust-gas collection rate, facility removal rate, and facility commissioning rate of factories in different categories.
Based on the differences in the overall equipment levels of regional pesticide factories, the proportions of benchmark, moderate, and poor factories were 15%, 50%, and 35%, respectively, in the provinces of Jiangsu and Zhejiang. The proportions of benchmark, moderate, and poor factories were 10%, 40%, and 50%, respectively, in the Shandong province. In other provinces that were hypothesid to be similar to one another, benchmark factories were not identified, and the proportions of moderate and poor factories were 30% and 70%, respectively. Therefore, the overall proportions of benchmark, moderate, and poor factories at the national level were 9.2%, 41.3%, and 49.5%, respectively. According to the “14th Five-Year Plan” VOC emission reduction requirements and the actual situation of the pesticide industry, the number and scale of pesticide factories in China will remain unchanged, and the emission reduction of VOCs will be achieved through self-improvement. Three different target levels were set as shown in Table 1.
The exhaust gas collection rate α, facility commissioning rate β, and facility removal rate γ of benchmark, moderate, and poor factories were calculated to obtain the corresponding comprehensive removal rate η. Based on the proportion of benchmark, moderate, and poor factories under different targets, the VOC emissions under each target were calculated, and the difference between the current VOC emissions and the VOC emissions under each target was considered the emission reduction.
E R e d u c t i o n = E c u r r e n t E p r o d u c e ( a b e n c h m a r k 1 η b e n c h m a r k + a m o d e r a t e 1 η m o d e r a t e + a p o o r 1 η p o o r .  
where E c u r r e n t represents the current VOC emissions, E p r o d u c e represents the VOC production, η b e n c h m a r k , η m o d e r a t e , and η p o o r represent the comprehensive removal rates of benchmark, moderate, and poor factories, and a b e n c h m a r k , a m o d e r a t e , a p o o r represent the proportions of benchmark, moderate, and poor factories under different targets.

3. Results and Discussion

3.1. Characteristics of VOC Pollution in the Pesticide Manufacturing Industry

Due to the use of inorganic substances, the transformation of solid products, and the use of combustion treatment facilities, pesticide waste gas is generally a mixture of inorganic and organic pollutants. Therefore, a combined process is generally used for the actual treatment of organic waste gas, and inorganic pollutants are firstly treated to reduce the impact of organic waste gas treatment facilities.
Due to the characteristics of pesticide industry processes, the reuse value of VOC organic waste gas is high. First, waste gas is condensed and recovered in the production workshop, and then it enters the terminal treatment facilities in the factory, clearly demonstrating a two-stage characteristic. Additionally, exhaust gas emissions in the pesticide industry are synchronized with production, which has intermittent characteristics, so there are occasional cases where high-concentration exhaust gas exceeds the standard during the VOC treatment process. The process flow diagram of the pesticide factory is shown in Figure 1. The characteristics of VOC emissions in the pesticide industry are summarized in Table 2.
The summarized discharge concentrations in Table 2 represent the values after collection and treatment. The general collection methods in the pesticide industry are relatively extensive at present, with an average collection rate of 50–60%. However, discharges at many link points cannot be effectively collected, as more than 90% use cold upper and side suction hoods, approximately 80% use direct connections between the equipment and outlet, approximately 40% use airtight collection in workshops or closed rooms, approximately 60% are collected in semi-airtight hoods or fume hoods, and approximately 30% are collected in hot upper suction hoods, leading to the characteristics of large air volume and low concentration of organic waste gas.

3.2. List of Key VOC Substances in Pesticide Manufacturing Industry

The list of key VOC substances in the pesticide manufacturing industry was based mainly on the characteristics of industrial production and discharge, solvent use, current control standards [26], maximum incremental reactivity (MIR) value of substances, health risk, and so on [30,31,32,33].
Organic solvents used in pesticide manufacturing are one of the main VOC substances emitted. The characteristic pollutants that are routinely monitored by factories are benzene, toluene, xylene, methanol, formaldehyde, chlorobenzene, phenols, acetone, acetonitrile, ethyl acrylate, etc. According to the use frequency of more than 40 kinds of pesticides, the top seven organic solvents are toluene, methanol, xylene, ethanol, dichloroethane, benzene, and acetonitrile. The VOCs regulated by current standards mainly include phosgene, acrylonitrile, benzene, benzene series compounds, formaldehyde, phenols, chlorobenzenes, and methanol. The key VOC substances selected after careful screening are shown in Table 3.

3.3. VOC Treatment Technologies in Pesticide Manufacturing Industry

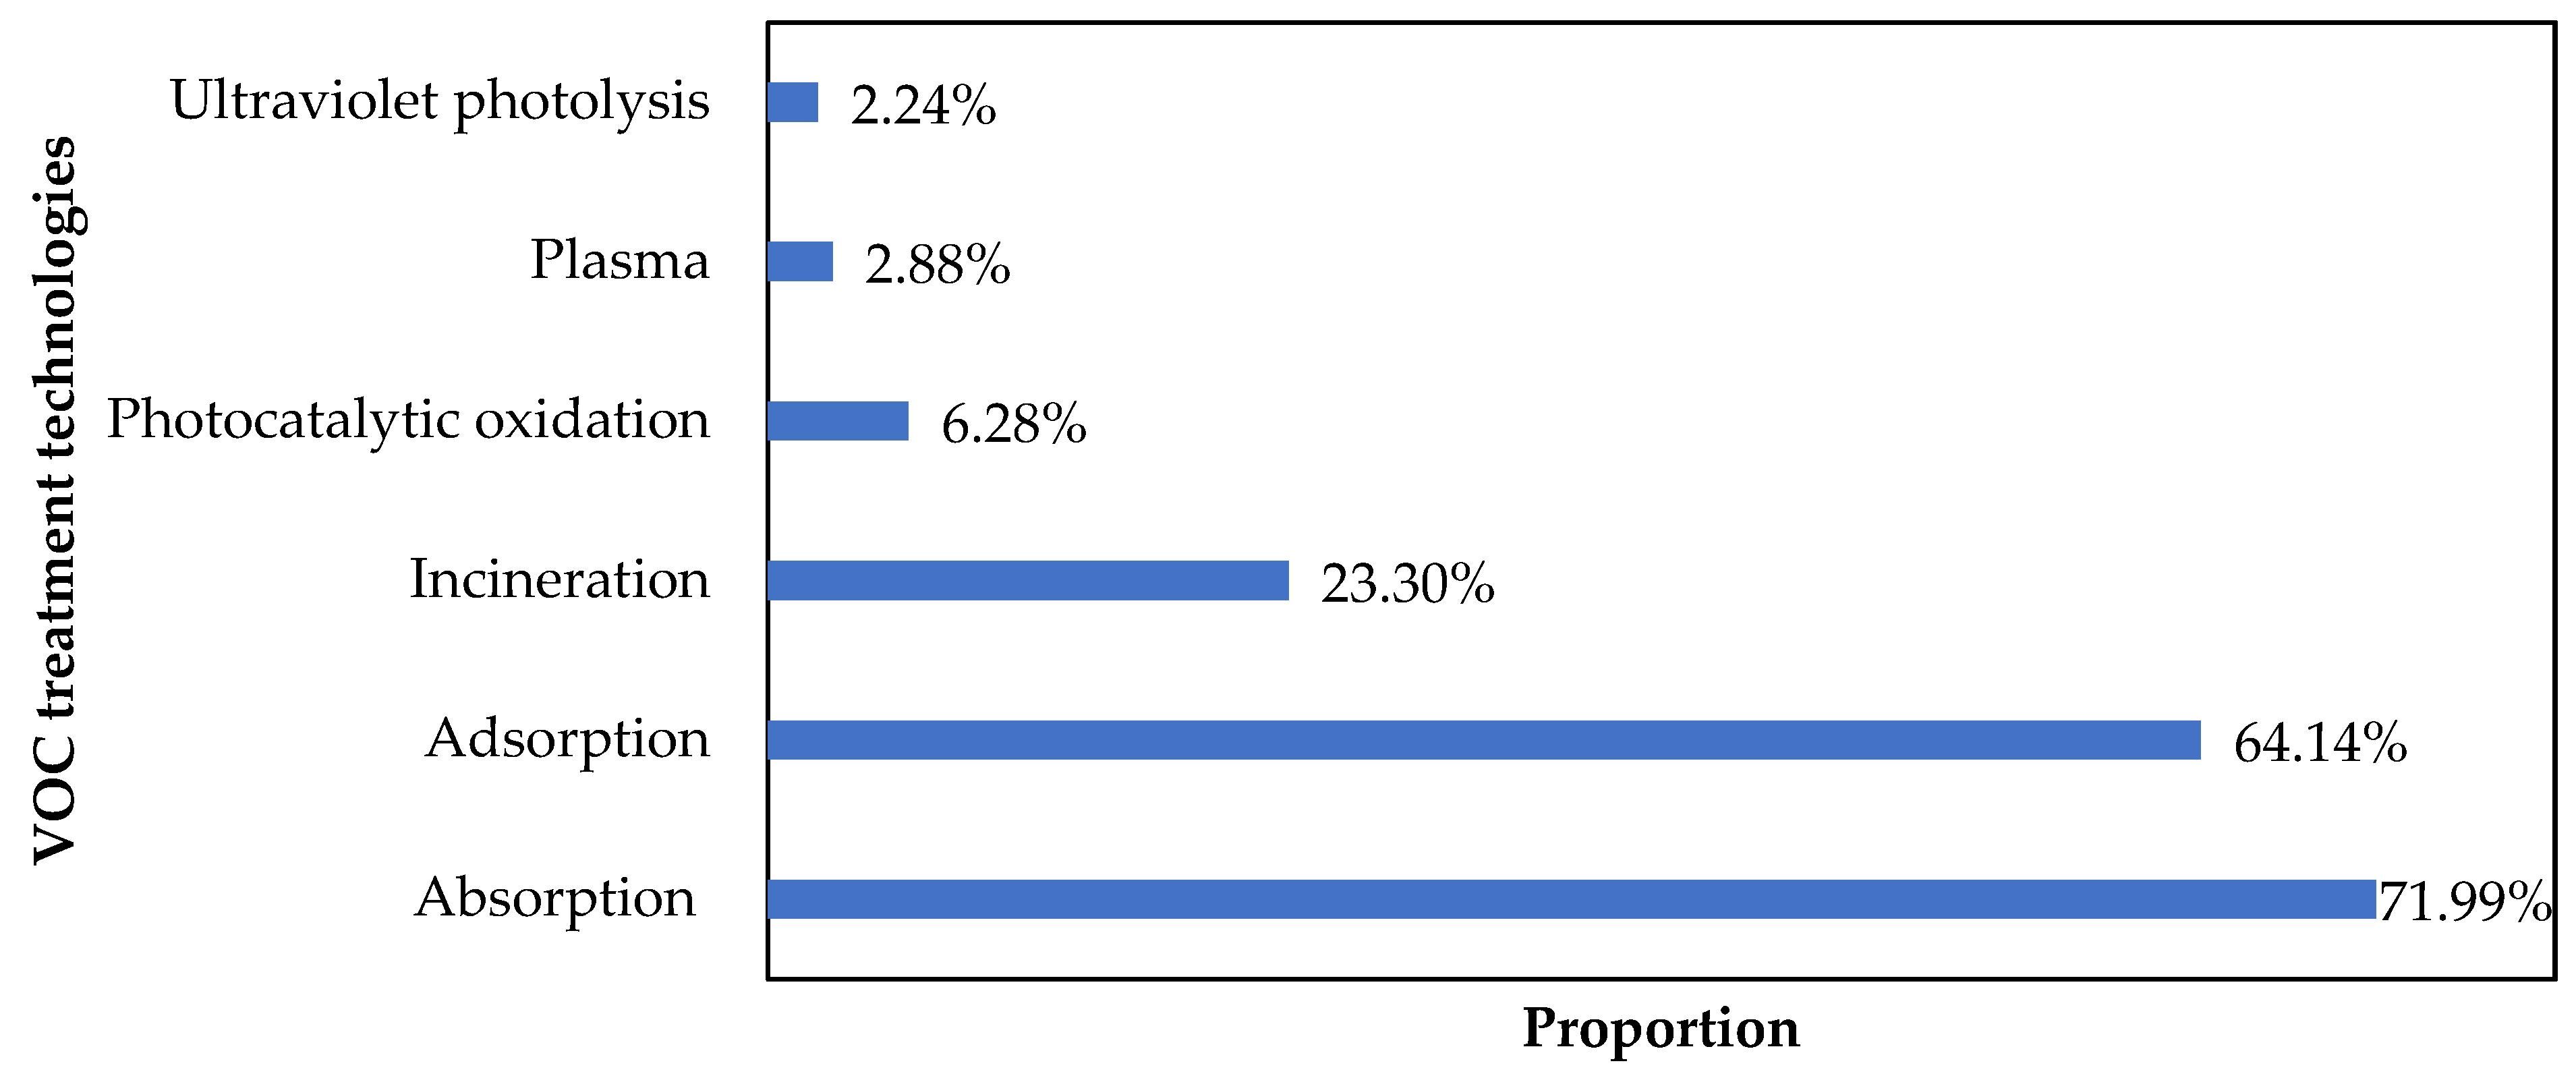
3.3.1. Proportion of VOC Treatment Technologies Used

The usage of VOC treatment facilities was summarized according to the pollutant discharge permits of 385 pesticide manufacturing factories, as shown in Figure 2. Organic waste gas treatment in the pesticide manufacturing industry mostly adopts combined processes, among which absorption and adsorption processes are used most often, with frequencies of 71.99% and 64.14%, respectively; incineration follows with a frequency of 23.30%; photocatalytic oxidation, plasma, ultraviolet photolysis, and other inefficient technologies are used less, with frequencies of 6.28%, 2.88%, and 2.36%, respectively. From the statistics above, it can be seen that most of the VOC treatment methods in the pesticide industry adopt a combined absorption–adsorption technique.

3.3.2. Facility Removal Rates of VOCs

The VOC removal rates of the common and combined processes were assessed in terms of historical facility removal rates, VOC treatment facility removal rates in the pesticide industry from the second pollution-source census of China, and our supplementary monitoring data, all of which are shown in Table 4. According to the “Emission Standard of Air Pollutants for Pesticide Manufacturing Industry” (GB39727-2020) [26], the removal rate of VOC treatment facilities in the pesticide industry should not be less than 80%. The recommended combined processes and removal rates of specific pollutants are shown in Table 5.
According to Table 4 and Table 5, the efficiency of treatment facilities decreases significantly with reduction in organic waste gas concentration, so the large volume and low concentration of pesticide organic waste gas make it difficult for treatment facilities to achieve the intended removal effect. Furthermore, the detected concentrations of pesticide organic waste gas are still extremely low, partly because the responsiveness of some specific VOCs is low when employing a hydrogen-flame ionization detector (FID) to determine the nonmethane total hydrocarbon, meaning that the results are generally low when analyzing oxygenated volatile organic compounds [36]. In addition, the removal effect of treatment facilities is inevitably related to the quality and brand of the equipment used.
It should be emphasized that some raw and auxiliary materials in the pesticide industry have a relatively low odor threshold and a large amount of unorganized emissions, which can easily lead to complaints and discomfort. Inefficient VOC treatment systems, such as photocatalytic oxidation and low-temperature plasma, are more effective than other systems in the removal of odorous substances. Therefore, the use of such VOC treatment facilities can be encouraged under certain conditions.

3.3.3. Collection Rate of Exhaust Gas

The collection rate of exhaust gas in the pesticide industry was derived from the collection rate reported in the second pollution-source census, along with the published standards and industry manuals, and the results are shown in Table 6.

3.3.4. Emission Reduction Benefit and Economic Evaluation

The investment cost, operating cost, emission concentration, design air volume, design removal rate, and other information related to VOC treatment facilities at eight pesticide-manufacturing factories were investigated.
The investment cost of regenerative thermal oxidation (RTO) in the pesticide industry was high; the main equipment cost was approximately $0.51 million to $2.66 million according to the air inlet volume, excluding pipelines and other renovation costs, so the equipment cost per 10,000 cubic meter of air volume was approximately $0.36 million. In addition to technical integration and operational stability, the cost of RTO is determined by the materials of the RTO frame (such as corrosion-resistant materials), the materials in the heat storage components (such as cordierite, mullite, and alumina), and the preheating device. According to the statistics, the annual operating cost of RTO accounts for approximately 25~30% of the one-time investment. It is estimated that the annual VOC emission reduction of RTO with 40,000 cubic meters of air volume is 187.51 tons. Furthermore, the investment cost of other combustion treatment facilities, such as catalytic combustion with 20,000 cubic meters of air volume, was $0.40 million, and the operating cost accounted for approximately 27% of the one-time investment.
Regarding unorganized source collection, the investment cost of capping the wastewater treatment facility was approximately $0.088 to $0.89 million, including the cost of the pipeline or treatment facilities. The cost associated with gas-phase balance in the volatile organic liquid storage tank was approximately $0.028 million, and that of the gas-phase equilibrium device, including adsorption, was approximately $0.41 million. Different facilities in a plant have different costs for airtight transformation, the investment costs of which are $0.12 to $0.55 million. The cost of pipelines is related to the length, diameter, and material of the pipe itself, and the installation cost is approximately 80% of the material cost.
In summary, the emission reduction benefits and economic evaluations of different treatment facilities in the pesticide industry based on the characteristics of the surveyed factories are shown in Table 7.

3.4. VOC Emission Reduction Potential of the Pesticide Manufacturing Industry

According to the investigation of the actual production status of typical pesticide factories, different production processes and equipment levels will lead to different VOC proportions in each pollution-producing node. After comprehensive analysis, the VOC emission proportion of each node was determined and results are shown in Figure 3. The reaction waste gas includes two parts, equipment-venting waste gas and vacuuming waste gas, the latter of which is included in the vacuum system.
Benchmark factories have relatively high degrees of airtightness, pipeline quality, and process automation, and the collection rate should meet or exceed the requirements. The values for moderate and poor factories were appropriately decreased. The adjusted collection rates of VOCs in the pesticide industry, shown in Figure 4 and Table S1, were calculated by reviewing and revising the data based on the actual use of collection and processing facilities.
The measures taken by benchmark factories generally include a variety of combined processes, and the overall efficiency should be higher than the required treatment rate. The adjusted facility removal rates of VOCs in the pesticide industry are shown in Figure 5 and Table S2.
In principle, facilities should meet the requirements of 100% use, but the effective utilization rate of facilities decreases due to factors such as untimely addition of chemicals, untimely replacement or regeneration of adsorbents, and untimely maintenance of combustion facilities. The facility commissioning rates are 95%, 80%, and 50% for benchmark, moderate, and poor levels in the entire evaluation node, which are presented in Table S3.
Based on the values of α, β, and γ in Tables S1 and S2, the comprehensive removal rates of benchmark, moderate, and poor factories in the pesticide industry were calculated as 86%, 51%, and 10%, respectively, as shown in Table 8. Considering that some factories are not fully covered by collection and treatment facilities, the comprehensive removal rates of factories calculated based on individual processes were too high and required adjustment. The adjustment coefficients of benchmark, moderate, and poor factories were 0.94, 0.9, and 0.8, respectively. After adjustment, the comprehensive removal rates of benchmark, medium, and poor factories were 81%, 46%, and 8%, respectively.
According to different emission reduction target stages, the emission reduction ratios of the high, moderate, and low targets were 41.55%, 32.12%, and 24.32%, respectively, and the corresponding emission reduction costs were $0.653, $0.505, and $0.038 billion/year, respectively.

4. Conclusions and Prospects

The pesticide industry can be divided into three categories: chemical raw material production, biological raw material production, and formulation production. The VOC emission nodes mainly include preparation and feeding, the reaction process, solid–liquid separation, drying, solvent recovery, the vacuum system, dynamic and static equipment sealing, process sampling, packaging, storage and transportation, sewage treatment, the circulating water system, and temporary storage of hazardous waste. After careful screening, 41 key VOC substances were selected: formaldehyde, acrylonitrile, benzene series compounds (benzene, toluene, and xylene), phenols, chlorobenzenes, glyoxal, propylene, isoprene, ethylene, m/p-xylene, o-xylene, acrolein, 1-pentene, m-diethylbenzene, propionaldehyde, cyclopentene, trans-3-heptene, n-butyraldehyde, n-butanol, trans-1,3-dichloropropene, cyclohexene, n-hexanal, 3-methoxy-1-butanol, naphthalene, methyl isobutyl ketone, styrene, methylcyclohexane, ethanol, isopentene, cyclohexanone, cyclohexane, n-hexane, n-heptane, n-propyl acetate, methyl tert-butyl ether, methanol, trichloroethylene, ethyl acetate ester, and isopropanol.
Factories in the pesticide industry can be divided into three categories, corresponding to benchmark, moderate, and poor governance levels, which account for 9.2%, 41.3%, and 49.5% of the national total, respectively, and have comprehensive removal rates of 81%, 46%, and 8%. According to the estimated emission reduction potential, under the high, medium, and low emission reduction targets during the “14th Five-Year Plan” period, the emission reduction rates of VOCs in the pesticide industry are 41.55%, 32.12%, and 24.32%, respectively, and the corresponding emission reduction costs are $0.653, $0.505, and $0.038 billion/year.
As mentioned previously, there are more benchmark factories in the Jiangsu and Zhejiang provinces, followed by Shandong, and the proportion of poor factories is higher in other provinces, especially in the western provinces. Therefore, in order to achieve the target, the improvement of pollution prevention level of the pesticide industry is urgent in provinces, except for those in the southeast. From the perspective of the treatment effect, the efficiency of incineration is the best, generally above 99%, but the input and operating costs of this method are the highest. For the factories that use multistage absorption and activated-carbon adsorption, which accounts for the highest proportion, attention should be paid to the activated carbons with different specifications or different iodine values, which can have a significant impact on the adsorption effect. Furthermore, the replacement frequency of activated carbons is closely related to processing efficiency.
According to the overall process supervision approach of “source reduction-process control-endpoint treatment-daily management”, there are several effective methods for lowering pollution levels in the pesticide industry. (1) Source reduction: encourage enterprises to use nonhalogenated hydrocarbons, nonaromatic hydrocarbons, high-solids, and high-boiling point solvents; promote green production processes such as the water-phase method and biological enzymatic synthesis, especially for preparation factories; promote solvents with a high boiling point and low photochemical potential to reduce the environmental impact in the life cycle. (2) Process control: combined with equipment upgrades, improve the airtightness of equipment in storage, transportation, feeding, solid–liquid separation, drying, vacuum system, packaging, solvent storage and transportation, etc. and reasonably design air collection devices for a rational air volume; in principle, avoid overall ventilation air collection in the workshop and avoid situations where an excessive air volume cannot be controlled. (3) Endpoint treatment: accelerate the elimination of inefficient single treatment methods and adopt reasonable treatment technology. Adopt adsorption regeneration as a recommended pretreatment for halogenated hydrocarbon and aromatic hydrocarbon waste gas in principle. Eliminate the use of photo-oxidation and activated carbon adsorption, water spray and activated carbon adsorption, disposable activated carbon adsorption and other processes as end-of-line treatment measures in the treatment of VOC waste gas generated from the production of technical materials and intermediates. Encourage the use of RTO or integrated incineration of waste gas and waste liquid for efficient treatment. (4) Daily management: in view of the intermittent production schedule of pesticide factories and the poor results of conventional leak detection and repair (LDAR) testing, an unannounced inspection system should be established. Sampling inspections will be carried out at selected points; if the number of points exceeds the standard, corresponding punitive measures can be taken to improve the effectiveness of LDAR detection.
Due to the refined pesticide industry emission standards of China, the advanced issuance of pollutant discharge permits, and the tightened requirements for VOCs emission reduction of the factory, the pollution prevention and control level of most pesticide factories is difficult to adapt to the needs of the environmental situation. This paper estimated the emission reduction ratios and the corresponding emission reduction costs through the statistics of pesticide industry in China, but has not formed a technical system that can be seen, learned, and promoted. Therefore, we should establish the best available technical specifications based on integration of industry practices, and compile a recommended catalogue for the production equipment of pesticide industry to standardize the upgrading and transformation of enterprise equipment in future, supporting the development of pollution reduction work in the pesticide industry.

Supplementary Materials

The following supporting information can be downloaded at https://0-www-mdpi-com.brum.beds.ac.uk/article/10.3390/atmos13081241/s1, Figure S1. The regional distribution of the pesticide factories in China. Table S1. Evaluation for collection rate of VOCs in pesticide industry. Table S2. Evaluation of the facility removal rate of VOCs in the pesticide industry. Table S3. Evaluation of the facility commissioning rate of VOCs in the pesticide industry.

Author Contributions

Conceptualization, N.W. and M.S.; methodology, N.W. and M.S.; result validation, S.W.; formal analysis, X.G. and X.Z.; investigation, M.S., X.Z. and N.N.; data collation, N.W. and S.S.; writing—original draft preparation, N.W.; writing—review and editing, S.S. and H.Z. All authors have read and agreed to the published version of the manuscript.

Funding

This research was funded by the National Key R&D Program of China (2019YFC1806100).

Institutional Review Board Statement

Not applicable.

Informed Consent Statement

Not applicable.

Data Availability Statement

The data used in this paper can be provided by Na Wang ([email protected]).

Acknowledgments

This paper represents the perspectives of the authors and does not necessarily represent the official views of our sponsors. We would like to thank the anonymous reviewers for their valuable comments and suggestions to improve the manuscript.

Conflicts of Interest

The authors declare no conflict of interest.

References

  1. Liu, X.; Yan, F.; Hua, H.; Yuan, Z. Identifying hotspots based on high-resolution emission inventory of volatile organic compounds: A case study in China. J. Environ. Manag. 2021, 288, 112419. [Google Scholar] [CrossRef] [PubMed]
  2. A Practical Handbook on Volatile Organic Compounds Management, 2nd ed; China Environment Publishing Group: Beijing, China; ISBN 9787511147509.
  3. Song, C.; He, J.; Wu, L.; Jin, T.; Chen, X.; Li, R.; Ren, P.; Zhang, L.; Mao, H. Health burden attributable to ambient PM2.5 in China. Environ. Pollut. 2017, 223, 575–586. [Google Scholar] [CrossRef] [PubMed]
  4. Song, C.; Wu, L.; Xie, Y.; He, J.; Chen, X.; Wang, T.; Lin, Y.; Jin, T.; Wang, A.; Liu, Y.; et al. Air pollution in China: Status and spatiotemporal variations. Environ. Pollut. 2017, 227, 334–347. [Google Scholar] [CrossRef] [PubMed]
  5. Wang, T.; Xue, L.; Brimblecombe, P.; Lam, Y.F.; Li, L.; Zhang, L. Ozone pollution in China: A review of concentrations, meteorological influences, chemical precursors, and effects. Sci. Total Environ. 2017, 575, 1582–1596. [Google Scholar] [CrossRef] [PubMed]
  6. Li, Q.; Su, G.; Li, C.; Liu, P.; Zhao, X.; Zhang, C.; Sun, X.; Mu, Y.; Wu, M.; Wang, Q.; et al. An investigation into the role of VOCs in SOA and ozone production in Beijing, China. Sci. Total Environ. 2020, 720, 137536. [Google Scholar] [CrossRef]
  7. Xiang, S.; Liu, J.; Tao, W.; Yi, K.; Xu, J.; Hu, X.; Liu, H.; Wang, Y.; Zhang, Y.; Yang, H.; et al. Control of both PM2.5 and O3 in Beijing-Tianjin-Hebei and the surrounding areas. Atmos. Environ. 2020, 224, 117259. [Google Scholar] [CrossRef]
  8. Guo, X.; Shen, Y.; Liu, W.; Chen, D.; Liu, J. Estimation and Prediction of Industrial VOC Emissions in Hebei Province, China. Atmosphere 2021, 12, 530. [Google Scholar] [CrossRef]
  9. Wang, H.L.; Sun, S.M.; Nie, L.; Zhang, Z.S.; Li, W.P.; Hao, Z.P. A review of whole-process control of industrial volatile organic compounds in China. J. Environ. Sci. 2022. [Google Scholar] [CrossRef]
  10. He, D.C.; Li, F.H.; Wu, M.; Luo, H.L.; Qiu, L.Q.; Ma, X.R.; Lu, J.W.; Liu, W.R.; Ying, G.G. Emission of volatile organic compounds (VOCs) from application of commercial pesticides in China. J. Environ. Manag. 2022, 314, 115069. [Google Scholar] [CrossRef]
  11. Wang, R.; Wang, X.; Cheng, S.; Wang, K.; Cheng, L.; Zhu, J.; Zheng, H.; Duan, W. Emission Characteristics and Reactivity of Volatile Organic Compounds from Typical High-Energy-Consuming Industries in North China. Sci. Total Environ. 2022, 809, 151134. [Google Scholar] [CrossRef]
  12. Lewis, A.C.; Hopkins, J.R.; Carslaw, D.C.; Hamilton, J.F.; Nelson, B.S.; Stewart, G.; Dernie, J.; Passant, N.; Murrells, T. An increasing role for solvent emissions and implications for future measurements of volatile organic compounds. Phil. Trans. Math. Phys. Eng. Sci. 2020, 378, 20190328. [Google Scholar] [CrossRef] [PubMed]
  13. Zhang, X.M.; Zhao, W.J.; Nie, L.; Shao, X.; Dang, H.Y.; Zhang, W.Q.; Wang, D. A new classification approach to enhance future VOCs emission policies: Taking solvent-consuming industry as an example. Environ. Pollut. 2021, 268, 115868. [Google Scholar] [CrossRef] [PubMed]
  14. Yuan, C.S.; Cheng, W.H.; Huang, H.Y. Spatiotemporal distribution characteristics and potential sources of VOCs at an industrial harbor city in southern Taiwan: Three year VOCs monitoring data analysis. J. Environ. Manag. 2022, 303, 114259. [Google Scholar] [CrossRef] [PubMed]
  15. Guo, Y.Y.; Liu, F.M.; Wang, J.; Peng, Q.R. Research progress on substitution of harmful organic solvent in pesticide emulsifiable concentrates. Chin. J. Pesticide Sci. 2020, 22, 925–932. [Google Scholar]
  16. OWD (Our World in Data). Pesticides—Our World in Data. 2021. Available online: https://ourworldindata.org/pesticides (accessed on 18 May 2022).
  17. Habeebullah, T.M. Risk assessment of exposure to BTEX in the Holy City of Makkah. Arab. J. Geosci. 2015, 8, 1155–1162. [Google Scholar] [CrossRef]
  18. Bari, M.A.; Kindzierski, W.B. Concentrations, sources and human health risk of inhalation exposure to air toxics in Edmonton. Chemosphere 2017, 173, 160–171. [Google Scholar] [CrossRef]
  19. Masih, A.; Lall, A.S.; Taneja, A.; Singhvi, R. Exposure levels and health risk assessment of ambient BTX at urban and rural environments of a Terai region of Northern India. Environ. Pollut. 2018, 242, 1678–1683. [Google Scholar] [CrossRef]
  20. Chen, Y.; Li, L.N.; Yang, C.Q.; Hao, Z.P.; Sun, H.K.; Li, Y. Countermeasures for priority control of toxic VOC pollution. Environ. Sci. 2011, 32, 3469–3475. [Google Scholar]
  21. Wei, W. Study on Current and Future Anthropogenic Emission of Volatile Organic Compounds in China. Ph.D. Thesis, Tsinghua University, Beijing, China, 2009. (In Chinese). [Google Scholar]
  22. Liu, J.F.; Zhao, J.; Li, T.T.; Bai, Y.H.; Liu, Z.R. Establishment of Chinese Anthropogenic Source Volatile Organic Compounds Emission Inventory. China Environ. Sci. 2008, 28, 496–500. (In Chinese) [Google Scholar]
  23. Zhao, B.; Wang, P.; Ma, J.Z.; Zhu, S.; Pozzer, A.; Li, W. A high-resolution emission inventory of primary pollutants for the Huabei region, China. Atmos. Chem. Phys. 2012, 12, 481–501. [Google Scholar] [CrossRef] [Green Version]
  24. Hua, H.; Jiang, S.; Sheng, H.; Zhang, Y.; Liu, X.; Zhang, L.; Yuan, Z.; Chen, T. A high spatial-temporal resolution emission inventory of multi-type air pollutants for Wuxi city. J. Clean. Prod. 2019, 229, 278–288. [Google Scholar] [CrossRef]
  25. Li, M.; Zhang, Q.; Zheng, B.; Tong, D.; Lei, Y.; Liu, F.; Hong, C.; Kang, S.; Yan, L.; Zhang, Y.; et al. Persistent growth of anthropogenic non-methane volatile organic compound (NMVOC) emissions in China during 1990–2017: Drivers, speciation and ozone formation potential. Atmos. Chem. Phys. 2019, 19, 8897–8913. [Google Scholar] [CrossRef] [Green Version]
  26. “Emission Standard of Air Pollutants for Pesticide Industry” (GB 39727-2020). 2020. Available online: https://www.mee.gov.cn/ywgz/fgbz/bz/bzwb/dqhjbh/dqgdwrywrwpfbz/202012/t20201225_814812.shtml (accessed on 20 May 2022). (In Chinese)
  27. “Stationary Source Emission-Determination of Total Hydrocarbons, Methane and Nonmethane Hydrocarbons-Gas Chromatography” (HJ38-2017). 2017. Available online: https://www.mee.gov.cn/ywgz/fgbz/bz/bzwb/jcffbz/201801/t20180108_429313.shtml (accessed on 20 May 2022). (In Chinese)
  28. Zheng, H.C.; Dang, X.Q.; Li, S.J.; Cao, L.; Tan, X.Y.; Xu, J. Selection and optimization of VOCs exhaust gas collection method in printing process. Chin. J. Environ. Eng. 2020, 14, 2786–2795. (In Chinese) [Google Scholar]
  29. Liu, H.; Huang, Y.; Zhou, J.R.; Qiu, P.P.; Duan, Y.X. Measured analysis of volatile organic compounds pollution control efficiency in key industries in Wuhan. J. Gre. Sci. Tech. 2022, 24, 214–218. (In Chinese) [Google Scholar]
  30. Chen, Y. Study on Current and Future Industrial Emission of Volatile Organic Compounds in China. Master’s Thesis, South China University of Technology, Guangzhou, China, 2011. (In Chinese). [Google Scholar]
  31. Shao, Y.X. Study on Emission Characteristics and Emission Reduction Potential of Volatile Organic Compounds from Typical Industries. Master’s Thesis, Zhejiang University, Hangzhou, China, 2019. [Google Scholar]
  32. Sha, Q.; Zhu, M.; Huang, H.; Wang, Y.; Huang, Z.; Zhang, X.; Tang, M.; Lu, M.; Chen, C.; Shi, B.; et al. A newly integrated dataset of volatile organic compounds (VOCs) source profiles and implications for the future development of VOCs profiles in China. Sci. Total Environ. 2021, 793, 148348. [Google Scholar] [CrossRef]
  33. Huang, Y.; Xiu, G.; Lu, Y.; Gao, S.; Li, L.; Chen, L.; Huang, Q.; Yang, Y.; Che, X.; Chen, X.; et al. Application of an emission profile-based method to trace the sources of volatile organic compounds in a chemical industrial park. Sci. Total Environ. 2021, 768, 144694. [Google Scholar] [CrossRef] [PubMed]
  34. Carter, W.P.L. Development of ozone reactivity scales for volatile organic compounds. J. Air Waste Manag. 1994, 44, 881–899. [Google Scholar] [CrossRef] [Green Version]
  35. American. FINAL Regulation Order: Tables of Maximum Incremental and Reactivity (MIR) Values [Z], 94700. Available online: https://vdocument.in/final-regulation-order-tables-of-maximum-incremental-reactivity-mir-of-maximum.html?page=1 (accessed on 17 May 2022).
  36. Li, Z.M. Discussion on Determination of Non-methane Hydrocarbons. Adv. Mat. Res. 2015, 1073–1076, 562–566. [Google Scholar] [CrossRef]
Figure 1. The process flow diagram of the pesticide factory.
Atmosphere 13 01241 g001
Figure 2. Proportion of VOC treatment usage in pesticide manufacturing industry facilities.
Atmosphere 13 01241 g002
Figure 3. Nodes and proportions of VOC pollution in the pesticide industry. (Others: hazardous waste temporary storage, dynamic and static equipment sealing, process sampling, circulating water system).
Atmosphere 13 01241 g003
Figure 4. Evaluation for collection rate of VOCs in pesticide industry. (A: preparation, feeding, and reaction process; B: solid-liquid separation; C: drying; D: solvent recovery, vacuum system; E: packaging; F: solvent storage and transportation; G: others, including hazardous waste temporary storage, dynamic and static equipment sealing, process sampling, circulating water system).
Atmosphere 13 01241 g004
Figure 5. Evaluation of the facility removal rate of VOCs in pesticide industry. (A: production process; B: solvent storage and transportation; C: sewage station; D: hazardous waste temporary storage).
Atmosphere 13 01241 g005
Table 1. Three different levels of VOC emission reduction targets in pesticide factories in China.
Target LevelsProportion of Factories (%)
BenchmarkModeratePoor
Low206515
Moderate306010
High40582
Table 2. Characteristics of VOC emissions in the pesticide industry.
ProcessGenerating PointCauseEmission CharacteristicsEmission FormDischarge Concentration after Collection and Treatment (mg/m3)
FeedingFeeding portThe feeding port is connected to the reactorNormal temperature and pressure, intermittent dischargeOrganized/fugitive emissions<10
ReactionReactor, washing kettle, etc.Displacement, purging and other processesHigh temperature, atmospheric or high pressure, intermittent dischargeOrganized emissions5~110
RefiningDistillation tower, rectification tower, crystallization tank, etc.Discharge during replacement, purging, material in- and outflow, etc.High temperature, atmospheric pressure, intermittent dischargeOrganized emissions5~110
SeparationFilter presses, stratification facilitiesProcesses such as open filter pressesNormal temperature, normal pressure, intermittent dischargeOrganized/fugitive emissions5~110
FillingDischarge port, product filling, etc.Product dischargeNormal temperature, normal pressure, intermittent dischargeOrganized/fugitive emissions<10
StorageBreathing valve of the organic liquid storage tank at atmospheric pressureTank breathingNormal temperature, normal pressure, intermittent dischargeOrganized/fugitive emissions<10
Wastewater treatmentOpen liquid surface in wastewater treatment facilitiesLiquid escapeNormal temperature, normal pressure, continuous dischargeOrganized/fugitive emissions<10
LoadingOpen mouths of tankers etc.Exhaust gas discharge due to internal and external gas phase balanceNormal temperature, normal pressure, intermittent dischargeOrganized/fugitive emissions<10
Hazardous waste storageHazardous waste warehouse, raw material warehouseEscape caused by poor packagingNormal temperature, normal pressure, continuous dischargeOrganized/fugitive emissions<10
Vacuum systemWet vacuum system, circulating water tankVOC escape from circulating waterNormal temperature, normal pressure, continuous dischargeOrganized/fugitive emissionsFugitive emissions caused by improper management >3000
Circulating water systemOpen circulating water equipmentVOC escape from circulating waterNormal temperature, normal pressure, continuous dischargeFugitive emissionsHigh VOC emissions caused by improper management
Note: The discharge concentration of VOC in terms of the nonmethane hydrocarbons (NMHC) is 100 mg/m3 in “Emission standard of air pollutants for pesticide industry” (GB 39727-2020) [26].
Table 3. List of key VOC substances in the pesticide manufacturing industry.
TypeKey VOC SubstancesOriginsScreening Evidence
AlkanesCyclohexane, n-hexane, n-heptane, methylcyclohexaneIntermediates, raw materialsRefer to active substance lists [30,31,32,33]
OlefinsAcrylonitrileRaw materialsHigh MIR value [34,35]; pungent odour
Propylene, isoprene, ethylene, 1-pentene, cyclopentene, trans-3-heptene, trans-1,3-dichloropropene, cyclohexene, styrene, isopenteneIntermediates, raw materialsRefer to active substance lists [30,31,32,33]
Aromatic hydrocarbonsBenzene series (benzene, toluene, xylene)Raw materials, solvents, contaminantsBenzene: carcinogenicity class I (high toxicity)
Toluene: high MIR value; large amount used as solvent
Xylene: high MIR value; large amount used as solvent [34,35]
m/p-xylene, o-xylene, m-diethylbenzene, naphthaleneIntermediates, raw materialsRefer to active substance lists [30,31,32,33]
Oxygenated hydrocarbonsFormaldehydeRaw materials and byproductsCarcinogenicity class I; high MIR value; inhalation toxicity class I; low olfactory threshold [34,35]
Glyoxal, propionaldehyde, acrolein, n-butyraldehyde, n-butanol, n-hexanal, 3-methoxy-1-butanol, methyl isobutyl ketone, ethanol, cyclohexanone, n-propyl acetate, Methyl tert-butyl ether, methanol, ethyl acetate, isopropanolIntermediates, raw materialsRefer to active substance lists [30,31,32,33]
Halogenated olefinsTrichloroethyleneIntermediates, raw materialsRefer to active substance lists [30,31,32,33]
PhenolsPhenolsRaw materialsIndustry standard requirements, no MIR value yet
ChlorobenzenesChlorobenzenesByproductIndustry standard requirements, no MIR value yet
Table 4. VOC removal rates by common compliant and combined processes in the pesticide manufacturing industry.
FacilityCoverage RateFacility Removal Rates of VOCs (In Terms of Total Nonmethane Hydrocarbons) (%)
Concentration I (>250 mg/m3)Concentration II (20~250 mg/m3)Concentration III (<20 mg/m3)
Incineration (RTO)23.3%988253
Multistage absorption and adsorption64.14%956535
Multistage absorption71.99%855116
Table 5. Recommended combined processes and removal rates of specific pollutants.
Specific PollutantsRecommended Combination ProcessRemoval Rate/%
BenzeneOne-stage alkali absorption + RTO99
AcrylonitrileAlkali absorption95
XyleneTwo-stage falling film + two-stage lye absorption + one-stage activated carbon adsorption90
Two-stage 5 °C water-cooled treatment +activated carbon adsorption and desorption90
One-stage absorption with water spray + one-stage alkali absorption + one-stage activated carbon adsorption95
PhosgeneAlkali absorption + RTO99
Two-stage absorption with falling water film + two-stage hot water catalytic light breaking absorption + one-stage absorption with falling water film + one-stage alkali absorption in packed tower95
TolueneActivated carbon adsorption98
Condensation absorption80
Secondary falling film absorption + activated carbon adsorption95
FormaldehydeOne-stage alkali absorption + RTO98
Water absorption90
Secondary falling film absorption + activated carbon adsorption95
Table 6. Collection rate of VOCs in the pesticide industry.
Collection MethodCoverage Rate %Collection Rate %The Conditions that Must Be Met to Reach the Upper Limit Efficiency, Otherwise the Limit Is Calculated
Direct connection to the exhaust gas outlet of the equipmentApproximately 80%80~95The equipment has a fixed discharge pipe (or port) directly connected to the air duct. The equipment is completely sealed, leaving only the product inlet and outlet open, and there are exhaust gas collection measures at the inlet and outlet. When the collection system is running, hardly any VOCs are emitted around it.
Confined collection in workshop or closed roomApproximately 40%80~95The roof is cast in place, and the surrounding walls, doors, and windows have good airtightness. The total air volume collected ensures a slight negative pressure at the opening (the suction wind speed at the open section is not less than 0.5 m/s), and exhaust gas is not leaked.
Semi-closed hood or fume hoodApproximately 60%65~85At the point (surface) of pollutant generation, the controlled wind speed towards the suction port shall not be less than 0.5 m/s.
Hot upper suction hoodsApproximately 30%30~60At the point (surface) of pollutant generation, the controlled wind speed towards the suction port shall not be less than 0.5 m/s. “Hot” refers to the temperature of the gas emitted by the pollution source, which must be ≥60 °C.
Cold upper suction hoods>90%20~50At the point (surface) of pollutant generation, the controlled wind speed towards the suction port shall not be less than 0.5 m/s. “Cold” refers to the temperature of the gas emitted by the pollution source, which must be <60 °C.
Side suction hoods>90%20~40At the point (surface) of pollutant generation, the controlled wind speed towards the suction port shall not be less than 0.5 m/s, and the distance between the suction hood and the far end of the pollution source shall not be greater than 0.6 m.
Table 7. Emission reduction benefits and economic evaluation of different treatment facilities in the pesticide industry.
TechnologyDepreciation Cost (Ten Thousand US Dollars)Operating Cost (Ten Thousand US Dollars)Comprehensive Cost (Ten Thousand US Dollars)VOC Treatment Amount (t/a)Unit VOC Reduction Cost (US dollars/ton)
RTO (low cost)31.088.8839.9688.24530.28
RTO (high cost)68.0834.04102.12187.515446.40
Multistage absorption and adsorption6.663.710.3632.473190.88
Multistage absorption5.920.746.6620.063319.64
Table 8. Classification of comprehensive removal rates in the pesticide industry (B represents benchmark, M represents moderate, and P represents poor).
Evaluation NodeProportion of VOC PollutionEstimated Exhaust Gas Collection Rate/Type of FactoryEstimated Facility Commissioning Rate/Type of FactoryEstimated Facility Removal Rate/Type of FactoryEstimated Comprehensive Removal Rate/Type of Factory
BMPBMPBMPBMP
Preparation, feeding and reaction process5%95%75%095%80%50%95%75%30%86%45%0%
Solid–liquid separation20%95%75%60%95%80%50%95%75%30%86%45%9%
Drying30%95%85%75%95%80%50%95%75%30%86%51%11%
Solvent recovery, vacuum system35%98%95%85%95%80%50%95%75%30%88%57%13%
Packaging3%95%85%095%80%50%95%75%30%86%51%0%
Solvent storage and transportation2%95%75%50%95%80%50%95%95%086%57%0%
Sewage station2%90%75%10%95%80%50%90%60%30%77%36%2%
Others3%90%75%095%80%50%95%60%30%81%36%0%
Whole plant evaluation 86%51%10%
Publisher’s Note: MDPI stays neutral with regard to jurisdictional claims in published maps and institutional affiliations.

