
Attribution Analysis of Runoff Change in the Upper Reaches of the Kaidu River Basin Based on a Modified Budyko Framework

1
School of Water Resources and Environment, China University of Geosciences, Beijing 100083, China
2
Key Laboratory of Groundwater Conservation of MWR, China University of Geosciences, Beijing 100083, China
*
Author to whom correspondence should be addressed.
Atmosphere 2022, 13(9), 1385; https://0-doi-org.brum.beds.ac.uk/10.3390/atmos13091385
Submission received: 10 August 2022
/
Revised: 24 August 2022
/
Accepted: 25 August 2022
/
Published: 29 August 2022
(This article belongs to the Special Issue Hydrological Responses under Climate Changes)
Abstract
:The Kaidu River plays an important role in the water development and utilization in the Tarim River basin in northwestern China. In this study, we used a modified Budyko framework, which considered the snowmelt to analyze and attribute the runoff change in the upper Kaidu River basin based on the observations during the period of 1960–2010. The time series was divided into two periods: 1960–1995 and 1996–2010. The contribution rate of runoff change between these two periods and the elasticity coefficient of runoff were estimated to quantify the effect of climatic variables and landscape changes on runoff alteration. The results show that the increase in precipitation was the major cause of increase in runoff, whose contribution accounted for 81.42%. The contribution rate of the landscape change was lower than that of the precipitation change, accounting for 9.07%. The elasticity coefficient of runoff to precipitation was 1.24, and the elasticity coefficient of runoff to the landscape was −0.74. Compared with the original Budyko framework, without considering the snowmelt, the contribution rates of precipitation and potential evaporation to runoff change would decrease after considering the snowmelt in the modified Budyko framework, while the contribution rate of landscape would increase. The increased snow ratio would cause more fluctuations in the runoff. This study provides a valuable reference for the water resources management in the upper Kaidu River basin and deepens our understanding of the response of runoff to climate change in snowmelt-affected regions.
1. Introduction
Cold regions affected by snowmelt provide water resources for about one-sixth of the global population and influence most of the industrialized countries. However, they are expected to be particularly vulnerable to climate change [1]. As reported by the IPCC, the rise in global average air temperature was significant in the past 40 years, and it will reach 1.5 °C over the next two decades even under the low greenhouse gas emissions scenarios [2]. As a result, streamflow in snowmelt-affected catchments is undergoing significant changes due to climate change [3]. However, at the catchment scale, the contributions of snowmelt change to runoff alteration may vary significantly in a changing climate [4], which deserves great attention for water resources management in cold regions.
Snowfall is an important component of the water cycle in arid or semi-arid areas, and it has a great impact on freshwater supply and ecosystem [5]. Previous studies have reported a significant effect of snowfall change on runoff. Adam et al. [6] used a physical hydrological model to assess the impact of climate change on runoff, indicating that warm season runoff has decreased in most snow-affected areas, and the distribution of runoff at an annual scale has been altered. Nohara et al. [7] found that a warming climate would lead to earlier snowmelt and an increase in runoff, especially in middle- or high-latitude rivers. Barnhart et al. [8] suggested that future increases in regional air temperature may lead to earlier but slower snowmelt in mountainous areas, which might reduce the below-root zone percolation and streamflow, resulting in a corresponding reduction in runoff. In general, although the response of runoff to climate change in snowmelt-affected catchments has been extensively studied, attribution analysis of runoff changes remains a great challenge. This is because there are complex interactions between climate, vegetation, topography, and soils in snowmelt-affected areas [9].
Some methods are proposed for the attribution analysis of runoff changes in snowmelt-affected catchments. For example, the statistical method is widely used because of the low requirement for computation and great adaptability [10]. However, the statistical method simplifies or ignores the physical processes, which results in great uncertainties [11]. The physically based hydrological model, such as SRM and GE-SWAT, can simulate the runoff in detail, but it has high requirements on data and computation resources, with a large number of parameters to calibrate [12,13]. In addition, the water balance method combined with the Budyko framework has been considered an effective approach for estimating the contribution of climate variability and landscape changes to runoff alteration [14]. The Budyko framework is an analytical method that includes evapotranspiration, available energy, and available water supply, using a parameter that represents the basin characteristics [15,16,17]. The Budyko framework has been widely applied to quantitively study the effect of climate changes on runoff in different catchments [18,19]. However, the effect of snowmelt was rarely considered in the original Budyko framework, and the application of the Budyko framework in cold regions is not adequate.
The Kaidu River is located on the southern slope of the Tianshan Mountains in northwest China [20]. It provides 83.4% of inflow water to Bosten Lake [21]. Therefore, the Kaidu River plays an important role in the water resources development and utilization in the Yanqi Basin. In recent years, the climate in the Tianshan Mountains has exhibited a warmer and wetter trend [22], and the runoff of the Kaidu River has shown an obvious increasing trend in the past 40 years [20]. However, there are few studies on quantitatively evaluating the effect of different factors on runoff change, and the impact of snowmelt remains unclear [23]. Therefore, the response of runoff to climate change in the upper Kaidu River basin needs to be further examined.
Due to the complex relationship between changes in temperature and precipitation and their combined impact on snowmelt-affected runoff, trend detection and attribution analysis of runoff change are still difficult in cold regions [24]. In previous studies, as a common method, hydrologic models, such as SWAT, GR6J, and VHM, have been applied in different sub-regions in the Kaidu River basin to quantify the response of the hydrological cycle to climate changes [25,26,27]. Chen et al. [28] used Surfer 9.0 to obtain the quantitative runoff depth–precipitation–potential evapotranspiration relations of the upper Kaidu River basin, indicating that the graphic method was effective in quantifying the potential impacts of climate fluctuation on runoff. Zhuang et al. [29] developed an integrated multi-GCM-based stochastic weather generator and stepwise cluster analysis method to explore the nonlinear relationship between the input variables and outputs in basin systems. However, the contributions of snowmelt to the runoff are still poorly understood [30].
The main purpose of this study is to quantitatively evaluate the influence of different factors on the runoff change in the upper reaches of the Kaidu River basin using a modified Budyko framework incorporating snowmelt. The first-order hydro-climatic relationship (i.e., the relationship between runoff and snowmelt) is investigated [31].
2. Study Area and Data
Originating from the central Tianshan Mountains, the Kaidu River is one of the sources of the Tarim River. The upper reaches drain the headwater region of the river upstream of the Dashankou hydrological station, located within 41°30′ N to 43°21′ N latitudes and 82°58′ E to 86°55′ E longitudes (Figure 1a). The length of the upper reaches is 2222 km, and the drainage area is 18,827 km2, with an average annual runoff amount of 3.49 × 10⁹ m3 [32]. The Kaidu River basin is dominated by a continental climate, and the air moisture mainly comes from the humid westerlies and the Arctic Ocean air in the northwest. The mean annual precipitation is about 332 mm, and the rainy season is from May to August. The upper reaches of the Kaidu River basin are located in the mountain area, and the mean annual pan evapotranspiration is more than 1100 mm. The evapotranspiration increases from north to south and from high altitude to low altitude [33]. The average annual air temperature in the basin is about −4.6 °C. The snow season generally lasts from November to March in the following year, lasting 139 days, and the maximum basin-averaged snow depth is 12 cm [34]. The basin is partially covered by glaciers with an area of 490.68 km2, and the reserves are about 25.25 km3 [35]. Due to the limited rainfall, the basin is mostly covered by grassland, and the percentage of forest coverage is only 0.41%.
The measured daily climate data used in this study were obtained from 11 meteorological stations in and around the upper Kaidu River basin, and the observed river discharge data at the Dashankou hydrological station located at the outlet of the upper Kaidu River basin were collected from the Hydrological Yearbook in China. The locations of the stations are shown in Figure 1b, and detailed information about the stations is shown in Table 1.
We collected daily meteorological data in a long series of 51 years from 1960 to 2010, including air temperature, relative humidity, wind speed, and sunshine hours. The 0.25° resolution gridded data set of precipitation was provided by the National Meteorological Information Center of China (http://cdc.nmic.cn, accessed on 10 April 2021). The hydrological station provided the annual runoff data from 1960 to 2010. The DEM data with a 90 m spatial resolution were obtained by the Shuttle Radar Topography Mission (SRTM) dataset (http://srtm.csi.cgiar.org, accessed on 20 October 2020). The land use data were derived from the remote sensing monitoring database of land use status in China provided by the Resource and Environmental Science and Data Center (http://www.resdc.cn, accessed on 26 March 2021).
Since the meteorological station did not record the types of precipitation, it is necessary to distinguish the precipitation into snowfall and rainfall. We used the parameterization scheme developed by Ding et al. [36] to determine the type of precipitation, and the snow and sleet quantity were counted in the snowfall amount:
where Tw is the daily mean wet-bulb temperature, including air temperature, humidity, and atmospheric pressure information, which is more suitable for indicating the precipitation type than the air temperature. Tw is deduced as:
where RH is the relative humidity; ps is the atmospheric pressure (hPa); Ta is the air temperature (°C); esat (Ta) is the saturated vapor pressure at Ta, which is estimated as:
Tmin and Tmax are characteristic temperatures, representing the boundary between snow, sleet, and rain. They can be calculated using RH [36].
The study basin was divided into a grid system of 152 rows and 258 columns. Daily meteorological data averaged of the whole study basin were estimated by spatial interpolation based on the observations at meteorological stations, and the air temperature was interpolated considering its gradient of elevation. Potential evapotranspiration was calculated by the Penman-Monteith equation [37]. Then, the daily data were summarized into annual data.
3. Method
3.1. Mann-Kendall Nonparametric Test
The Mann-Kendall nonparametric test is used to detect trends in the hydrologic series and to determine the abrupt year of changes [38]. For one time series, x1, x2, …, xn, the following parameters were defined as:
Assuming that the samples are random and independent, the statistic UFk (UFk is a normally distributed statistic) can be calculated as:
where UF1 = 0; E(sk) and Var(sk) can be determined by the following formulas:
If UFn is larger than the critical value of 1.96 (or lower than −1.96), the trend of the variable in the whole study period is considered to be significant at a 5% significance level. We can put the time series in reverse order and use Equations (4)–(8) to calculate a new statistic UBk. At a 5% significance level, if UFk is outside the range of critical values (α = ±1.96), the increasing trend (UFk > 0) or decreasing trend (UFk < 0) will be significant. The intersection of UBk and UFk is the abrupt point in the time series. Accumulative anomalies were also used to validate the result of the Mann-Kendall nonparametric test.
3.2. The Budyko Framework
In this study, we used the Yang-Choudhury equation [39] as the original Budyko framework:
where P is precipitation (mm); E is actual evapotranspiration (mm); EP is potential evapotranspiration (mm); n is a parameter representing the landscape of the basin. According to the water balance equation, neglecting the water storage change in the basin at the interannual scale, runoff (R) can be expressed as:
Equation (9) can be rewritten as follows:
Many previous studies have extended this framework. Du et al. [40] used equivalent precipitation to replace P to represent different available water resources for evapotranspiration. Here, we adopted a new modified framework proposed by Zhang et al. [41], considering the snowmelt.
We introduced an assumption that the snow cover sublimates barely and the melting snow is too little to produce runoff in the snow season; the melting snow water flows into rivers in the form of surface runoff without evaporation or infiltration loss in the melting season [41,42]. In other words, the entire process of snow, from accumulation to melting, does not participate in the evapotranspiration processes. Therefore, the equivalent precipitation (Pe) in this framework can be expressed as:
where rs is the snow ratio, which is the ratio of snowfall to precipitation. The energy term also needs to be adjusted accordingly. Because part of the energy for evapotranspiration is used to melt the snow, the equivalent available energy is equal to the difference between EP and melting heat equivalence Rm/L, where L is the latent heat of evaporation (2500 kJ/kg). Rm is the energy required for all snow to melt, and it is about 0.14rs·P according to the estimations by Zhang et al. [41]. The equivalent available energy () can be calculated as:
Then, we replaced P and EP in the original framework by Pe and . The original framework can be changed to the following form:
The rs in the study basin was estimated to be about 0.28. The energy correction term 0.14rs/(1 − rs) was much smaller than the original term EP/((1 − rs)·P). For example, using the long-time average values, the energy correction term and original term were estimated to be 0.05 and 4.44, respectively. The difference between them are two orders of magnitude away. Thus, the energy correction term can be neglected, and Equation (14) can be simplified as:
3.3. Contribution Analysis of Runoff Change
Here, we give an additional assumption that the runoff only changes between steady states without any transient changes [41]. Therefore, an analytical framework can be introduced to quantify the contribution of different factors to runoff change between two periods. Equation (15) can be rewritten in the following form:
We assumed that the factors are independent of each other. Then, the total differential equation of R can be expressed as:
where
The contribution of different factors to runoff change can be expressed as follows:
where x is a factor that can influence the runoff. Δx is the difference of this factor between the two periods. ΔR is the difference in the runoff between two periods.
3.4. Climate Elasticity Method
We used the climate elasticity method to analyze the sensitivity of runoff to different factors. The concept of elasticity was used to explore the reaction of runoff under varying climatic conditions [43]. The elasticity coefficient of runoff (ε) can be calculated as:
where εx represents the ratio of proportional change in runoff and proportional change in an influencing factor, indicating the sensitivity of runoff to this factor [44].
4. Results
4.1. Trends and Variations of Precipitation, Snowfall, EP, and Runoff
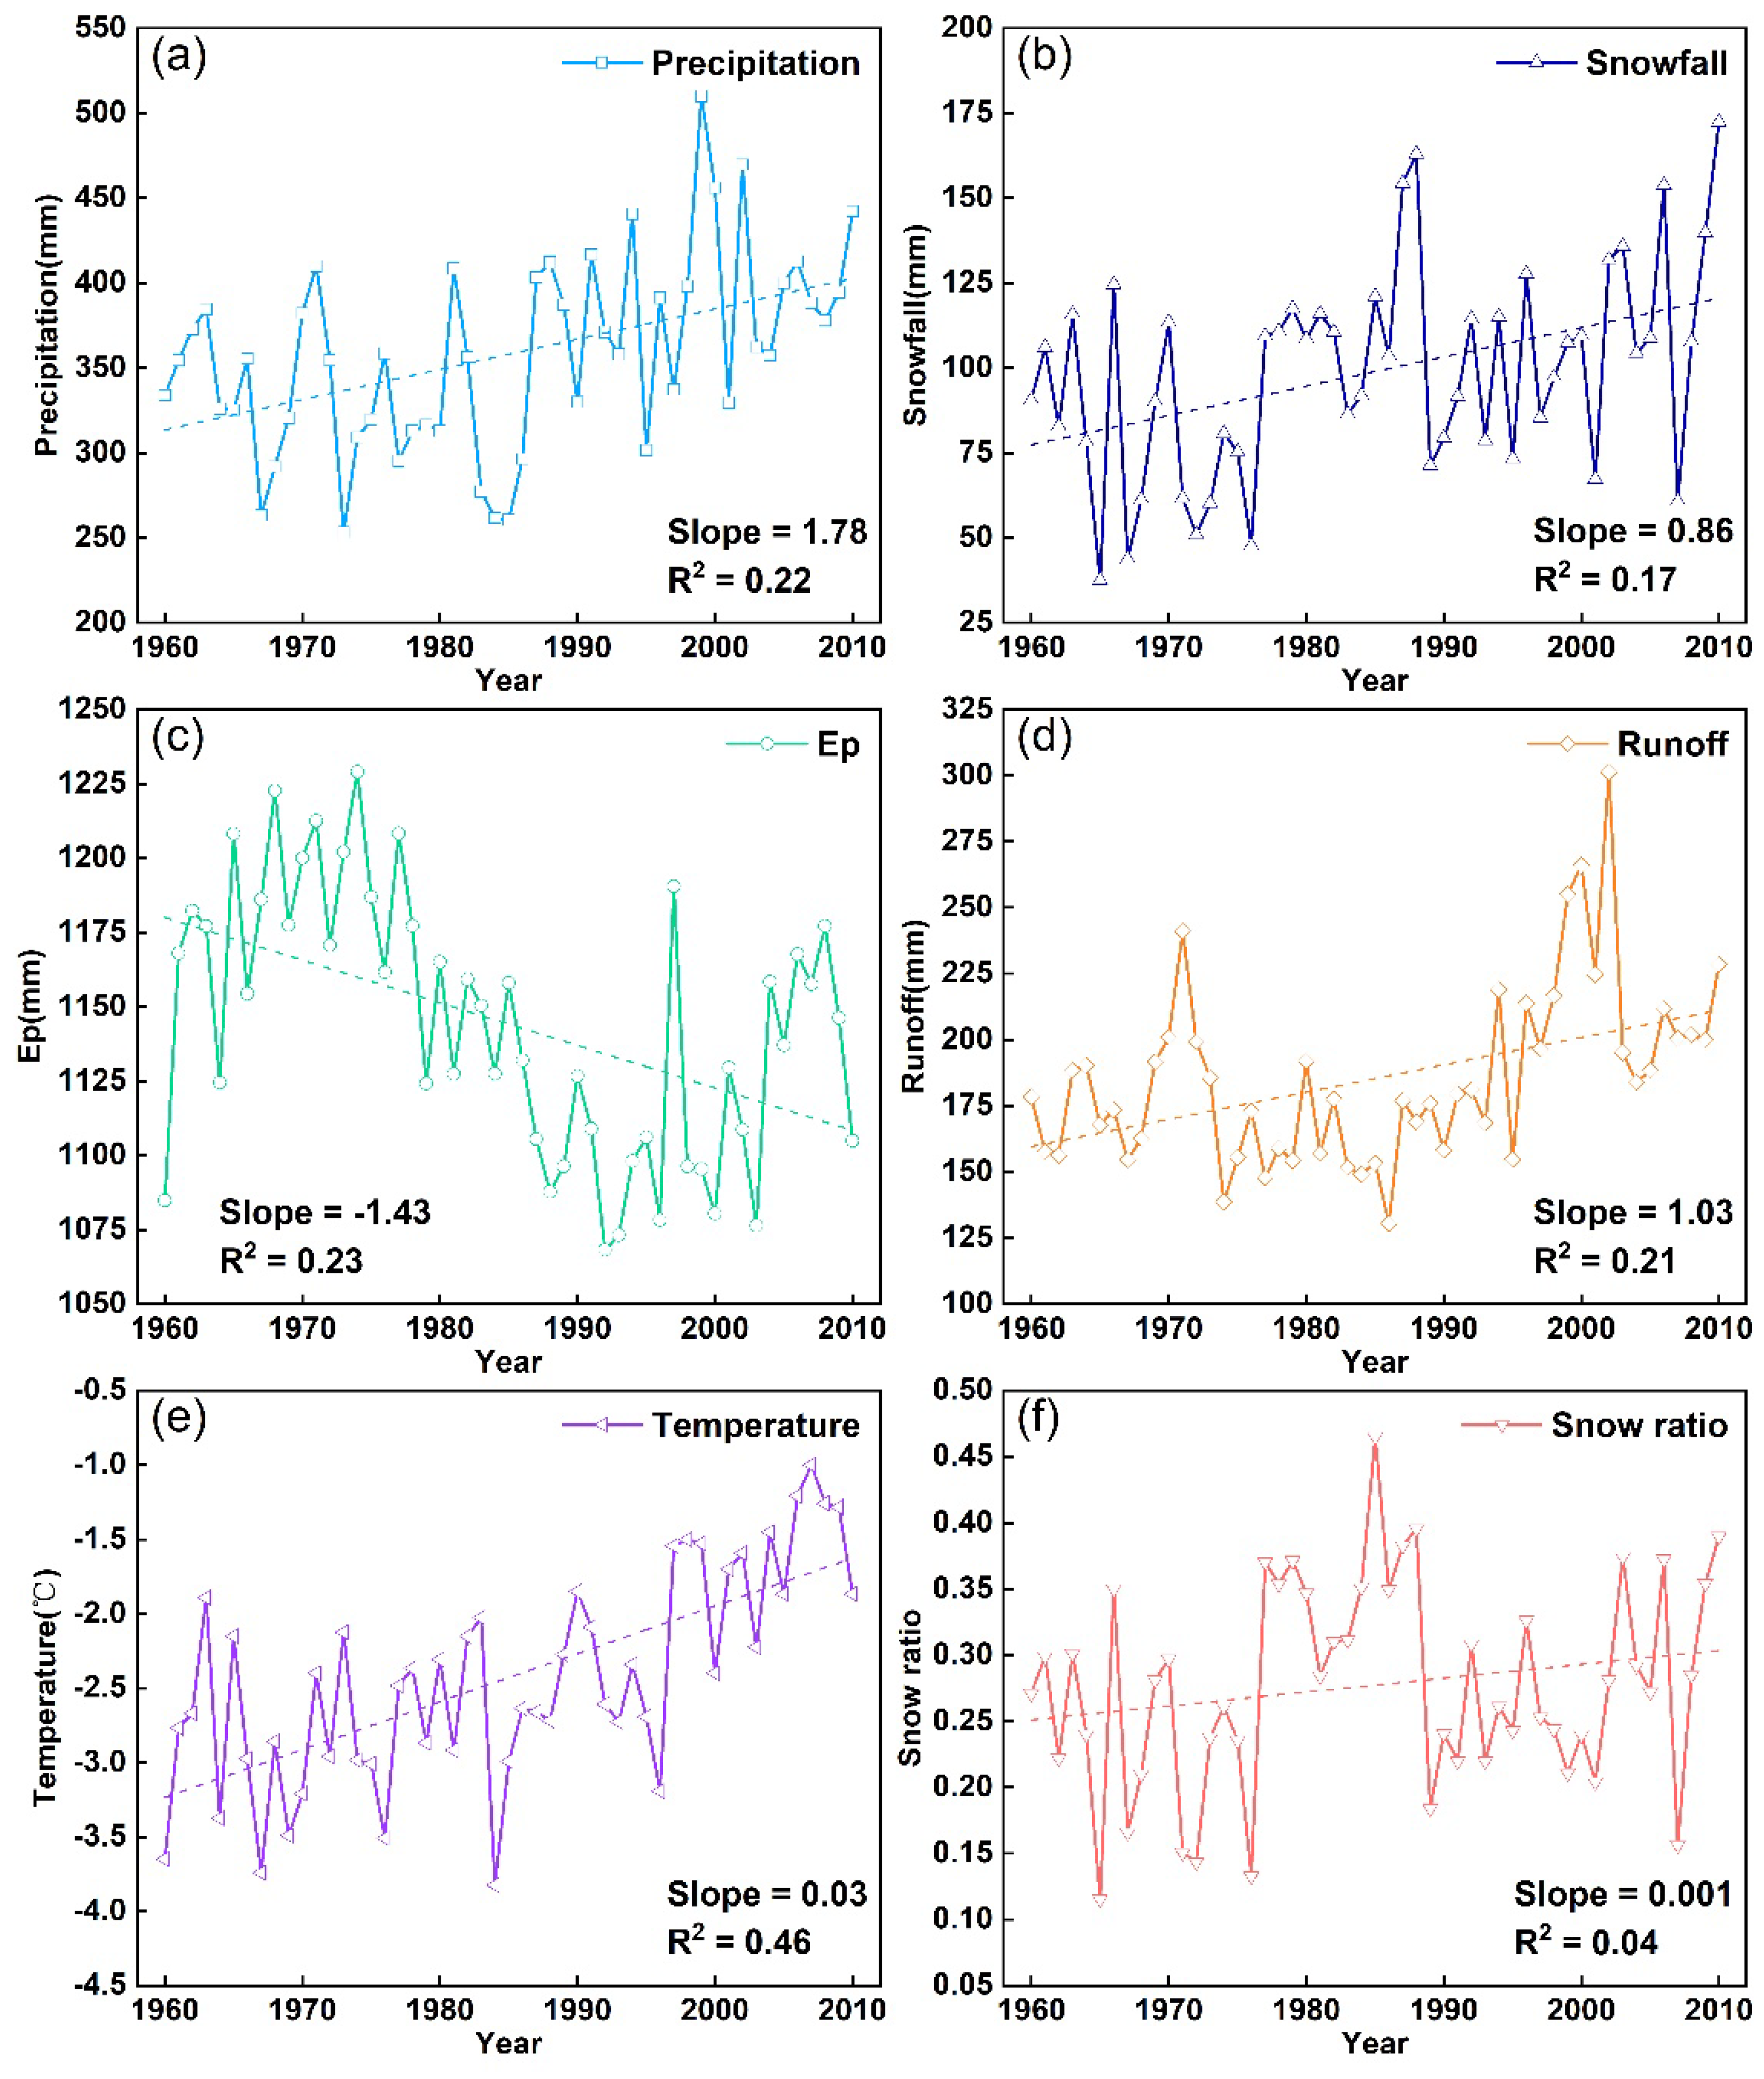
We firstly analyzed the trends in different climate factors, which helped us better understand their impacts on runoff. Figure 2 displays the long-term trends in annual precipitation, snowfall, EP, and runoff from 1960 to 2010. The annual precipitation, runoff, and average air temperature all showed a significant increasing trend, and the trend in annual precipitation was more obvious during the period of 1990–2010. The average values of annual precipitation, runoff, and air temperature were 358.1 mm, 185.4 mm, and −2.43 °C, with an increase of 17.8 mm, 10.3 mm, and 0.03 °C per decade, respectively. EP had a significant decreasing trend, and it declined by 16.6 mm every decade, and the average EP from 1960 to 2010 was 1144.2 mm. The average annual snowfall was 99 mm during the period of 1960–2010, with a variation of 8.6 mm per decade. The snow ratio in the period of 1960–2010 also increased.
We used the Mann-Kendall nonparametric test to analyze the trend of runoff. Figure 3a shows that the abrupt change point was 1995, and this result passed the test of significance at a 95% confidence level. Figure 3b shows that the accumulative value of runoff was at the lowest point in 1995. Therefore, the time series can be divided into two periods: 1960–1995 and 1996–2010 for analyzing the change in the runoff. The period from 1960 to 1996 is defined as the base period, and the period from 1996 to 2010 is defined as the change period. The parameter n in the two periods can be calculated by Equation (15). Table 2 shows the average value of annual precipitation, snowfall, air temperature, snow ratio, EP, runoff, parameter n, wind speed at 10 m, sunshine time, and relative humidity in the upper Kaidu River basin during the two periods. Table 3 summarizes the trends of these variables detected by the Mann-Kendall nonparametric test. Yin et al. found that the wind speed, net radiation, and relative humidity played a dominant role in the change of EP from 1964 to 1993 in northwestern China, and the wind speed and relative humidity played a dominant role in the change of EP from 1994 to 2018 [45]. A decrease in sunshine time and wind speed and an increase in relative humidity will lead to a decrease in EP [46]. Therefore, in spite of the increase in air temperature, the decrease in wind speed and sunshine hours, together with the increase in relative humidity in the change period compared with that in the base period (Table 2), caused a reduction in EP.
We also display the data in the two periods in the Budyko space. As shown in Figure 4, the data points in the base period and change period were in different Budyko curves. Compared with the base period, the dryness index (EP/P) in the change period decreased significantly, indicating a tendency for a warmer and wetter climate in the upper Kaidu River basin.
4.2. Attribution Analysis of Runoff Change
The climate factors (i.e., precipitation and EP) and landscape factor n in the two periods varied to different degrees (Table 2). Compared with the data in the base period, runoff, precipitation, and snow ratio in the change period increased by 28.76% (47.6 mm), 18.23% (62.0 mm), and 3.35% (0.009), respectively; EP and parameter n decreased by 2.12% (24.4 mm), and 3.39% (0.025), respectively.
As shown in Figure 5a,b, the increase in precipitation caused the runoff to increase by 38.7 mm, among which the contribution of snow ratio is 1.3 mm, and the corresponding contribution rates were 81.42% and 2.64%, respectively. The decrease in EP and n caused an increase in the runoff by 0.9 mm and 4.3 mm, respectively. Their contribution rates were estimated at 1.83% and 9.07%, respectively. The contribution rate of other factors to the runoff change was 7.68%. These results indicate that the change in precipitation dominated the increase in runoff in the upper reaches of the Kaidu River basin. Change in landscape represented by the alteration in parameter n was the secondary cause of runoff change, and the contribution rate of the landscape change was 9.07%. Change in EP had a quite limited impact on runoff change, which corresponded to the characteristics of arid or semi-arid regions, which was the water-limited region.
Figure 5c displays the effect of proportional changes in precipitation, snow ratio, EP, and parameter n on runoff change. During the base period, an increase of 1% in precipitation and snow ratio increased the runoff by 1.24% and 0.22%, respectively. In contrast, an increase of 1% in EP and parameter n reduced the runoff by 0.24% and 0.74%, respectively. During the change period, an increase of 1% in precipitation and snow ratio increased the runoff by 1.23% and 0.19%, respectively, and an increase of 1% in EP and parameter n, in contrast, reduced the runoff by 0.23% and 0.69%, respectively. The elasticity coefficient of runoff to precipitation was the largest among all the elasticity coefficients, and the parameter n had the second largest elasticity coefficient. Compared with the elasticity coefficients in the base period, the elasticity coefficients of runoff to precipitation, EP, rs, and parameter n in the change period were reduced by 0.81%, 4.17%, 13.64%, and 6.76%, respectively. This result indicates that the elasticity coefficient of runoff to precipitation did not change significantly in the two periods.
The results of the contribution rates and elasticity coefficients suggested there was a significant impact of precipitation change on runoff alteration, but the effects of other factors should not be ignored. Although the contribution rate of precipitation change was evidently larger than that of landscape change (parameter n), which seems to suggest that the precipitation had a much larger effect on runoff, we should note that the absolute value of their elasticity coefficients was not quite different. The relatively small difference between the elasticity coefficients of runoff to precipitation and landscape (parameter n) indicates that the sensitivity of runoff to landscape (parameter n) was close to that of precipitation. Meanwhile, the change rate of precipitation (18.23%) was larger than that of landscape (3.39%), which led to a further expansion in the difference in contribution rates of change in precipitation and landscape (Equation (19)). That was why the contribution rates and elasticity coefficients exhibited different conclusions when the sensitivity of runoff to different factors was similar, and this phenomenon also occurred between EP and snow ratio. In addition, the landscape is easily affected by human activities. Some studies proposed that the value of parameter n, which represents the landscape, was determined by vegetation coverage, soil property, slope, and land use [47,48,49]. The land use and vegetation coverage could be changed by humans in the short term. Several studies even argued that the parameter n could reflect the influence of human activity [50,51]. Therefore, we suggest that the impact of landscape change on runoff alteration is also important for water resources management in the upper Kaidu River basin.
4.3. The Influence of the Snowmelt on Runoff Change
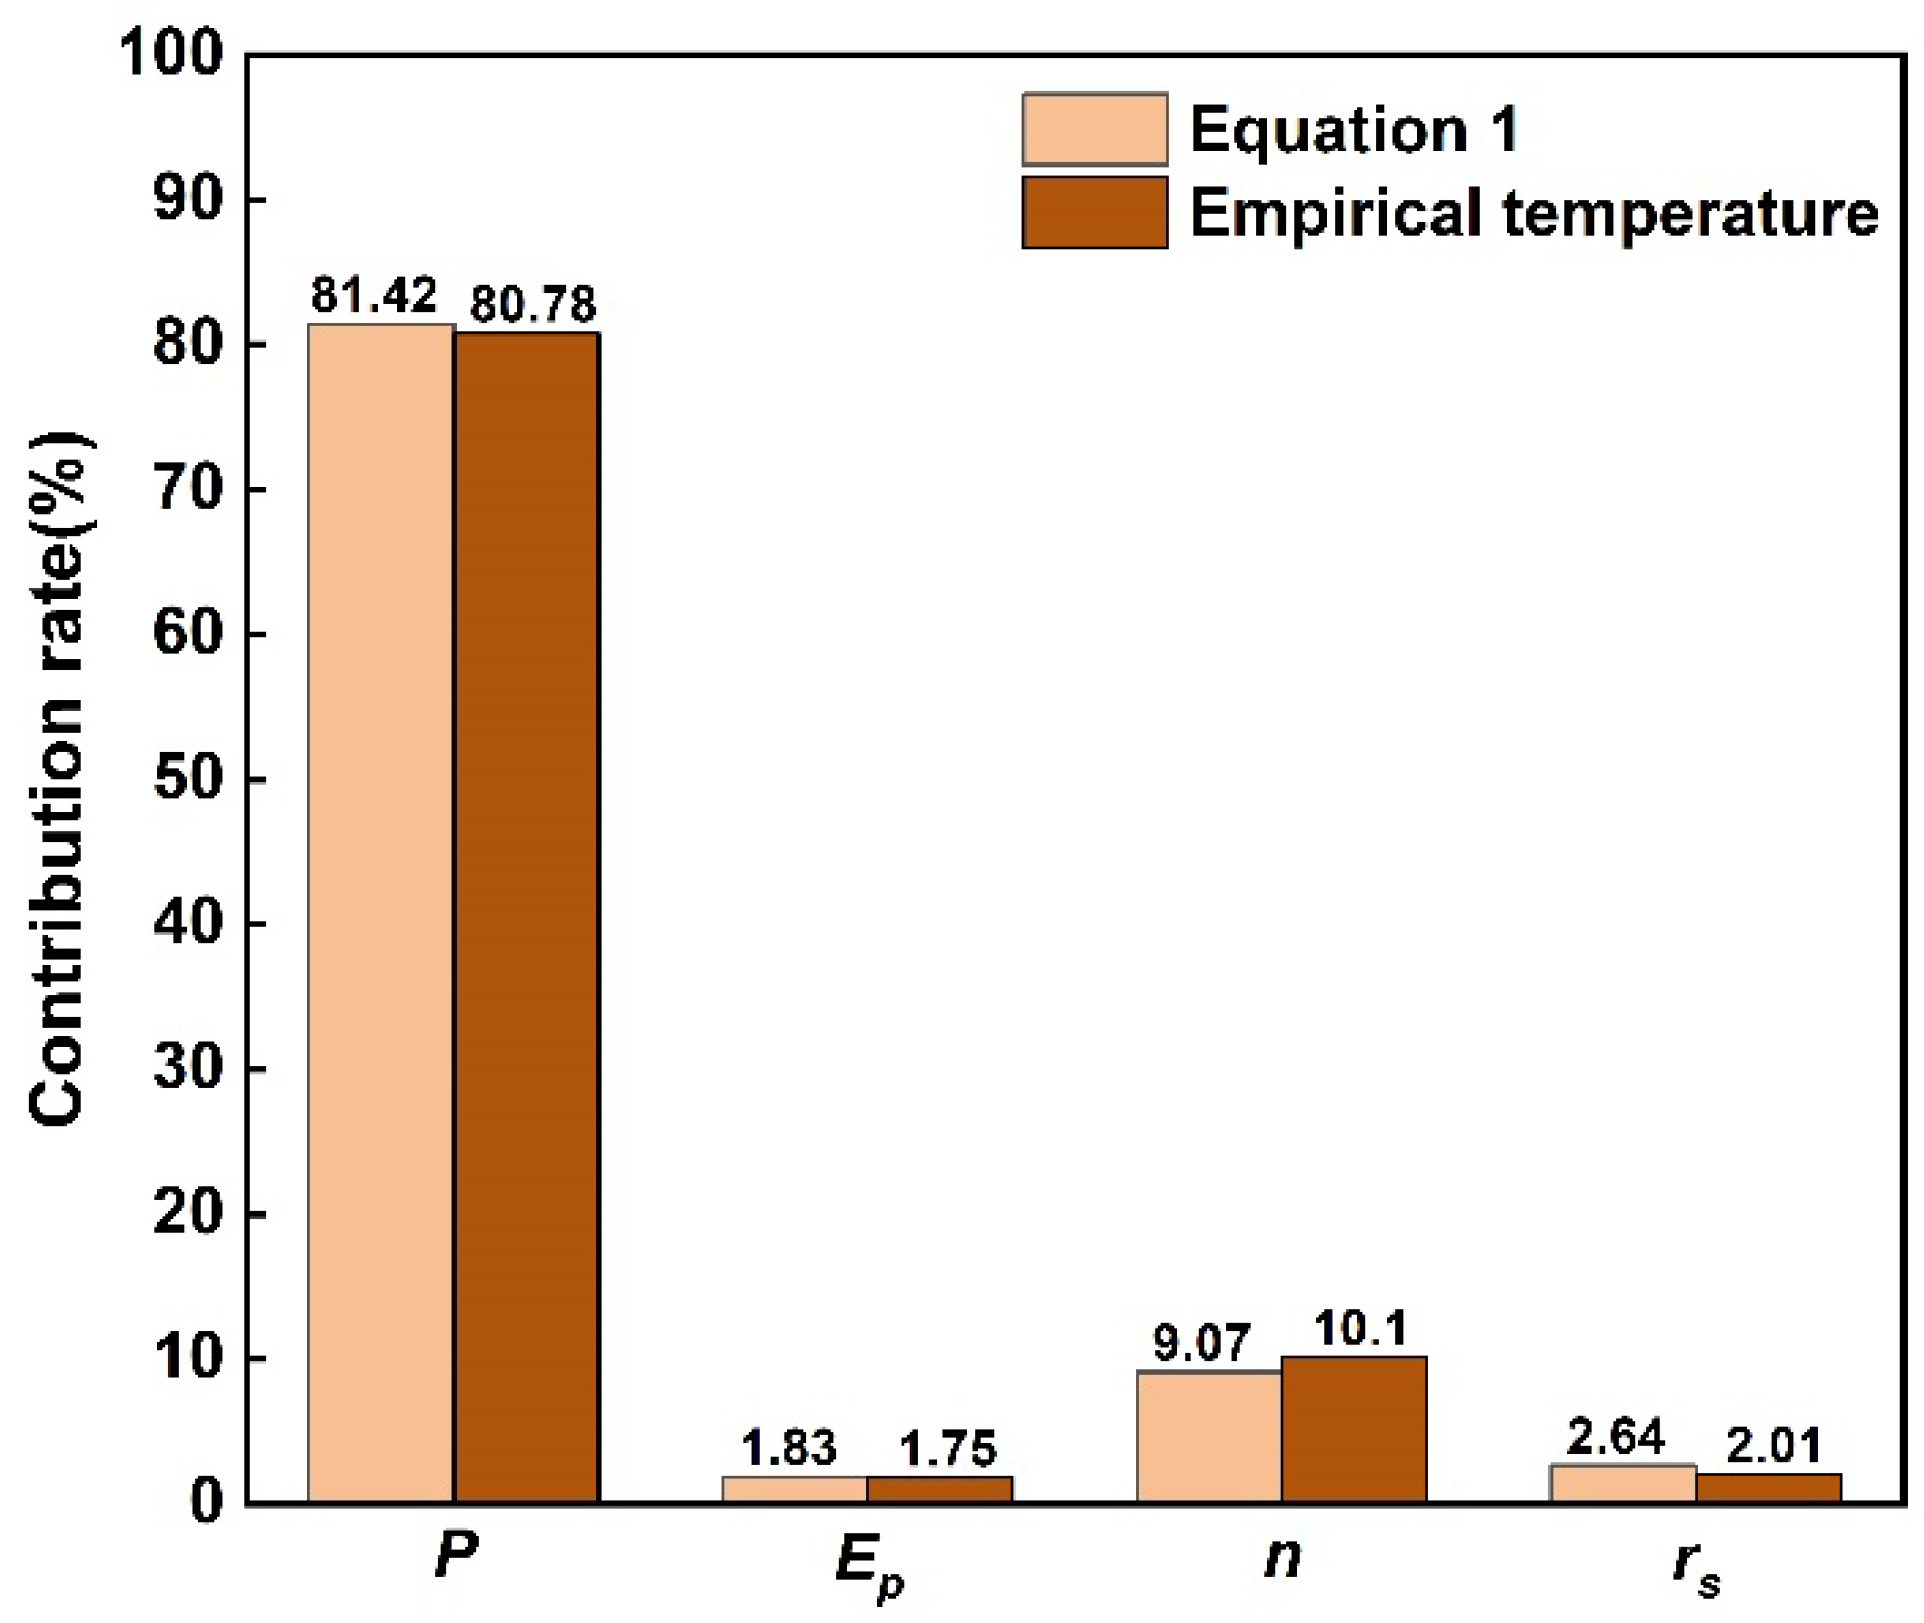
We compared the results of this study with that of the original Budyko framework without considering the snowmelt. The parameter n in the original Budyko framework during the base period and change period was 0.574 and 0.564, respectively. Figure 6 shows the contribution rates of different factors to runoff change in the original Budyko framework and the results of the modified Budyko framework in this study.
The contribution rates of precipitation, EP, and their total contribution rate in the original Budyko framework were larger than that in the modified Budyko framework; however, the contribution rate of parameter n in the original Budyko framework was less than that in the modified Budyko framework. For Equation (19), if factor x is precipitation, we can get the following equation at the interannual scale:
If the factor x is not precipitation, we can get another equation:
where ηx is the contribution rate of one factor to runoff change; is the contribution rate of one factor to evapotranspiration. When ΔP is greater than ΔR, ηP is negatively correlated with , and the absolute value of ηx is positively correlated with that of .
Considering that snowmelt did not participate in the evapotranspiration process, the water available for evapotranspiration was less than precipitation in the modified Budyko framework. At the same time, part of the energy was consumed by snowmelt, which reduced the available energy for evapotranspiration. The available energy is generally more than the available water in arid and semi-arid areas. The reduction of available water or energy increased the sensitivity of evapotranspiration to water and energy. If the available water was reduced nearly to zero and the available energy remained constant, evapotranspiration would be limited by the available water, and any increase in available water would cause an equivalent increase in evapotranspiration [17]. Similarly, if the available energy was reduced nearly to zero and the available water remained constant, the evapotranspiration would be limited by the available energy, and any increase in available energy would cause an equivalent increase in evapotranspiration (the water and energy limitation in Figure 4). However, if the available water and energy were reduced at the same time and the reduction of the available energy was much smaller than that of the available water, the change rate of evapotranspiration with available water () would increase, and that to available energy () would decrease in the original Budyko framework. When the snowmelt was considered, the available water and energy in the modified Budyko framework were less than that in the original Budyko framework, and the difference between available water was more than that between available energy. The value of and in the original Budyko framework were 0.331 and 0.049, respectively, while the values of and in the modified Budyko framework were 0.375 and 0.036, respectively. Therefore, although the corresponding factor changed by the same amount in the two frameworks, the contribution rate of precipitation change to evapotranspiration alteration in the modified Budyko framework was larger than that in the original Budyko framework, and the absolute value of the contribution rate of EP change to evapotranspiration alteration in the modified Budyko framework was smaller than that in the original Budyko framework. According to Equation (22), if the contribution of precipitation to evapotranspiration () increased, the contribution of precipitation to runoff (ηP) would decrease. Similarly, in Equation (24), if the contribution rate of EP to evapotranspiration (ηEp′) increased (the value of ηEp′ was negative), the contribution rate of EP to runoff (ηEp) would decrease. That was why the contribution rate of precipitation and EP in the original Budyko framework were larger than that in the modified Budyko framework.
The appearance of snow also influences the landscape characteristics (such as soil, vegetation coverage, etc.) [52,53], which was reflected in the differences between the parameter n in the original and modified Budyko framework. There was a complex relationship between snow and landscape characteristics [41]. The contribution rate of parameter n had a larger value in the modified Budyko framework, which might be the result of these multiple mechanisms.
4.4. The First-Order Hydro-Climatic Relationship
Figure 7 shows that the snow ratio elasticity coefficient of runoff has a positive correlation with the snow ratio. A larger snow ratio corresponded to a larger runoff elasticity coefficient. In the wet years, with a high snow ratio, the basin would get more runoff than the basin with a low snow ratio when the snow ratio increased. In dry years, the runoff loss of the basin with a low snow ratio would be less than that with a high snow ratio when the snow ratio decreased. Liu et al. [31] raised a hypothesis that a higher snow ratio might lead to annual streamflow increases in the wet year and decreases in the dry year. The snow ratio elasticity coefficient of runoff in the upper reaches of the Kaidu River basin might partially prove this hypothesis. However, the correlation between precipitation and snow ratio was still not fully clear and needed further study.
5. Discussion
5.1. Effects of Different Methods for Distinguishing Precipitation Types on the Results
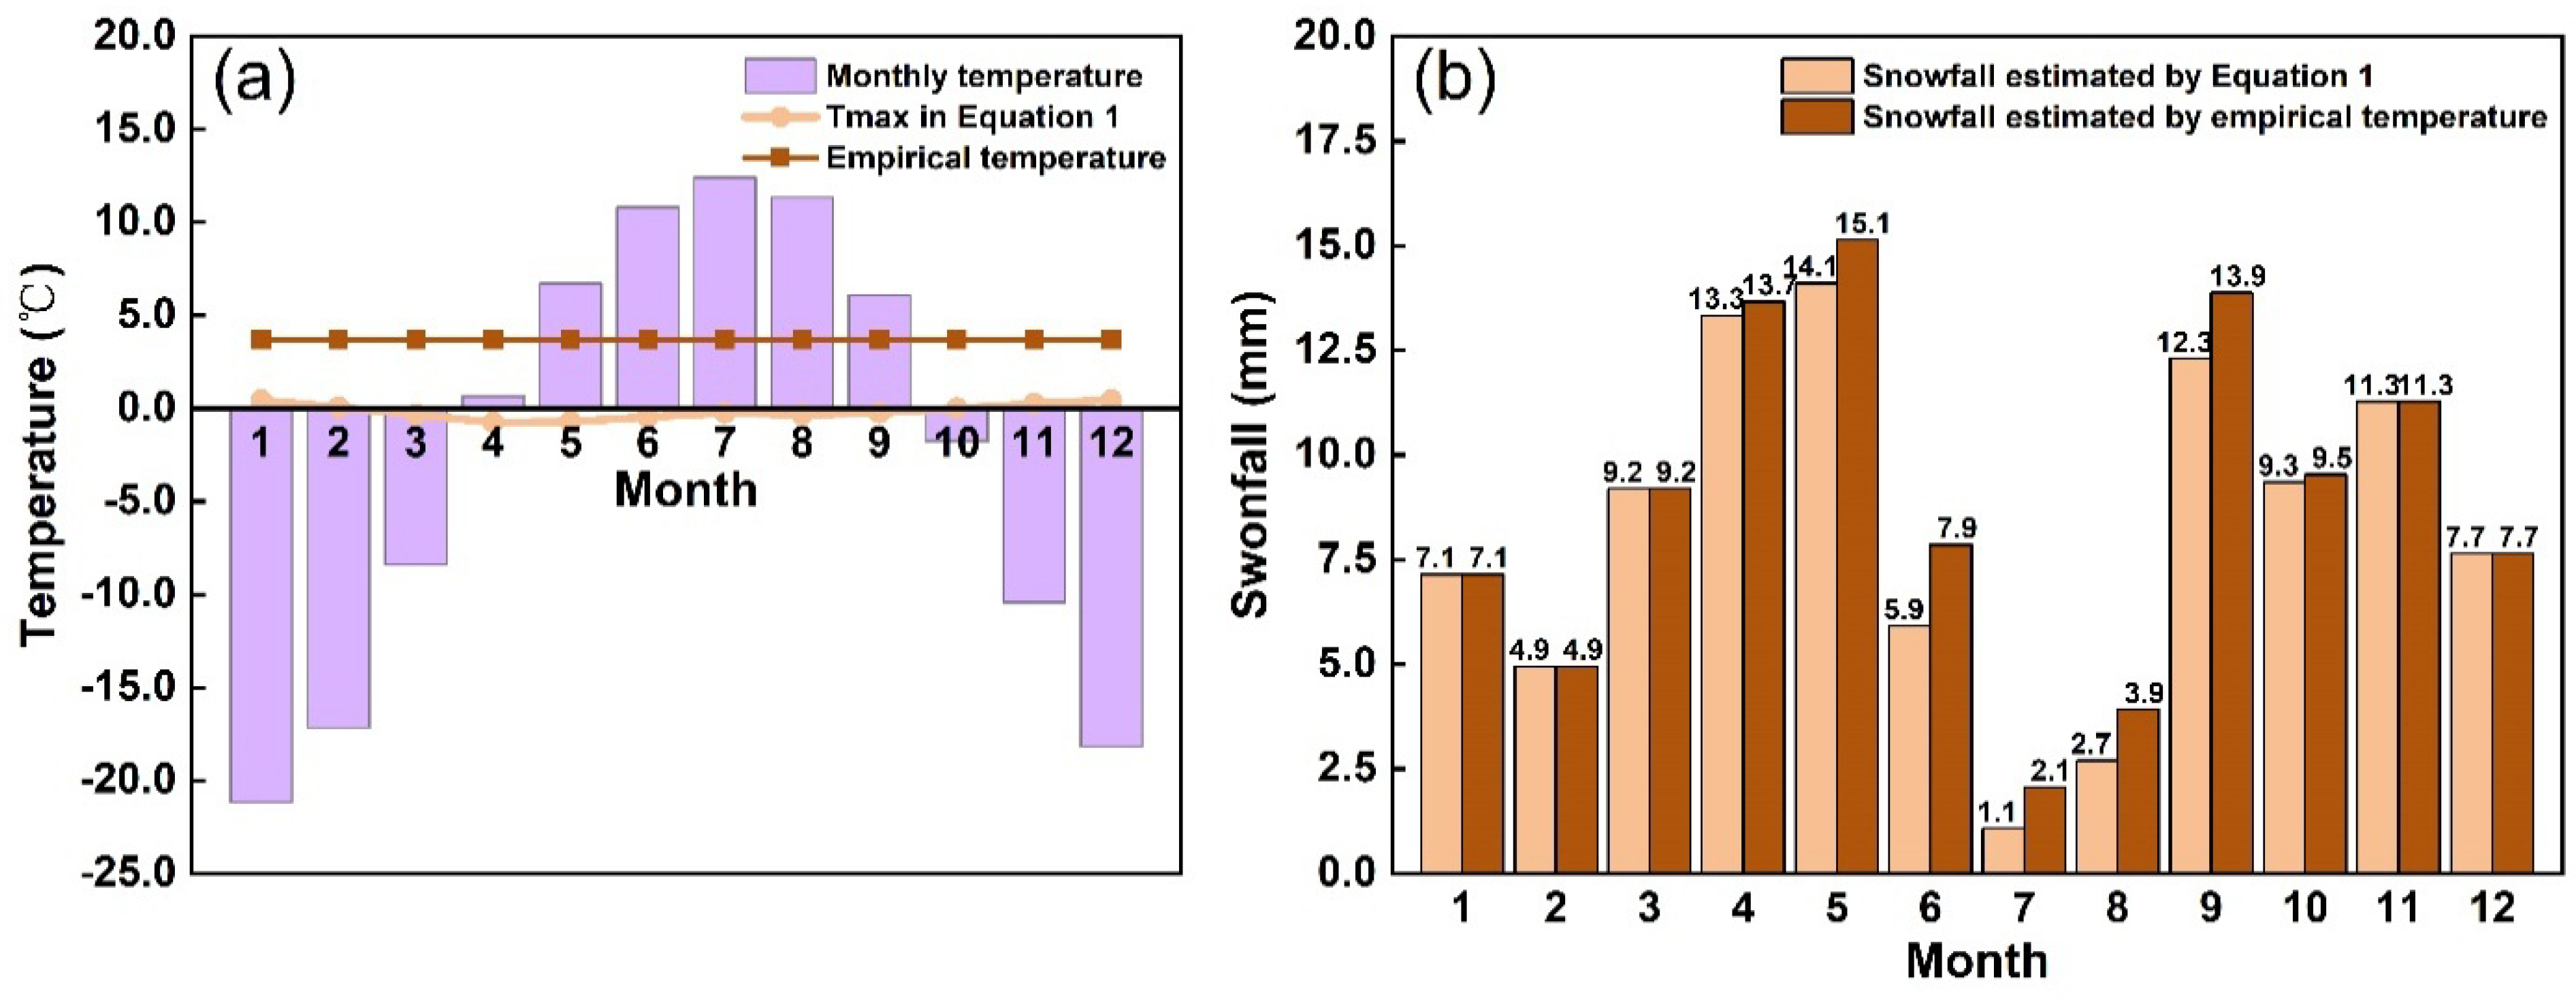
Han et al. [54] collected the air temperature and precipitation type data from 643 meteorological stations in China from 1961 to 1979 and summarized the critical temperature for distinguishing rainfall and snowfall in the whole country. The result showed that the critical temperature of rainfall and snowfall in northwestern China was about 3.70 °C (empirical temperature). Since we combined the amount of snowfall and sleet, the temperature that distinguished the precipitation types using Tw was equal to the Tmax in Equation (1) in this study. Then, we summarized the monthly average Tmax. Figure 8a indicates that the Tmax was smaller than the empirical temperature in all months.
We used the empirical temperature to distinguish the daily precipitation types and obtained the monthly and annual snowfall and snow ratios calculated by the empirical temperature. As shown in Table 4, compared with the result obtained by Equation (1), the snowfall calculated by the empirical temperature in the two periods increased by about 7.00 mm, and the snow ratio increased by about 0.02. The difference was derived from the identification of precipitation type at 0–3.7 °C. This phenomenon usually occurs in the warm season from May to September (Figure 8b). Although the snowfall was different, the changes in snow ratio in the two periods calculated by empirical temperature and Equation (1) were quite close. Moreover, the contribution rates of different factors to runoff change calculated by the two methods had little differences (Figure 9).
Equation (1) considered the altitude, air pressure, and humidity of each grid to determine the precipitation type, which was more comprehensive and had high precision. The empirical temperature was determined by the records from meteorological stations and was more convenient for application. However, the complex topography and the lack of in situ observations might make the records in mountain areas less representative and then affect the results. Therefore, we recommended using Equation (1) to estimate snowfall in northwest China.
5.2. The Physical Response of Runoff to Different Variables
The runoff is greatly influenced by precipitation, and the increase in precipitation in the change period directly enhances the runoff. Padrón et al. [48] found that the parameter n was related to the landscape conditions. The vegetation coverage is the main factor influencing the parameter n [49]. Yang et al. [55] suggested that the increase in the parameter n represented an increase in vegetation coverage, and the increase in vegetation coverage would lead to a decrease in runoff in arid or semi-arid regions. Therefore, the decrease in parameter n in the study basin indicated a reduction in the vegetation coverage from the base period to the change period, which was consistent with the decreasing trend of NDVI from 1998 to 2012 in northwestern China [56]. The degradation of vegetation will result in the reduction of canopy interception and a decrease in transpiration, which is conducive to runoff generation.
The accumulated snowfall in the snow season will extensively melt into liquid water in the melting season. In the early stage of the melting season, the unfrozen ground makes it difficult for the meltwater to infiltrate [57]. Therefore, the increase in air temperature and snowfall during the change period led to the increase in snowmelt, which directly enhanced the surface runoff and total runoff.
5.3. Uncertainties and Limitations
There are still some limitations in this study. The framework used in this study ignored some terms in water balance. Zhu et al. [58] analyzed and compared the two glacier survey data in 1970 and 2009 and found that the numbers of glaciers in the Kaidu River basin decreased by 103, and the reserves decreased by 8.81 km3 in 40 years. Sorg et al. [59] measured ice-snow meltwater in the Tianshan Mountains, and their results showed that the contribution rate of glacier meltwater variation to runoff change was between 3.5% and 67.5%. However, because of lacking long term and high-quality available observed data for glaciers, we could not accurately quantify the process of glacier change and link it to the Budyko framework, which was a limitation in this study and needed future investigation.
Some assumptions adopted by the modified Budyko framework might also cause uncertainties. The sublimation of snow cover in the snow season was ignored in this study. However, the fraction of the sublimation losses in different locations was between 10% and 90% in winter [60]. In a small basin, the snow water could reach confluence quickly with little evaporation loss. In fact, this part of evaporation loss was borne by precipitation, causing the precipitation involved in the evapotranspiration circulation to be lower than the actual value. In addition, we neglected the catchment groundwater storage change in the basin at an interannual scale. These factors might lead to uncertainties in the estimation of available water and available energy.
On the other hand, the analysis framework in this study ignored the relationship between different factors. In addition to the direct effect of different factors on runoff, the coupling and interactions of different related factors also had an indirect effect on runoff [61]. Evidently, this framework could not quantify these indirect effects, which needs further studies to improve the framework.
6. Conclusions
This study analyzed the long-term change in runoff in the upper reaches of the Kaidu River basin from 1960 to 2010 using a modified Budyko framework that considered the snowmelt. Based on the contribution rate and elasticity coefficient of runoff estimated by the modified Budyko framework, the influence of different factors on runoff change was evaluated, and the mechanism between snow ratio change and runoff alteration was discussed. The major findings are as follows:
- (1)
- From 1960 to 2010, the precipitation, snowfall, air temperature, and runoff exhibited an upward trend in the upper reaches of the Kaidu River basin, while EP showed a downward trend, but the snowfall ratio did not change significantly. In the two periods divided by 1995, the relative change in runoff was evident.
- (2)
- From the base period to the change period, the runoff increased by 27.76%. The major factor leading to the increase in runoff was the change in precipitation, whose contribution rate was 81.42%. The contributions of landscape, snow ratio, and EP change to the runoff alteration accounted for 9.07%, 2.64%, and 1.83%, respectively. The elasticity coefficients of runoff to precipitation, landscape, snow ratio, and EP in the base period were 1.24, −0.74, 0.22, and −0.24, and that in the change period were 1.23, −0.69, 0.19, and −0.23, respectively.
- (3)
- Compared with the original Budyko framework, the contribution of precipitation and EP to the runoff change decreased, and that of landscape increased after considering the snowmelt in the modified Budyko framework. This is because the snowmelt did not participate in the evapotranspiration process, which altered the water-energy condition.
- (4)
- A larger snow ratio led to a larger runoff elasticity coefficient, suggesting that the variation of runoff increases with the increase in the snow ratio.
The results of this study helped us to better understand the response of runoff to the climate and landscape changes in the upper reaches of the Kaidu River basin. The modified Budyko framework used in this study can be applied to other mountain catchments, and it also needs further improvement to better describe the effect of complex cryosphere processes in cold regions.
Author Contributions
Conceptualization, B.G.; Data curation, G.S.; Formal analysis, G.S.; Investigation, G.S.; Methodology, B.G.; Resources, B.G.; Software, G.S.; Supervision, B.G.; Validation, G.S.; Writing—original draft, G.S.; Writing—review and editing, B.G. All authors have read and agreed to the published version of the manuscript.
Funding
This research was supported by grants from the National Natural Science Foundation of China (Grant No. 41661144031).
Institutional Review Board Statement
Not applicable.
Informed Consent Statement
Not applicable.
Data Availability Statement
The 0.25° resolution gridded data set of precipitation is available from the National Meteorological Information Center of China (http://cdc.nmic.cn, accessed on 10 April 2021). The DEM data with a 90 m spatial resolution are obtained from the Shuttle Radar Topography Mission (SRTM) dataset (http://srtm.csi.cgiar.org, accessed on 20 October 2020). The land use data are derived from the remote sensing monitoring database of land use status in China provided by the Resource and Environmental Science and Data Center (http://www.resdc.cn, accessed on 26 March 2021). The other data that support the findings of this study are available from the corresponding author upon reasonable request.
Acknowledgments
All the tables and figures are created by authors. We thank Wang Xu-Sheng at China University of Geosciences, Beijing, China, for his help with data collection.
Conflicts of Interest
The authors declare no conflict of interest.
References
- Barnett, T.P.; Adam, J.C.; Lettenmaier, D.P. Potential impacts of a warming climate on water availability in snow-dominated regions. Nature 2005, 438, 303–309. [Google Scholar] [CrossRef] [PubMed]
- Masson-Delmotte, V.; Zhai, P.; Pirani, A.; Connors, S.L.; Péan, C.; Berger, S.; Caud, N.; Chen, Y.; Goldfarb, L.; Gomis, M.I.; et al. (Eds.) IPCC, 2021: Summary for Policymakers. In Climate Change 2021: The Physical Science Basis. Contribution of Working Group I to the Sixth Assessment Report of the Intergovernmental Panel on Climate Change; Cambridge University Press: Cambridge, UK; New York, NY, USA, 2021; pp. 3–32. [Google Scholar]
- Elsner, M.M.; Cuo, L.; Voisin, N.; Deems, J.S.; Hamlet, A.F.; Vano, J.A.; Mickelson, K.E.B.; Lee, S.-Y.; Lettenmaier, D.P. Implications of 21st century climate change for the hydrology of Washington State. Clim. Chang. 2010, 102, 225–260. [Google Scholar] [CrossRef]
- Milner, A.M.; Brown, L.E.; Hannah, D.M. Hydroecological response of river systems to shrinking glaciers. Hydrol. Process. 2009, 23, 62–77. [Google Scholar] [CrossRef]
- Wu, S.; Zhang, X.; Du, J.; Wang, H. Evaluating the different responses to climatic factors between snow water equivalent and snow cover area in the Central Tianshan Mountains. Theor. Appl. Climatol. 2022, 148, 1563–1576. [Google Scholar] [CrossRef]
- Adam, J.C.; Hamlet, A.F.; Lettenmaier, D.P. Implications of global climate change for snowmelt hydrology in the twenty-first century. Hydrol. Process. 2009, 23, 962–972. [Google Scholar] [CrossRef]
- Nohara, D.; Kitoh, A.; Hosaka, M.; Oki, T. Impact of climate change on river discharge projected by multimodel ensemble. J. Hydrometeorol. 2006, 7, 1076–1089. [Google Scholar] [CrossRef]
- Barnhart, T.B.; Molotch, N.P.; Livneh, B.; Harpold, A.A.; Knowles, J.F.; Schneider, D. Snowmelt rate dictates streamflow. Geophys. Res. Lett. 2016, 43, 8006–8016. [Google Scholar] [CrossRef]
- Sexstone, G.A.; Driscoll, J.M.; Hay, L.E.; Hammond, J.C.; Barnhart, T.B. Runoff sensitivity to snow depletion curve representation within a continental scale hydrologic model. Hydrol. Process. 2020, 34, 2365–2380. [Google Scholar] [CrossRef]
- Kure, S.; Jang, S.; Ohara, N.; Kavvas, M.L.; Chen, Z.Q. Hydrologic impact of regional climate change for the snow-fed and glacier-fed river basins in the Republic of Tajikistan: Statistical downscaling of global climate model projections. Hydrol. Process. 2013, 27, 4071–4090. [Google Scholar] [CrossRef]
- Xiang, Y.; Wang, Z.; Zhang, H.; Chen, Y. Study of snowmelt runoff simulation in arid regions: Progress and prospect. J. Glaciol. Geocryol. 2017, 39, 892–901. [Google Scholar]
- Immerzeel, W.W.; van Beek, L.P.; Bierkens, M.F. Climate change will affect the Asian water towers. Science 2010, 328, 1382–1385. [Google Scholar] [CrossRef]
- Liu, J.; Long, A.; Deng, X.; Yin, Z.; Deng, M.; An, Q.; Gu, X.; Li, S.; Liu, G. The Impact of Climate Change on Hydrological Processes of the Glacierized Watershed and Projections. Remote Sens. 2022, 14, 1314. [Google Scholar] [CrossRef]
- Xie, J.; Xu, Y.-P.; Guo, Y.; Wang, Y. Detecting the dominant contributions of runoff variance across the source region of the Yellow River using a new decomposition framework. Hydrol. Res. 2021, 52, 1015–1032. [Google Scholar] [CrossRef]
- Budyko, M.I. Climate and Life; Academic Press: New York, NY, USA, 1974. [Google Scholar]
- Fu, B.P. On the calculation of the evaporation from land surface. Sci. Atmos. Sin. 1981, 5, 23–31. [Google Scholar]
- Zhang, L.; Hickel, K.; Dawes, W.R.; Chiew, F.H.S.; Western, A.W.; Briggs, P.R. A rational function approach for estimating mean annual evapotranspiration. Water Resour. Res. 2004, 40, W02502. [Google Scholar] [CrossRef]
- Greve, P.; Gudmundsson, L.; Orlowsky, B.; Seneviratne, S.I. A two-parameter Budyko function to represent conditions under which evapotranspiration exceeds precipitation. Hydrol. Earth Syst. Sci. 2016, 20, 2195–2205. [Google Scholar] [CrossRef]
- De Lavenne, A.; Andréassian, V. Impact of climate seasonality on catchment yield: A parameterization for commonly-used water balance formulas. J. Hydrol. 2018, 558, 266–274. [Google Scholar] [CrossRef]
- Bai, L.; Chen, Z.; Xu, J.; Li, W. Multi-scale response of runoff to climate fluctuation in the headwater region of Kaidu River in Xinjiang of China. Theor. Appl. Climatol. 2015, 125, 703–712. [Google Scholar] [CrossRef]
- Liu, Y.; Bao, A.; Chen, X.; Zhong, R. A Model Study of the Discharges Effects of Kaidu River on the Salinity Structure of Bosten Lake. Water 2018, 11, 8. [Google Scholar] [CrossRef]
- Shen, Y.J.; Shen, Y.; Fink, M.; Kralisch, S.; Brenning, A. Unraveling the Hydrology of the Glacierized Kaidu Basin by Integrating Multisource Data in the Tianshan Mountains, Northwestern China. Water Resour. Res. 2018, 54, 557–580. [Google Scholar] [CrossRef]
- Zhang, Y.; Li, B.; Bao, A.; Zhou, C.; Chen, X.; Zhang, X. Study on snowmelt runoff simulation in the Kaidu River basin. Sci. China Ser. D Earth Sci. 2007, 50, 26–35. [Google Scholar] [CrossRef]
- Stewart, I.T. Changes in snowpack and snowmelt runoff for key mountain regions. Hydrol. Process. 2009, 23, 78–94. [Google Scholar] [CrossRef]
- Song, Y.; Zuo, Q.; Ma, J. Variation and dynamic drivers of drought in Kaidu River Basin based on the SWAT model. Arid Zone Res. 2021, 38, 610–617. [Google Scholar]
- Hao, Y.; Sun, F.; Wang, H.; Liu, W.; Shen, Y.-J.; Li, Z.; Hu, S. Understanding climate-induced changes of snow hydrological processes in the Kaidu River Basin through the CemaNeige-GR6J model. Catena 2022, 212, 106082. [Google Scholar] [CrossRef]
- Basher, M.A.; Liu, T.; Kabir, M.A.; Ntegeka, V.; Willems, P. Climate change impact on the hydrological extremes in the Kaidu river basin, China. J. Flood Eng. 2010, 1, 93–108. [Google Scholar]
- Chen, Z.; Chen, Y. Effects of climate fluctuations on runoff in the headwater region of the Kaidu River in northwestern China. Front. Earth Sci. 2014, 8, 309–318. [Google Scholar] [CrossRef]
- Zhuang, X.W.; Li, Y.P.; Huang, G.H.; Liu, J. Assessment of climate change impacts on watershed in cold-arid region: An integrated multi-GCM-based stochastic weather generator and stepwise cluster analysis method. Clim. Dyn. 2015, 47, 191–209. [Google Scholar] [CrossRef]
- Gordon, B.L.; Brooks, P.D.; Krogh, S.A.; Boisrame, G.F.S.; Carroll, R.W.H.; McNamara, J.P.; Harpold, A.A. Why does snowmelt-driven streamflow response to warming vary? A data-driven review and predictive framework. Environ. Res. Lett. 2022, 17, 053004. [Google Scholar] [CrossRef]
- Liu, Z.; Wang, T.; Han, J.; Yang, W.; Yang, H. Decreases in Mean Annual Streamflow and Interannual Streamflow Variability Across Snow-Affected Catchments Under a Warming Climate. Geophys. Res. Lett. 2022, 49, e2021GL097442. [Google Scholar] [CrossRef]
- Tao, H.; Wang, G.; Shao, C.; Song, Y.; Zou, S. Climate Change and Its Effects on Runoff at the Headwater of Kaidu River. J. Glaciol. Geocryol. 2007, 29, 413–417. [Google Scholar]
- Xie, Y.; Zhu, J. Hydrological Characteristics of Kaidou River Basin. Hydrology 2011, 31, 92–96. [Google Scholar]
- Xu, J.; Chen, Y.; Ji, M.; Lu, F. Climate change and its effects on runoff of Kaidu River, Xinjiang, China: A multiple time-scale analysis. Chin. Geogr. Sci. 2008, 18, 331–339. [Google Scholar] [CrossRef]
- Shen, Y.; Su, H.; Wang, G.; Mao, W.; Wang, S.; Han, P.; Wang, N.; Li, Z. The Responses of Glaciers and Snow Cover to Climate Change in Xinjiang(I): Hydrological Effect. J. Glaciol. Geocryol. 2013, 35, 513–527. [Google Scholar]
- Ding, B.; Yang, K.; Qin, J.; Wang, L.; Chen, Y.; He, X. The dependence of precipitation types on surface elevation and meteorological conditions and its parameterization. J. Hydrol. 2014, 513, 154–163. [Google Scholar] [CrossRef]
- Pereira, L.S.; Allen, R.G.; Smith, M.; Raes, D. Crop evapotranspiration estimation with FAO56: Past and future. Agric. Water Manag. 2015, 147, 4–20. [Google Scholar] [CrossRef]
- Xin, J.; Sun, X.; Liu, L.; Li, H.; Liu, X.; Li, X.; Cheng, L.; Xu, Z. Quantifying the contribution of climate and underlying surface changes to alpine runoff alterations associated with glacier melting. Hydrol. Process. 2021, 35, e14069. [Google Scholar] [CrossRef]
- Yang, H.; Yang, D.; Lei, Z.; Sun, F. New analytical derivation of the mean annual water-energy balance equation. Water Resour. Res. 2008, 44, W03410. [Google Scholar] [CrossRef]
- Du, C.; Sun, F.; Yu, J.; Liu, X.; Chen, Y. New interpretation of the role of water balance in an extended Budyko hypothesis in arid regions. Hydrol. Earth Syst. Sci. 2016, 20, 393–409. [Google Scholar] [CrossRef]
- Zhang, D.; Cong, Z.; Ni, G.; Yang, D.; Hu, S. Effects of snow ratio on annual runoff within the Budyko framework. Hydrol. Earth Syst. Sci. 2015, 19, 1977–1992. [Google Scholar] [CrossRef]
- Anderson, E.A. Development and testing of snow pack energy balance equations. Water Resour. Res. 1968, 4, 19–37. [Google Scholar] [CrossRef]
- Fu, G.; Charles, S.P.; Chiew, F.H.S. A two-parameter climate elasticity of streamflow index to assess climate change effects on annual streamflow. Water Resour. Res. 2007, 43, W11419. [Google Scholar] [CrossRef]
- Dey, P.; Mishra, A. Separating the impacts of climate change and human activities on streamflow: A review of methodologies and critical assumptions. J. Hydrol. 2017, 548, 278–290. [Google Scholar] [CrossRef]
- Yin, X.; Wu, Y.; Zhao, W.; Zhao, F.; Sun, P.; Song, Y.; Qiu, L. Drought characteristics and sensitivity of potential evapotranspiration to climatic factors in the arid and semi-arid areas of northwest China. Hydrogeol. Eng. Geol. 2021, 48, 20–30. [Google Scholar]
- Ni, G.; Li, X.; Cong, Z.; Sun, F.; Liu, Y. Temporal and spatial characteristics of reference evapotranspiration in China. Trans. Chin. Soc. Agric. Eng. 2006, 22, 1–4. [Google Scholar]
- Zhang, S.; Yang, Y.; McVicar, T.R.; Yang, D. An Analytical Solution for the Impact of Vegetation Changes on Hydrological Partitioning within the Budyko Framework. Water Resour. Res. 2018, 54, 519–537. [Google Scholar] [CrossRef]
- Padrón, R.S.; Gudmundsson, L.; Greve, P.; Seneviratne, S.I. Large-Scale Controls of the Surface Water Balance over Land: Insights from a Systematic Review and Meta-Analysis. Water Resour. Res. 2017, 53, 9659–9678. [Google Scholar] [CrossRef]
- Xu, X.; Liu, W.; Scanlon, B.R.; Zhang, L.; Pan, M. Local and global factors controlling water-energy balances within the Budyko framework. Geophys. Res. Lett. 2013, 40, 6123–6129. [Google Scholar] [CrossRef]
- Ning, T.; Li, Z.; Feng, Q.; Liu, W.; Li, Z. Comparison of the effectiveness of four Budyko-based methods in attributing long-term changes in actual evapotranspiration. Sci. Rep. 2018, 8, 12665. [Google Scholar] [CrossRef] [PubMed]
- Wu, L.; Wang, L.; Li, C.; Zhang, Y.; Wei, J.; Xie, X.; Lv, J. Separating the contributions of climate change and human activities to regional AET variability by using a developed analytical framework. Stoch. Environ. Res. Risk Assess. 2020, 34, 1831–1845. [Google Scholar] [CrossRef]
- Wilson, G.; Green, M.; Brown, J.; Campbell, J.; Groffman, P.; Durán, J.; Morse, J. Snowpack affects soil microclimate throughout the year. Clim. Chang. 2020, 163, 705–722. [Google Scholar] [CrossRef]
- Lu, Z.; Peng, S.; Slette, I.; Cheng, G.; Li, X.; Chen, A. Soil moisture seasonality alters vegetation response to drought in the Mongolian Plateau. Environ. Res. Lett. 2021, 16, 014050. [Google Scholar] [CrossRef]
- Han, C.; Chen, R.; Liu, J.; Yang, Y.; Qing, W. A Discuss of the Separating Solid and Liquid Precipitations. J. Glaciol. Geocryol. 2010, 32, 249–256. [Google Scholar]
- Yang, D.; Shao, W.; Yeh, P.J.F.; Yang, H.; Kanae, S.; Oki, T. Impact of vegetation coverage on regional water balance in the nonhumid regions of China. Water Resour. Res. 2009, 45, W00A14. [Google Scholar] [CrossRef]
- Du, J.; Jiaerheng, A.; Zhao, C.; Fang, G.; Yin, J.; Xiang, B.; Yuan, X.; Fang, S. Dynamic changes in vegetation NDVI from 1982 to 2012 and its responses to climate change and human activities in Xinjiang, China. J. Appl. Ecol. 2015, 26, 3567–3578. [Google Scholar]
- Tian, L.; Li, H.; Li, F.; Li, X.; Du, X.; Ye, X. Identification of key influence factors and an empirical formula for spring snowmelt-runoff: A case study in mid-temperate zone of northeast China. Sci. Rep. 2018, 8, 16950. [Google Scholar] [CrossRef]
- Zhu, W.; Shangguan, D.; Guo, W.; Xu, J. Glaciers in some representative basins in the middle of the Tianshan Mountains: Change and response to climate change. J. Glaciol. Geocryol. 2014, 36, 1376–1384. [Google Scholar]
- Sorg, A.; Bolch, T.; Stoffel, M.; Solomina, O.; Beniston, M. Climate change impacts on glaciers and runoff in Tien Shan (Central Asia). Nat. Clim. Chang. 2012, 2, 725–731. [Google Scholar] [CrossRef]
- Strasser, U.; Bernhardt, M.; Weber, M.; Liston, G.E.; Mauser, W. Is snow sublimation important in the alpine water balance? Cryosphere 2008, 2, 53–66. [Google Scholar] [CrossRef]
- Xu, Z.; Cheng, L.; Liu, P.; Makarieva, O.; Chen, M. Detecting and quantifying the impact of long-term terrestrial water storage changes on the runoff ratio in the head regions of the two largest rivers in China. J. Hydrol. 2021, 601, 126668. [Google Scholar] [CrossRef]
Figure 1.
The topography and river network in the upper reaches of the Kaidu River basin (a); the stations in and around the basin (b).
Figure 1.
The topography and river network in the upper reaches of the Kaidu River basin (a); the stations in and around the basin (b).

Figure 2.
The trend in hydro-meteorological variables: (a) annual precipitation, (b) snowfall, (c) EP, (d) runoff, (e) average air temperature, and (f) snow ratio during the period of 1960–2010. The dotted line is the linear trend for this period.
Figure 2.
The trend in hydro-meteorological variables: (a) annual precipitation, (b) snowfall, (c) EP, (d) runoff, (e) average air temperature, and (f) snow ratio during the period of 1960–2010. The dotted line is the linear trend for this period.

Figure 3.
The result of the analysis of annual runoff: (a) the M-K test and (b) the accumulative anomalies.
Figure 3.
The result of the analysis of annual runoff: (a) the M-K test and (b) the accumulative anomalies.

Figure 4.
The data points of the two periods in the Budyko space. The red one was the Budyko curve with a parameter n of 0.735. The blue one was the Budyko curve with a parameter n of 0.710. The horizontal dotted line represented the water limitation, and the sloping dotted line represented the energy limitation.

Figure 5.
Contributions (a) and contribution rates (b) of change in precipitation (P), EP, snow ratio (rs), and parameter n to runoff variation and their elasticity coefficients of runoff (c) in the two periods.
Figure 5.
Contributions (a) and contribution rates (b) of change in precipitation (P), EP, snow ratio (rs), and parameter n to runoff variation and their elasticity coefficients of runoff (c) in the two periods.

Figure 6.
Contribution rate of precipitation (P), EP, snow ratio (rs), and basin parameter (n) changes to runoff variation in the two Budyko frameworks.
Figure 6.
Contribution rate of precipitation (P), EP, snow ratio (rs), and basin parameter (n) changes to runoff variation in the two Budyko frameworks.

Figure 7.
The statistical relationship between the snow ratio elasticity coefficient of runoff and snow ratio during the period of 1960–2010. The small black dots were the values of annual snow ratio and elasticity coefficient and the red line was the trend line.
Figure 7.
The statistical relationship between the snow ratio elasticity coefficient of runoff and snow ratio during the period of 1960–2010. The small black dots were the values of annual snow ratio and elasticity coefficient and the red line was the trend line.

Figure 8.
The monthly average air temperature, Tmax in Equation (1), and empirical temperature from 1960 to 2010 (a), and the monthly average snowfall calculated by empirical temperature and Equation (1) (b).
Figure 8.
The monthly average air temperature, Tmax in Equation (1), and empirical temperature from 1960 to 2010 (a), and the monthly average snowfall calculated by empirical temperature and Equation (1) (b).

Figure 9.
Contribution rates of precipitation (P), EP, snow ratio (rs), and basin parameter (n) changes to runoff change calculated by different methods for distinguishing rainfall and snowfall.
Figure 9.
Contribution rates of precipitation (P), EP, snow ratio (rs), and basin parameter (n) changes to runoff change calculated by different methods for distinguishing rainfall and snowfall.


Table 1.
The information on the hydrological and meteorological stations in the upper Kaidu River basin.
Table 1.
The information on the hydrological and meteorological stations in the upper Kaidu River basin.
| Station Number | Station Name | Latitude and Longitude | Elevation (m) | Station Type |
|---|---|---|---|---|
| 51,241 | Tuoli | (45.56 N, 83.36 E) | 1077.8 | Meteorological station |
| 51,243 | Kelamayi | (45.37 N, 84.51 E) | 449.5 | Meteorological station |
| 51,334 | Jinghe | (44.34 N, 82.49 E) | 329.2 | Meteorological station |
| 51,367 | Hutubi | (44.1 N, 86.51 E) | 575.1 | Meteorological station |
| 51,469 | Urumqi Mushizhan | (43.27 N, 87.11 E) | 1930 | Meteorological station |
| 51,470 | Tianchi | (43.53 N, 88.07 E) | 1942.5 | Meteorological station |
| 51,477 | Dabancheng | (43.21 N, 88.19 E) | 1103.5 | Meteorological station |
| 51,542 | Bayinbuluke | (43.02 N, 84.09 E) | 2458 | Meteorological station |
| 51,567 | Yanqi | (42.05 N, 86.34 E) | 1055.3 | Meteorological station |
| 51,639 | Shaya | (41.14 N, 82.47 E) | 980.4 | Meteorological station |
| 51,656 | Kuerle | (41.45 N, 86.08 E) | 931.5 | Meteorological station |
| 705,700 | Dashankou | (42.25 N, 85.73 E) | 1270 | Hydrological station |
Table 2.
The value of annual precipitation, snowfall, average air temperature, snow ratio, EP, runoff, wind speed at 10 m, sunshine time, and relative humidity during the base period (1960–1995) and change period (1996–2010).
Table 2.
The value of annual precipitation, snowfall, average air temperature, snow ratio, EP, runoff, wind speed at 10 m, sunshine time, and relative humidity during the base period (1960–1995) and change period (1996–2010).
| Runoff Period | Precipitation (mm) | Snowfall (mm) | Temperature (°C) | EP (mm) | Snow Ratio | Runoff (mm) | Basin Parameter | Wind Speed (m/s) | Sunshine Time (h) | Relative Humidity |
|---|---|---|---|---|---|---|---|---|---|---|
| 1960–1995 | 339.9 | 92.7 | −2.7 | 1151.3 | 0.275 | 171.4 | 0.735 | 3.4 | 7.9 | 0.53 |
| 1996–2010 | 401.8 | 114.0 | −1.7 | 1127.0 | 0.284 | 219.0 | 0.710 | 2.9 | 7.7 | 0.55 |
Table 3.
The trend of precipitation, snowfall, EP, runoff, air temperature, and snow ratio in the period from 1960 to 2010.
Table 3.
The trend of precipitation, snowfall, EP, runoff, air temperature, and snow ratio in the period from 1960 to 2010.
| Variable | Trend | Linear Change Rate |
|---|---|---|
| Precipitation | increase | 1.78 (mm/year) |
| Snowfall | increase | 0.86 (mm/year) |
| EP | decrease | −1.43 (mm/year) |
| Runoff | increase | 1.03 (mm/year) |
| Temperature | increase | 0.03 (°C/year) |
| Snow ratio | increase | 0.001 |
Note: The items marked in red indicated that the trend was significant at 95% confidence level.
Table 4.
The value of annual precipitation, snowfall, average air temperature, snow ratio, EP, runoff, and basin parameters during the base period (1960–1995) and change period (1996–2010).
Table 4.
The value of annual precipitation, snowfall, average air temperature, snow ratio, EP, runoff, and basin parameters during the base period (1960–1995) and change period (1996–2010).
| Runoff Period | Precipitation (mm) | Snowfall (mm) | Temperature (°C) | EP (mm) | Snow Ratio | Runoff (mm) | Basin Parameter |
|---|---|---|---|---|---|---|---|
| 1960–1995 | 339.9 | 100.0 | −2.7 | 1151.3 | 0.295 | 171.4 | 0.756 |
| 1996–2010 | 401.8 | 121.5 | −1.7 | 1127.0 | 0.302 | 219.0 | 0.726 |
Note: The snowfall and snow ratio were calculated by the empirical temperature, and the basin parameters were recalculated after the change of snowfall and snow ratio.
Publisher’s Note: MDPI stays neutral with regard to jurisdictional claims in published maps and institutional affiliations. |
© 2022 by the authors. Licensee MDPI, Basel, Switzerland. This article is an open access article distributed under the terms and conditions of the Creative Commons Attribution (CC BY) license (https://creativecommons.org/licenses/by/4.0/).
Share and Cite
MDPI and ACS Style
Shi, G.; Gao, B. Attribution Analysis of Runoff Change in the Upper Reaches of the Kaidu River Basin Based on a Modified Budyko Framework. Atmosphere 2022, 13, 1385. https://0-doi-org.brum.beds.ac.uk/10.3390/atmos13091385
AMA Style
Shi G, Gao B. Attribution Analysis of Runoff Change in the Upper Reaches of the Kaidu River Basin Based on a Modified Budyko Framework. Atmosphere. 2022; 13(9):1385. https://0-doi-org.brum.beds.ac.uk/10.3390/atmos13091385
Chicago/Turabian StyleShi, Guosen, and Bing Gao. 2022. "Attribution Analysis of Runoff Change in the Upper Reaches of the Kaidu River Basin Based on a Modified Budyko Framework" Atmosphere 13, no. 9: 1385. https://0-doi-org.brum.beds.ac.uk/10.3390/atmos13091385
Note that from the first issue of 2016, this journal uses article numbers instead of page numbers. See further details here.