Article

Study of the Sea Temperature Backgrounds to Tropical Cyclones Affecting Hainan Province in the Dry Season

1
Hainan Climate Center, Haikou 570203, China
2
Key Laboratory of South China Sea Meteorological Disaster Prevention and Mitigation of Hainan Province, Haikou 570203, China
3
Meteorological and Hydrological Office of Xichang Satellite Launch Center, Xichang 615000, China
*
Author to whom correspondence should be addressed.
Submission received: 24 September 2023 / Revised: 4 November 2023 / Accepted: 6 November 2023 / Published: 9 November 2023
(This article belongs to the Special Issue Data Assimilation for Predicting Hurricane, Typhoon and Storm)

Abstract

:
Using the best path data set of tropical cyclones from the China Meteorological Administration, NCEP/NCAR (National Centers for Environmental Prediction–National Center for Atmospheric Research) reanalysis data, JMA (Japan Meteorological Agency) SST (surface sea temperature) data and NCEP subsurface sea temperature data, the sea temperature background of tropical cyclones affecting Hainan Province in the dry season was analyzed using typical cases from November to December. The results show that there was a significant positive correlation between the number of tropical cyclones affecting Hainan Province and the sea surface temperature in the South China Sea and the Western Pacific. The high SST in the South China Sea and Northwest Pacific were favorable for the occurrence and development of tropical cyclones. The circulation situation also had a significant impact on tropical cyclones during the concurrent period. The wind field convergence was conducive to the occurrence and development of tropical cyclones. The high subsurface sea temperature in the Western Pacific at the depth of 5–50 m was conducive to the strengthening of convection in the Pacific warm pool and the occurrence of the tropical cyclones. The typical cases of 1993 and 2017 have effectively verified the impact of the sea surface temperature background and circulation situation on tropical cyclones affecting the Hainan Province from November to December.

1. Introduction

A tropical cyclone (TC) is one of the most serious catastrophic weather events to affect the southeast coast of China, posing a significant threat to the economy, as well as the safety of people’s lives and property, leading to substantial losses every year. Many scholars have conducted research on typhoons. He et al. [1] analyzed the structure, features, and heavy rainfall of the landfall typhoon “Maisha”, demonstrating that the typhoon maintained an asymmetric structure and had stronger convective clouds to the east and north of the typhoon during its long distance of travel in East China. Chen et al. [2,3] conducted a series of studies on tropical cyclones, especially on abnormal typhoons in China. In addition, there have been many studies conducted by meteorologists on the path, intensity, structure, destruction, climate characteristics, and predictability of TCs [4,5,6,7,8,9].
Hainan Province is located in the southern part of China, including Hainan Island and the South China Sea, and is highly vulnerable to TCs. TCs affecting Hainan Province have been the focus of research by meteorologists. Numerous research findings have been obtained. Chen et al. [10] studied the interannual variation of TCs affecting Hainan Province and found that there are both frequent and infrequent periods of TCs affecting Hainan Province, and that there are four distinct cycles in the annual frequency of these impacts. Yang et al. [11] conducted statistics on the frequency, intensity, and location of TCs that have made landfall in China in recent decades. They found that there were significant interannual and interdecadal variations in the TCs that made landfall on Hainan Island. Wu [12] studied the characteristics of TCs affecting Hainan and their relationship with ENSO, in addition to counting the frequency, intensity, landfall sites, and other patterns of TCs affecting Hainan and their correlation with ENSO. Ye et al. [13] conducted a study that established correlations between the statistical characteristics of TCs and changes in oceanic atmospheric circulation activities, specifically focusing on the Western Pacific subtropical high during the corresponding period. Wei et al. [14] conducted a statistical analysis of TCs that made landfall and affected Hainan Island from 1949 to 2008, revealing the variations in the circulation background of TCs with different paths and similar paths in different seasons. Liang et al. [15] statistically analyzed the characteristics of TCs that made landfall in Hainan Province from 1964 to 2013, focusing on the characteristics of the year, month, intensity, path, and landfall location. In addition, there is a close relationship between SST and atmospheric circulation. Hu et al. [16] studied the relationship of summer precipitation anomalies and subtropical Northeast Pacific SSTA, highlighting that the negative SSTA in the subtropical Northeast Pacific can cause a low-level divergence and high-level convergence. Chen [17] studied the impacts of El Niño and La Niña on the cycle of the East Asian winter and summer monsoons, which showed that the close linkage between the East Asian winter monsoon and the following summer monsoon is due to the impact of the SSTA associated with El Niño or La Niña events. Zhi et al. [18] conducted a retrospective prediction in a coupled model over East Asia during the El Niño event’s decaying phase and discovered that the negative SSTA in the western North Pacific can cause the anomalous anticyclones over the area, which increase the rainfall. The internal connection between SST and atmosphere circulation has an impact on TCs.
In the field of meteorology, the rainy season refers to a specific period of the year characterized by a relatively high and concentrated amount of precipitation. Conversely, the dry season is defined as a period when precipitation is relatively low and scattered throughout the year. Similar to some low latitude areas in China [19], a clearly dry–wet seasonality is also an important climatic characteristic of Hainan. According to the statistics from Hainan Climate Center, the total rainfall of the dry season (from November to April of the following year) constitutes only 17.0% of the annual precipitation. However, regardless of whether it is the rainy season (from May to October) or dry season, Hainan is affected by TCs due to its special geographical location. Wu et al. [20] conducted a statistical analysis of the climatic characteristics of typhoon activity in the Northwest Pacific in the dry season based on typhoon data from 1949 to 2002 and found that there was no significant decrease in the number of TCs affecting Hainan Province in the dry season. However, most of the studies on the mechanism of TCs affecting Hainan Province have focused on the rainy season, and few studies conducted on dry season TCs have been conducted.
In recent years, several TCs have occurred in the dry season, causing significant impacts in Hainan Province. One such example is the super typhoon “Haiyan” in November 2013, which caused huge economic losses for Hainan Island. Statistically, there have been 110 TCs affecting Hainan Province in the dry seasons from 1980 to 2021, with an average of 2.6 per year. An analysis of the five-year moving average demonstrates a significant shift from less frequent to more frequent after the 2010s (Figure 1). Therefore, it is necessary to analyze the TCs affecting Hainan Province in the dry season.
SST (sea surface temperature) has an important influence on the generation and development of TCs. Tropical ocean SST anomalies can regulate the environmental factors associated with tropical cyclones by influencing the large-scale circulation system [21]. It has been shown that SST anomalies can be used as potential predictors of TC generation. Many scholars have conducted studies on the influence of the SST on the frequency and intensity of TCs [22,23,24,25,26,27]. Therefore, SST anomalies have an impact on the TCs affecting Hainan Province in the dry season. It is necessary to analyze the sea temperature background of the TC anomalies to reveal the intrinsic link between sea temperature conditions and the TCs affecting Hainan Province. This can improve our ability to predict the TCs that will affect Hainan Province.

2. Data and Methods

The TC data are from the best path data set of TCs compiled by the Shanghai Typhoon Research Institute of the China Meteorological Administration (CMA) [28], where the position and intensity of TCs are recorded once every 6 h. SST data are obtained from the month-by-month SST data provided by the Japan Meteorological Agency (JMA), with a horizontal resolution of 1° × 1° [29]. Subsurface sea temperature data were obtained from NCEP’s high-resolution and multilayer ocean analysis, with depths ranging from 5m in the surface layer to approximately 4500 m in the subsurface layer, comprising a total of 40 layers. The wind data are from the NCEP/NCAR reanalysis data [30]. The period analyzed in this paper is from 1980 to 2021. According to the World Meteorological Organization (WMO), the climatological normals were obtained using data from 1991 to 2020.
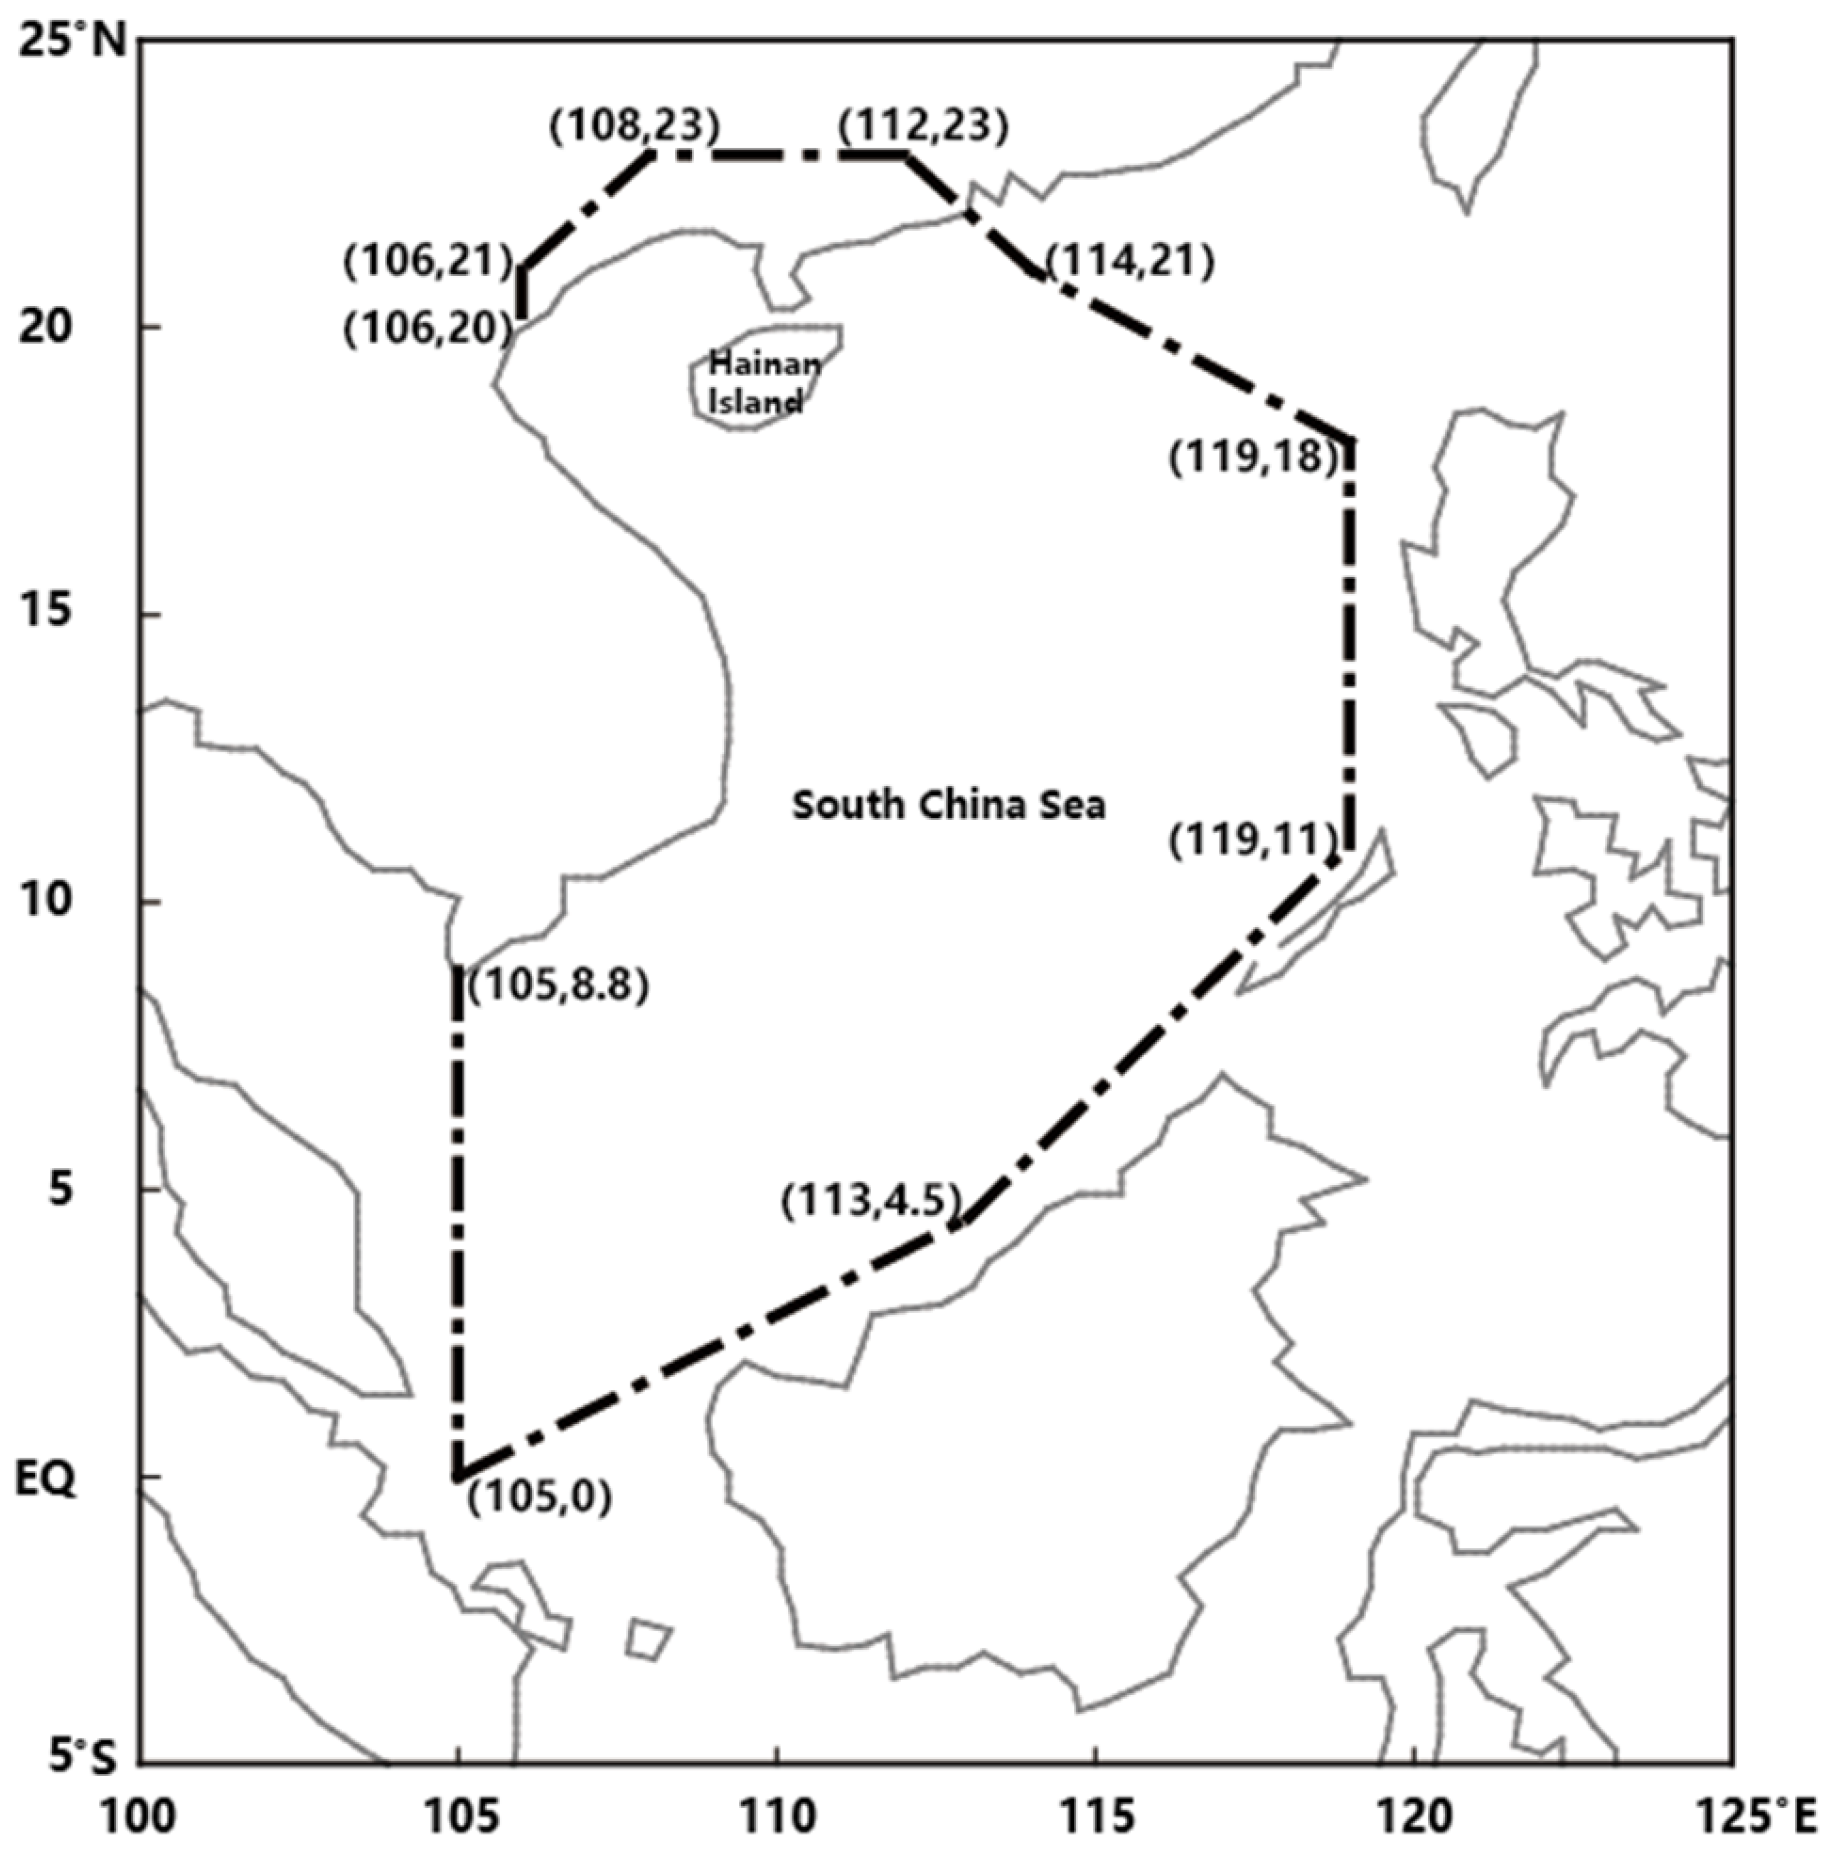
According to the medium- and long-term meteorological operations in Hainan Province, the area delineated in Figure 2 represents the influence area of TCs. If a TC enters the area and is recorded two or more times in the region, including as a tropical depression (TD), tropical storm (TS), strong tropical storm (STS), typhoon (TY), strong typhoon (STY), or super typhoon (super TY), it is defined as a TC affecting Hainan Province.
Then, we need to divide the TCs into different months. The impact time is the time of the TC’s initial entry into the region, which can be deduced from the two recorded times before and after entering the region. If a TC is generated at the end of April and enters the region in early May, it will be counted as a TC that impacted Hainan Province in May rather than April.
The percentile method [31,32] was used to select the active years and quiescent years for TCs in Section 4. The Years with TC numbers below the 10% threshold were selected as the quiescent years for TCs. The Years with TC numbers above the 90% threshold were selected as the active years for TCs. The rest are labeled as general years. Based on the three sets of data, the analysis of sea temperature was conducted using a composite analysis method.

3. Characteristics of TC Sources in the Dry Season

TCs that affect Hainan Province predominantly manifest during the rainy season. Extensive research has been conducted on TCs that impact Hainan Province during the rainy season. However, there is a lack of research on TCs in the dry season. Nevertheless, an analysis of the frequency of TCs impacting Hainan Province in each month reveals that the occurrence of such cyclones remains notably high in November and December (Figure 3).
According to the statistics of TCs affecting Hainan Province in the dry season from 1980 to 2021 (Table 1), a total of 110 TCs were recorded. TCs mainly occur in November and December, accounting for 82.7%. STYs and super TYs are still possible in November and December. Due to the long time span and the different important influences between months, combining several months for the analysis would cause interference. Therefore, November and December were selected to represent the dry season for our analysis of TCs impacting Hainan Province in order to minimize the distortion of valuable information.
Statistical analysis was conducted on the sources of TCs affecting Hainan Province in November and December between 1980 and 2021. The TCs are primarily found in the South China Sea and the Western Pacific within the geographical coordinates of 5–15° N and 110–157° E (Figure 4). There were three concentration areas. The first area was the South China Sea area located between 110 and 120° E. The second area was the area east of the Philippines located between 125 and 140° E. The third area was the area east 140° E.
The distribution characteristics of the origins of TCs affecting Hainan Province from November to December indicate that the genesis of TCs typically occurs in regions situated both further south and further west than usual. From a mechanistic standpoint, the possible reason for this is that the subtropical high pressure in the Northwest Pacific Ocean is stronger and further south in November and December. Guided by the east winds on the southern side of the subtropical high pressure, the TCs generated at low latitudes tend to move westward into the South China Sea. In addition, during this season, the SST in low latitude areas is relatively higher than in the northern sea region. This contributes to the formation and growth of TCs.

4. Sea Temperature Background Analysis

4.1. Correlation Analysis of the TC Number with the SST in Both the Previous Period and the Concurrent Period

The correlation analyses between the number of TCs affecting Hainan Province from November to December and the SST during the previous period (July, August, September, and October), as well as the concurrent period (from November to December), are illustrated in Figure 5. The number of TCs affecting Hainan from November to December was closely correlated with the SST anomalies in the Western Pacific. The significant correlation areas were mainly concentrated in the Northwest Pacific. There was a significant positive correlation between the SST of July and August in the Northwest Pacific and the number of TCs from November to December (Figure 5a,b). The correlation in the South China sea weakened in September, and the positive correlation areas were primarily concentrated in the east of the Philippines (Figure 5c). The positive correlation areas in October were mainly concentrated near the Philippines and in the western area of the equatorial Pacific Ocean (Figure 5d). During the concurrent period (Figure 5e), the correlation between the SST in both the South China Sea and east of the Philippines and the number of TCs was significant. There was a significant positive correlation between the SST in the Northwest Pacific and the number of TCs. There was a negative correlation between the SST in the equatorial Middle Eastern Pacific and the number of TCs. It can be seen that the SST in the Western Pacific had a significant impact on the tropical cyclones affecting Hainan Province from November to December. The higher the SST in the Western Pacific and South China Sea, the more favorable it was for the generation and development of TCs affecting Hainan Province from November to December. From the evolution of the correlation, it can be seen that there was a certain lag in the impact of sea surface temperature in the South China Sea and the Western Pacific on TCs.
Based on a comprehensive analysis, it can be seen that there was a significant positive correlation between the number of TCs affecting Hainan Province from November to December and the SST in the Western Pacific, both in the previous period and the concurrent period. This indicated that the higher the SST in the Western Pacific, the more likely it was for a TC to affect Hainan Province from November to December.

4.2. Analysis of the SST and the Circulation Background

Figure 6 shows the SST anomaly and 925 hPa wind field anomaly of the abnormal year of TCs affecting Hainan Province from November to December. In quiescent years for TCs affecting Hainan Province from November to December (Figure 6a), the SST in the South China Sea was slightly warmer than the climatological normal, while the SST in the Northwest Pacific east of the Philippines was colder than the climatological normal. There was a northeasterly wind anomaly from the Philippines to the Indian Ocean. There was an anticyclonic circulation anomaly over the South China Sea, which is not conducive to the strengthening and development of cyclonic circulation. Compared with the general years (Figure 6c), the SST over the South China sea and Northwest Pacific in the quiescent years was colder than the SST in the general years. There were no obvious anticyclonic circulation anomalies. Based on the analysis in Section 4.1, the low SST over the Northwest Pacific was not conducive to the occurrence and development of TCs. The anticyclonic circulation anomaly over the South China Sea were not conducive to the development of upward motion and convection, which were not conducive to the occurrence and development of TCs.
In the years with more TCs affecting Hainan Province (Figure 6b), the SSTs over the South China Sea and east of the Philippines and the Northwest Pacific Ocean were warmer than the climatological normal. Compared with the general years (Figure 6c), the SST over the South China sea and Northwest Pacific in the quiescent years was warmer than the SST in the general years. There was an obvious cyclonic circulation anomaly. The easterly wind anomaly from the central Pacific Ocean to the Philippines was conducive to the formation of wind convergence zones near the Philippines. The combination of the high SST and wind field convergence promoted the strengthening of upward movement, which was conducive to the occurrence and development of TCs. Therefore, the circulation situation has a significant impact on TCs.

4.3. Background Analysis of the Subsurface Sea Surface Temperature

With the development of ocean exploration technology, subsurface sea temperature has been widely used. Compared to the SST, the subsurface sea temperature is less affected by external factors and the stability is higher. The study of the influence of subsurface sea temperature on climate has gradually attracted the attention of meteorologists [33,34,35]. In light of this, the characteristics of subsurface sea temperature during TCs affecting Hainan Province in the dry season were analyzed.
Figure 7a shows the longitudinal distribution of the subsurface sea temperature along 5–15° N from July to October in the quiescent years. The subsurface sea temperature in the Pacific Ocean at the depth of 5–200 m was colder than the climatological normal. The main part of the low subsurface sea temperature was located at depths of 100–150 m in the Western Pacific Ocean between 130° E and 170° E. Similar results were also observed in concurrent time (Figure 7b). Unlike the quiescent years, whether in the preceding time (Figure 7c) or the concurrent time (Figure 7d) of the active years, the subsurface sea temperatures at depths of 5–150 m in the Pacific Ocean were warmer than the climatological normal. In the preceding time (Figure 7e) of the general years, it can be seen that the subsurface sea temperatures at depths of 5–50 m between 110° E and 140° E were colder than the climatological normal, while they were warmer between 140° E and 160° E. In addition, the subsurface sea temperatures at depths of 50–150 m between 120° E and 160° E were warmer than the climatological normal. Similar results were also observed in concurrent time (Figure 7f).
Compared with the general years, quiescent years, and active years, it can be seen that the sea surface temperature anomalies at - depths of 5–50 m between 110° E and 157° E were important to the number of TCs. The area between 110° E and 140° E contained two concentration areas of TCs (Figure 4). The subsurface sea temperatures were colder than the climatological normal, which made it difficult for TCs to generate in the area. However, there is a concentration area of TCs in the area between 140° E and 160° E (Figure 4). The subsurface sea temperatures were warmer than the climatological normal, which were conducive to the strengthening of convection and the occurrence of TCs in the area. So, the number of TCs generated between 110° E and 160° E eventually tend toward the general rather than abnormal. In contrast, the subsurface sea temperatures in the quiescent years were colder than the climatological normal, while they were warmer in the active years. The area between 110° E and 160° E contained the three concentration areas of TCs (Figure 4). The warm subsurface sea temperatures in the area were conducive to the strengthening of convection in the area and the occurrence of TCs. The low subsurface sea temperatures were not conducive to the development of convective activities over the ocean, and were found to suppress the occurrence of tropical disturbances.

5. Typical Case Analysis

In 2017, there were more TCs affecting Hainan Province from November to December than the climatological normal. In order to verify the characteristics of the sea surface temperature and atmospheric circulation background of TC affecting Hainan Province from November to December, the SST and circulation background in 2017 was analyzed as an example.
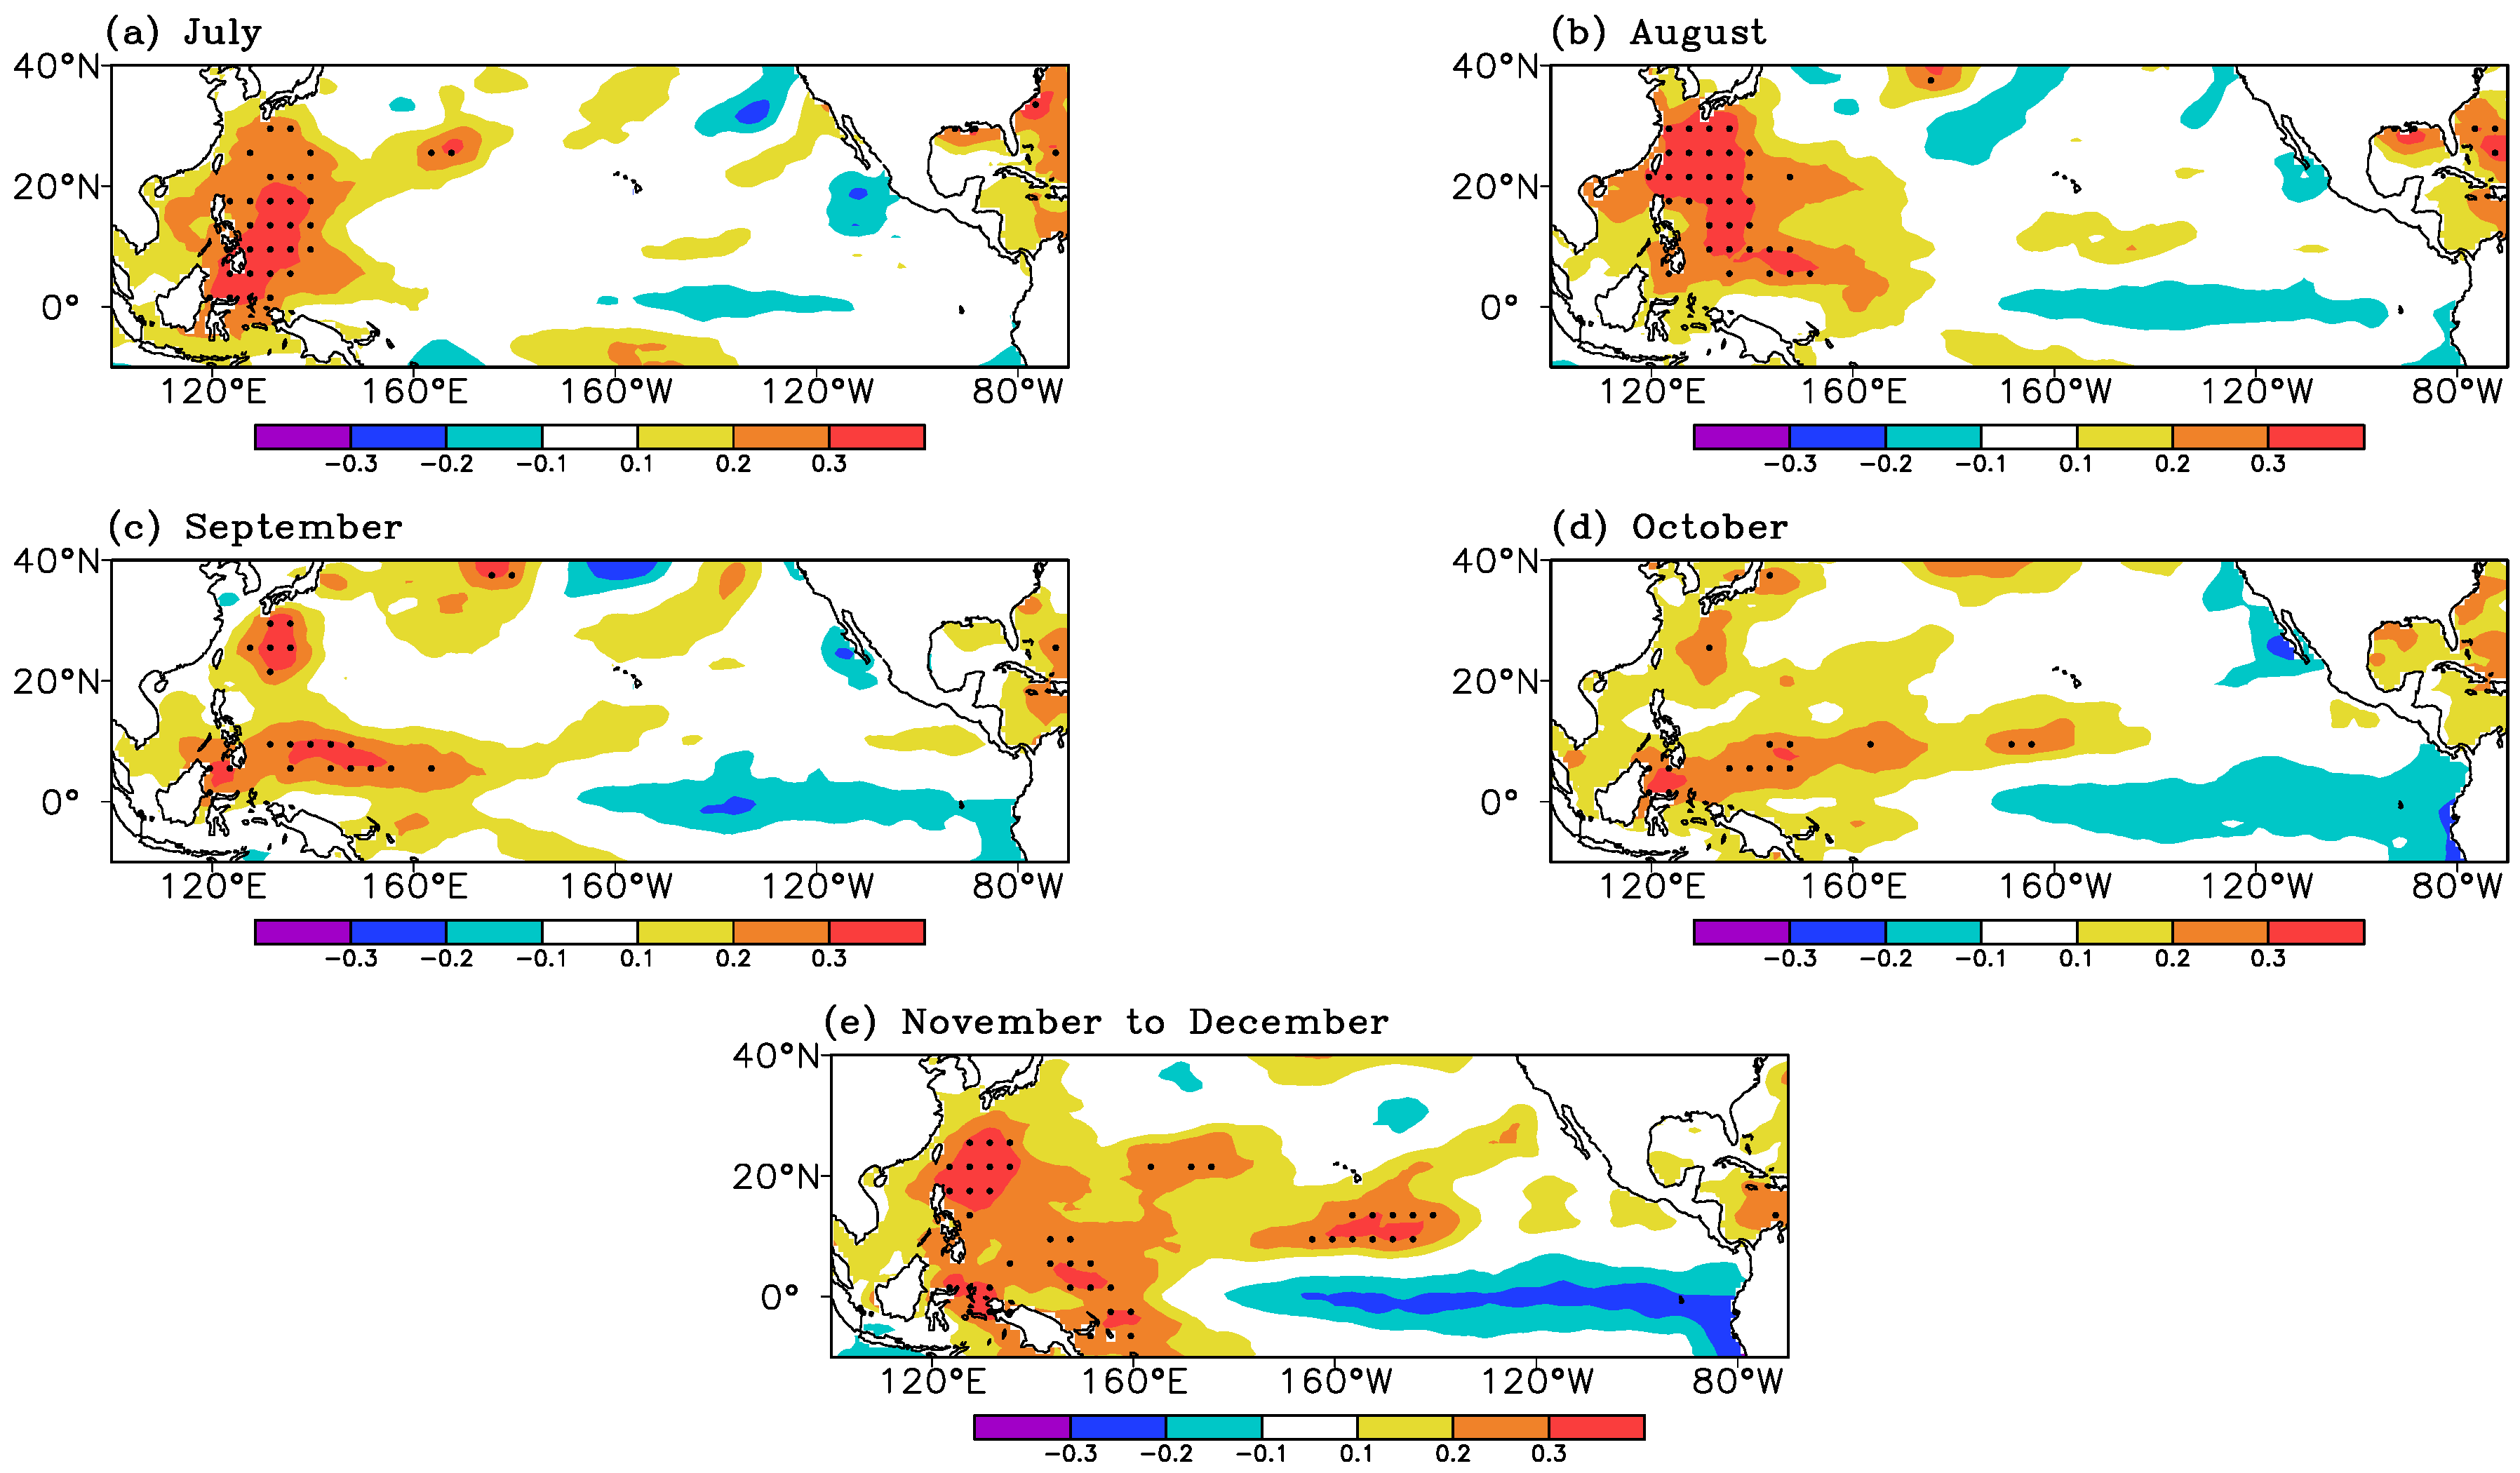
From November to December 2017, there were five TCs affecting Hainan Province, marking the highest number of cyclones ever recorded in its history. The characteristics of the SST in the previous period and the concurrent period of November to December 2017 were analyzed (Figure 8). The results showed that the characteristics of the SST anomalies in July–December 2017 were similar to those in Figure 5. In July, the SST over the Northwest Pacific was warmer than the climatological normal (Figure 8a). In August, the SST over the South China Sea was slightly warmer than the climatological normal, while the SST near the Philippines and in the Northwest Pacific Ocean was warmer than the climatological normal (Figure 8b). In September, the SST over the South China Sea and the Northwest Pacific was warmer than the climatological normal (Figure 8c). The SST in the South China Sea, the Northwest Pacific, and the area near the Philippines was warmer than the climatological normal in October (Figure 8d). During the concurrent period (Figure 8e), the SSTs in the South China Sea, the Northwest Pacific, and the area near the Philippines were warmer than the climatological normal. The SST in the equatorial Middle East Pacific was significantly colder. From the characteristics of SST in the previous period and the concurrent period in 2017, it can be seen that the SSTs in the South China Sea and the Northwest Pacific were warmer than the climatological normal. There was a good correspondence with the significant correlation between the number of TCs affecting Hainan Province and the SSTs (Figure 5). The warmer SSTs over the South China Sea and the Northwest Pacific in the preceding time and the concurrent time were conducive to the occurrence and development of TCs affecting Hainan Province from November to December.
Figure 9 displays the 925 hPa wind field anomaly from November to December 2017. The South China Sea was controlled by a cyclonic circulation anomaly, and, east of the Philippines, there was an easterly wind anomaly. There was a wind field convergence over the Philippines, which is an important area for the generation and development of TCs. From the figure, it can be seen that four TCs were generated here. In addition, guided by the easterly winds, they all moved westward and entered the South China Sea.
From the characteristics of the subsurface sea temperature anomaly (Figure 10), it can be seen that there was a warm layer extant in the Western Pacific, extending to the East–Central Pacific. The main part of the warm layer was located in the subsurface layer at depths of 5–150 m. The warm layer had a wide range. The characteristics were similar to Figure 7c,d. From the preceding time (Figure 10a) to the concurrent time (Figure 10b), the subsurface sea temperature between 120 and 140° E (the main sources of TCs in Figure 9) at depths of 5–50 m was warmer than the climatological normal, which was conducive to the strengthening of convection and the generation of TCs in theWestern Pacific Ocean from November to December 2017.
To further verify the effectiveness of the SST background on the TCs affecting Hainan Province, it was necessary to analyze another case that was significantly different from 2017. We chose 1993 for analysis, which is a year with five TCs affecting Hainan Province from November to December.
Figure 11 shows the SST anomaly for July to December 1993. From the figure, it can be seen that the SST background was significantly different from 2017. Overall, the SST in the Western Pacific was colder than the climatological normal, while it was warmer in the Middle Eastern Pacific, which has typical El Niño characteristics. The SSTs in the South China Sea, near the Philippines, and in the Northwest Pacific were colder than the climatological normal from July to December, while the SST in the Middle East Pacific was warmer than the climatological normal. Following analysis, it was found that the subsurface SST in November 1993 was also unfavorable for the occurrence of TCs affecting Hainan Province (figure omitted). Based on the previous analysis, the cold SST anomaly in the South China Sea and the Northwest Pacific was not conducive to the occurrence of TCs affecting Hainan Province from November to December.
Figure 12 shows the 925 hPa wind field anomaly from November to December 1993. There was a large-scale cyclonic circulation anomaly in the South China Sea and Western Pacific, with an easterly anomaly in the east of the Philippines. There was a convergence zone near 140° E, where four TCs were generated. The low-level circulation situation was conducive to the strengthening and development of low-level upward movement in the Western Pacific to the South China Sea region, which was conducive to the occurrence of TCs.
Based on the distribution characteristics of SST from November to December 1993, it can be seen that the SST was not conducive to the occurrence of TCs, but the low-level circulation was beneficial. This indicates that an advantageous circulation may also trigger the occurrence and development of tropical cyclones in the case of a disadvantageous SST.

6. Discussion and Conclusions

The sea temperature background of TCs affecting Hainan Province in the dry season was analyzed with typical cases from November to December using the CMA TC data, NCEP/NCAR reanalysis data, JMA SST data, and NCEP subsurface sea temperature data.
The results show that there was a significant positive correlation between the number of tropical cyclones affecting Hainan Province from November to December and the sea surface temperature in the South China Sea and the Western Pacific. The high SST in the South China Sea and Northwest Pacific were favorable for the occurrence and development of TCs. The circulation situation also had a significant impact on TCs during the concurrent period. The wind field promoted the strengthening of upward movement, which was conducive to the occurrence and development of TCs. Additionally, the high subsurface sea temperature in the Western Pacific at the depth of 5–50 m was conducive to the strengthening of convection in the Pacific warm pool and the occurrence of the TCs. Taking 1993 and 2017 as typical cases, the sea temperature backgrounds were analyzed. The SST in 2017 was warmer in the Northwest Pacific and colder in the Middle East Pacific. The background characteristics in 1993 were the opposite. When the sea temperature background in the Northwest Pacific was favorable for the formation of TCs, there would be more TCs affecting Hainan Province. However, the advantageous circulation may also trigger the occurrence and development of TCs in the case of a disadvantageous SST.
It should be pointed out that when studying the sea temperature background of TCs affecting Hainan Province in the dry season, the influence of sea temperature environment was studied by analyzing the correlation between sea temperature environment and frequency of TCs. However, what is the internal mechanism by which sea temperature affects TCs in the dry seasons? How does SST affect the formation and development of dry season TCs by affecting the atmosphere? These issues require further research in the future.

Author Contributions

Conceptualization, J.Z.; Data curation, J.Z., X.Z., H.W. and D.H.; Investigation, C.X.; Methodology, J.Z., H.W. and D.H.; Resources, C.X.; Validation, H.W.; Writing—original draft, X.Z.; Writing—review and editing, S.W. All authors have read and agreed to the published version of the manuscript.

Funding

This research was funded by the Technology Improvement Project of Hainan Meteorological Service grant number HNQXJS202003 and the Key Laboratory of South China Sea Meteorological Disaster Prevention and Mitigation of Hainan Province grant number SCSF202201.

Institutional Review Board Statement

Not applicable.

Informed Consent Statement

Not applicable.

Data Availability Statement

The TC data is provided by the Shanghai Typhoon Research Institute of the China Meteorological Administration (CMA) from their website at https://www.sti.org.cn/taifengsuoyewuwangzhanwangzhi.html, accessed on 10 November 2022. SST data is provided by Japan Meteorological Agency (JMA) from their website at https://psl.noaa.gov/data/gridded/tables/sst.html, accessed on 14 January 2023. Subsurface sea temperature data and wind data is provided by National Centers for Environmental Prediction (NCEP) from their website at https://rda.ucar.edu/lookfordata, accessed on 11 March 2023.

Conflicts of Interest

The authors declare no conflict of interest.

References

  1. He, L.; Yin, J.; Chen, T.; Luo, J. Analysis of Structure and Heavy Rain of Landfall Typhoon Maisha. Meteor. Mon. 2006, 32, 93–100. [Google Scholar]
  2. Chen, L.; Meng, Z. An Overview on Tropical Cyclone Research Progress in China during the Past Ten Years. Chin. J. Atmos. Sci. 2001, 25, 420–432. [Google Scholar]
  3. Chen, L.; Xu, X.; Luo, Z.; Wang, J. Introduction to Tropical Cyclone Dynamics; Meteorological Press: Beijing, China, 2002; pp. 25–26. [Google Scholar]
  4. Shen, F.; Min, J.; Xu, D. Assimilation of radar radial velocity data with the WRF Hybrid ETKF–3DVAR system for the prediction of Hurricane Ike (2008). Atmos. Res. 2016, 169, 127–138. [Google Scholar] [CrossRef]
  5. Shen, F.; Xu, D.; Min, J. Effect of momentum control variables on assimilating radar observations for the analysis and forecast for Typhoon Chanthu (2010). Atmos. Res. 2019, 230, 104622. [Google Scholar] [CrossRef]
  6. Liang, J.Y.; Chen, Z.T.; Wan, Q.L.; Ding, W.Y.; Liu, C.X.; Lin, A.L. Diagnostic analysis of the landfall process of tropical cyclone “VONGFONG”. J. Trop. Meteorol. 2003, 19, 45–55. [Google Scholar]
  7. Qian, Y.; Zhang, H. Analysis of Moving Track of Typhoon Sinlaku and Some Forecast Difficulty. Meteor. Mon. 2004, 30, 19–23. [Google Scholar]
  8. Li, Y.; Chen, L.; Wang, J. The diagnostic analysis on the characteristics of large scale circulation corresponding to the sustaining and decaying of tropical cyclone after it’s landfall. Acta Meteorol. Sin. 2004, 62, 167–179. [Google Scholar]
  9. Shen, F.; Xue, M.; Min, J. A comparison of limited-area 3DVAR and ETKF-En3DVAR data assimilation using radar observations at convective scale for the prediction of Typhoon Saomai (2006). Meteorol. Appl. 2017, 24, 628–641. [Google Scholar] [CrossRef]
  10. Chen, X. Inter-annul Variation and Tendency Prediction of Tropical Cyclones in Hainan Province. J. Trop. Meteorol. 2000, 16, 360–365. [Google Scholar]
  11. Yang, Y.; Ying, M.; Chen, B. The climatic changes of landfall tropic al cyclones in China over the past 58 years. Acta Meteorol. Sin. 2009, 67, 689–696. [Google Scholar]
  12. Wu, H. Climatic Features of Tropical Cyclone in Hainan Island and Its Relationship with ENSO. Meteor. Mon. 2005, 31, 61–64. [Google Scholar]
  13. Ye, Y.; Dong, B. Climate characteristics of tropical cyclones in the northwest Pacific Ocean in 1994/1995 and analysis of tropical oceanic and atmospheric circulation. Ocean. Forecast. 1997, 14, 44–52. [Google Scholar]
  14. Wei, N.; Li, Y.; Hu, S. Statistical characteristics and circulation background of tropical cyclone activity in mainland China from 1949 to 2008. J. Trop. Meteorol. 2013, 29, 17–27. [Google Scholar]
  15. Liang, H.; Liang, H.; Che, Z. Statistical characteristics analysis of tropical cyclones landfall in Hainan Province in the last fifty years. Ocean. Forecast. 2015, 32, 68–75. [Google Scholar]
  16. Huang, Y.; Jin, D.; Mireayi, T. Relationship of Nanjing summer precipitation anomaly and subtropical Northeast Pacific SSTA in 1991 and 1994 and its causes. Trans. Atmos. Sci. 2019, 42, 552–561. [Google Scholar]
  17. Wen, C. Impacts of EL Nino and La Nina on the cycle of the east Asian winter and summer monsoon. Chin. J. Atmos. Sci. 2002, 26, 595–610. [Google Scholar]
  18. Zhi, H.; Yu, Y.; Yan, L. Retrospective prediction in a coupled model over East Asia during EL Nino decaying phase. Acta Meteorol. Sin. 2012, 70, 779–788. [Google Scholar]
  19. Huang, Z. Changes of Dry-wet Climate in the Dry Season in Yunnan (1961–2007). Adv. Clim. Chang. Res. 2011, 2, 49–54. [Google Scholar] [CrossRef]
  20. Wu, S.; Zhang, Y.; Jiang, Z. The Variation Characteristics of Hainan-Influencing Tropical Cyclones Activity Off Rainy Seasons. J. Trop. Meteorol. 2006, 22, 301–307. [Google Scholar]
  21. Chen, M.; Chen, R. Interdecadal Change in the Relationship between Summer Tropical Cyclone Genesis Frequency over the Western North Pacific and Tropical Sea Surface Temperature. J. Trop. Meteorol. 2022, 38, 58–67. [Google Scholar]
  22. Shen, F.; Min, J. Assimilating AMSU-A radiance data with the WRF Hybrid En3DVAR system for track predictions of Typhoon Megi (2010). Adv. Atmos. Sci. 2015, 32, 1231–1243. [Google Scholar] [CrossRef]
  23. Zhang, Y.; Wang, H. A projection of future climate change over the western North Pacific related to typhoon activities. Acta Meteorol. Sin. 2010, 68, 539–549. [Google Scholar]
  24. Xu, D.; Min, J.; Shen, F.; Ban, J.; Chen, P. Assimilation of MWHS radiance data from the FY-3B satellite with the WRF Hybrid-3DVAR system for the forecasting of binary typhoons. J. Adv. Model. Earth Syst. 2016, 8, 1014–1028. [Google Scholar] [CrossRef]
  25. Chan, J.C. Comments on “Changes in tropical cyclone number, duration and intensity in a warming environment”. Science 2006, 311, 1713b. [Google Scholar] [CrossRef] [PubMed]
  26. Shen, F.; Xu, D.; Li, H.; Min, J.; Liu, R. Assimilation of GPM Microwave Imager Radiance data with the WRF hybrid 3DEnVar system for the prediction of Typhoon Chanhom (2015). Atmos. Res. 2021, 251, 105422. [Google Scholar] [CrossRef]
  27. Lei, X.; Xu, M.; Ren, F. A review on the impacts of global warming on tropical cyclone activities. Acta Meteorol. Sin. 2009, 67, 679–688. [Google Scholar]
  28. Ying, M.; Zhang, W.; Yu, H.; Lu, X.; Feng, J.; Fan, Y.; Zhu, Y.; Chen, D. An Overview of the China Meteorological Administration Tropical Cyclone Database. J. Atmos. Ocean. Technol. 2014, 31, 287–301. [Google Scholar] [CrossRef]
  29. Ishii, M.; Shouji, A.; Sugimoto, S.; Matsumoto, T. Objective analyses of sea-surface temperature and marine meteorological variables for the 20th century using ICOADS and the Kobe Collection. Int. J. Climatol. 2005, 25, 865–879. [Google Scholar] [CrossRef]
  30. Kalnay, E.; Kanamitsu, M.; Kistler, R.; Collins, W.; Deaven, D.; Gandin, L.; Iredell, M.; Saha, S.; White, G.; Woollen, J.; et al. The NCEP/NCAR 40-year reanalysis project. Bull. Amer. Meteor. Soc. 1996, 77, 437–471. [Google Scholar] [CrossRef]
  31. Bonsal, B.R.; Zhang, X.; Vincent, L.A.; Hogg, W.D. Characteristics of daily and extreme temperatures over Canada. J. Clim. 2001, 14, 1959–1976. [Google Scholar] [CrossRef]
  32. Sun, J.; Guan, Z.; Li, M.; Yu, Y. Anomalous circulation patterns in association with two types of regional daily precipitation extremes over South China from July to October. Acta Meteorol. Sin. 2019, 77, 43–57. [Google Scholar]
  33. Huang, R.; Sun, F. Impacts of the Thermal State and the Convective Activities in the Tropical Western Warm Pool on the Summer Climate Anomalies in East Asia. Chin. J. Atmos. Sci. 1994, 18, 141–151. [Google Scholar]
  34. Li, L.; Wang, P.; Li, H.; Ye, M. Analysis of inter-decadal anomaly relations between sub-surface sea temperature and sea level pressure over the north pacific. J. Trop. Meteorol. 2003, 19, 357–366. [Google Scholar]
  35. Qi, L.; Sun, Z.; Li, Z. Winter Subsurface Layer Thermal State Character of the North Pacific and Its Relationship with the Summer Climate in the East of China. Trans. Atmos. Sci. 2007, 30, 153–161. [Google Scholar]
Figure 1. Number of TCs affecting Hainan Province in the dry season from 1980 to 2021.
Atmosphere 14 01663 g001
Figure 2. Regional map of TCs affecting Hainan Province. The numbers in brackets represent the longitude and latitude of the location; the numbers on the left represent longitude, and the numbers on the right represent latitude.
Atmosphere 14 01663 g002
Figure 3. Monthly number of TCs affecting Hainan Province from 1980 to 2021.
Atmosphere 14 01663 g003
Figure 4. Sources of TCs affecting Hainan Province in November and December between 1980 and 2021. The TC icons are the generation locations of the TCs. The rectangles represent the main generation areas of the TCs.
Atmosphere 14 01663 g004
Figure 5. Correlation between the number of TCs affecting Hainan from November to December and the SSTs in the preceding time ((a) July, (b) August, (c) September, and (d) October)) and concurrent time ((e) November to December); the black dot areas exceed the 90% significance level.
Atmosphere 14 01663 g005
Figure 6. SST anomaly (colored areas, units: °C) and 925 hPa wind field anomaly (vectors, units: m/s) from November to December for TC anomalies affecting Hainan Province: (a) quiescent years for TCs, (b) active years for TCs, and (c) general years.
Atmosphere 14 01663 g006
Figure 7. The longitudinal distribution characteristics of the subsurface sea surface temperature anomalies from 5° N to 15° N in the preceding time (July to October) and concurrent time (November to December) for the abnormal years of TCs affecting Hainan Province (units: ℃). The colored areas are ocean, and the white areas are land: (a) the preceding time of the quiescent years for TCs; (b) the concurrent time of quiescent years for TCs; (c) the preceding time of the active years for TCs; (d) the concurrent time of active years for TCs; (e) the preceding time of general years; (f) the concurrent time of general years.
Atmosphere 14 01663 g007
Figure 8. SST anomalies in 2017 ((a) July, (b) August, (c) September, (d) October, (e) November to December, units: °C).
Atmosphere 14 01663 g008
Figure 9. 925 hPa wind field anomaly (vectors, units: m/s) from November to December 2017. The TC icons are the generation locations of the TCs.
Atmosphere 14 01663 g009
Figure 10. The longitudinal distribution characteristics of the subsurface sea surface temperature anomalies from 5° N to 15° N in 2017 (units: °C). The colored areas are ocean, and the white areas are land: (a) the preceding time (July to October), and (b) the concurrent time (November to December).
Atmosphere 14 01663 g010
Figure 11. SST anomalies in 1993 ((a) July, (b) August, (c) September, (d) October, (e) November to December, units: °C).
Atmosphere 14 01663 g011
Figure 12. 925 hPa wind field anomaly (vectors, units: m/s) for November and December in 1993. The TC icons are the generation locations of the TCs.
Atmosphere 14 01663 g012
Table 1. The number of TCs affecting Hainan Province in the dry season from 1980 to 2021.
MonthTDTSSTSTYSTYSuper TYTotal
November91312910558
December49266633
January1200104
February1200003
March2030106
April2022006
Disclaimer/Publisher’s Note: The statements, opinions and data contained in all publications are solely those of the individual author(s) and contributor(s) and not of MDPI and/or the editor(s). MDPI and/or the editor(s) disclaim responsibility for any injury to people or property resulting from any ideas, methods, instructions or products referred to in the content.

