Article

Distribution and Long-Term Trends of Tropospheric Ozone Concentrations in Ireland

1
UCD School of Agriculture and Food Science, University College Dublin, D04 N2E5 Dublin, Ireland
2
School of Environment, Trent University, Peterborough, ON K9L 0G2, Canada
*
Author to whom correspondence should be addressed.
Submission received: 25 January 2023 / Revised: 10 March 2023 / Accepted: 14 March 2023 / Published: 16 March 2023
(This article belongs to the Special Issue Source and Transport of Ozone)

Abstract

:
Tropospheric ozone (O3) is highly variable over space and time reflecting local production and destruction as well as addition and loss through regional and long-range transport. In this study, O3 concentrations at 11 stations in Ireland and their long-term trends (7–9 sites) were evaluated; O3 concentrations (2015–2019) varied spatially, with the highest annual mean concentrations along the Atlantic west coast (69–75 µg/m3), and the lowest in urban centres (39–43 µg/m3). Ozone followed a seasonal pattern of spring and winter maximum and summer–autumn minimum. Significant long-term (2005–2019) increases were observed in annual O3 concentration at two rural stations, while increases were larger and more frequent during winter with increases at four out of seven stations. During the decade 2010–2019, significant annual increases were observed at four out of nine stations. Observed site- and season-specific increasing trends in O3 concentrations likely reflected changes in regional precursor gas emissions sources. Despite reported decreases in background concentrations in the marine boundary layer in northern mid-latitudes in recent decades, O3 concentrations at some sites in Ireland have increased significantly primarily driven by changes in winter concentrations. There were no significant decreasing trends at any site or in any season.

1. Introduction

Ozone (O3) is a highly reactive gas formed from the photochemical reaction of precursor compounds, with concentrations highly variable over space and time due to complex non-linear creation and destruction processes. While stratospheric O3 is vital for life on earth through its absorption of harmful UV radiation, tropospheric (or ground level) O3 is potentially harmful to human and plant health and is a potent greenhouse gas [1]. It is well established that high O3 concentrations lead to an increase in respiratory illness and hospitalisations [2,3]. In plants, O3 causes stippling on the upper leaf surface, reducing photosynthesis and growth, and increasing the susceptibility to other stressors [4]. Since the industrial revolution, O3 concentrations have increased by at least a factor of two in northern mid-latitudes, owing to increases in the emissions of precursor gases [5].
The production of O3 in the troposphere is primarily determined by the levels and ratios of nitrogen oxides (NOx = NO plus NO2) and volatile organic compounds (VOCs), in the presence of sunlight [6,7]. However, despite high emissions of precursors in cities, lower O3 concentrations are often found due to reactions with freshly emitted nitric oxide (NO), highlighting the non-linear nature of O3 formation. Furthermore, sources of VOCs have changed over time; decreases in traffic emissions have been observed, while increases in emissions from industrial and consumer activities have also occurred [8]. In Europe, precursor concentrations have decreased during the past decades [9] because of successful emission reduction measures. In Ireland, the same decreasing trend was not observed, and in recent years (2010–2019) NOx emissions have exceeded mandatory emissions thresholds under the EU National Emission Reduction Commitments Directive (NECD, 2016/2284/EU; [10]). Further, non-methane VOC (NMVOC) emissions have also exceeded the EU threshold and have shown a significant increasing trend during 2010–2019 [10]. Methane emissions have also increased in this period, with increases from agriculture more than offsetting decreases from landfill [11].
Ozone concentrations are dynamic with formation also dependent on local meteorological conditions such as sunlight and temperature [12,13], with daytime concentrations typically higher than night-time concentrations. Therefore, a changing climate with higher summer temperatures and reduced cloudiness is projected to lead to an increase in exceedances of O3 thresholds for health [14]. Despite its dynamic nature, ground-level O3 and its precursors can be transported large distances by wind [15,16,17], therefore high precursor or O3 concentrations in one location can increase O3 levels downwind in another location. Understanding and monitoring the variability of O3 both spatially and temporally is important for the protection of human and plant health.
Tropospheric O3 concentrations have been routinely measured across North America, Europe, and Asia since the 1950s–1970s. These long-term datasets show a consistent increase in mean O3 concentrations across North America and Europe up to the year 2000, after which a levelling-off or decreasing trend occurred [17,18]. This levelling-off pattern since 2000 has been attributed to the reduction of precursor emissions [9]. While emissions reductions across Europe and North America have led to reductions in summer peak O3 concentrations, an increase in winter concentrations has also been observed [19,20,21]. In Europe, during the period 1995 to 2014, increases in mean and lower-percentile O3 concentrations were observed, while a decrease in peak values occurred over the same period [21]. In North America (1990–2010), reductions in precursor emissions resulted in lower mean O3 concentrations [22], especially in areas close to emissions sources [23].
Large-area studies across Europe have provided a detailed picture of the current state of O3 concentrations and their potential impacts. Mean O3 concentrations in Europe vary spatially, with higher concentrations generally experienced in the Mediterranean region during the summer, due to higher temperatures and levels of sunshine, along with high emissions of O3 precursors in some areas [24]. For the period 2015–2019, annual average concentrations for all stations in Spain were 59 µg/m3 (n = >400, standard deviation (SD): 11.8 µg/m3), and in Italy were 57 µg/m3 (n = >350, SD: 13.6 µg/m3). Lower concentrations are typical in other areas of Europe, where temperature and levels of sunlight are lower, e.g., the annual mean concentration across all stations in Germany was 50 µg/m3 (SD: 9.1 µg/m3).
Observations from Mace Head, Ireland, a remote rural site on the Atlantic coast, show an increasing trend in baseline levels up to the year 2000, followed by a levelling-off up to 2009, after which a decline occurred to April 2017 [18]. The most recent study [25,26] which investigated trends at eight stations in Ireland up to 2009, similarly suggested that concentrations had stabilised since 2000. However, there have been no studies during the last decade. Air quality in Ireland is influenced by Atlantic air masses due to its location on the western periphery of Europe, with just 7% of the airmass arriving from mainland Europe [25]. Nonetheless, O3 concentrations in Ireland can reach levels high enough to exceed thresholds for plant health [25,27]. The objective of this study was to assess tropospheric O3 concentrations in Ireland, especially during the second decade of the 21st century. To achieve this, we analysed long-term trends in annual, and seasonal O3 concentrations over 10 and 15-year periods, and assessed spatial variation in annual, seasonal, weekly, and daily cycles.

2. Materials and Methods

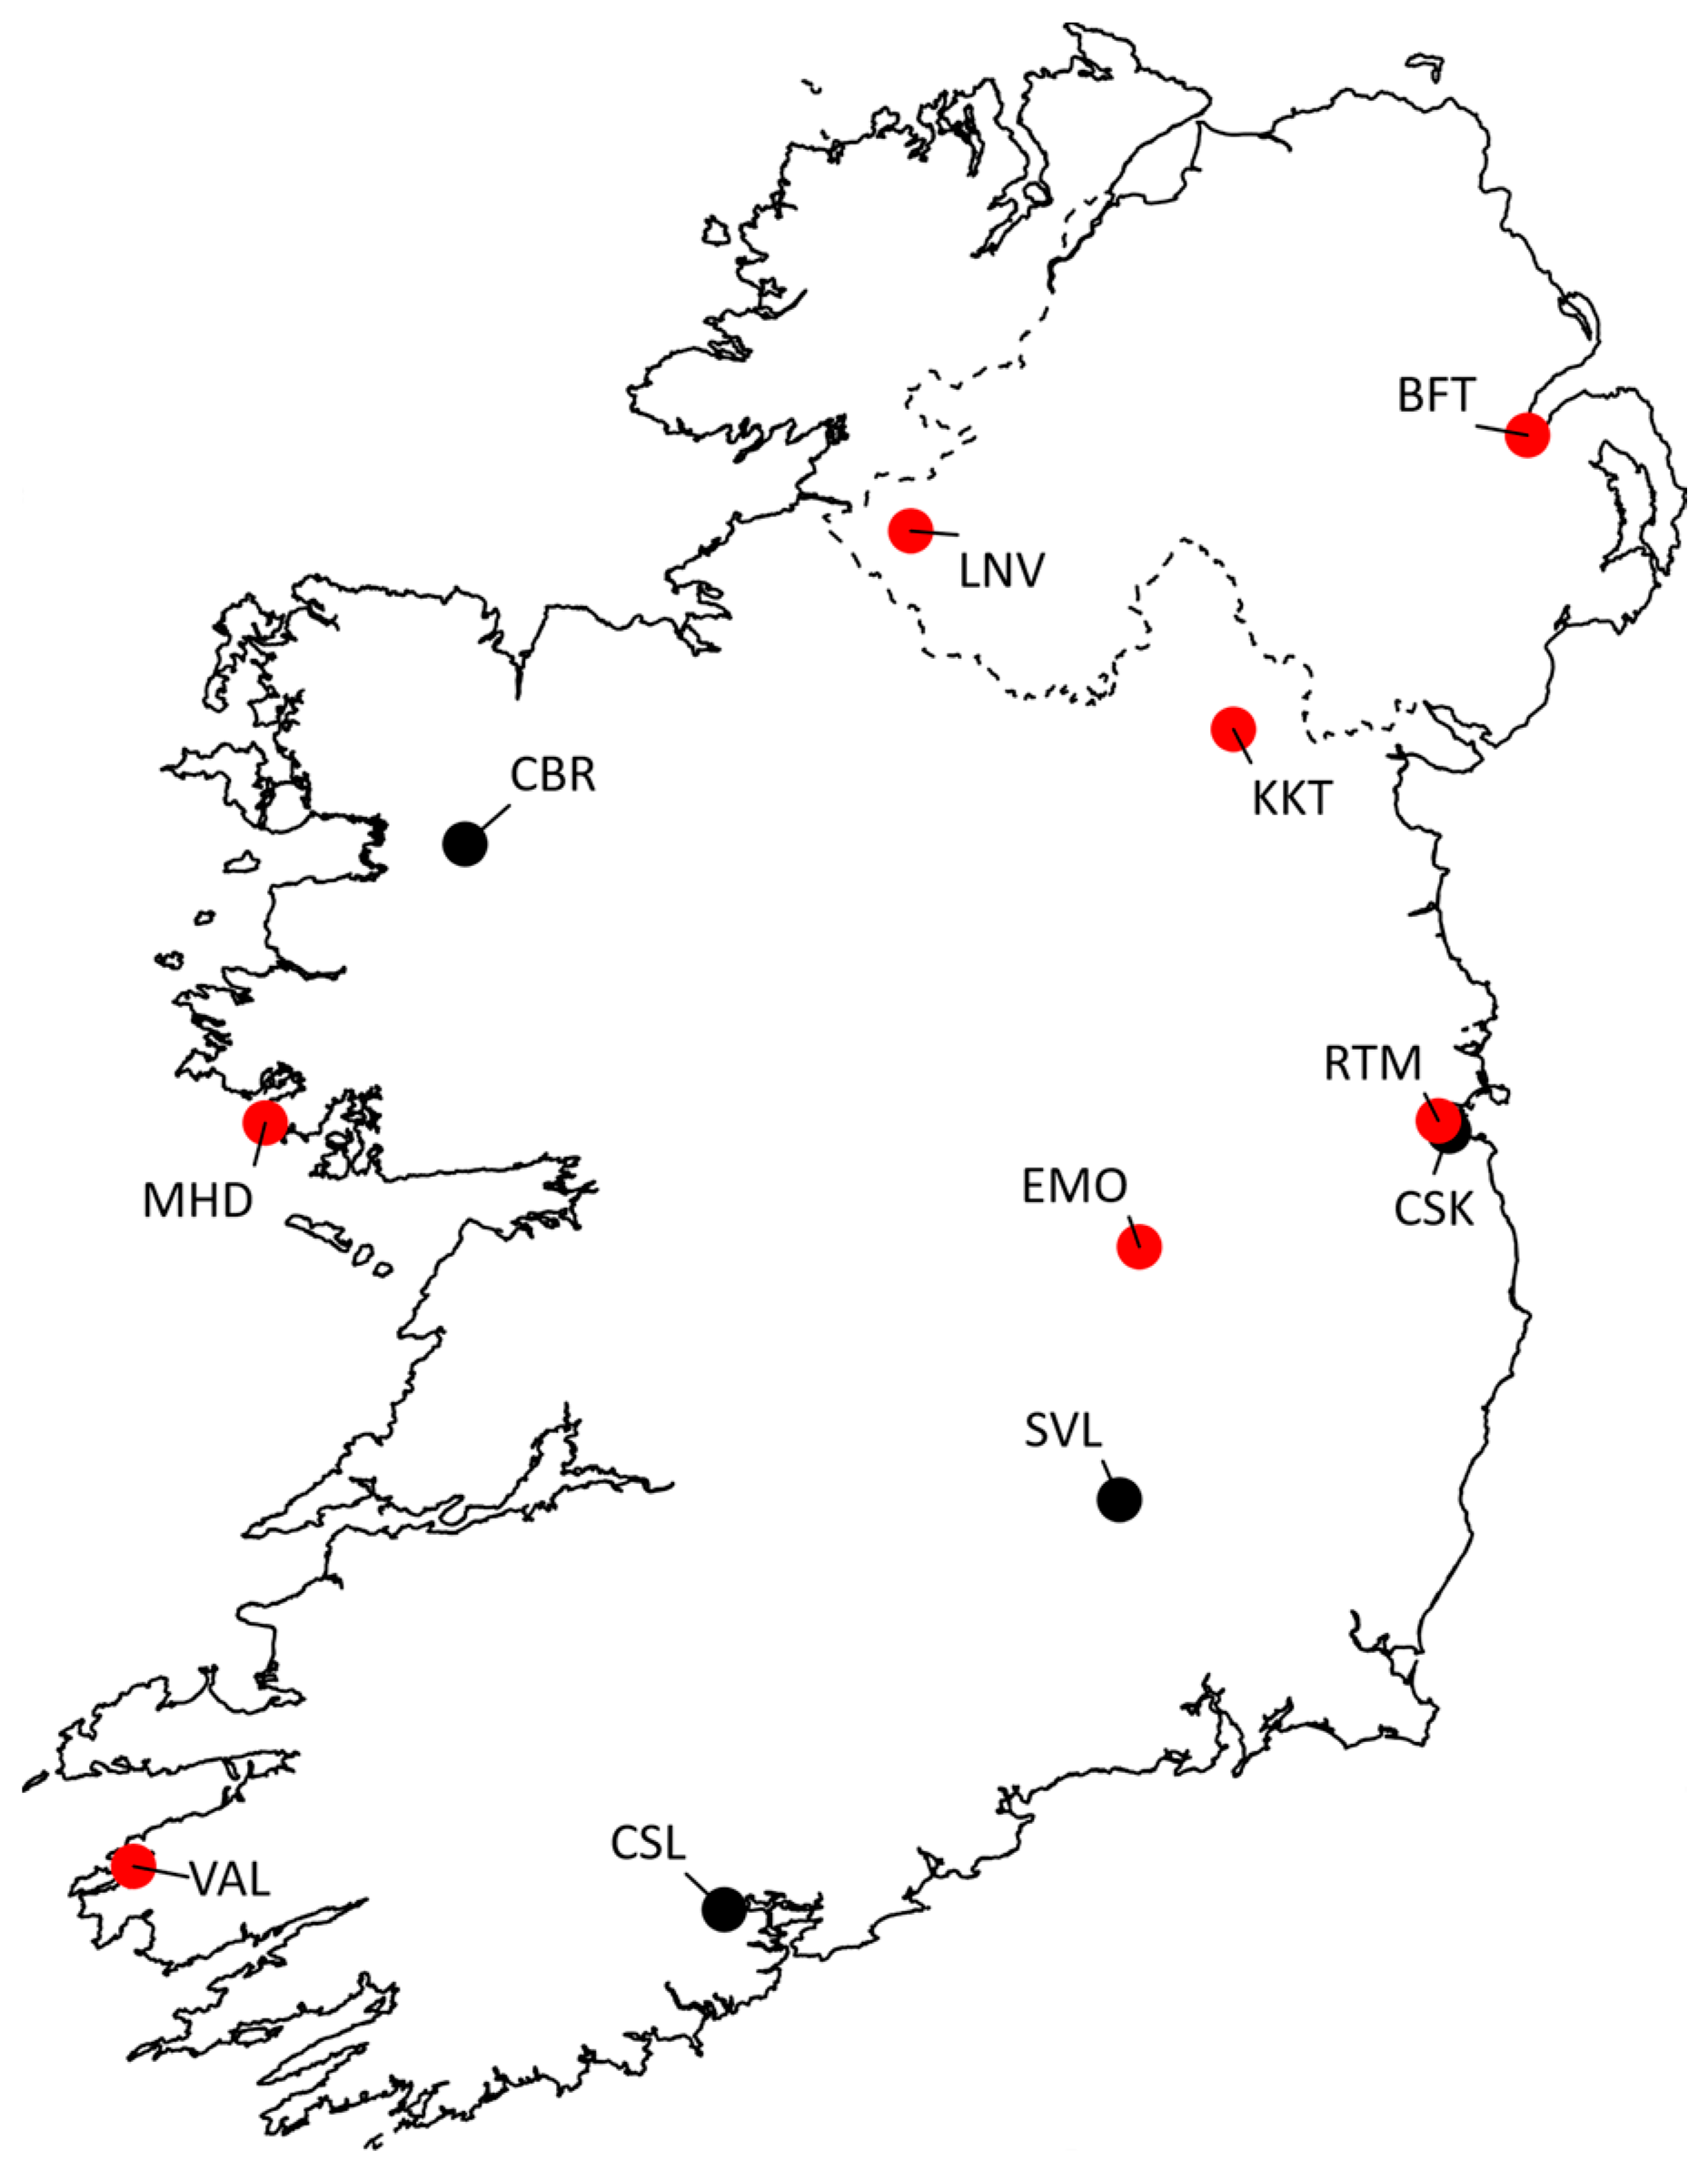
2.1. Study Area and Sites

Situated on the Atlantic periphery of Europe, Ireland experiences a cool temperate oceanic climate, with monthly mean air temperatures ranging between 4 and 8 °C in winter, and between 12 and 16 °C in summer (Met Éireann, Dublin, Ireland, 1981–2010). Annual sunshine duration ranges between 1100 and 1600 h, with a mean of one hour per day in the northwest during December, to seven hours in the extreme southeast during June.
Ozone concentrations were obtained from selected monitoring stations with a minimum of five years of data (n = 11, see Table 1 and Figure 1) in the Irish National Ambient Air Quality Network managed by the Environmental Protection Agency (EPA) and the United Kingdom (UK) Automatic Urban and Rural Network (AURN). Hourly O3 concentrations were retrieved from three online databases: EPA SAFER (URL: eparesearch.epa.ie/safer/iso19115/display?isoID=66 (accessed on 25 January 2023)), European Environment Agency (URL: discomap.eea.europa.eu/map/fme/AirQualityExport.htm (accessed on 25 January 2023)), and UK Department for the Environment Food and Rural Affairs (URL: uk-air.defra.gov.uk/networks/network-info?view=aurn (accessed on 25 January 2023)). Each dataset was assessed for missing values and the extent of the gaps determined their inclusion. The maximum acceptable missing data percentage was 75%, as set out by the Tropospheric Ozone Assessment Report (TOAR metrics, established by [28].
The Irish EPA operates the stations meeting the data threshold of five years (2015–2019) at Rathmines (RTM), Clonskeagh (CSK), Kilkitt (KKT), Emo (EMO), Castlebar (CBR), and Seville Lodge (SVL). Mace Head (MHD) is operated by NUI Galway, Valentia (VAL) by Met Éireann, and Cork City Council operates the Cork South Link Road (CSL) station. In addition, there are two sites in Northern Ireland, Lough Navar (LNV) and Belfast (BFT), which are part of the UK AURN. The 11 stations are located in rural Atlantic, rural, and urban areas (Figure 1; Table 1). The stations of MHD and VAL are located on the west, and southwest coast of Ireland, respectively, distant from sources of precursor emissions, while RTM and CSK are located in Dublin city, and BFT and CSL are located in Belfast and Cork cities, respectively. The stations of KKT, LNV, and EMO are located in rural areas, and the remaining stations of CBR and SVL are located near Castlebar (population ~12,000) and Kilkenny (population~26,000), respectively. Stations were categorised based on the Irish EPA and UK AURN classifications, which have been used in previous studies; Atlantic, urban, urban traffic, suburban, and rural. Station elevations range from 8 m at the Atlantic Station in Mace Head and the urban station in Belfast, to 170 m at the rural station of Kilkitt (Table 1).

2.2. Measurements

Ground level O3 was measured using UV photometry as required by the Ambient Air Quality Directive (2008/50/EC), with results presented hourly in µg/m3, or ppb (1 ppb = 1.9957 µg/m3 at a standard temp of 20 °C and 1013 hPa). Further, as required by the Directive, instruments were routinely calibrated every three months. The concentration is determined using the Beer–Lambert equation, which quantifies light absorption based on the ratio of two light intensities derived from a scrubbed air sample containing no O3, and a sample containing ambient O3. An API photometric analyser (models: 400, T400, 400E Teledyne) is used to measure tropospheric ozone at most of the stations in Ireland and Northern Ireland, apart from CSK and MHD which use the Thermo 49i instrument (Thermo Fisher Scientific, Waltham, MA USA). Further details on the long-term changes in measurement equipment at MHD are provided by [18].

2.3. Data Processing and Analysis

Ozone concentrations from the 11 study stations were based on the most recent five-year period of available data (2015–2019, n = 11). Long-term trends in annual, seasonal, and day and night O3 concentrations were evaluated for stations with 15 years (n = 7) or 10 years (n = 9) of data available. Annual trends were assessed using monthly mean concentrations, which were deseasoned using the seasonal trend decomposition method [29]. Seasonal concentrations and trends were investigated based on meteorological spring (March, April, and May), summer (June, July, and August), autumn (September, October, and November), and winter (December, January, and February). Daytime and night-time mean concentrations were investigated based on 08:00–20:00 and 20:00–08:00 UTC, respectively. Week (Monday–Friday) and weekend (Saturday and Sunday) mean concentrations were compared for all stations. Meteorological data were obtained from Met Éireann (URL: www.met.ie/climate/available-data/historical-data) (accessed on 25 January 2023).
The Theil–Sen slope estimator and the Mann–Kendall (M-K) tests were used to determine slope and significance of the trends following TOAR metrics [28]. The M-K test is not influenced by outliers and needs no assumption of data distribution. The M-K test and Theil–Sen slope estimator were calculated using the Openair package in R [30,31]. Significance is presented along with slope and is represented by p < 0.001 = ∗∗∗, p < 0.01 = ∗∗, p < 0.05 = ∗, and p < 0.1 = +. Long-term trends were evaluated for stations with a minimum of 10 years of data (2010–2019). Nine stations met this long-term data requirement (BFT, CBR, CSK, LNV, MHD, VAL, RTM, KKT, and EMO; see Table 1); this period represents the 10 years since the last study [26]. Long-term trends were also investigated for 15 years, a threshold highlighted by TOAR, using the same stations with the exception of CBR and CSK, which did not meet the 15-year data threshold (Table 1; Figure 1). In the current study, long-term trends were evaluated for annual and seasonal O3, for daytime and night-time periods, and selected percentiles (2, 5, 10, 25, 50, 75, 90, 95, and 98), again following TOAR [28]. Spatial variation (%) was estimated as the coefficient of variation between stations.

3. Results

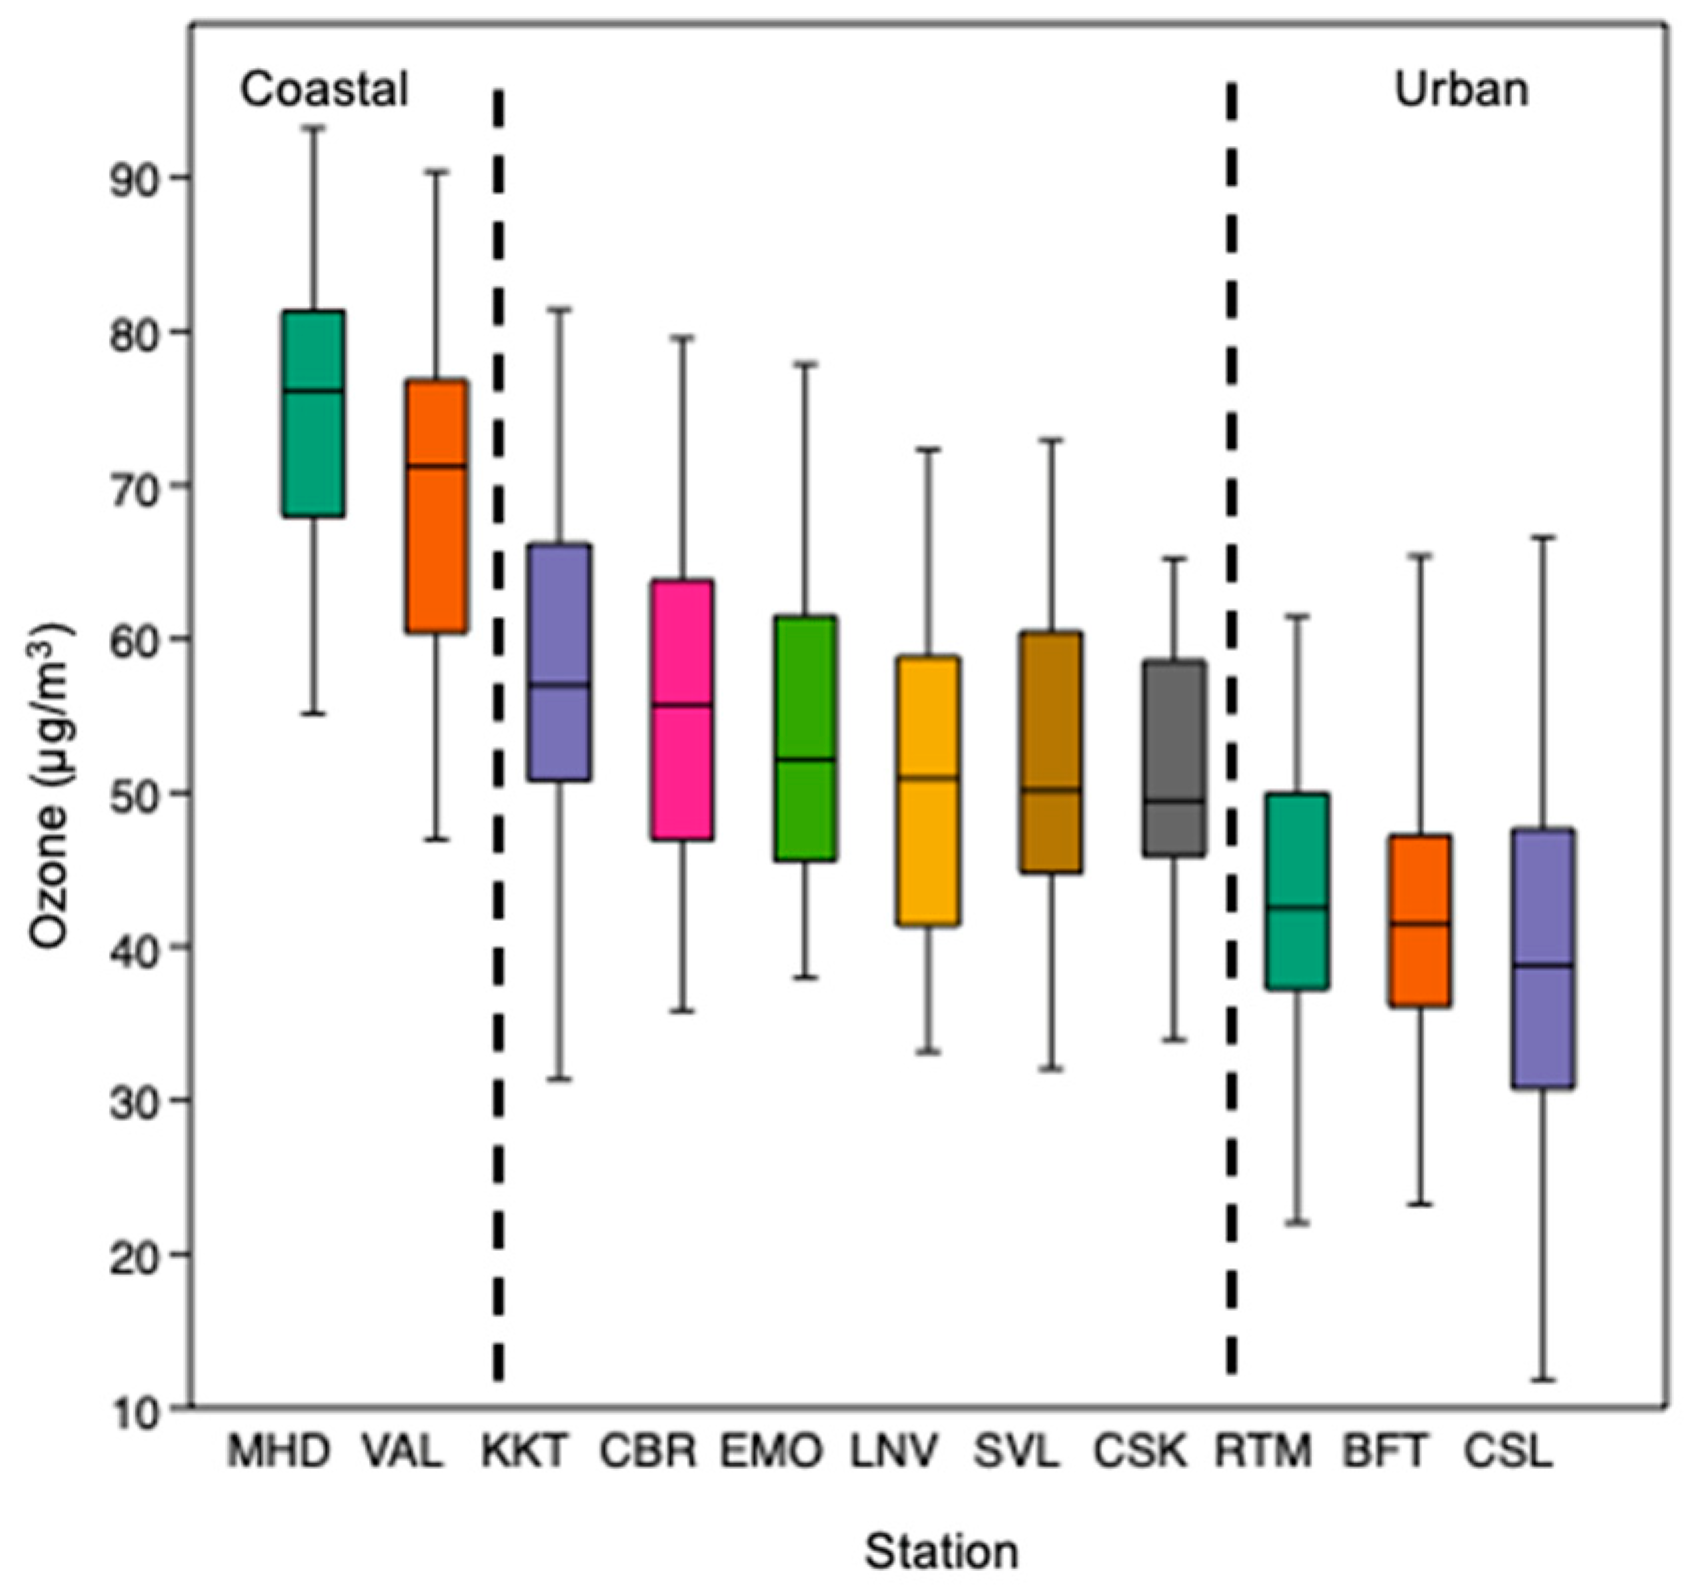
3.1. Annual Concentrations

The mean hourly O3 concentration across the 11 stations during the period 2015–2019 was 53.7 µg/m3 (median: 55 µg/m3; median range: 32.9–77.8 µg/m3; see Figure 2; Table S1). There was moderate spatial variation in annual O3 across the stations (coefficient of variation: 20%). The highest 5-year annual mean concentrations were observed at the coastal stations of MHD and VAL (74.5 and 69.2 µg/m3; see Figure 2 and Figure 3). The rural stations of KKT, EMO, and LNV, and suburban stations of SVL, CSK, and CBR had intermediate annual mean concentrations (see Table S1), with 5-year annual mean concentrations ranging between 50.7 µg/m3 at LNV, and 58.2 µg/m3 at KKT. The remaining three sites, the urban stations of RTM, and BFT, and the urban traffic site at CSL, had the lowest range of annual mean concentrations between 39.3 µg/m3 and 43.3 µg/m3.

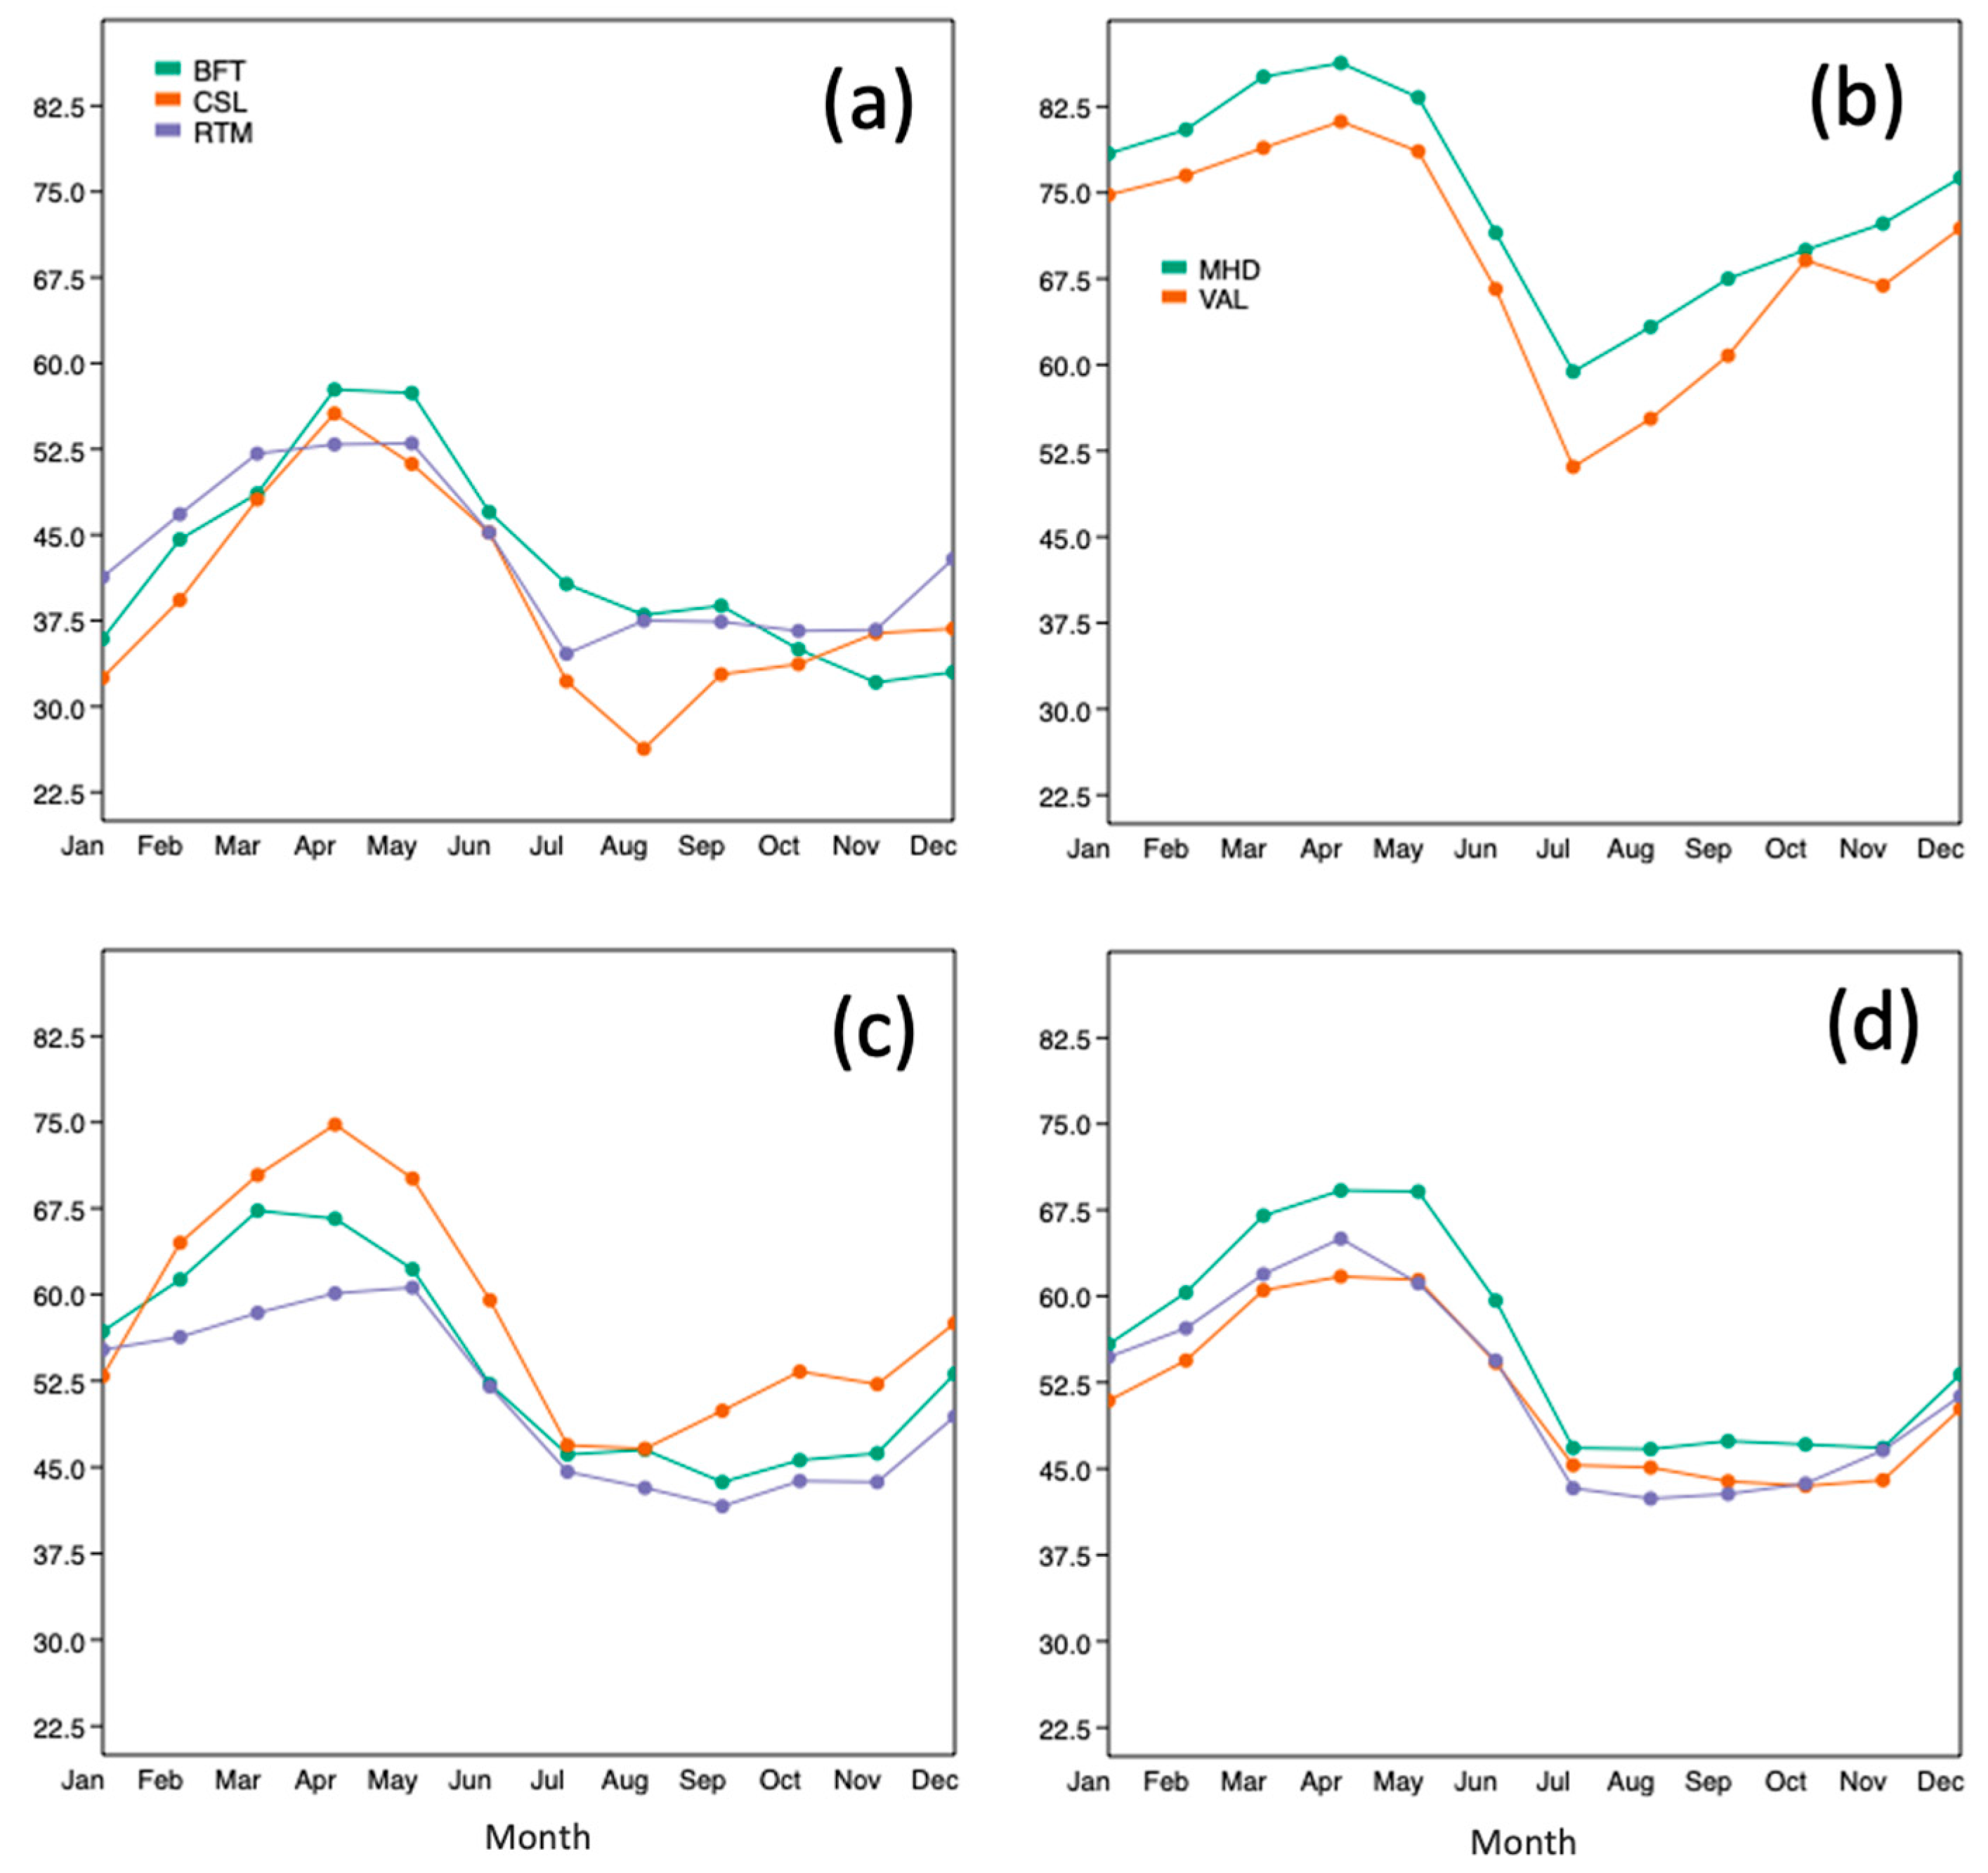
3.2. Seasonal Pattern

A seasonal pattern of a spring maximum and a summer–autumn minimum was observed for all stations (see Figure 4; Table S2). The maximum monthly mean O3 value for 8 of the 11 stations occurred in April (EMO occurred in March, while LNV and RTM occurred in May; see Table S3). In contrast, the lowest mean concentrations occurred between July and November; the west and southwest coastal stations of MHD and VAL had the lowest mean values in July, compared with suburban CSK, and urban BFT which experienced the lowest monthly mean concentration in October and November, respectively. The mean difference between the highest and lowest monthly mean values for all stations was 24.02 µg/m3 (36%). The highest seasonal mean concentration at an urban station was observed at BFT during spring (55 µg/m3), which was lower than the lowest seasonal mean at an Atlantic coastal station (VAL summer 57 µg/m3).
The Atlantic stations (MHD and VAL), and the rural station of KKT experienced the sharpest decline in O3 concentrations across the four months from the spring peak in April to the summer valley in July, with a drop of between 27.0 and 30.0 µg/m3 (decrease of 31–37%; Figure 4). In the four-month period between January and the modal peak in April, the sharpest increases in concentrations were observed at BFT, CSL, and KKT with an increase of 21.8 to 23.1 µg/m3 (29–42%) increase during the four-month period.

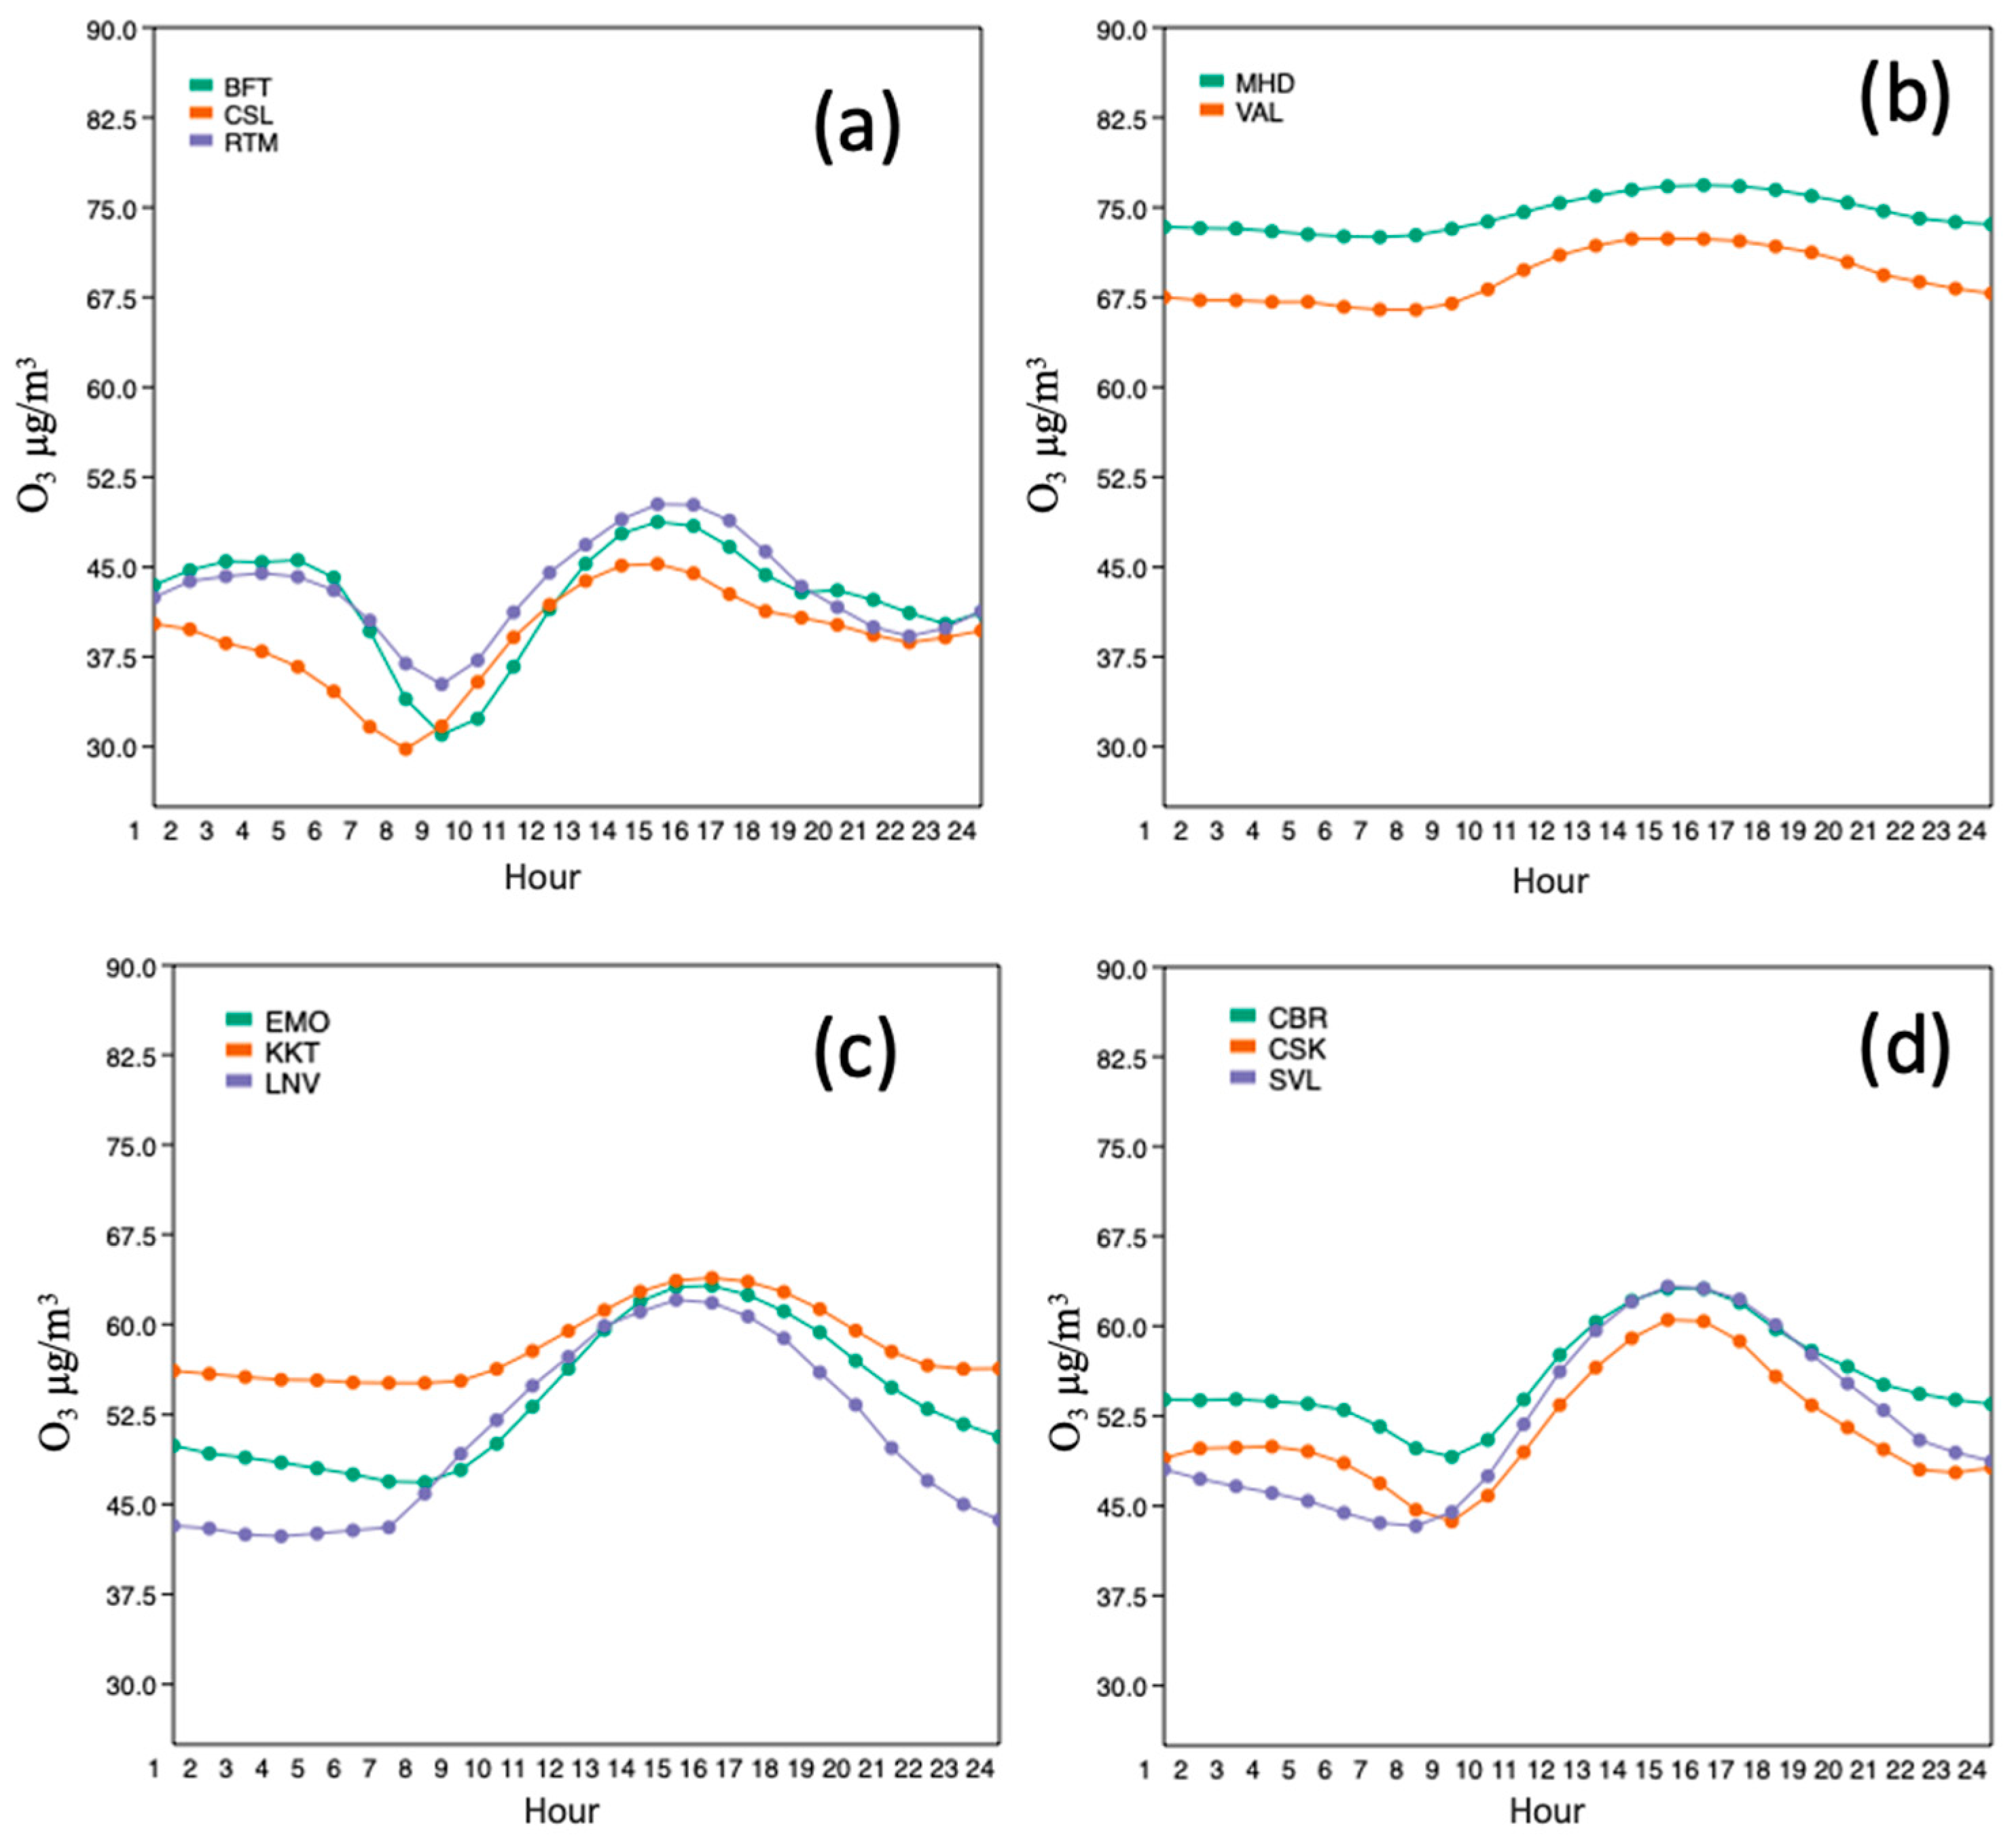
3.3. Weekly and Daily Pattern

The mean O3 concentrations at the urban stations of CSL and BFT between 2015–2019 were 8.8–9.3% (3.7–4.3 µg/m3) lower on weekdays compared with weekends. The daily concentrations followed a pattern of maximum in mid to late afternoon, between 15:00 and 17:00 for all stations, with 8 of the 11 stations having a maximum mean concentration occurring at 15:00 (see Figure 5). The minimum concentrations occurred between 07:00 and 10:00 in the morning with the exception of LNV (04:00–05:00). The rural sites of EMO and LNV, and the suburban site of SVL had the largest variation between daytime (08:00–20:00) and night-time (20:00–08:00) mean concentrations, with daytime concentrations 11.5%, 22.7%, and 13.8% greater than night-time concentrations, respectively. Urban and Atlantic locations had the least variation in concentrations throughout the day (Figure 5), e.g., the urban stations of BFT, CSL, and RTM had night-time concentrations of 0.3%, 5.1%, and 4.6% less than the mean daytime concentrations, respectively.

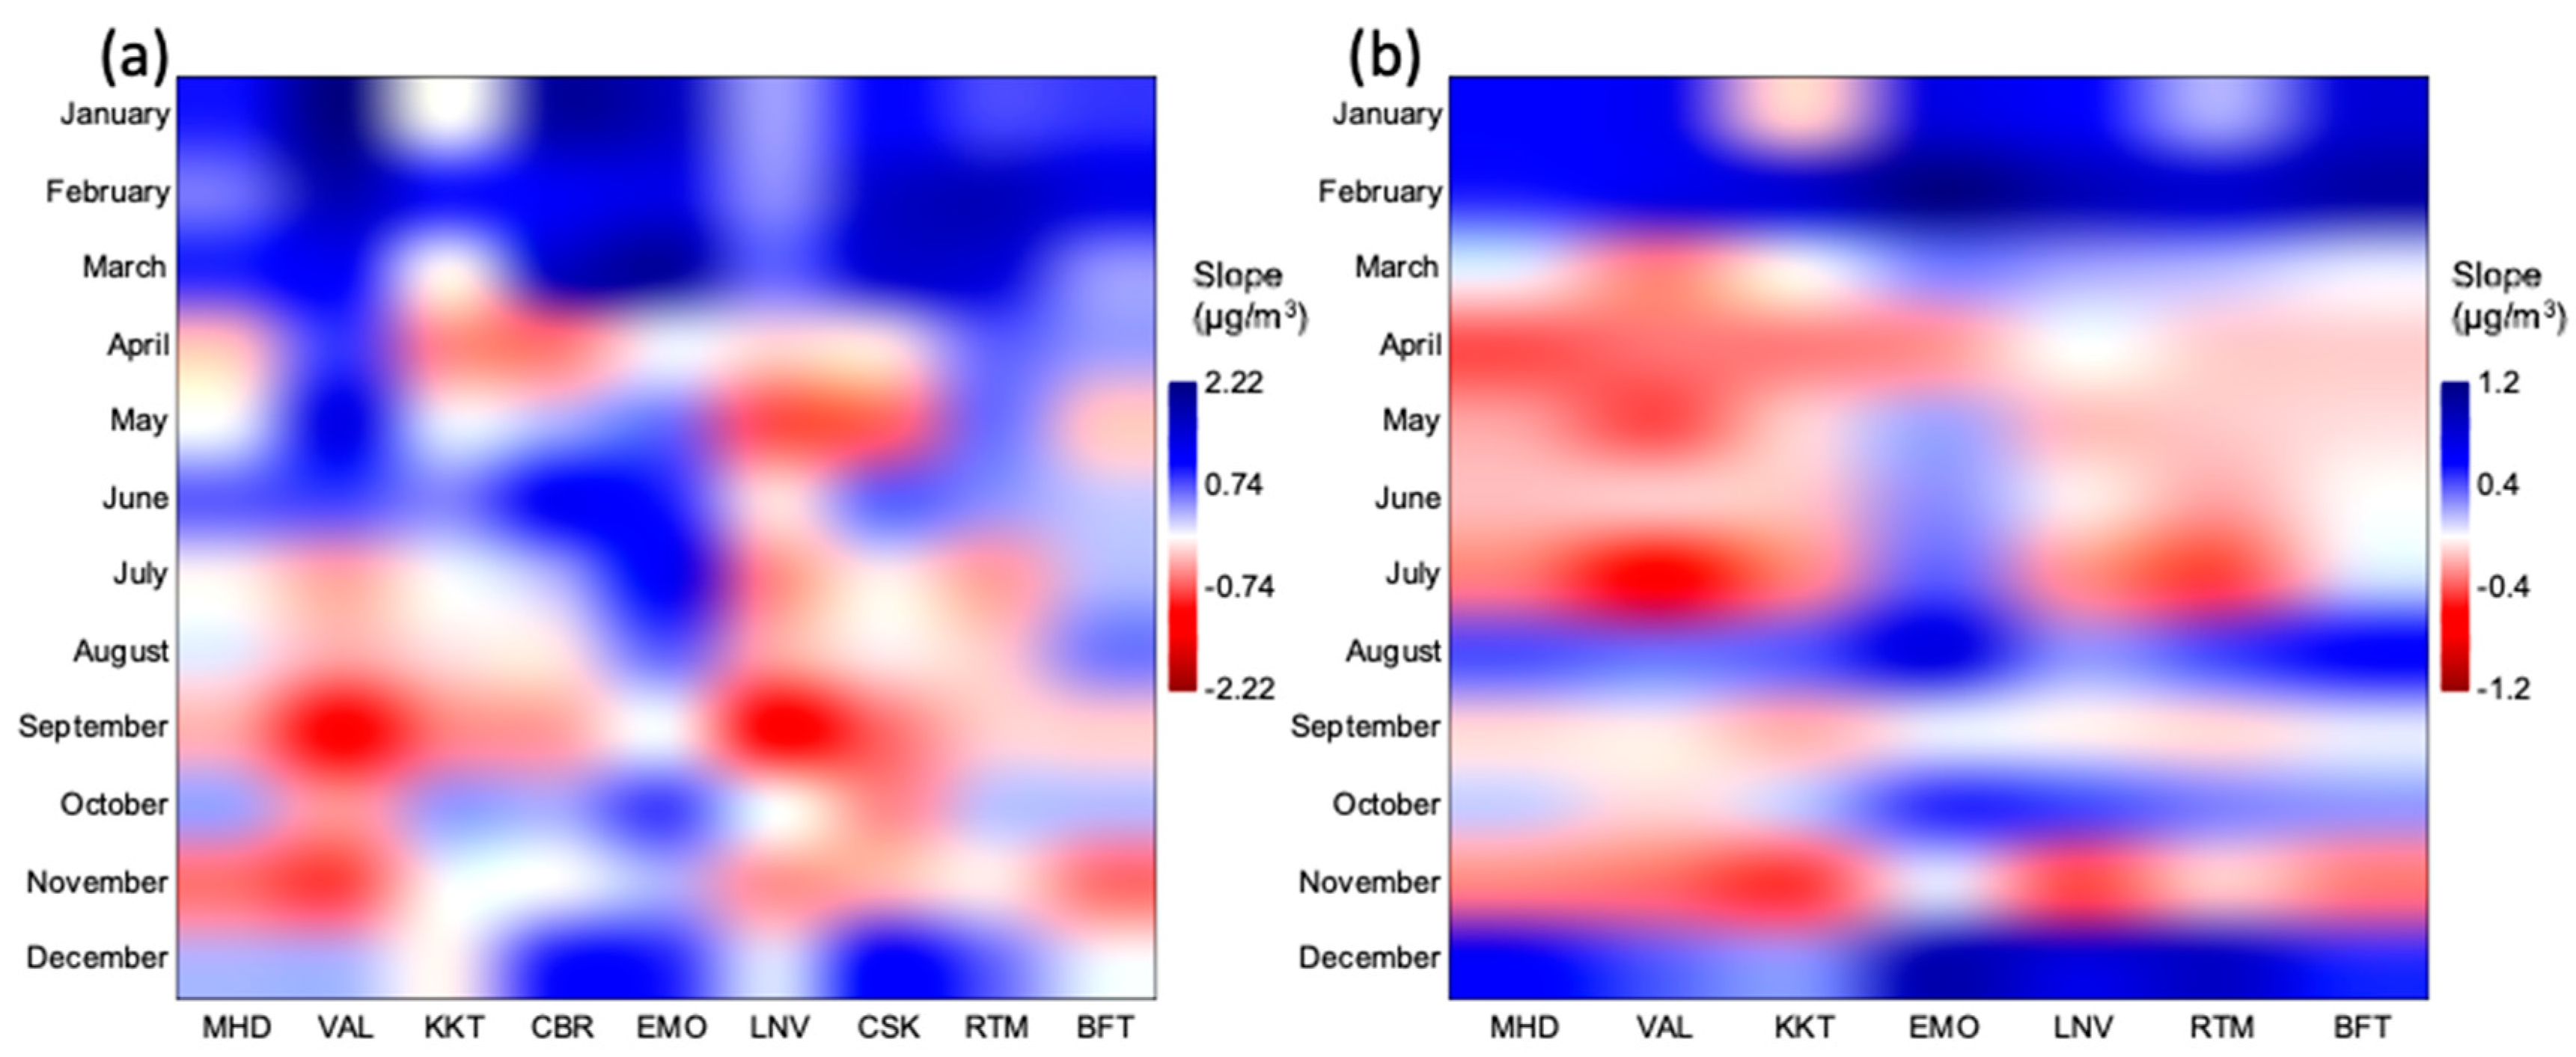
3.4. Long-Term Trends in Concentrations

The dominant long-term trend across stations was an increase in O3 concentration, with few decreasing trends (Table 2). The rural station of EMO had significant increases in the 15 (2005–2019) and 10-year (2010–2019) periods, for annual, daytime, and night-time concentrations, which were the most statistically significant changes out of all the stations. A second rural station (LNV) had significant increases over 15 years annually and daytime. The urban station of BFT had increased during daytime for both 15 and 10 years. A second urban station (RTM) had significant increases in 10 years annually and night-time. Finally, the sub-urban station of CBR had significant increases for 10 years annually, daytime and night. These significant changes occurred in the 2nd to 25th percentiles for the 15-year period, in comparison to the 2nd to 90th for the 10-year period (see Tables S4 and S5).
The seasonal trends showed a similar dominance of increases in O3, especially during winter (Table 3). The rural station of EMO had significant increases for summer over both 10 and 15 years. However, the most common significant increases occurred during winter over 15 years, with a cross-section of station types; urban (BFT), rural (EMO and LNV), and the Atlantic coastal (MHD) stations. The long-term monthly changes were primarily dominated by increases in winter (see Figure 6) with the most significant increases occurring in February (see Tables S6–S9).

4. Discussion

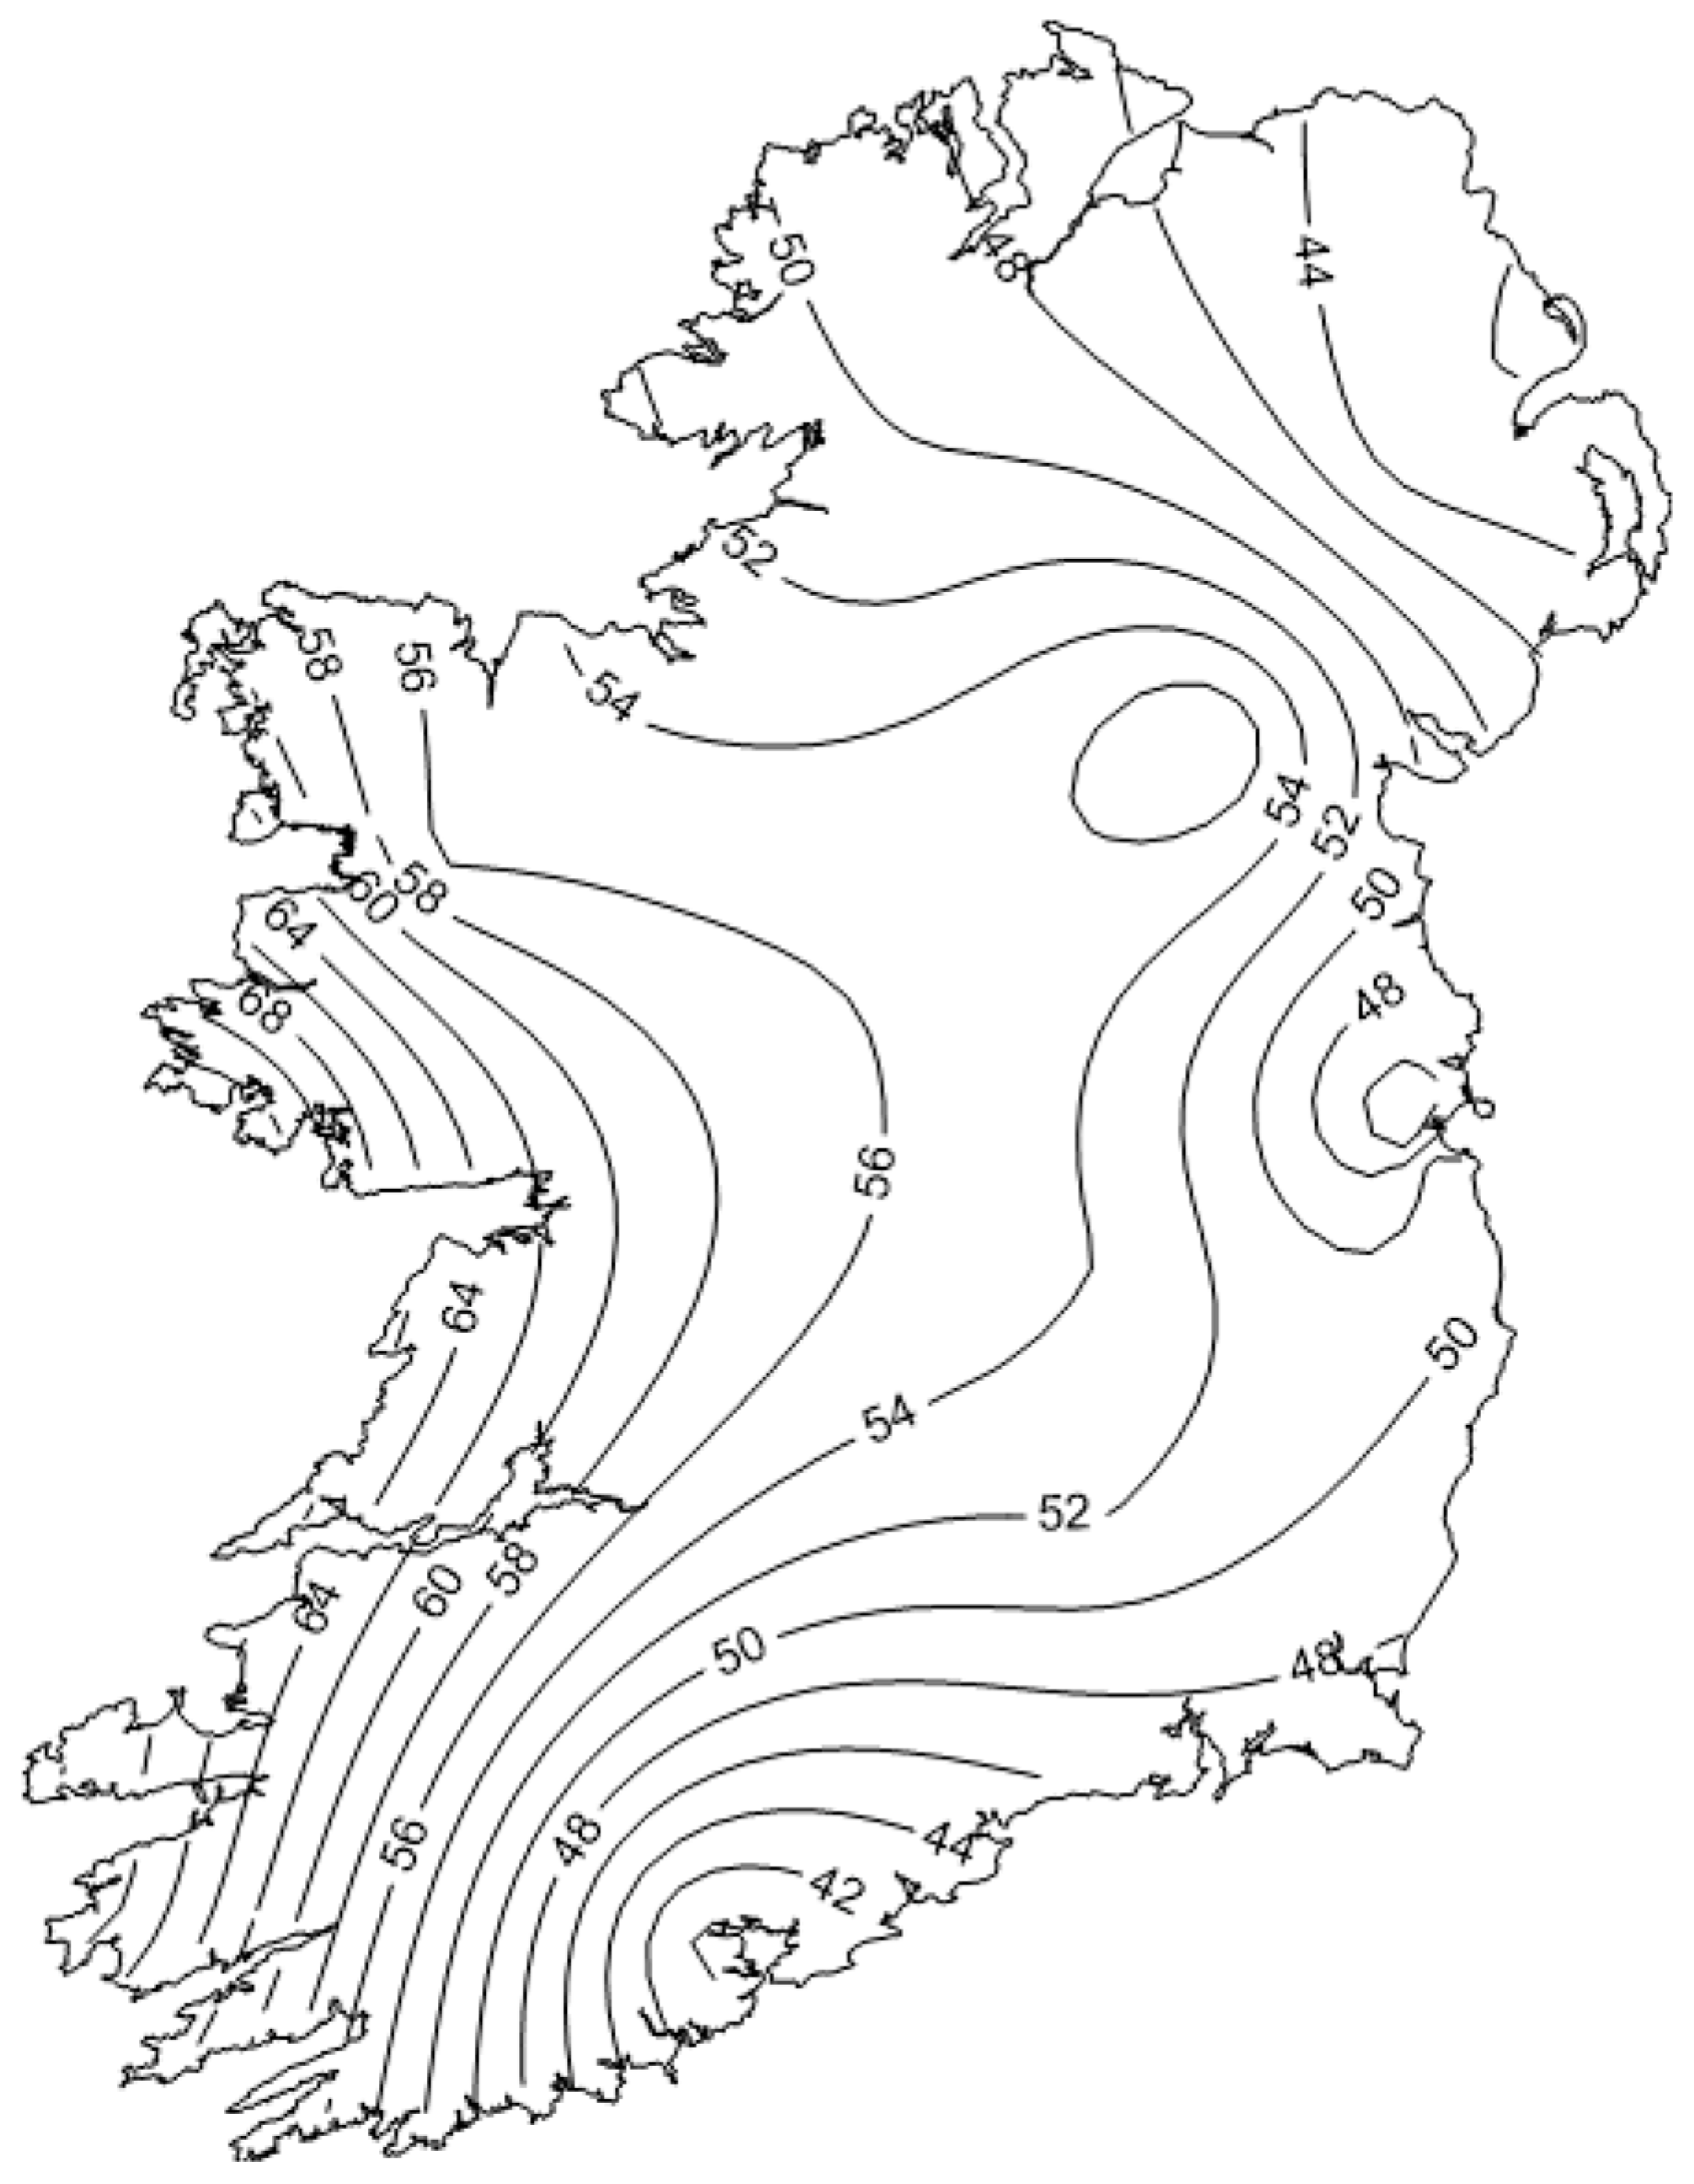
4.1. Spatial Variation of O3 Concentrations

The annual average O3 concentrations in Ireland (53.7 µg/m3; SD: 10.3 µg/m3) are consistent with countries in northwest Europe, which experience similar or lower concentrations, e.g., annual average concentrations in Denmark: 56 µg/m3 (SD: 7.5 µg/m3), the UK (including Northern Ireland): 48 µg/m3 (SD: 9.5 µg/m3), and Belgium: 46 µg/m3 (SD: 6.6 µg/m3). Urban or industrialised areas tend to have lower concentrations than non-urban areas [24,32], owing to higher emissions of NOx from fossil fuel combustion in transport leading to increased removal of O3 by NO. In this study, the three urban stations (BFT, CSL, and RTM) experienced the lowest O3 concentrations, suggesting removal by locally emitted NO.
Throughout Europe, rural areas located downwind of the urban centres experience higher levels of O3 due to precursor transport, which can be at distances of hundreds or thousands of kilometres [32,33]. Rural stations generally have lower titration of O3 by NO, and higher emissions of biogenic VOCs, leading to higher O3 concentrations sometimes found in these areas [20,34] which is evident in this study.
The high concentrations observed in windward coastal areas can rapidly drop off as a result of the increased deposition of O3 over vegetated surfaces, which leads to progressive O3 loss to the surface downwind and inland [35,36,37]. Low levels of NOx at the Atlantic coastal stations of MHD, and VAL lead to uninterrupted high O3 marine air masses not observed elsewhere. In contrast urban centres located in coastal areas in this study (BFT, CSL, and RTM), experienced lower concentrations due to both the titration effect from local emissions, and their placement on south and east coasts, with prevailing winds coming from land rather than sea, distinguishing them from the coastal Atlantic locations.

4.2. Temporal Variation of O3 Concentrations

The seasonal pattern of a spring maximum and a summer–autumn minimum was observed for all stations regardless of location (see Table S2; Figure 4), as noted by other studies [18,25]. A spring maximum has been observed across the northern hemisphere, in parts of Europe, North America, and East Asia [38], however, a summer maximum in the interior of Europe is also common [39]. Higher surface O3 concentrations during the spring can be attributed to increasing levels of solar radiation [24,32], which after a build-up of precursors during the winter period, increases O3 formation [40,41]. Further, the stratosphere–troposphere exchange peaks during May in the Northern Hemisphere, which contributes to the tropospheric O3 peak during this time. However, the annual cycle of a spring maximum has been observed for other trace gases at MHD, which do not have stratospheric inputs [42], suggesting that long-range transport of precursors from biomass burning events during the springtime may be a contributing factor [32,43]. In rural agricultural areas, the application of organic and inorganic fertilisers during spring along with warming soil temperatures is a source of NOx in an otherwise low-NOx environment and may also be a contributing factor to the higher O3 concentrations during this time [13,44]. The summer–autumn O3 minimum experienced in Ireland is not common in Europe, with studies citing instead an average winter minimum due to lower temperatures and levels of sunlight [19,24]. However, in Ireland, winter was the second-highest seasonal average for all stations except BFT. The summer minimum is a common phenomenon for other trace gases measured at MHD [42] indicating a larger-scale process of increased removal through deposition, combined with lower levels of emissions.
The lower weekday ozone concentrations for BFT and CSL, at urban stations where traffic emissions are expected to be higher, are consistent with studies in cities in the US, Italy, and South Korea, which had an average difference of 8.1%, 9.0%, and 9.9% (respectively) during the period 2005–2014 [7]. However, the urban station RTM did not show this pattern, suggesting that traffic emissions are equally high during weekday and weekend periods at this location.
The diurnal O3 concentrations were strongly influenced by daylight and at urban stations by the traffic rush hour times. The morning dip experienced at urban stations can be attributed to O3 destruction by NO emitted from rush-hour traffic, which is followed by an increase to a peak in the late afternoon, and a dip in the evening again after rush hour. The high contrast between daytime and night-time concentrations which is usually stronger in urban areas, results from the lack of photochemical production overnight, along with continued O3 removal through deposition and scavenging by NO [45]; with the difference enhanced further by the shallower nocturnal boundary layer, compared to the daytime convective boundary layer.

4.3. Long-Term Trends in O3 Concentrations

Increasing O3 concentrations were observed in western Europe up to the year 2000, after which a levelling off occurred [22,25,46]. In Europe since then, increases have primarily been observed at urban stations [7,34]. In the UK between the early 1990s and 2006, increases in mid and lower percentiles were observed [47], while there was a decrease in the exceedance of thresholds for health up to 2019 [48]. In Ireland, increasing concentrations were also observed at stations up to the year 2000, followed by a possible stabilisation up to 2009 [25]. In the decade following that study, here we record significant site- and season-specific increases at several stations (Table 2 and Table 3), which may be driven by precursor emissions, consistent with recorded exceedances of emissions limits.
During the 15-year period (2005–2019), significant increases observed at three stations were not due to changes in peak concentrations, but rather to increases in the lower percentiles. The lower percentiles have been rising in recent years in urban areas across Europe [7]. However, studies have previously reported a decreasing trend in baseline concentrations in the marine boundary layer and free troposphere in northern mid-latitudes [17,18] which has not been reflected at stations in this study. Long-range hemispheric transport of O3 sets the baseline concentrations at the Atlantic coastal stations [47], represented by the higher-percentile concentrations reported here, with lower values representing the net effects of removal by deposition to surfaces, formation of new ozone, and destruction of imported and newly formed ozone. Further, climate changes are impacting O3 formation, through changes to stratospheric input, and an increase in NOx emissions from lightning [40,49,50].
Annual average concentrations mask differing changes in winter versus summer concentrations where significant winter increases and summer decreases can numerically cancel each other out, which similarly occurs with day and night concentrations. For all stations, the dominant and largest long-term increases were observed during winter, which is consistent with studies in Northern Europe [19]; again, these increases may be driven by long-range transport of O3 and precursors from hemispheric transport and changes in climate.

5. Conclusions

Site- and season-specific significant increases were observed in this study, driven by increases in winter and lower-percentile concentrations. While summer decreases and winter increases occur without net annual trends at some stations, the rural stations of EMO and LNV, and the urban stations of BFT had significant increases in O3 concentrations. These significant increases are in contrast to stations in Europe where decreases have occurred. The largest increases occurred during winter, which following spring was the season with the highest mean O3 concentrations. Significant increases in the spring and winter may lead to an increase in the exceedances of threshold values for the protection of human and vegetation health, especially given the humid climate and longer growing season. Where an increasing trend in O3 concentrations were recorded, they likely reflected changes in regional precursor gas emissions sources. Despite reported decreases in background concentrations in the marine boundary layer in northern mid-latitudes in recent decades, O3 concentrations at some sites in Ireland have increased significantly primarily driven by changes in winter concentrations.

Supplementary Materials

The following supporting information can be downloaded at: https://0-www-mdpi-com.brum.beds.ac.uk/article/10.3390/atmos14030569/s1, Table S1: Annual mean O3 concentrations (µg/m3) at ambient air quality monitoring stations in Ireland for the period 2015–2019; Table S2: Seasonal mean O3 concentrations 2015–2019; Table S3: Monthly mean values for the period 2015–2019; Table S4: Long-term trends using Mann-Kendall test during 10-year period (2005–2019), for chosen percentiles of data for each station, the p-value with significance is shown; Table S5: Long-term trends using Mann-Kendall test during 15-year period (2005–2019), for chosen percentiles of data for each station, the p-value with significance is shown; Table S6: Monthly long-term trend slope with significance for 10-years (2010–2019); Table S7: Monthly long-term trend slope with significance for 15-years (2005–2019); Table S8: Significance values for 10-year long-term trends; Table S9: Significance values for 15-year long-term trends; Figure S1: Annual median O3 concentrations for all stations over 2005–2019; Figure S2: Pollutant concentrations for the urban station RTM, during summer 2021 (top graph 28–29 of June; bottom graph 17–18 July). The negative relationship between NO2 and O3 is visible (screenshot source: https://airquality.ie/station/EPA-22).

Author Contributions

Conceptualization, K.M., T.C. and J.A.; methodology, K.M., T.C. and J.A.; formal analysis, K.M.; investigation, K.M.; writing—original draft preparation, K.M.; writing—review and editing, K.M., T.C. and J.A.; project administration, T.C.; funding acquisition, T.C. All authors have read and agreed to the published version of the manuscript.

Funding

This research was funded by Environmental Protection Agency Ireland (EPA), grant number 2019-CCRP-LS.3.

Institutional Review Board Statement

Not applicable.

Informed Consent Statement

Not applicable.

Data Availability Statement

Data used in this study are available from three online databases: EPA SAFER (URL: eparesearch.epa.ie/safer/iso19115/display?isoID=66 (accessed on 25 January 2023)), European Environment Agency (URL: discomap.eea.europa.eu/map/fme/AirQualityExport.htm (accessed on 15 March 2023)), and UK Department for the Environment Food and Rural Affairs (URL: uk-air.defra.gov.uk/networks/network-info?view=aurn (accessed on 25 January 2023)).

Acknowledgments

The authors greatly appreciate the helpful comments from the two anonymous reviewers.

Conflicts of Interest

The authors declare no conflict of interest.

References

  1. CLRTAP. CLRTAP. 2016. Towards Cleaner Air; Scientific Assessment Report 2016; Maas, R., Grennfelt, P., Eds.; EMEP Steering Body and Working Group on Effects of the Convention on Long-Range Transboundary Air Pollution: Oslo, Norway, 2016; p.12. [Google Scholar]
  2. WHO. Review of Evidence on Health Aspects of Air Pollution–REVIHAAP Project; World Health Organization: Geneva, Switzerland, 2017. [Google Scholar]
  3. EEA. Health Effects of Exposure to Ozone. 2016. Available online: https://www.eea.europa.eu/publications/TOP08-98/page010.html (accessed on 25 January 2023).
  4. Mills, G.; Wagg, S.; Harmens, H. Ozone Pollution: Impacts on Ecosystem Services and Biodiversity; NERC/Centre for Ecology & Hydrology: Lancaster, UK, 2013. [Google Scholar]
  5. Fowler, D.; Amann, M.; Anderson, R.; Ashmore, M.; Cox, P.; Depledge, M.; Derwent, D.; Grennfelt, P.; Hewitt, N.; Hov, O.; et al. Ground-Level Ozone in the 21st Century: Future Trends, Impacts and Policy Implications; The Royal Society: London, UK, 2008. [Google Scholar]
  6. Pusede, S.E.; Cohen, R.C. On the observed response of ozone to NO x and VOC reactivity reductions in San Joaquin Valley California 1995–present. Atmos. Chem. Phys. 2012, 12, 8323–8339. [Google Scholar] [CrossRef] [Green Version]
  7. Sicard, P.; Paoletti, E.; Agathokleous, E.; Araminienė, V.; Proietti, C.; Coulibaly, F.; De Marco, A. Ozone weekend effect in cities: Deep insights for urban air pollution control. Environ. Res. 2020, 191, 110193. [Google Scholar] [CrossRef] [PubMed]
  8. Coggon, M.M.; Gkatzelis, G.I.; McDonald, B.C.; Gilman, J.B.; Schwantes, R.H.; Abuhassan, N.; Aikin, K.C.; Arend, M.F.; Berkoff, T.A.; Brown, S.S.; et al. Volatile chemical product emissions enhance ozone and modulate urban chemistry. Proc. Natl. Acad. Sci. USA 2021, 118, e2026653118. [Google Scholar] [CrossRef]
  9. Sicard, P. Ground-level ozone over time: An observation-based global overview. Curr. Opin. Environ. Sci. Health 2021, 19, 100226. [Google Scholar] [CrossRef]
  10. EPA 2021. Available online: https://www.epa.ie/publications/monitoring--assessment/climate-change/air-emissions/EPA-Irelands-Air-Pollutant-Emissions-report_2021Final.pdf (accessed on 25 January 2023).
  11. Duffy, P.; Black, K.; Fahey, D.; Hyde, B.; Kehoe, A.; Monaghan, S.; Murphy, J.; Ryan, A.; Ponzi, J. Ireland’s National Inventory Report 2022 Greenhouse Gas Emissions 1990–2020 Reported to the United Nations Framework Convention on Climate Change; Envioronmental Protection Agency: Wexford, Ireland, 2022. [Google Scholar]
  12. Andersson, C.; Langner, J.; Bergstroumm, R. Interannual variation and trends in air pollution over Europe due to climate variability during 1958–2001 simulated with a regional CTM coupled to the ERA40 reanalysis. Tellus B Chem. Phys. Meteorol. 2007, 59, 77–98. [Google Scholar] [CrossRef] [Green Version]
  13. Lu, X.; Zhang, L.; Shen, L. Meteorology and climate influences on tropospheric ozone: A review of natural sources, chemistry, and transport patterns. Curr. Pollut. Rep. 2019, 5, 238–260. [Google Scholar] [CrossRef] [Green Version]
  14. Meleux, F.; Solmon, F.; Giorgi, F. Increase in summer European ozone amounts due to climate change. Atmos. Environ. 2007, 41, 7577–7587. [Google Scholar] [CrossRef]
  15. Creilson, J.K.; Fishman, J.; Wozniak, A.E. Intercontinental transport of tropospheric ozone: A study of its seasonal variability across the North Atlantic utilizing tropospheric ozone residuals and its relationship to the North Atlantic Oscillation. Atmos. Chem. Phys. 2003, 3, 2053–2066. [Google Scholar] [CrossRef] [Green Version]
  16. Young, P.J.; Archibald, A.T.; Bowman, K.W.; Lamarque, J.F.; Naik, V.; Stevenson, D.S.; Tilmes, S.; Voulgarakis, A.; Wild, O.; Bergmann, D.; et al. Pre-industrial to end 21st century projections of tropospheric ozone from the Atmospheric Chemistry and Climate Model Intercomparison Project (ACCMIP). Atmos. Chem. Phys. 2013, 13, 2063–2090. [Google Scholar] [CrossRef] [Green Version]
  17. Parrish, D.D.; Derwent, R.G.; Steinbrecht, W.; Stübi, R.; Van Malderen, R.; Steinbacher, M.; Trickl, T.; Ries, L.; Xu, X. Zonal similarity of long-term changes and seasonal cycles of baseline ozone at northern midlatitudes. J. Geophys. Res. Atmos. 2020, 125, e2019JD031908. [Google Scholar] [CrossRef]
  18. Derwent, R.G.; Manning, A.J.; Simmonds, P.G.; Spain, T.G.; O’Doherty, S. Long-term trends in ozone in baseline and European regionally-polluted air at Mace Head, Ireland over a 30-year period. Atmos. Environ. 2018, 179, 279–287. [Google Scholar] [CrossRef] [Green Version]
  19. Karlsson, P.E.; Klingberg, J.; Engardt, M.; Andersson, C.; Langner, J.; Karlsson, G.P.; Pleijel, H. Past, present and future concentrations of ground-level ozone and potential impacts on ecosystems and human health in northern Europe. Sci. Total Environ. 2017, 576, 22–35. [Google Scholar] [CrossRef] [PubMed]
  20. Paoletti, E.; De Marco, A.; Beddows, D.C.; Harrison, R.M.; Manning, W.J. Ozone levels in European and USA cities are increasing more than at rural sites, while peak values are decreasing. Environ. Pollut. 2014, 192, 295–299. [Google Scholar] [CrossRef]
  21. Yan, Y.; Pozzer, A.; Ojha, N.; Lin, J.; Lelieveld, J. Analysis of European ozone trends in the period 1995–2014. Atmos. Chem. Phys. 2018, 18, 5589–5605. [Google Scholar] [CrossRef] [Green Version]
  22. Cooper, O.R.; Parrish, D.D.; Ziemke, J.; Balashov, N.V.; Cupeiro, M.; Galbally, I.E.; Gilge, S.; Horowitz, L.; Jensen, N.R.; Lamarque, J.F.; et al. Global distribution and trends of tropospheric ozone: An observation-based review. Elem. Sci. Anthr. 2014, 2, 000029. [Google Scholar] [CrossRef]
  23. Soleimanian, E.; Wang, Y.; Estes, M. Long-term trend in surface ozone in Houston-Galveston-Brazoria: Sectoral contributions based on changes in volatile organic compounds. Environ. Pollut. 2022, 308, 119647. [Google Scholar] [CrossRef]
  24. Sicard, P.; Serra, R.; Rossello, P. Spatiotemporal trends in ground-level ozone concentrations and metrics in France over the time period 1999–2012. Environ. Res. 2016, 149, 122–144. [Google Scholar] [CrossRef]
  25. Tripathi, O.P.; Jennings, S.G.; Colman, L.; Lambkin, K.; Moran, E.; O’Dowd, C. Ozone Levels, Changes and Trends over Ireland: An Integrated Analysis; Environmental Protection Agency: Wexford, Ireland, 2010. [Google Scholar]
  26. Tripathi, O.P.; Jennings, S.G.; O’Dowd, C.; O’Leary, B.; Lambkin, K.; Moran, E.; O’Doherty, S.J.; Spain, T.G. An assessment of the surface ozone trend in Ireland relevant to air pollution and environmental protection. Atmos. Poll. Res. 2012, 3, 341–351. [Google Scholar] [CrossRef] [Green Version]
  27. de Kluizenaar, Y.; Aherne, J.; Farrell, E.P. Concentrations, cumulative exposure tand critical levels of ozone in Ireland. Water Air Soil Pollut. Focus 2001, 1, 197–210. [Google Scholar] [CrossRef]
  28. Lefohn, A.S.; Malley, C.S.; Smith, L.; Wells, B.; Hazucha, M.; Simon, H.; Naik, V.; Mills, G.; Schultz, M.G.; Paoletti, E.; et al. Tropospheric ozone assessment report: Global ozone metrics for climate change, human health, and crop/ecosystem research. Elem. Sci. Anthr. 2018, 6, 28. [Google Scholar] [CrossRef] [Green Version]
  29. Cleveland, R.B.; Cleveland, W.S.; McRae, J.E.; Terpenning, I. STL: A seasonal-trend decomposition. J. Off. Stat 1990, 6, 3–73. [Google Scholar]
  30. R Core Team. R: A Language and Environment for Statistical Computing. R Foundation for Statistical Computing, Vienna, Austria. 2022. Available online: https://www.R-project.org/ (accessed on 25 January 2023).
  31. Carslaw, D.C.; Ropkins, K. Openair—An R package for air quality data analysis. Environ. Model. Softw. 2012, 27, 52–61. [Google Scholar] [CrossRef]
  32. Monks, P.S.; Archibald, A.T.; Colette, A.; Cooper, O.; Coyle, M.; Derwent, R.; Fowler, D.; Granier, C.; Law, K.S.; Mills, G.E.; et al. Tropospheric ozone and its precursors from the urban to the global scale from air quality to short-lived climate forcer. Atmos. Chem. Phys. 2015, 15, 8889–8973. [Google Scholar] [CrossRef] [Green Version]
  33. Wilson, R.C.; Fleming, Z.L.; Monks, P.S.; Clain, G.; Henne, S.; Konovalov, I.B.; Szopa, S.; Menut, L. Have primary emission reduction measures reduced ozone across Europe? An analysis of European rural background ozone trends 1996–2005. Atmos. Chem. Phys. 2012, 12, 437–454. [Google Scholar] [CrossRef] [Green Version]
  34. Sicard, P.; De Marco, A.; Troussier, F.; Renou, C.; Vas, N.; Paoletti, E. Decrease in surface ozone concentrations at Mediterranean remote sites and increase in the cities. Atmos. Environ. 2013, 79, 705–715. [Google Scholar] [CrossRef]
  35. Jenkin, M.E. Investigation of an oxidant-based methodology for AOT40 exposure assessment in the UK. Atmos. Environ. 2014, 94, 332–340. [Google Scholar] [CrossRef]
  36. Pleijel, H.; Klingberg, J.; Karlsson, G.P.; Engardt, M.; Karlsson, E. Surface ozone in the marine environment—Horizontal ozone concentration gradients in coastal areas. Water Air Soil Pollut. 2013, 224, 1–10. [Google Scholar] [CrossRef]
  37. Simpson, D.; Ashmore, M.R.; Emberson, L.; Tuovinen, J.P. A comparison of two different approaches for mapping potential ozone damage to vegetation. A model study. Environ. Pollut. 2007, 146, 715–725. [Google Scholar] [CrossRef] [PubMed]
  38. Gaudel, A.; Cooper, O.R.; Ancellet, G.; Barret, B.; Boynard, A.; Burrows, J.P.; Clerbaux, C.; Coheur, P.F.; Cuesta, J.; Cuevas, E.; et al. Tropospheric Ozone Assessment Report: Present-day distribution and trends of tropospheric ozone relevant to climate and global atmospheric chemistry model evaluation. Elem. Sci. Anthr. 2018, 6, 39. [Google Scholar] [CrossRef] [Green Version]
  39. Monks, P.S. A review of the observations and origins of the spring ozone maximum. Atmos. Environ. 2000, 34, 3545–3561. [Google Scholar] [CrossRef]
  40. Collins, W.J.; Derwent, R.G.; Garnier, B.; Johnson, C.E.; Sanderson, M.G.; Stevenson, D.S. Effect of stratosphere-troposphere exchange on the future tropospheric ozone trend. J. Geophys. Res. Atmos. 2003, 108, 8528. [Google Scholar] [CrossRef] [Green Version]
  41. Salisbury, G.; Monks, P.S.; Bauguitte, S.; Bandy, B.J.; Penkett, S.A. A seasonal comparison of the ozone photochemistry in clean and polluted air masses at Mace Head, Ireland. J. Atmos. Chem. 2002, 41, 163–187. [Google Scholar] [CrossRef]
  42. Derwent, R.; Parrish, D.; Simmonds, P.G.; O’Doherty, S.J.; Spain, T.G. Seasonal cycles in baseline mixing ratios of a large number of trace gases at the Mace Head, Ireland atmospheric research station. Atmos. Environ. 2020, 233, 117531. [Google Scholar] [CrossRef]
  43. Schultz, M.G.; Heil, A.; Hoelzemann, J.J.; Spessa, A.; Thonicke, K.; Goldammer, J.; Held, A.C.; Pereira, J.M.; van het Bolscher, M. Global emissions from wildland fires from 1960 to 2000. Glob. Biogeochem. Cycles 2008, 22, 2. [Google Scholar] [CrossRef]
  44. Hall, S.J.; Matson, P.A.; Roth, P.M. NOx emissions from soil: Implications for air quality modeling in agricultural regions. Annu. Rev. Energy Environ. 1996, 21, 311–346. [Google Scholar] [CrossRef]
  45. Tarasick, D.; Galbally, I.E.; Cooper, O.R.; Schultz, M.G.; Ancellet, G.; Leblanc, T.; Wallington, T.J.; Ziemke, J.; Liu, X.; Steinbacher, M.; et al. Tropospheric Ozone Assessment Report: Tropospheric ozone from 1877 to 2016, observed levels, trends and uncertainties. Elem. Sci. Anthr. 2019, 7, 39. [Google Scholar] [CrossRef] [Green Version]
  46. Derwent, R.G.; Manning, A.J.; Simmonds, P.G.; Spain, T.G.; O’Doherty, S. Analysis and interpretation of 25 years of ozone observations at the Mace Head Atmospheric Research Station on the Atlantic Ocean coast of Ireland from 1987 to 2012. Atmos. Environ. 2013, 80, 361–368. [Google Scholar] [CrossRef]
  47. Jenkin, M.E. Trends in ozone concentration distributions in the UK since 1990: Local, regional and global influences. Atmos. Environ. 2008, 42, 5434–5445. [Google Scholar] [CrossRef]
  48. Diaz, F.M.; Khan, M.A.H.; Shallcross, B.M.; Shallcross, E.D.; Vogt, U.; Shallcross, D.E. Ozone trends in the United Kingdom over the last 30 years. Atmosphere 2020, 11, 534. [Google Scholar] [CrossRef]
  49. Lefohn, A.S.; Wernli, H.; Shadwick, D.; Oltmans, S.J.; Shapiro, M. Quantifying the importance of stratospheric-tropospheric transport on surface ozone concentrations at high-and low-elevation monitoring sites in the United States. Atmos. Environ. 2012, 62, 646–656. [Google Scholar] [CrossRef]
  50. Myhre, G.; Shindell, D.; Pongratz, J. Anthropogenic and Natural Radiative Forcing; Climate Change 2013: The Physical Science Basis; Working Group I contribution to the fifth assessment report of the Intergovernmental Panel on Climate Change; Cambridge University Press: Cambridge, CA, USA, 2014; pp. 659–740. [Google Scholar]
Figure 1. Ambient air quality monitoring stations (n = 11) measuring tropospheric ozone that meet the minimum data threshold of five years (2015–2019), and the seven stations that meet the 15-year threshold (2005–2019; represented by red filled circles) on the island of Ireland (see Table 1 for station ID codes). The dashed line represents the border between Northern Ireland (UK) and Ireland.
Atmosphere 14 00569 g001
Figure 2. Box plots displaying monthly mean ozone concentrations (µg/m3) for the monitoring stations based on the period 2015–2019 (dashed lines separate Atlantic coastal from rural–sub-urban, and urban). The median, 95-, 75-, 50-, 25-, and 5-percentiles ordered from highest to lowest medians are presented (see Table 1 for station ID codes).
Atmosphere 14 00569 g002
Figure 3. The mean ozone concentration (µg/m3) during the period 2015–2019 mapped from 11 stations using kriging interpolation. The highest concentrations were recorded at stations along the west coast, with the lowest concentrations in urban centres (see Figure 1 for station locations).
Atmosphere 14 00569 g003
Figure 4. Five-year mean (2015–2019) monthly ozone (O3) concentrations (µg/m3) for: (a) urban stations (BFT, CSL, RTM); (b) Atlantic stations (MHD, VAL); (c) rural stations (EMO, KKT, LNV); and (d) suburban stations (CBR, CSK, SVL). See Table 1 for station ID codes.
Atmosphere 14 00569 g004
Figure 5. Five-year (2015–2019) hourly mean ozone (O3) concentrations (µg/m3) for: (a) urban stations (BFT, CSL, RTM); (b) Atlantic stations (MHD, VAL); (c) rural stations (EMO, KKT, LNV); and (d) suburban stations (CBR, CSK, SVL). All stations followed a daily pattern of mid-morning minimum, and late afternoon maximum. See Table 1 for station ID codes.
Atmosphere 14 00569 g005
Figure 6. Interpolated matrix plots of trend slope (µg/m3 per year) for long-term monthly ozone concentrations over (a) ten years (2010–2019) and (b) 15 years (2005–2019); increases in blue and decreases in red (see Tables S6–S9 for data). See Table 1 for station ID codes.
Atmosphere 14 00569 g006
Table 1. Ambient air quality monitoring stations measuring tropospheric ozone that meet the minimum data threshold of five years (2015–2019), with location information, measurement network (Irish Environmental Protection Agency (EPA), United Kingdom Automatic Urban and Rural Network (AURN)) and first year of observations.
Station NameIDLandcoverNetworkAltitude
(m)
LatitudeLongitudeStart
BelfastBFTUrbanAURN854.5996–5.92881992
CastlebarCBRSuburbanEPA3953.8511–9.30032010
ClonskeaghCSKSuburban EPA2553.3118–6.23532009
CorkCSLUrbanEPA1051.8785–8.46512015
EmoEMORuralEPA2053.1076–7.19832004
KilkittKKTRuralEPA17054.0661–6.88311995
Lough NavarLNVRuralAURN13054.4395–7.90031987
Mace HeadMHDAtlanticEPA853.3253–9.90361987
RathminesRTMUrban EPA2553.3320–6.26722002
Seville LodgeSVLSuburbanEPA50 52.6383–7.26762012
ValentiaVALAtlanticEPA1051.9385–10.24012001
Table 2. Long-term Thiel-Sen slope over ten years (2010–2019) and 15 years (2005–2019) for annual, daytime, and night-time ozone concentrations. Positive values indicate increases and negative values indicate decreases (µg/m3 per year) in the Thiel-Sen slope, with asterisks indicating levels of significance. See Table 1 for station ID codes.
StationAnnual (24 h)Annual
(24 h)
DaytimeDaytimeNight-TimeNight-Time
Period2010–20192005–20192010–20192005–20192010–20192005–2019
MHD0.18 0.020.14 00.22 0.05
VAL0.22−0.040.21−0.110.19 0.01
KKT0.17 0.040.270.130.05−0.05
CBR0.47 * 0.42 * 0.59 *
EMO0.93 *** 0.47 ***0.91 *** 0.47 ***0.97 *** 0.48 ***
LNV−0.180.15+−0.20 0.33 ***−0.14 −0.02
CSK0.23 0.12 0.32
RTM0.42 +0.090.240.040.52 *0.11
BFT0.31 * 0.150.37 * 0.31 **0.24−0.3
Table 3. Long-term Thiel-Sen slope trends over ten years (2010–2019), and 15-years (2005–2019) of seasonal mean ozone concentration (µg/m3/year): spring (March, April, May), summer (June, July, August), autumn (September, October, November), and winter (December, January, February). Positive values indicate increases and negative values indicate decreases (µg/m3 per season) in the Theil-Sen slope, and asterisks indicate levels of significance. See Table 1 for station ID codes.
StationSpringSpringSummerSummerAutumnAutumnWinterWinter
Period2010–20192005–20192010–20192005–20192010–20192005–20192010–20192005–2019
MHD0.33−0.140.25−0.01−0.18−0.090.680.55 **
VAL0.93−0.390.23−0.17−0.66−0.021.360.40
KKT−0.06−0.090.14−0.070.13−0.160.290.34
CBR0.36 0.74 0.08 1.28
EMO0.550.111.00+0.50 +0.440.221.661.08 *
LNV−0.120.07−0.27−0.02−0.670.060.580.84+
CSK0.21 0.59 −0.51 1.21
RTM0.790.030.360.050.060.101.070.68
BFT0.380.030.370.20−0.23−0.020.680.56 +
Disclaimer/Publisher’s Note: The statements, opinions and data contained in all publications are solely those of the individual author(s) and contributor(s) and not of MDPI and/or the editor(s). MDPI and/or the editor(s) disclaim responsibility for any injury to people or property resulting from any ideas, methods, instructions or products referred to in the content.

