
Photocatalytic Reduction of VOCs with Ag/Ni-Doped Photocatalyst in Different Temperature and Humidity Environments

Department of Environmental Engineering, Engineering and Natural Science Faculty, Konya Technical University, 42250 Konya, Türkiye
*
Author to whom correspondence should be addressed.
Atmosphere 2024, 15(1), 70; https://0-doi-org.brum.beds.ac.uk/10.3390/atmos15010070
Submission received: 7 December 2023
/
Revised: 2 January 2024
/
Accepted: 4 January 2024
/
Published: 6 January 2024
(This article belongs to the Section Air Pollution Control)
Abstract
:The photocatalytic oxidation (PCO) process is one of the most preferred, inexpensive, and environmentally friendly methods for VOC removal. It has been determined that this method can remove a wide range of organic pollutants. The removal of benzene and toluene pollutants, two important VOCs commonly encountered in flue gases, has been studied in the scope of this study using the photocatalytic oxidation method under UVA irradiation. For this purpose, the photocatalytic activity of the photocatalyst increased by the metal/metal doping process. Two different metals, a noble metal (Ag) and a transition metal (Ni), were used together for the doping of TiO2 nanoparticles, and the photocatalysts attached to a glass surface were prepared. Four different doping percentages were used for photocatalysts: 0.5%, 1%, 2.5%, and 5%. Several PCO experiments were conducted under different temperatures (120, 150, and 180 °C) and humidity conditions (25 and 50%). Photocatalytic oxidation experiments were carried out with artificially produced benzene and toluene gases, and the success of the system was evaluated with respect to removal efficiency calculations. The UVA light source was used for the photocatalytic experiments. The results of the study indicated that the removal efficiencies of toluene were found to be higher than those of benzene, and the most suitable conditions were determined to be 50% humidity and a 120 °C environment with the use of a 1% doped photocatalyst.

1. Introduction
Air pollution is one of the main factors that determines the length of human health and life. Emissions into the atmosphere come from point sources such as production and from fields such as gasoline. It is difficult to estimate on a country-wide basis from total usage and transportation from the city center. Fuel use (gasoline) is the largest contributor to these emissions. Apart from this, exhaust and cigarette smoke are among the other sources [1]. Furthermore, flue gases are one of the other most important sources of air pollutants. The pollutants originating from the chimneys vary according to the fuel type. In addition, some substances used during industrial production can affect the concentration and type of gas-derived pollutants originating from chimneys. These pollutants can be inorganic or organic. Inorganic pollutants are released into the atmosphere in much higher concentrations than organic pollutants [2]. However, even low concentrations of organic pollutants can cause serious hazards. Organic air pollutants are also known as volatile organic compounds (VOCs). All compounds containing carbon (except for carbon monoxide, carbon dioxide, carbonic acid, metallic carbides or carbonates, and ammonium carbonate) that are volatile under normal conditions are defined as volatile organic compounds [3]. Volatile organic compounds containing hydrocarbons consist of three main classes: low-molecular-weight hydrocarbons (methane, ethane, butane, propane, etc.), chlorinated hydrocarbons (dioxin, furan, etc.), and aromatic hydrocarbons (naphthalene, benzene, toluene, ethyl benzene, etc.) [4]. Organics in this group are generally released as a result of combustion processes. In addition, it includes other volatile organics that do not contain hydrocarbons, such as carbonyl compounds, organohalide compounds, chlorofluorocarbons, organosulfur compounds, and organonitrogen compounds [5].
When compared to other types of air pollution, VOCs have the potential to cause more severe health concerns. Although there are traditional methods (such as adsorption, absorption, incineration, and so on) that can be used for the removal of volatile organic compounds released from a variety of sources, such as flue gas, cleaning products, and paints, there is currently no method that is considered to be the most effective. The elimination of these contaminants calls for innovative approaches that are gentler on the natural world, less expensive, and more recent. The photocatalytic oxidation technique is one of the most popular methods for the elimination of volatile organic compounds since it is economical and ecologically beneficial. There have been many studies on the photocatalytic oxidation process and how to remove different VOCs. These studies include finding ways to make the process more efficient, finding the best conditions for photocatalytic oxidation, and making systems that can remove VOCs in larger systems that can work in situ while also finding ways to make the process more efficient and finding the best conditions for photocatalytic oxidation [6]. New research is required in many areas, including the construction of systems that are capable of effectively controlling a greater number of VOCs.
The chemical parameters of the photocatalyst and its light absorption capability guide the selection of the semiconductor structures employed in the photocatalytic oxidation process. TiO2, ZnO, WO3, ZnS, and CdS are all commonly used semiconductors that function as photocatalysts [7]. TiO2 is the most popular photocatalyst currently in use. TiO2 is a semiconductor that has the advantages of being inexpensive, simple to produce, and highly stable. Although TiO2 has many potential benefits, it is not always an effective photocatalyst. Limitations in applications under visible light and natural sunshine, for instance, are caused by the large bandwidth and rapid recombination speed of the charge carriers. In addition, photocatalytic oxidation efficiency is diminished because photogenerated electrons and holes recombine quickly. Therefore, it is important to create photocatalysts that can be activated by visible light and work by isolating charge carriers and slowing the pace at which they recombine [7]. The photocatalytic activity of photocatalysts can be extended to wider wavelengths, and the tendency to carry a photogenic charge for recombination can be reduced through the application of either morphological design (improvements related to the surface area of the catalyst) or electronic modifications [8]. The primary objective of morphological design is to increase the surface area of the semiconductor to maximize contact with the gas molecules in the environment and the light source. Nanoparticles, nanotubes and nanofibers, nanosheets, and porous/bonded surfaces are all examples of photocatalyst materials. Titanium oxide at the nanoscale level is one hundred times smaller than typical TiO2 pigments used in industry [9]. Previous research has shown that photocatalysts with both an appropriate surface morphology and electronic modifications are more effective. To achieve this result, the photocatalyst is doped [8]. Metal doping, non-metal doping, combined metal and non-metal doping, and composite doping are the four broad categories to consider when analyzing the doping process [7].
Hydroxyl radicals produced during water cleavage serve a pivotal role in the heterogeneous photocatalytic process. This setup involves exposing semi-conductive material to light while flowing airflow made of VOCs with consistent humidity through the area. The semi-conductive substance is illuminated, triggering the motion of electrons within the material. In Figure 1, a diagrammatic illustration of the photocatalytic oxidation process is given. An electron (e−) is transferred from the valence to the conduction band, while a hole (h+) is left behind when a photon with an energy of hv exceeds the energy of the band gap. The created charge carriers are instantly recombined in electrically conducting materials, such as metals. Semiconductors have partially photo-excited electron-hole pairs that move to the particle’s surface and join the chemical reaction with the donor or acceptor molecules that have stuck to it. Molecules in the donor state can be oxidized by holes, whereas those in the acceptor state can be reduced by electrons in the conduction band. The high oxidation power of their holes (h+) is a defining feature of semiconducting metal oxides. By losing just one electron to water, they can generate a highly reactive hydroxyl radical (*OH). For oxidizing most organic pollutants, there is a choice between two extremely potent oxidants: holes or hydroxyl radicals. Oxygen in the air forms the super-oxide ion *O2, which acts as an electron acceptor. In the same way as super-oxide ions can oxidize organic substances, they are also highly reactive particles [10]. Photocatalysts are catalysts that can be excited by exposure to light. Because their UV energy is more than or equivalent to the 3.2 eV bandgap, UVC (100–280 nm), UVB (280–320 nm), and UVA (320–400 nm) light sources are currently in widespread usage. However, only 3–5% of the sun’s radiation is in the UV band, which has little effect on TiO2. Therefore, much effort has been put into altering TiO2 and testing different semiconductors to increase the overlap of the photocatalyst’s absorption spectrum with the solar spectrum [11].
In this study, the efficacy of the photocatalytic oxidation method for removing benzene and toluene under a UVA light source was explored, along with an examination of potential by-products generated. To enhance the photocatalytic properties, TiO2 nanoparticles were doped with two different metals: a noble metal (Ag) and a transition metal (Ni). A specialized reactor was designed to ensure a system with high removal efficiency, and experiments were conducted under varying temperature and humidity conditions. The operational temperatures of the reactor were selected based on the average temperatures observed during the emission of flue gases. The experiments encompassed a range of catalyst doping percentages, humidity levels, and temperature parameters to assess their impact on the removal process. The study methodology and key findings are elaborated upon in the subsequent sections.
2. Materials and Methods
2.1. Preparation of Photocatalyst
The synthesis of Ag-Ni-doped TiO2 nanoparticles deposited as thin films on glass plates was performed in this research. To achieve this goal, the sol–gel method was used, and the coating was accomplished with a custom-built laboratory dip coater. Accordingly, photocatalysts with varying amounts of Ag-Ni doping were made for this purpose. The levels of doping were listed as 0.5%, 1%, 2.5%, and 5%. The doped TiO2 nanomaterials were produced with respect to the preparation of two different sols, namely Sol A and Sol B. To prepare Sol A, chelation was carried out by dissolving titanium butoxide [Ti(OC4H9)4] (Merck/Sigma Aldrich Darmstadt, Germany, 97% reagent grade) and acetyl acetone (Merck/Sigma Aldrich Darmstadt, Germany, 99% reagent grade) in 1-butanol (Merck/Sigma Aldrich Darmstadt, Germany, for analysis EMSURE® ACS, ISO Reag. Ph. Eur) and then mixing in a magnetic stirrer for 1 h. Sol B was prepared simultaneously with the preparation of Sol A, containing certain percentages of Ag and Ni. Meanwhile, AgNO3 (Merck/Sigma Aldrich Darmstadt, Germany, for analysis EMSURE® ACS, ISO, Reag. Ph. Eur) and Ni2(NO3) (Merck/Sigma Aldrich Darmstadt, Germany, 99.999% trace metals basis) were dissolved separately in ethyl alcohol (Merck/Sigma Aldrich Darmstadt, Germany absolute for analysis EMSURE® ACS, ISO, Reag. Ph. Eur). Sol B was then added to Sol A in two stages and mixed for a certain period of time in each stage. The resulting sol changed color depending on the percentage of Ti, Ag, and Ni. For the coating process, the glass plates were immersed in sol, dried, and then subjected to heat treatment at 600 °C to prepare the final product.
2.2. Characterization of Ag/Ni-Doped Photocatalyst
To better understand the nature of the produced photocatalysts, we ran Scanning Electron Microscopy with Energy Dispersive X-Ray (SEM-EDX) analysis and X-Ray Diffraction (XRD) investigations. We used a Zeiss EVO LS10 SEM-EDX analyzer to obtain the results we needed. With a resolution of 6 nm in high vacuum mode and a voltage range of 1–30 kV, the EVO creates high-quality images that are on par with those obtained with standard SEM instruments, but it really shines when analyzing non-conductive, hydrated, large, or otherwise non-standard samples. This investigation examined materials with a carbon coating as thin as 1–3 m. On top of that, EDX mapping was employed to obtain a better look into the surface’s material distribution. A Bruker D8 Advance X-Ray Diffractometer was used for the research. The thin films gathered for this investigation were analyzed using the “Parallel focused beam geometry” technique with a constant grating angle (GID-minimum 0.5°). The phases and characteristics of the materials were identified through qualitative analysis of the resulting X-ray images.
Atomic force microscope (AFM) images were used to determine the characteristics of the coating created during photocatalyst production for this study. The microscope’s pictures reveal details about the surface’s composition and its consistency. Sol’s density, dipping speed, surface tension, and gravity were utilized in conjunction with the calculation for surface film thickness provided in Equation (1) [12].
Here, h: thin film thickness, c: fixed (0.944), η: viscosity, U: immersion speed, γ: surface tension, : density, g: gravitational acceleration
2.3. Experimental Setup
After the reactor is heated and humidified, a predetermined amount of gas is introduced and then exits the reactor in a continuous flow to conduct the experiment. The volume and flow rate of the reactor were used to calculate the gas’s residence period. Figure 2 is a schematic representation of the experimental setup developed for this work. It was agreed upon that the best location for the reactor’s light source would be smack dab in the center of the cylinder’s diameter. Within the reactor’s interior, four photocatalyst plates were arranged vertically so that they faced each other at an angle of 90° and were the same length as the light source. Reactor diameters near 10 cm are typically selected in systems that employ reactors with circular geometries. Furthermore, it has been noted that typical reactor flow rates are under 3 L per minute [13,14,15,16]. Based on these data, the unique qualities of the privately developed reactor were identified. The reactor is constructed from stainless steel, and within it is a custom-made component designed to house the photocatalysts. The photocatalysts and the light source are separated by a 7 mm space inside the reactor. The reactor measures 45 cm in length and has an inner diameter of 14.5. The reactor’s input and exit ports are sealed with pipes and caps. It involves installing temperature sensors and a backup heater within the reactor to avoid heat loss, as well as placing wash bottles at the ends of the pipes leading to the reactor’s inlets and exits so that samples may be taken. The photocatalytic oxidation elimination system takes in a mixture of air and gaseous benzene and toluene. An air compressor supplied the system with a flow rate of 1 L/min. A gas production apparatus was designed to convert the liquid ACS reagent (99.99% purity from Merck) into the gaseous forms of benzene and toluene. Gas production was ensured in the wash bottle by adding air filtered through activated carbon at a rate of 35 mL/min using an air pump into a mixture of liquid benzene and toluene (2.5 mL). The produced gas is piped straight into the distribution network. An external gas flow controller was used to regulate the system’s gas flow. Through gas chromatographic analysis performed by the GC-FID machine, the gas input concentration was set to 14 mg/m3 for benzene and 0.4 mg/m3 for toluene.
The gas concentration was chosen with consideration for the by-product formation characteristic shared by benzene and toluene. Compared to benzene, toluene has been shown in earlier research to produce more by-products. Because of this, the toluene concentration value was adjusted to be lower. Activated carbon sorbent tubes were used to collect samples for analysis. In addition, the gas is heated before it enters the reactor by means of a heating device situated in front of the reactor’s entrance. To maintain the system’s humidity, a peristaltic pump is used that delivers pure water at a constant flow rate. The experimental setup was upgraded with a digital control screen, allowing for autonomous regulation of the reactor’s internal temperature, pressure, and pure water flow rate for humidity production. In the reactor, a constant and piston-like current flows. The 10-minute time period is required to complete one cycle within the system for each trial. Moreover, for 45 min before each experiment, the reactor was run in complete darkness after the introduction of the polluting gases to restore photocatalytic equilibrium for each catalyst. After waiting 45 min in the dark, the UVA light was turned on, and after 10 min, output samples were taken. After each experiment, we ran the reactor for 30 min on pure air to wash the catalysts. During this time, the UVA light was left on. This technique for cleaning the surface has been suggested as a viable option in previous research. Methods such as exposing the catalyst to ozone in a humid environment, heating it to 500 °C, exposing it to H2O2 vapor, and ventilation with fresh air are also recommended [17]. Using an Osram UVA 15W/78 G5 light source (OSRAM GmbH, München, 80807, Deutschland), we performed photocatalytic studies at various temperatures (120 °C, 150 °C, 180 °C), doping concentrations (0.5%, 1%, 2.5%, and 5%), and humidity levels (25% and 50%). Due to the importance of studying the impact of high temperatures on the photocatalytic oxidation process, this investigation favored high-temperature values. Stacks were the inspiration for the experimental rig and reactor. The study’s goal was to learn how well the reactor would function in a stack. New investigations with practical on-site applications are made possible by assessing the efficiency of this pilot-scale reactor. Due to the failure of visible light sources at elevated temperatures, the studies could only be carried out under UV light sources. The percentage efficiency of benzene and toluene photocatalytic degradation was determined by adjusting the input and output concentrations [18].
2.4. Analysis Methods
The Shimadzu GC-FID 2010 Plus instrument was used for the sample analysis. The RTX-624 column was employed in the apparatus throughout the analysis. The device’s ability to predict and replicate results allows for extremely exact measurements to be taken. Extractions were made using a CS2 solvent to obtain the samples. The samples are then automatically injected into the system using the AOC-20i unit following extraction. The impurities were calibrated using a volatile organic compound mixture (5242-VCX) from SPEX CertiPrep. There was 1 milliliter of a standard combination in methanol with a concentration of 2000 micrograms per milliliter (2000 parts per million). The experimental RTX-624 column had a maximum temperature of 240 °C, a length of 60 m, an inner diameter of 0.025 mm, and a wall thickness of 1.40 m.
3. Results and Discussion
3.1. Photocatalyst Characterization
3.1.1. SEM-EDX Analysis Results
Figure 3 shows the results of an SEM-EDX analysis of the photocatalyst materials that were made. The samples had different amounts of Ag and Ni. This mapping demonstrates how an increase in doping percentage results in a clustering of atoms at the surface. Due to the amorphous surface structure, maximum surface visualization in SEM imaging was achieved with 1–2 micrometer convergence. The findings of the SEM-EDX study show that the change in the doping percentage influences the material distribution on the surface. In particular, element percentage changes detected on material surfaces vary as they are viewed pointwise. The increase in the doping percentage positively affected the amount of Ag and Ni-doped on the surface. The nanoparticle distribution on the surface was observed by EDX mapping. This mapping shows that the increase in doping percentage causes agglomeration on the surface [18].
3.1.2. XRD Analysis Results
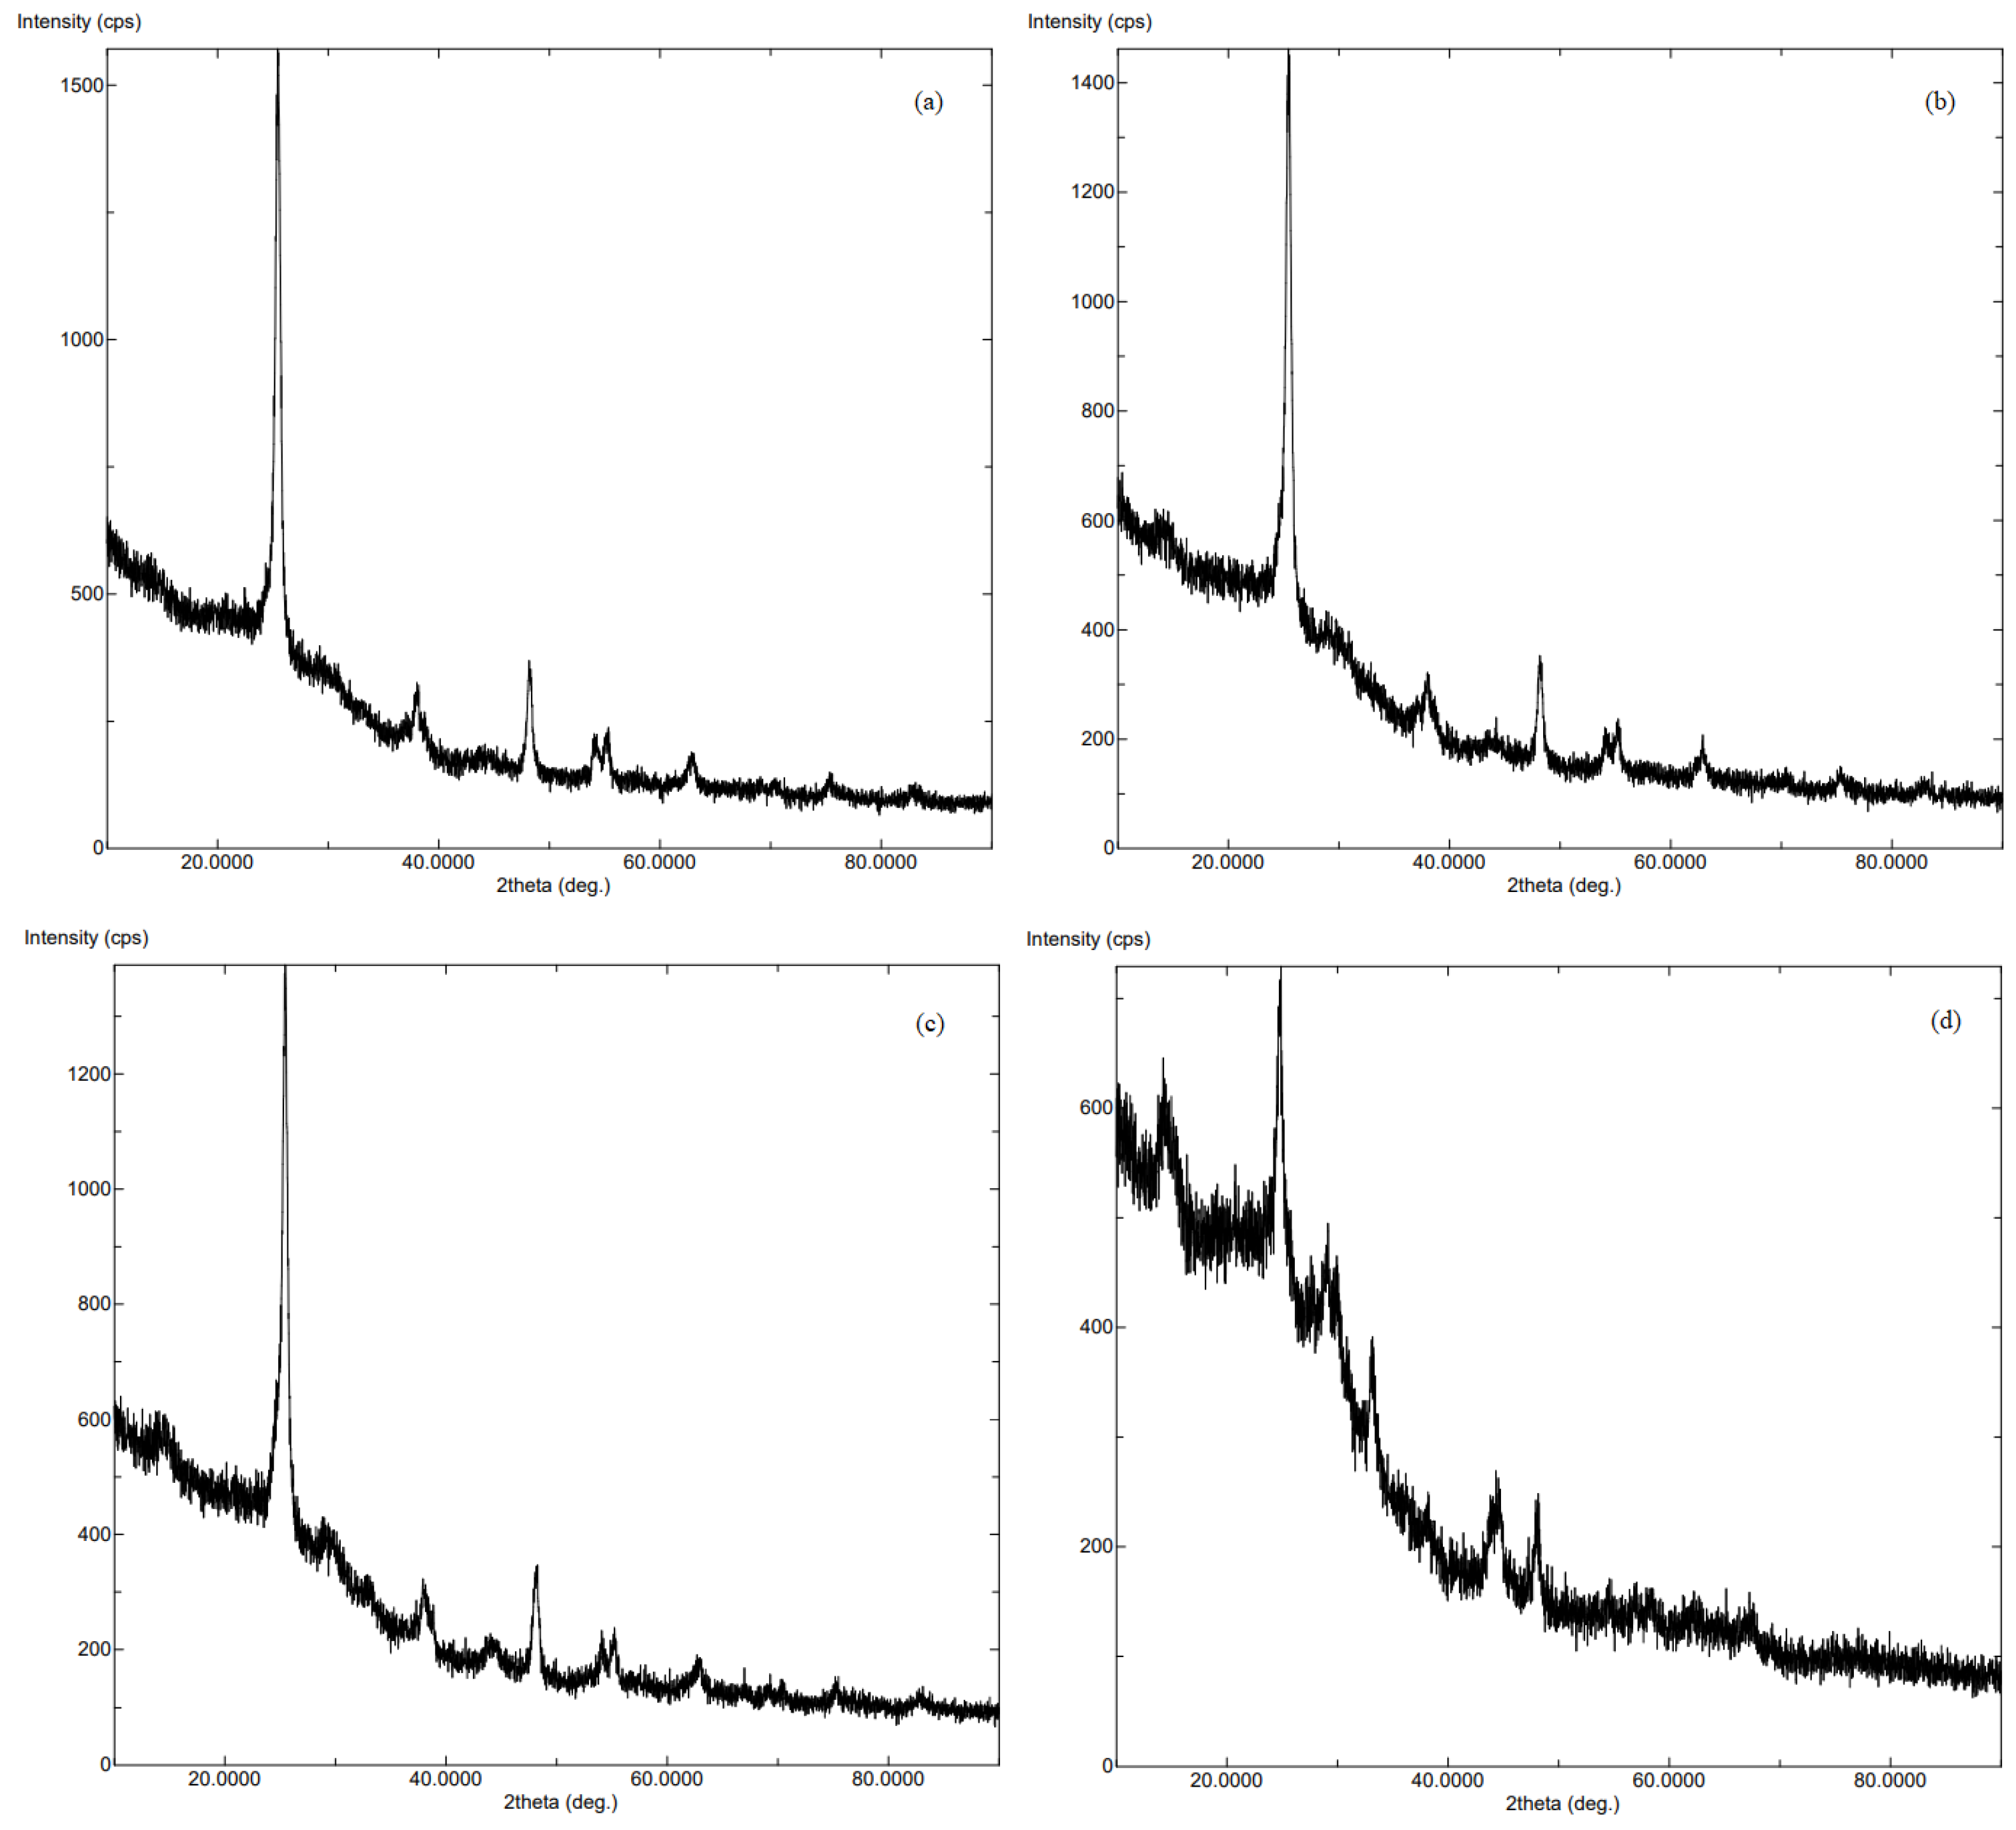
Graphs of X-ray powder diffraction patterns are displayed in Figure 4. X-ray diffraction examination reveals that the surface is composed of cubic Ag and Ni particles and anatase TiO2. According to the XRD pattern listings, the ratio of TiO2 on the material’s surface reduces as the doping percentage rises. The results of the XRD analysis suggest that the produced nanomaterials consist of anatase tetragonal TiO2 (JCPDS card no. 00-021-1272), cubic Ag (JCPDS card no. 01-087-0719), and cubic Ni (JCPDS card no. 01-071-4655) nanoparticles. Approximate interplanar spacing (d) for TiO2, Ag, and Ni taken by the XRD graphs are 3.50 A°, 2.4 A°, and 2.024 A°, respectively. Then, the approximate particle sizes were calculated by the Scherer equation, and the resulting particle sizes were obtained as 24.31 nm for TiO2, 36.61 nm for Ag, and 44.88 nm for Ni.
Moreover, when the surface adhesion percentages of the chemicals were analyzed, it was found that photocatalyst 1 contained approximately 80% TiO2, 23% Ag, and 14% Ni. For photocatalyst 2, the optimum ratio was found to be 78% TiO2, 22% Ag, and 11%Ni; for photocatalyst 3, it was 68% TiO2, 7% Ag, and 22% Ni; and for photocatalyst 4, it was 56% TiO2, 3% Ag, and 24% Ni [18]. When looking at the surface distribution, it can be seen that the Ni ratio suppresses the Ag ratio while the TiO2 ratio decreases on the surface of photocatalyst 4. It is reasonable to expect that Ag’s effect on photocatalyst 4 will diminish over time. It is reasonable to expect that Ag’s effect on photocatalyst 4 will diminish over time. These findings demonstrated that increasing the doping percentage in photocatalysts has the same effect as increasing the amount of material on the surface, lowering the doping efficiency.
3.1.3. Coating Properties
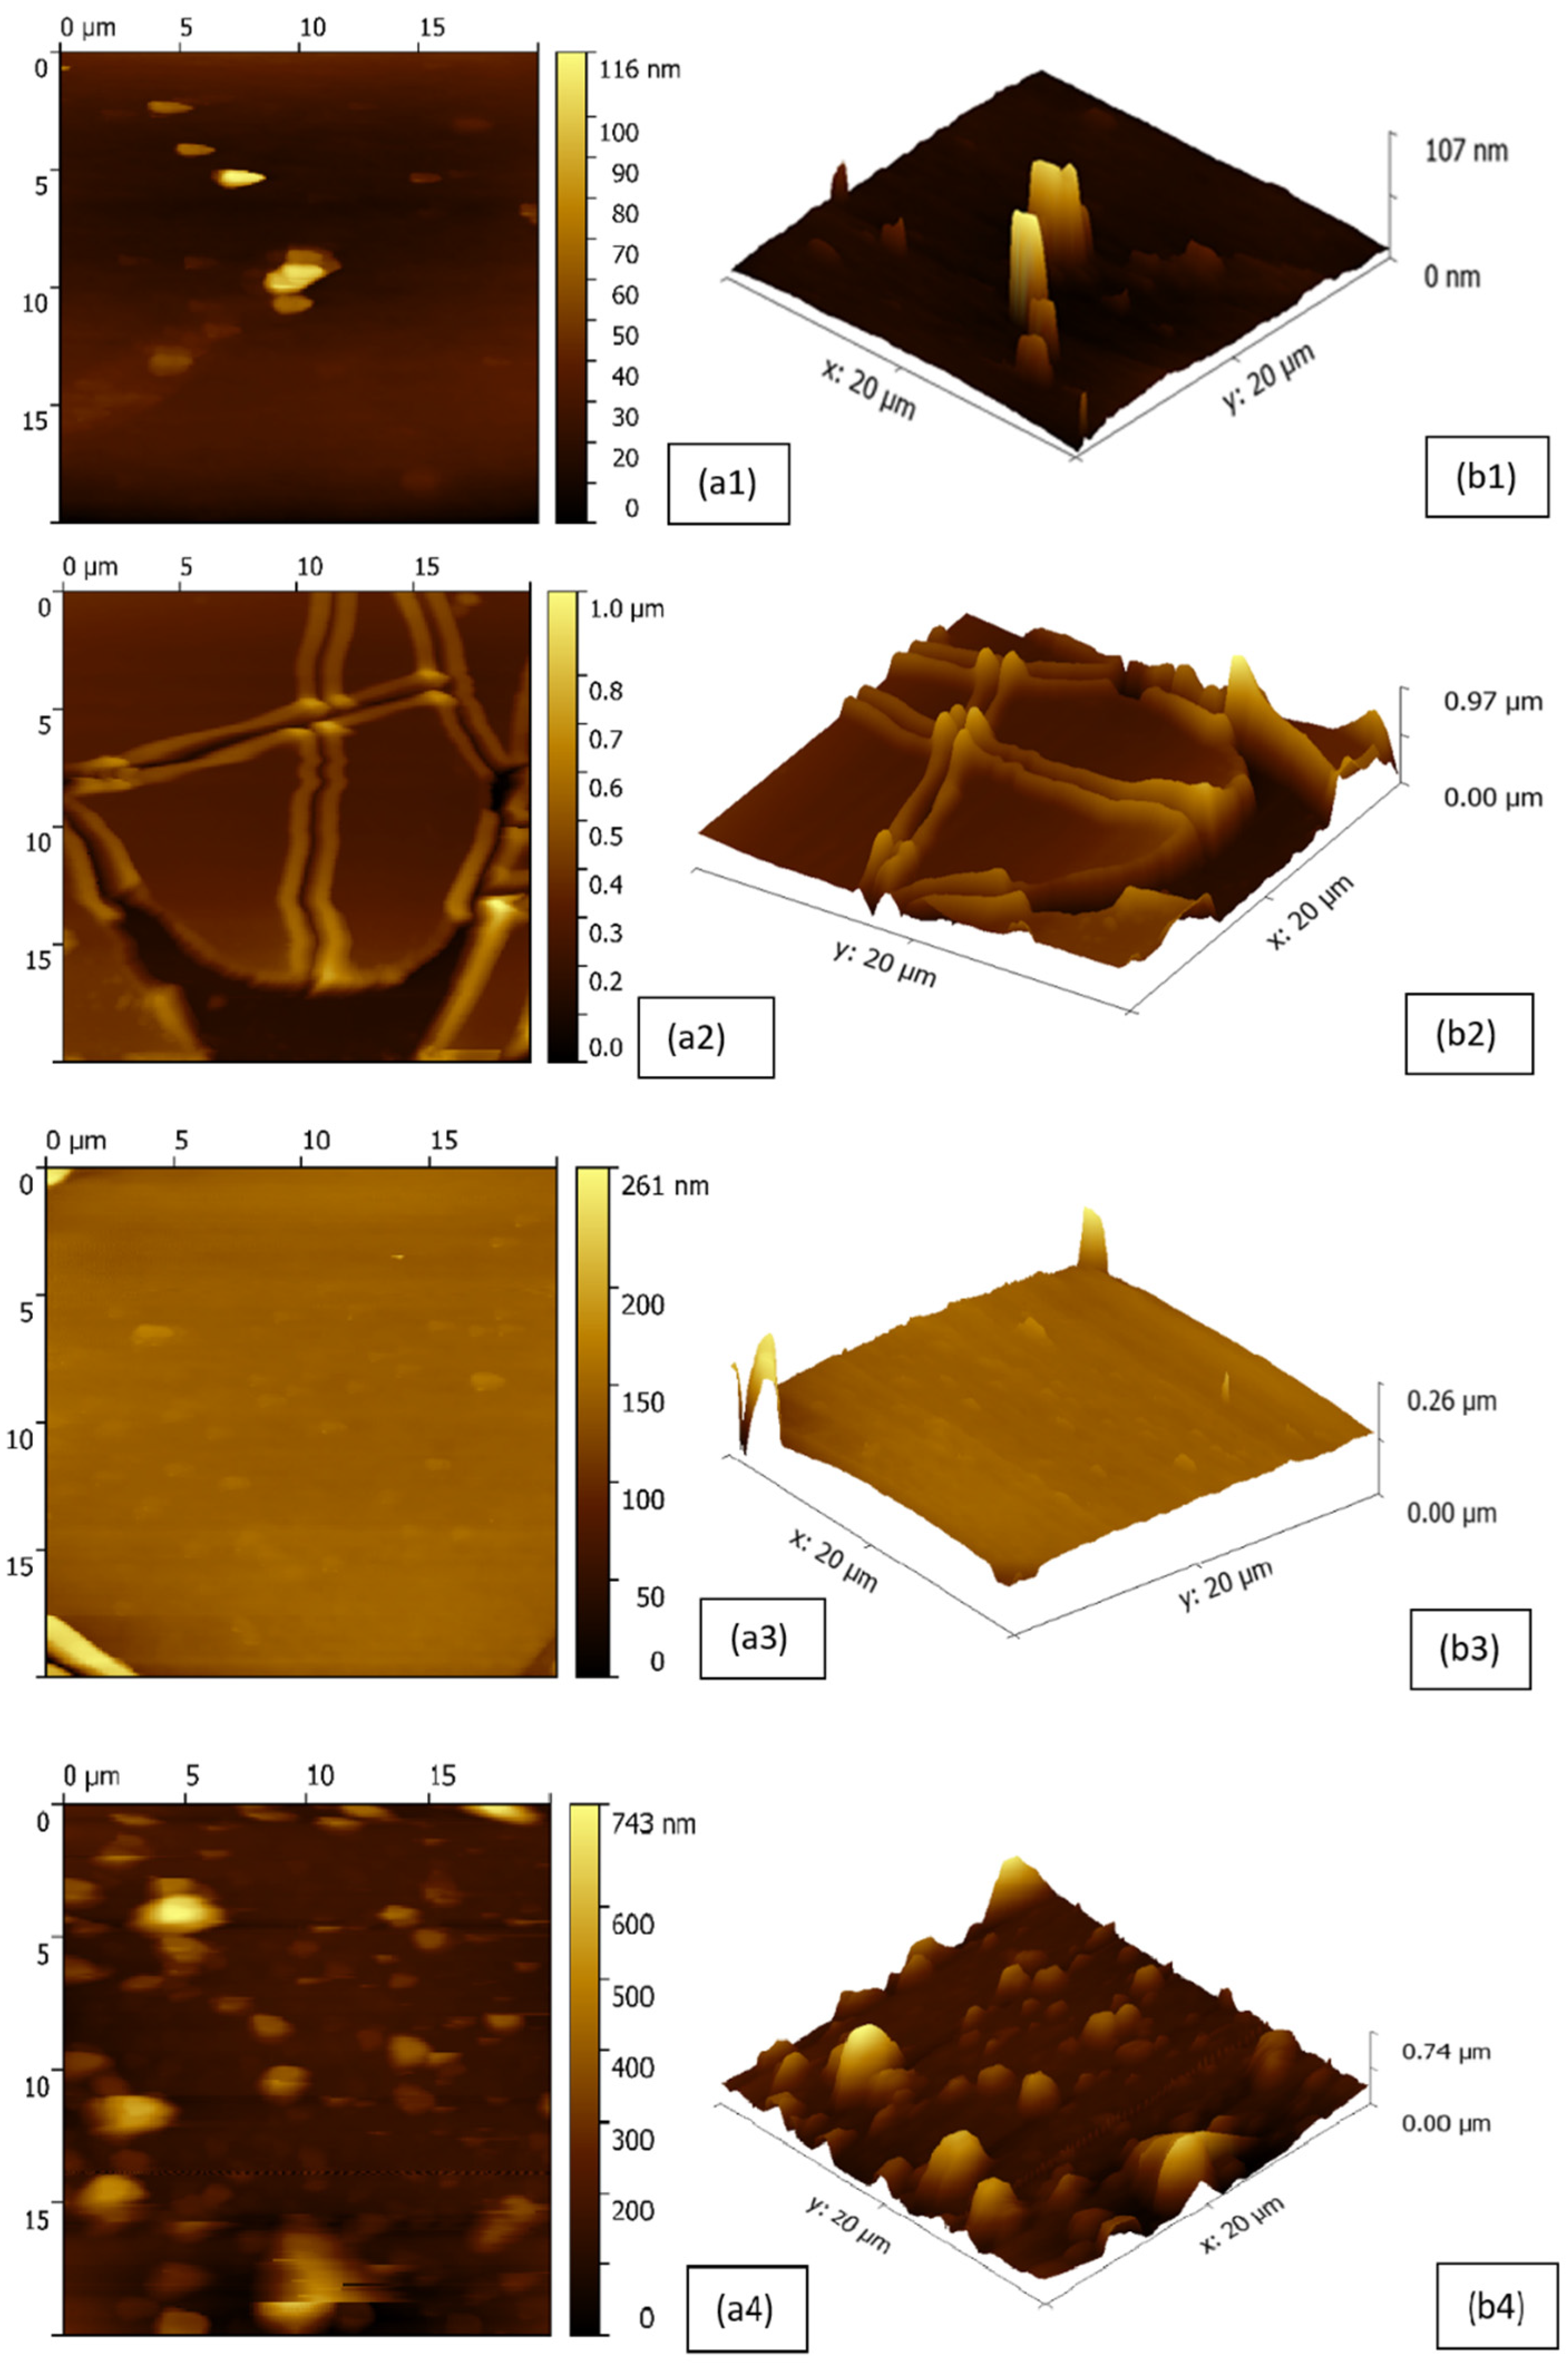
Figure 5 displays 2D and 3D AFM pictures revealing the coating properties of the manufactured materials. The 0.5% doped surface point shots were found to have the lowest peak point at 116 nm. The 1% doped material was found to have channels on its surface, and its coating had the highest peak point at 1000 nm. This was calculated to be 261 and 743 nm for coatings with a 2.5 and 5% doping percentage, respectively. It is clear from these findings that the coatings are not spread out evenly throughout the surface and that the vibrations experienced during the coating process have a localized effect on the coating. Table 1 displays the calculated values for the thickness of thin films using Equation 1. The coating thickness of the surface is assumed to be close to these values, which are based on theoretical computation.
In the roughness measurements made using AFM, the average roughness value was 4.3722 for 0.5% doped material, 5.7192 for 1% doped material, 32,194 for 2.5% doped material, and 133,653 for 5% doped material. These values showed that the increase in doping percentage increased the surface roughness.
3.2. Photocatalytic Reduction of VOCs
For the elimination of aromatic compounds, halocarbons, and alcohols, photocatalytic oxidation has been proven to be an efficient method [19]. Pollutants in the air can be removed through a process called heterogeneous photocatalytic oxidation, which makes use of hydroxyl radicals and super-oxide O2 ions, typically through the cleavage of water molecules. The semiconductor material is exposed to light and specific humidity, and the resulting photocatalysis removes contaminants from the air stream. The light is absorbed by the semiconductor, which then causes the electrons to flow. The charge difference between the valence band and the conduction band is brought about by the motion of the electrons. The semiconductor material develops photocatalytic capabilities as a result of charge separation. It interacts with the airborne electron acceptor and the adsorbed donor molecules during charge separation. Donor molecules are oxidized by the energy gap between the valence and conduction bands, while acceptor molecules are reduced by the conduction band’s electrons. O2 in the atmosphere functions as the water molecules’ donor by separating their charges on the semiconductor material, making it the electron acceptor. The molecules that are released as a result of these reactions (OH* and O2*−) react with adsorbed pollutants to turn VOCs into CO2 and H2O, SO2 into H2SO4(ads) or SO3(g), and NO into N2O3(g), N2O5(g) or HNO3(ads), it causes CO to break down into CO2 [11,20,21]. Listed in Table 2 are the chemical reactions that take place during the photocatalytic oxidation of TiO2 for the destruction of VOCs. Hole (h+) and electron (e−) are symbols for the holes and electrons, respectively, in the processes listed in Table 2. Many other types of reactive oxygen species are generated during this process, including hydroxyl radicals (OH*), super-oxide radicals (O2), and hydrogen peroxide (H2O2) [22]. Of several reactive oxygen species that can be generated through photocatalytic oxidation processes, OH* radicals have the highest chemical reactivity and lowest selectivity. Additionally, hydrogen peroxide is an abundant intermediate product of many environmental, biological, and photocatalytic activities. Among the many reactive oxygen species, H2O2 may play a role as a redox-active molecule in several TiO2-catalyzed photocatalytic reactions.
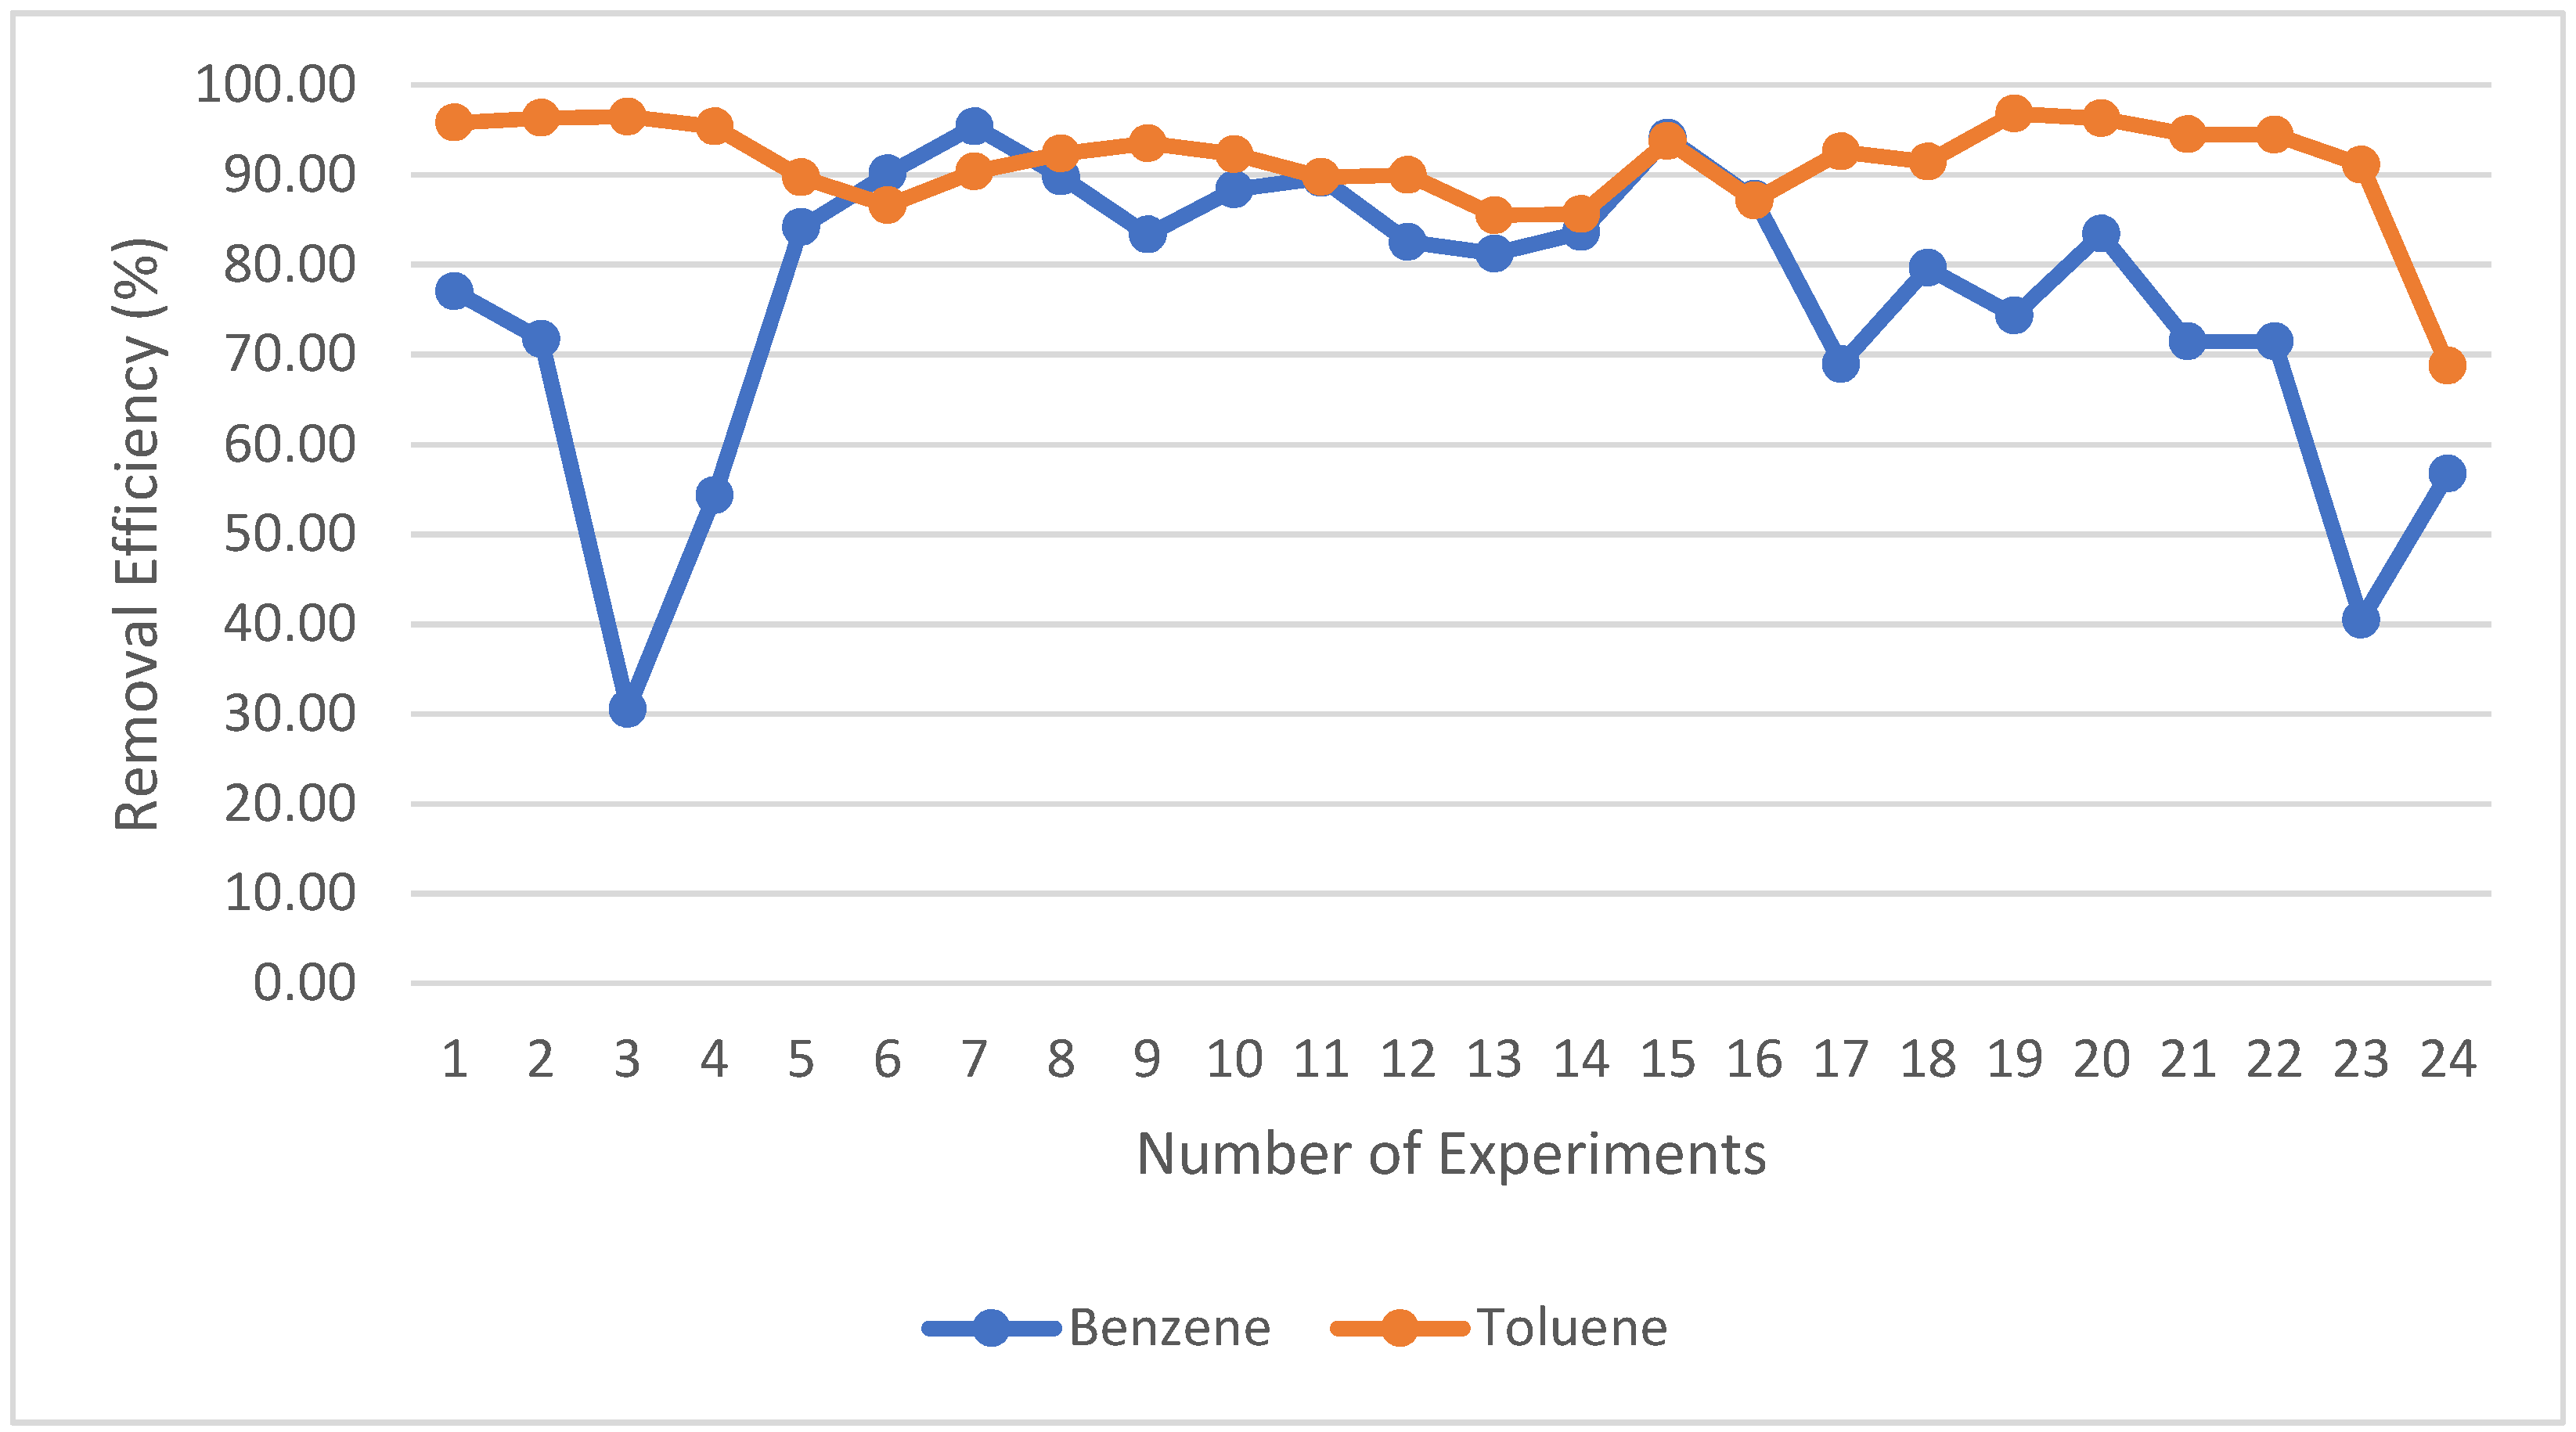
The findings of the experiments that were carried out as part of this research revealed that the average removal efficiency for benzene was found to be 76.24%, while the average removal efficiency for toluene was found to be 91.10% when exposed to the UVA light source. In Figure 6, a comparison is made between the percentage removal efficiencies of benzene and toluene regarding the number of experiments conducted. It can be deduced from this figure that the removal effectiveness of benzene has decreased in some experiments, which is the opposite of what happened with the toluene example. The entrance concentrations of contaminants may be the primary cause of these decreases. A higher entry concentration for benzene was given to the system because toluene is more likely to create by-products during photocatalytic oxidation and contaminate the surface of the photocatalyst [23,24]. Because of this, it was preferable to have low concentrations of toluene at the entry. Using the information that was gathered as a consequence of this research, an analysis was made to determine how the modifications that were made to the experimental conditions affected the removal efficiency.
3.2.1. Effect of Temperature
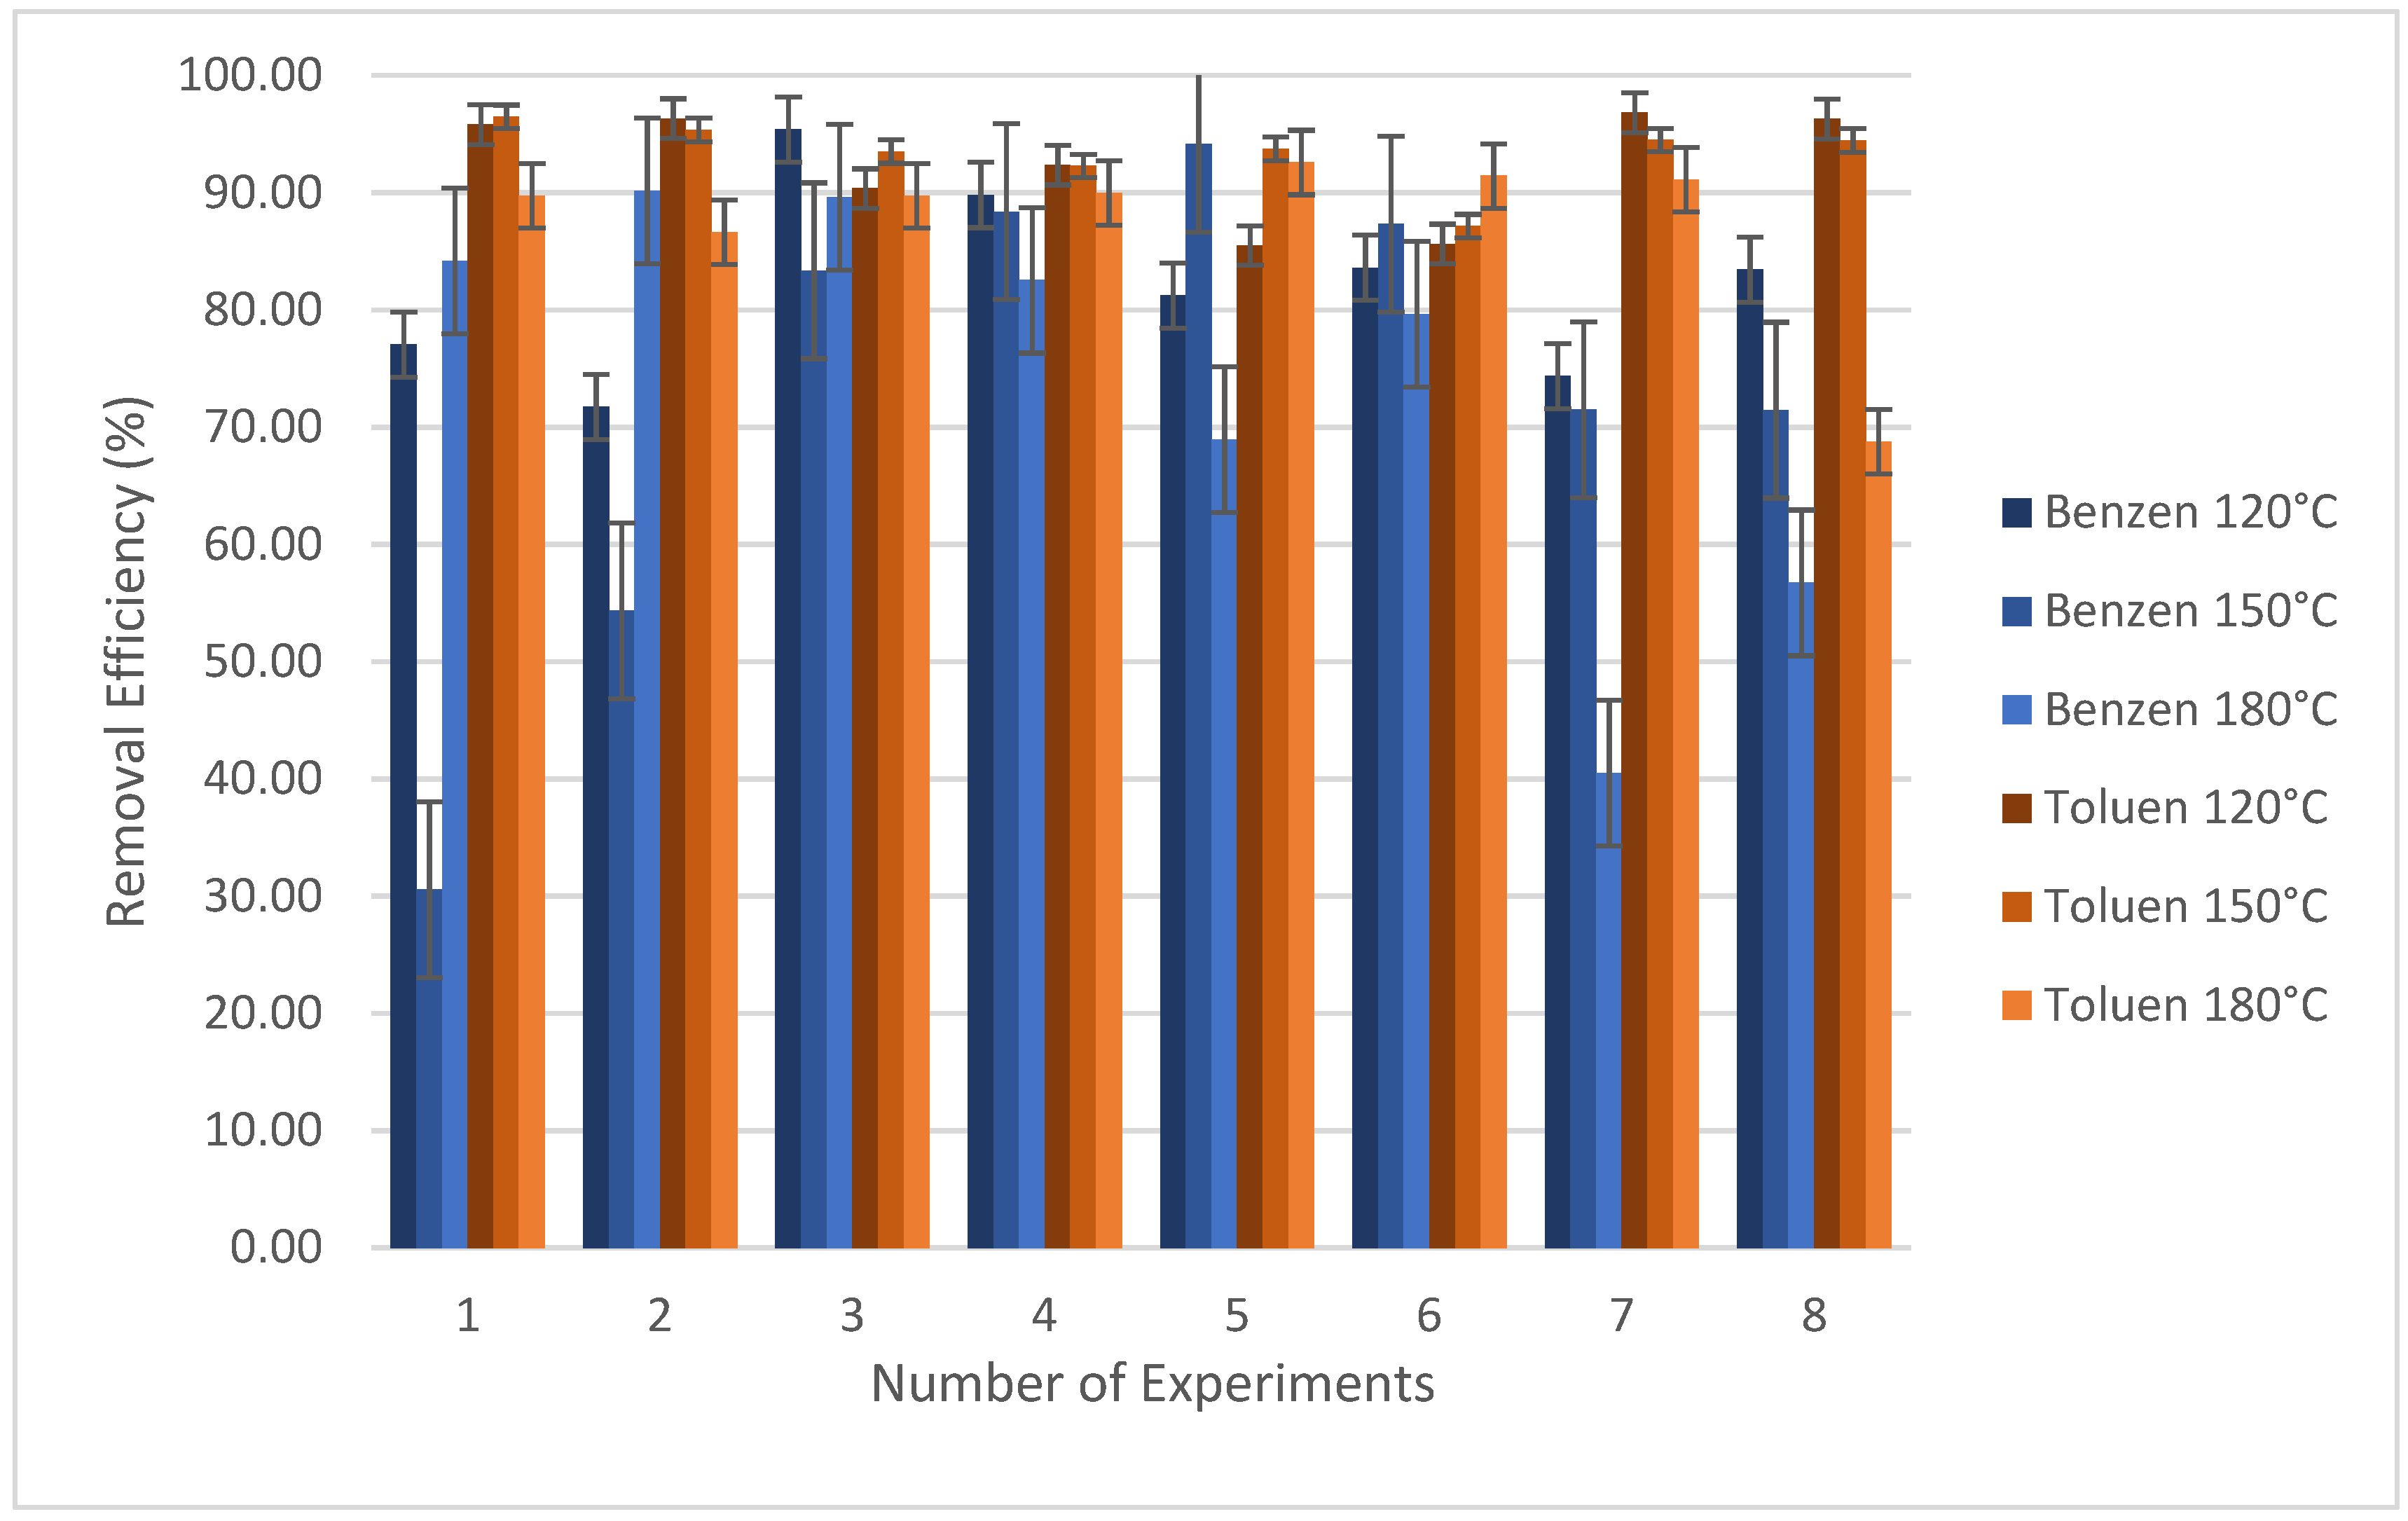
Figure 7 shows how the removal efficiencies of benzene and toluene changed as the studies were conducted at varying temperatures while employing a UVA light source. Experiments showed that a temperature of 120 °C resulted in the highest average yield (82.07%) for the elimination of benzene. The lowest average removal efficiency was found at 150 °C, where it was just 72.62%. Toluene removal efficiency was measured, and it was found to be at its maximum (average: 93.44%) at 150 °C and lowest (average: 87.49%) at 180 °C. These findings indicated that the removal efficiency of benzene and toluene via photocatalytic oxidation did not vary significantly with temperature. It has been calculated that, across all operational temperature conditions, the designed system achieves an average performance of greater than 70% with respect to both pollutants.
Photocatalytic oxidation effectiveness has been shown to decrease with rising temperature for numerous pollutants, according to studies examining the impact of temperature on photocatalytic oxidation efficiency (acetaldehyde, toluene, butadiene, trichloroethylene, perchloroethylene). For molecules containing ethylene and formaldehyde, however, the opposite was found to be true. Research shows that raising the temperature decreases adsorption and reaction generation on the surface, which in turn decreases the removal effectiveness. More importantly, the optimal temperature appears to lie within a small window [23]. According to Zorn’s research, the reaction rate constant of steam acetone increased from 30 to 77 °C, but further increases in temperature, from 77 to 113 °C, had no discernible effect [25]. Wu found that while utilizing a TiO2 photocatalyst for the photocatalytic oxidation of benzene pollutants, oxidation rates increased below the 160–180 °C band and reduced when this band was exceeded [26]. When the studies included in this paper were analyzed, it became clear that the findings were substantive. Even at 180 °C, the benzene pollutant was hardly affected, and effective results were attained. Higher temperatures resulted in less effective toluene pollution removal. These findings also show that there is a negative relationship between temperature and toluene pollution. Toluene yield is decreased when TiO2 nanotubes are utilized at 250 °C and 40% humidity, as reported by [27].
3.2.2. Effect of Photocatalysts Doping Percentage
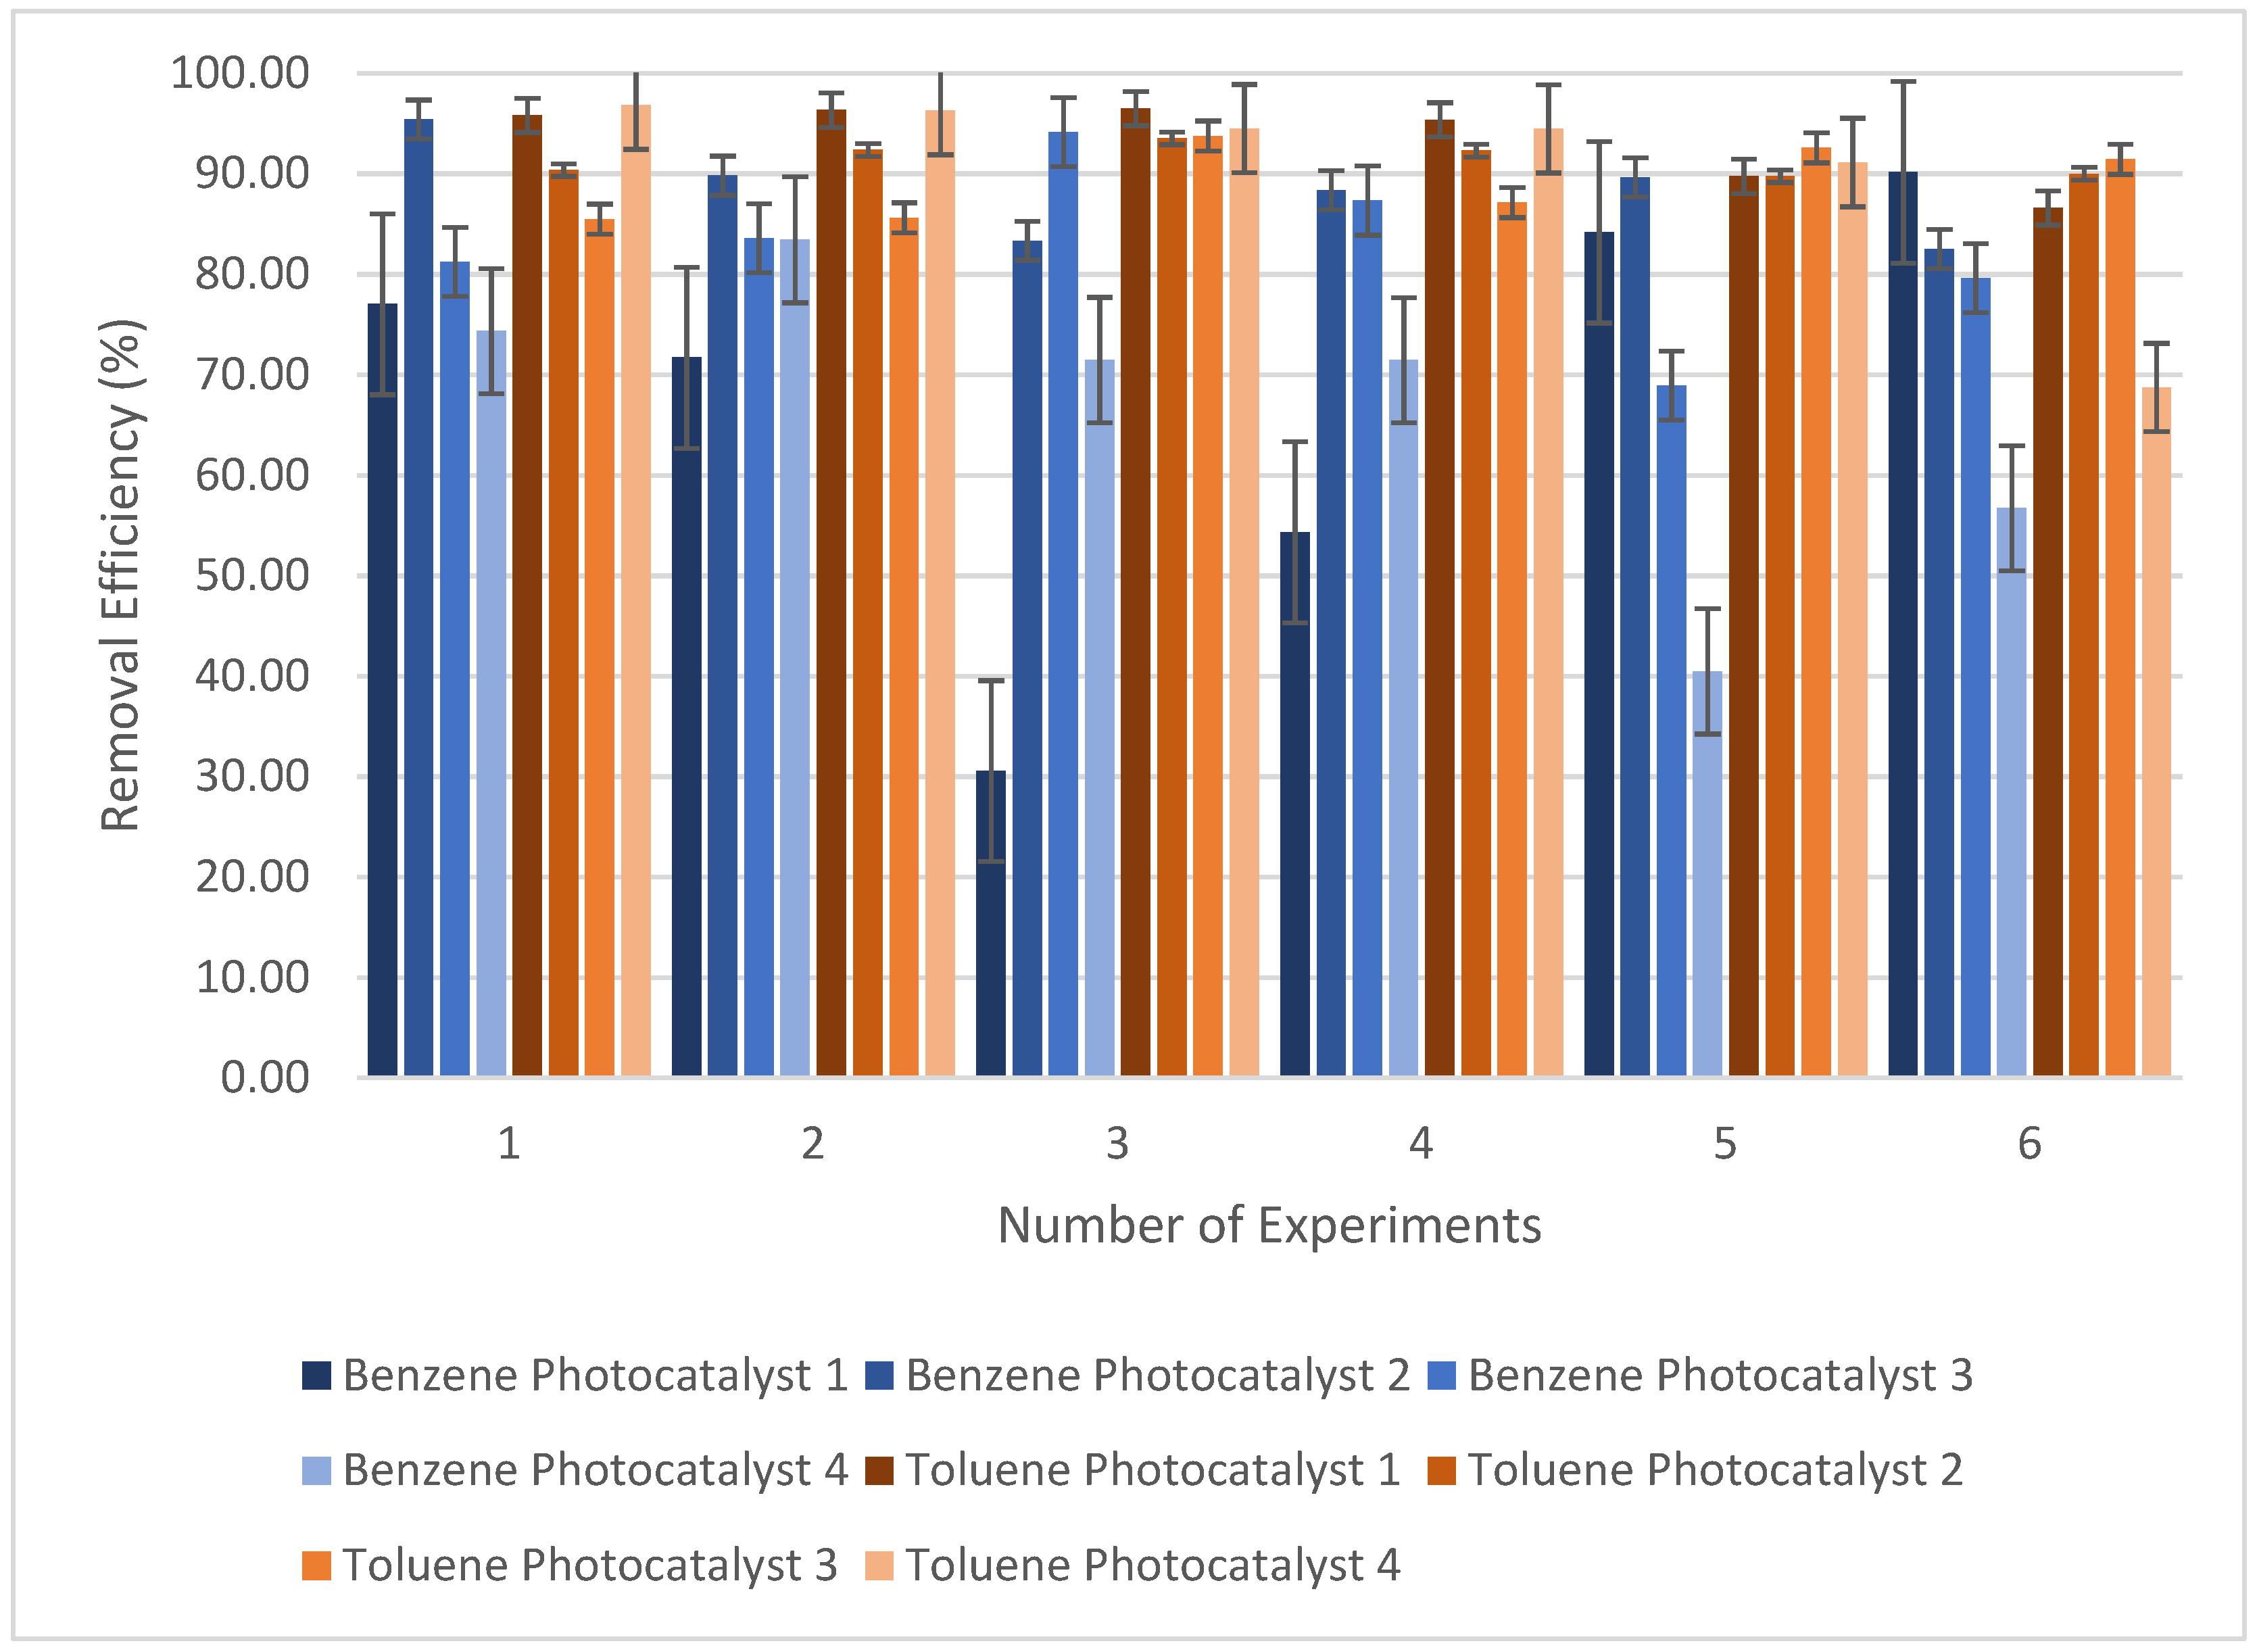
Figure 8 depicts how the percentage of photocatalyst doping affects the amount of benzene and toluene that can be removed effectively from samples in studies that use a UVA light source. Based on the information in the figure, the photocatalysts that had 1% doping and were exposed to UVA light were the most effective at removing benzene (88.18% on average). With 5% doping, the photocatalyst had an average efficiency of 66.32%, which was the lowest of all the conditions tested. In terms of toluene removal, the photocatalyst with an average removal efficiency of 93.39% and 0.5% doping offered the most successful results, while the photocatalyst with an average removal efficiency of 89.33% and 2.5% doping acquired the lowest removal efficiency possible. Nevertheless, it is extremely near the average efficiency (90.31%) observed with a 5% doping photocatalyst. It is clear that the photocatalysts with doping levels of 2.5% and 5% produce outcomes that are inferior to those produced by the other photocatalysts for this reason. This could be because the Ni percentage is much higher than the Ag percentage, and the 2.5% and 5% doped photocatalysts have low TiO2 ratios. This could have made the photocatalytic oxidation less effective than it would have been otherwise.
3.2.3. Effect of Humidity
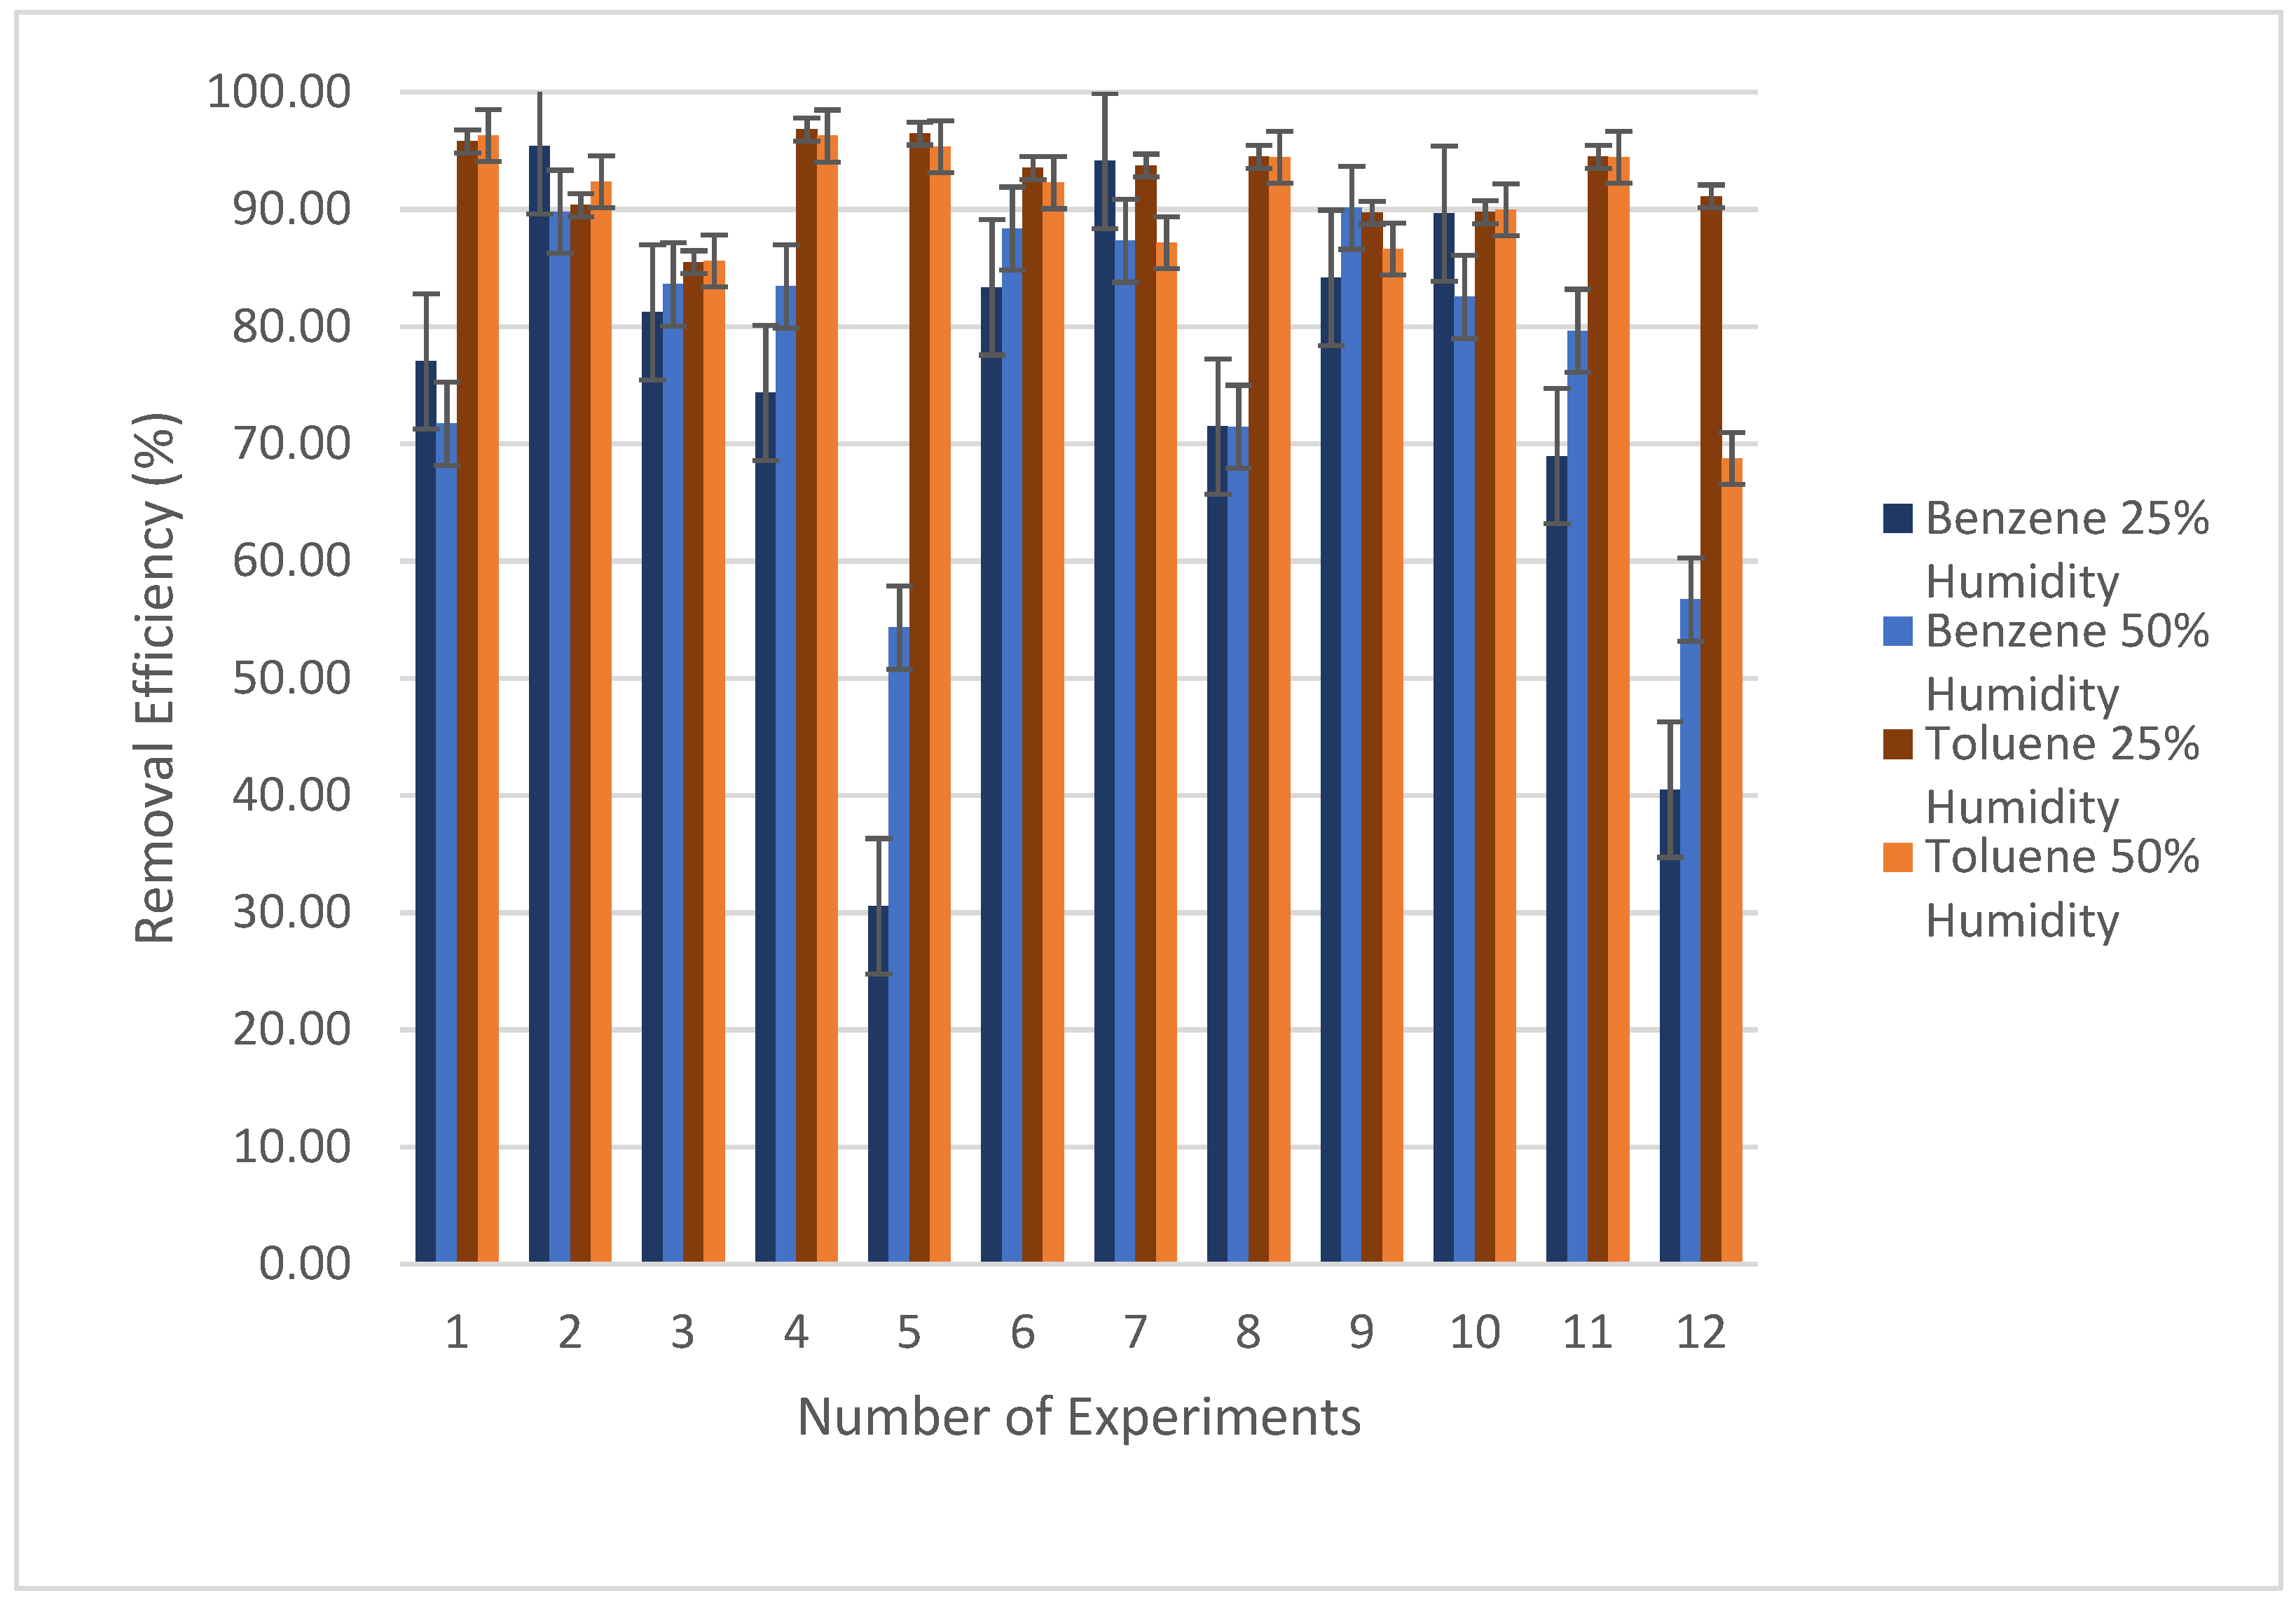
Figure 9 depicts how the moisture level present in the sample influences the amount of benzene and toluene that is removed when exposed to UVA light. Under UVA light, the effectiveness of benzene elimination was found to be 74.23% on average when the humidity was 25%, but it increased to 78.26% on average when the humidity was 50%. When the data from several of the trials is evaluated, it can be seen that the efficiency falls below 40% when the humidity is 25%. In terms of the efficiency of benzene elimination, the findings obtained with the UVA light source were found to be more successful at a humidity level of 50%. Under UVA light, the toluene removal efficiency was found to be 92.65% on average when the humidity was 25%, but it dropped to 89.97% when the humidity was 50%. In terms of the efficacy of toluene removal using the UVA light source, more successful results were obtained when the humidity was set to 25%. According to the findings, the effects of a change in the percentage of moisture on photocatalytic oxidation differ depending on the light source, the kind of pollutant, and the quantity of the pollutant.
According to the findings of the studies, photocatalytic oxidation systems require a specific amount of humidity. If this humidity value is too high, the photocatalyst surface may become dirty, which will have a negative impact on the efficiency of the photocatalytic oxidation process. Experimental investigations can be used in this context to identify the optimal percentage of moisture that should be provided to the system [23].
3.2.4. Comparison of the Effects
The results produced within the scope of the study were also assessed by comparing the various experiment-modified parameters.
Using a UVA light source, the effects of doping on benzene and toluene removal efficiency at varied temperatures and humidity rates were examined. Figure 10 depicts the radar graph resulting from this scenario. In trials utilizing photocatalyst 2 under UVA light, benzene removal efficiencies were found to be higher than in the other trials under different conditions, as depicted in this graph. Moreover, experiments using photocatalyst 1 and photocatalyst 4 demonstrate a reduced removal efficiency for benzene pollutants at various conditions. For photocatalyst 1, this behavior was found unexpectable.
Similarly, when the graph is analyzed in terms of toluene, photocatalysts 1 and 2 under UVA light at all temperatures and humidity ratios produced the highest yields. The photocatalysts with the lowest efficiency were photocatalysts 3 and 4. In this regard, benzene and toluene elimination under UVA light yield comparable results. Toluene removal efficiency was found to be greater than benzene removal efficiencies.
In particular, there is a reverse relationship between temperature increase and the removal performance of the system. Both pollutant removal performances were negatively influenced by the temperature increase caused by using photocatalyst 4. Photodegradation of toluene and benzene pollutants using the photocatalytic oxidation method has been studied in several studies before. These studies generally employed UV and visible light conditions, with a maximum humidity level of 60% [14,27,28,29,30,31,32]. Although the inhibitory effects of temperature variations are evident in the results for toluene, studies have consistently demonstrated the positive impact of dopants such as Ag and Fe on the removal efficiency [27,30,32]. In our study, the removal performances of benzene and toluene pollutants were evaluated under different conditions. The results obtained using UV light align well with similar studies in the literature [14,30,32]. The consistent use of UV light in these studies indicates that our study was appropriately directed and achieved results that are consistent with the existing literature. The experimental trials of the study revealed that an increased Ni doping on the photocatalyst surface (photocatalyst 4) negatively impacts the removal efficiency of benzene and toluene under high-temperature conditions, as can be seen in Figure 10. These findings establish a significant foundation for future studies.
Table 3 displays the results of the experiments conducted within the scope of the study and the average removal efficiencies in percentage.
Indicated in red are the average values at which the two photocatalysts achieved the highest average removal efficiencies under the conditions specified in the tables. Under UVA light and at 120 °C in the presence of 50% humidity, the most effective removal efficiencies for both contaminants were found. In terms of doping percentage, photocatalysts with 0.5% and 1% doping (Photocatalysts 1 and 2) provide the most effective removal efficiency. Using photocatalyst 2 and UVA light at 120 °C and 50% humidity, it is possible to produce simultaneous photocatalytic oxidation of contaminants.
3.3. Unwanted Peaks and By-Products
It is expected that the VOC species will react with hydroxyl radicals during the photocatalytic processes. This will turn the VOCs into carbon dioxide and water. However, this is not always achievable, and depending on the reactions that take place and the conditions that are present, a variety of unanticipated compounds may be created. In most cases, these compounds do not influence the mechanism of the reaction; however, they do cause undesired peaks on the GC chromatogram.
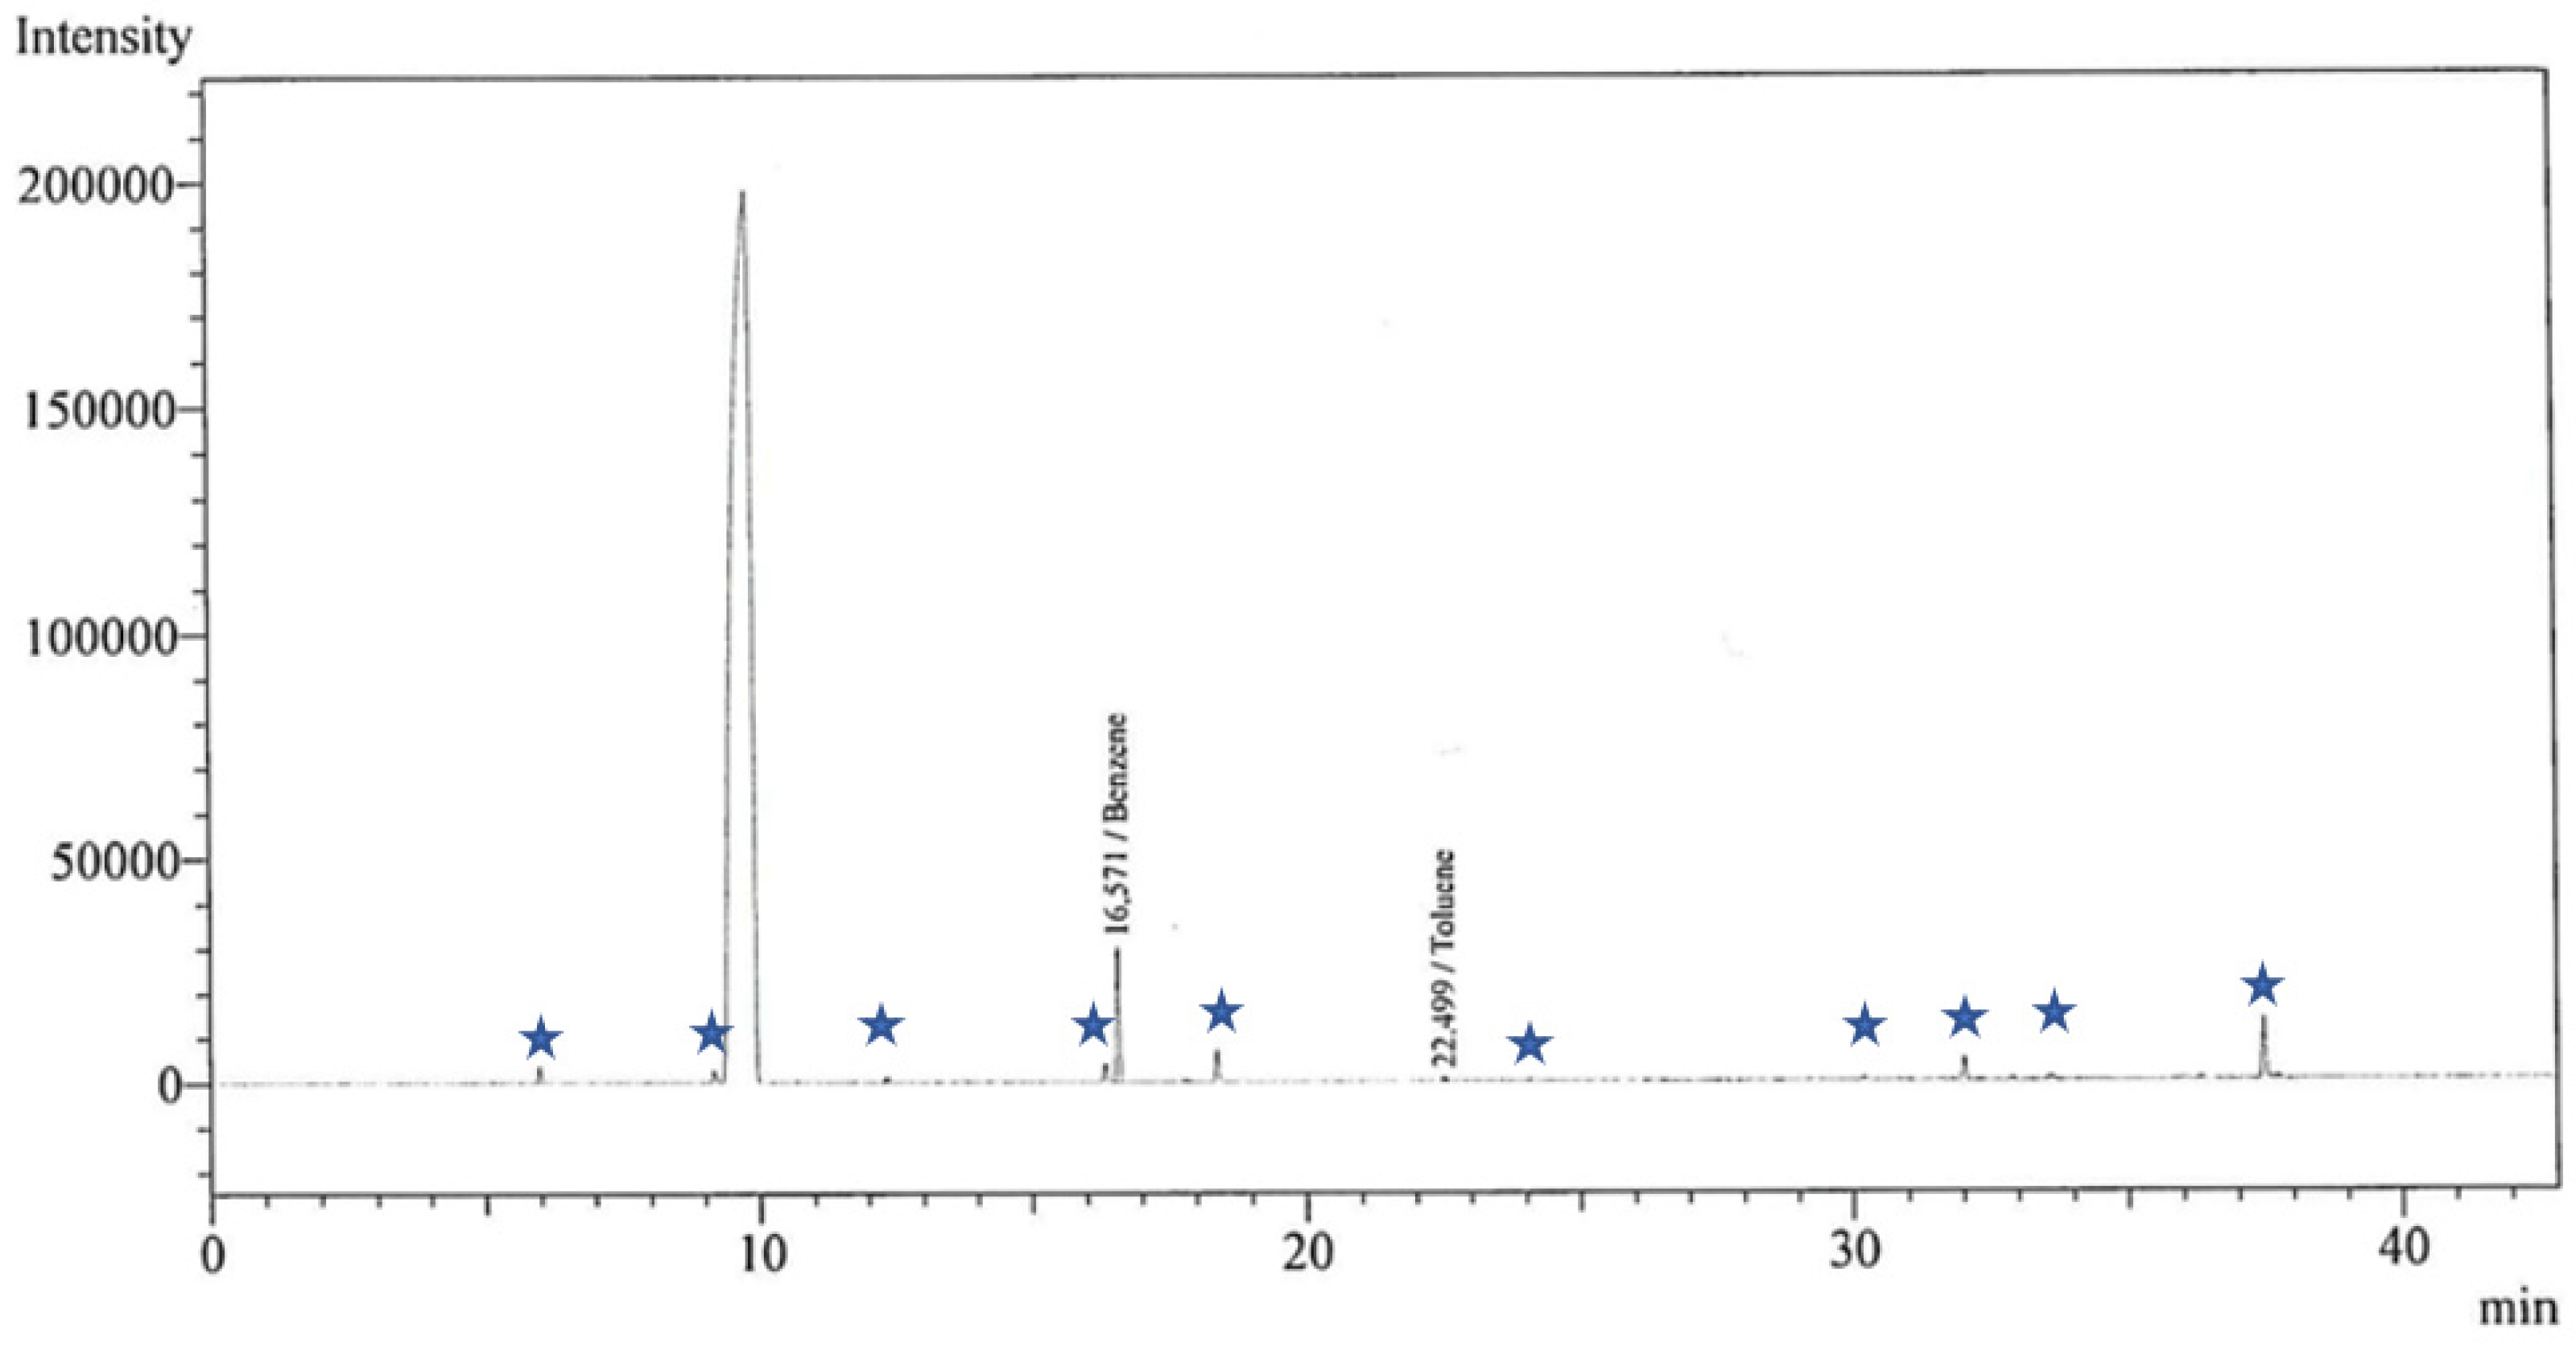
During this research, the GC-FID chromatograms revealed the presence of several undesirable peaks. An example chromatogram that was obtained from the analysis of the output sample can be found in Figure 11. This chromatogram represents the outcome of the experiment that was carried out at a temperature of 180 °C and humidity of 50%. It can be noticed in this figure that multiple peaks were not predicted (blue stars show these peaks). Comparable peaks were seen on a few of the other chromatograms of the output samples as well. These peaks were significantly more noticeable in the studies that were carried out under circumstances of 180 °C and 50% humidity. The presence of reaction intermediates may be demonstrated by the fact that these peaks dominate at higher temperatures. When Figure 11 is examined, it is seen that these unwanted peaks may be originated from compounds such as 1,2-dichloropropane, 1,1,2-tetrachloroethane, 1,3,5-trimethylbenzene, 1,1,2-trichloroethane, 1,2-dichlorobenzene, vinyl chloride, chloromethane, chloroethane and benzene-6d by comparing it with the chromatogram graph created according to the use of RTX-624 column for the contaminants that are commonly examined in VOC measurements with the Restek Pro EZGC Chromatogram Modeler [33].
In addition, these undesirable peaks might be caused by the components of the system itself, such as the reactor, the pipes, the connection parts, and so on. Similar peaks were observed on the chromatogram during the preliminary testing that was performed with an empty reactor (i.e., without a photocatalyst). In addition, benzene and toluene pollutants are extremely unlikely to be the origin of the synthesis of these compounds; instead, the working conditions are more likely to result in the formation of by-products. During the photocatalytic oxidation processes of benzene and toluene, there is a possibility that an incomplete oxidation will take place. In this scenario, the formation of a by-product takes place. These by-products include substances like phenol, benzoic acid, and benzaldehyde, among others [34]. In addition, it is essential to keep in mind that the sorbent tube, the solvent that was applied, and the GC instrument all have the potential to be responsible for the creation of these peaks.
Furthermore, some chlorocarbon compounds, such as trichloroethylene (TCE), 1,1,3-trichloropropene (TCP), and perchloroethylene (PCE), have a better photo efficiency than toluene, benzene, etc. [23]. In the instance of photocatalytic oxidation of TCE and toluene mixtures in air, the Cl radicals activate toluene by chain transfer, therefore drastically increasing the toluene conversion rate [35]. D’hennezel and Ollis [36] revealed that the use of TCE increased the photo efficiency of toluene destruction to provide 100% conversion in a single pass with a residence duration of 5–10 ms [37]. In this study, the formation of the chloro species might have a positive effect on the system’s photocatalytic removal efficiency.
4. Conclusions
Within the scope of this work, photocatalysts with varying doping percentages were employed for the photocatalytic oxidation of VOCs, which are commonly found in flue gases and have severe hazardous consequences. To accomplish this, experimental circumstances were created, and harmful gases (benzene and toluene) were manufactured artificially. Based on the average temperatures created during the emission of flue gases, the optimal operating temperatures and humidity for the reactor were adjusted. SEM-EDX, XRD, and AFM investigations were conducted to better comprehend the properties of the photocatalyst and thin film. In the photocatalytic oxidation studies, the effects of adjusting the ambient temperature (120 °C, 150 °C, and 180 °C) and the moisture content of the gas (25% and 50%) injected into the reactor on the removal efficiency were evaluated. During the studies, gas samples were drawn into the sorbent tube and subsequently analyzed with a GC-FID following CS2 extraction.
When the study’s findings were analyzed, it was revealed that the pollutant gases exhibited distinct removal properties in response to the system modifications. Studies employing a 1% doped photocatalyst yielded the most effective results under the UVA light utilized in the experiments. This result is consistent with the more uniform distribution of Ag and Ni on photocatalyst surfaces. With a 5% doped photocatalyst, the removal efficiency for both contaminants was low. XRD examination revealed that the effect of TiO2 was reduced by Ni in the photocatalyst with 5% doping and that the Ni ratio was significantly greater than Ag. Considering these factors, it is anticipated that the removal efficiency of the photocatalysts used in these tests will be quite low. Moreover, the surface roughness measurements made with AFM support this approach. The roughness value of a 5%-doped photocatalyst has been found to be 20 times higher than the roughness values of 0.5% and 1%-doped photocatalysts. It has been shown that surface roughness might have a negative impact on photocatalytic reduction. Considering the impacts of temperature, it was established that high temperatures in this investigation had no negative impact on the removal efficiency. Although the maximum yields for both pollutants were found at 120 °C, in terms of elimination efficiency, the findings obtained at 150 °C for benzene and 180 °C for toluene were the least effective. It has been discovered that a slight decrease in removal efficiency occurs at elevated temperatures, although the average removal efficiency is still over 60%. The moisture percentages utilized in the system also had an impact on its removal performance. Benzene removal under UVA radiation was more effective at 50% humidity, while toluene removal was more effective at 25% humidity. These results demonstrated that the rise in humidity had no negative impact on the system’s performance. However, it did not significantly affect the outcomes.
The objective of this work was to concurrently remove benzene and toluene, both of which are significant air pollutants, from flue gases under various experimental settings and to identify the optimal system. After studying the results of the experiments, it was found that UVA light, a photocatalyst that was doped with 1% benzene, a temperature of 120 °C, and a 50% moisture content were the best conditions for removing the benzene and toluene gases. Moreover, the average removal efficiency for benzene when exposed to the UVA light source was determined to be 76.24%, whereas the average removal efficiency for toluene was determined to be 91.10%. Low toluene entrance concentrations and the chloro species generated during the reactions may be the primary reasons for the enhancement in toluene removal.
The surfaces of the photocatalysts remained unchanged during the testing. In certain research on the photocatalytic oxidation of benzene and toluene, it was noted that by-products induced a color change and darkening on the surfaces of photocatalysts, which had a negative impact on the removal efficiency [17,38]. In this context, it demonstrates that the trials had no effect on the performance of the produced photocatalysts and that their long-term use is possible, particularly at low concentrations.
Author Contributions
The introduction, materials and method, results and discussions, and conclusions sections were written by Z.C.A. Control of the paper was made by S.D. All experimental work was undertaken by Z.C.A. and S.D. supported experimental work as an advisor. All authors have read and agreed to the published version of the manuscript.
Funding
Financial funding for this study was provided by the Scientific Research Projects (BAP) of Selcuk University for the thesis project (18101004) and the Environment, Atmosphere, Earth, and Marine Sciences Research Support Group of the Technological Research Institute of Turkey (TUBITAK) (118Y080).
Institutional Review Board Statement
Not applicable.
Informed Consent Statement
Not applicable.
Data Availability Statement
The data presented in this study are available on request from the corresponding author. The data are not publicly available due to it being part of the project.
Conflicts of Interest
The authors declare no conflict of interest. The funders had no role in the design of the study, in the collection, analyses, or interpretation of data, in the writing of the manuscript, or in the decision to publish the results.
References
- Yücedağ, C.; Kaya, L.G. Impacts of Air Pollutants to Plants. J. Grad. Sch. Nat. Appl. Sci. Mehmet Akif Ersoy Univ. 2016, 7, 67–74. [Google Scholar]
- Holman, C. 8—Sources of Air Pollution. In Air Pollution and Health; SHolgate, T., Samet, J.M., Koren, H.S., Maynard, R.L., Eds.; Academic Press: London, UK, 1999; pp. 115–148. [Google Scholar]
- EPA Technical Overview of Volatile Organic Compounds. 2017. Available online: https://www.epa.gov/indoor-air-quality-iaq/technical-overview-volatile-organic-compounds (accessed on 15 April 2022).
- Rymen, T.A.A. Tracing Organic Gaseous Pollutants in the Atmosphere: The Gas Chromatographic Survey of Vinyl Chloride-and Paint industry. Int. J. Environ. Anal. Chem. 1979, 6, 1–23. [Google Scholar] [CrossRef]
- Manahan, S.E. Fundamentals of Environmental Chemistry; CRC Press: Boca Raton, FL, USA, 2011. [Google Scholar]
- Gholami, M.; Nassehinia, H.R.; Jonidi-Jafari, A.; Nasseri, S.; Esrafili, A. Comparison of Benzene & Toluene removal from synthetic polluted air with use of Nano photocatalytic TiO2/ZNO process. J. Environ. Health Sci. Eng. 2014, 12, 1–8. [Google Scholar]
- Shayegan, Z.; Lee, C.-S.; Haghighat, F. TiO2 photocatalyst for removal of volatile organic compounds in gas phase—A review. Chem. Eng. J. 2018, 334, 2408–2439. [Google Scholar] [CrossRef]
- Verbruggen, S.W. TiO2 photocatalysis for the degradation of pollutants in gas phase: From morphological design to plasmonic enhancement. J. Photochem. Photobiol. C Photochem. Rev. 2015, 24, 64–82. [Google Scholar] [CrossRef]
- Rahimi, N.; Pax, R.A.; Gray, E.M. Review of functional titanium oxides. I: TiO2 and its modifications. Prog. Solid State Chem. 2016, 44, 86–105. [Google Scholar] [CrossRef]
- Dijy, C.; Divya, D. Reduction of air pollution from vehicles using titanium dioxide. Int. Res. J. Eng. Technol. 2015, 2, 1308–1314. [Google Scholar]
- Zhong, L.; Haghighat, F.; Blondeau, P.; Kozinski, J. Modeling and physical interpretation of photocatalytic oxidation Efficiency in indoor air applications. Build. Environ. 2010, 45, 2689–2697. [Google Scholar] [CrossRef]
- Aegerter, M.A.; Mennig, M. Sol-Gel Technologies for Glass Producers and Users; Springer Science & Business Media: Berlin/Heidelberg, Germany, 2013. [Google Scholar]
- Chapuis, Y.; Klvana, D.; Guy, C.; Kirchnerova, J. Photocatalytic oxidation of volatile organic compounds using fuorescent visible light. J. Air Waste Manag. Assoc. 2002, 52, 845–854. [Google Scholar] [CrossRef]
- Huang, H.; Liu, G.; Zhan, Y.; Xu, Y.; Lu, H.; Huang, H.; Feng, Q.; Wu, M. Photocatalytic oxidation of gaseous benzene under VUV irradiation over TiO2/zeolites catalysts. Catal. Today 2017, 281, 649–655. [Google Scholar] [CrossRef]
- Ji, J.; Xu, Y.; Huang, H.; He, M.; Liu, S.; Liu, G.; Xie, R.; Feng, Q.; Shu, Y.; Zhan, Y.; et al. Mesoporous TiO2 under VUV irradiation: Enhanced photocatalytic oxidation for VOCs degradation at room temperature. Chem. Eng. J. 2017, 327, 490–499. [Google Scholar] [CrossRef]
- Passalia, C.; Alfano, O.M.; Brandi, R.J. Integral design methodology of photocatalytic reactors for air pollution remediation. Molecules 2017, 22, 945. [Google Scholar] [CrossRef] [PubMed]
- Kozlov, D.V. Titanium Dioxide in gas-Phase Photocatalytic Oxidation of Aromatic and Heteroatom Organic Substances: Deactivation and Reactivation of Photocatalyst. Theor. Exp. Chem. 2014, 50, 133–154. [Google Scholar] [CrossRef]
- Dursun, S.; Ayturan, Z.C. Simultaneous Removal of Gaseous Benzene and Toluene with Photocatalytic Oxidation Process at High Temperatures under UVC Irradiation. Environ. Sci. Pollut. Res. 2022, 29, 38232–38247. [Google Scholar] [CrossRef] [PubMed]
- Yates, M.; Martin, J.C.; Ávila, O.; Gil-Llambias, F.J. Influence of the Bentonite/Titania Ratio on the Textural Characteristics of Incorporated Ceramics for Photocatalytic Destruction of Volatile Organic Compounds. In Studies in Surface Science and Catalysis; Llewellyn, P.L., Rodriquez-Reinoso, F., Rouqerol, J., Seaton, N., Eds.; Elsevier: Amsterdam, The Netherlands, 2007; pp. 233–240. [Google Scholar]
- Persson, H. Photocatalytic Oxidation for VOC Abatement. Master’s Thesis, Department of Chemical Engineering and Technology, KTH Royal Institute of Technology, Stockholm, Sweden, 2015. [Google Scholar]
- Han, Y.; Zhang, J.; Zhao, Y. Visible-light-induced photocatalytic oxidation of nitric oxide and sulfur dioxide: Discrete kinetics and mechanism. Energy 2016, 103, 725–734. [Google Scholar] [CrossRef]
- Łabuz, P.; Gryboś, J.; Pietrzyk, P.; Sobańska, K.; Macyk, W.; Sojka, Z. Photogeneration of reactive oxygen species over ultrafine TiO2 particles functionalized with rutin–ligand induced sensitization and crystallization effects. Res. Chem. Intermed. 2019, 45, 5781–5800. [Google Scholar] [CrossRef]
- Mo, J.; Zhang, Y.; Xu, Q.; Zhu, Y.; Lamson, J.J.; Zhao, R. Determination and risk assessment of by-products resulting from photocatalytic oxidation of toluene. Appl. Catal. B 2009, 89, 570–576. [Google Scholar] [CrossRef]
- Mo, J.; Zhang, Y.; Xu, Q.; Zhu, Y.; Lamson, J.J.; Zhao, R. Photocatalytic purification of volatile organic compounds in indoor air: A literature review. Atmos. Environ. 2009, 43, 2229–2246. [Google Scholar] [CrossRef]
- Zorn, M.E.; Tompkins, D.T.; Zeltner, W.A.; Anderson, M.A. Photocatalytic oxidation of acetone vapor on TiO2/ZrO2 thin films. Appl. Catal. B Environ. 1999, 23, 1–8. [Google Scholar] [CrossRef]
- Wu, J.-F.; Hung, C.-H.; Yuan, C.-S. Kinetic modeling of promotion and inhibition of temperature on photocatalytic degradation of benzene vapor. J. Photochem. Photobiol. A Chem. 2005, 170, 299–306. [Google Scholar] [CrossRef]
- Bianchi, C.L.; Gatto, S.; Pirola, C.; Naldoni, A.; Di Michele, A.; Cerrato, G.; Crocellà, V.; Capucci, V. Photocatalytic degradation of acetone, acetaldehyde and toluene in gas-phase: Comparison between nano and micro-sized TiO2. Appl. Catal. B Environ. 2014, 146, 123–130. [Google Scholar] [CrossRef]
- Hussain, M.; Russo, N.; Saracco, G. Photocatalytic abatement of VOCs by novel optimized TiO2 nanoparticles. Chem. Eng. J. 2011, 166, 138–149. [Google Scholar] [CrossRef]
- Khan, R.; Kim, T.-J. Preparation and application of visible-light-responsive Ni-doped and SnO2-coupled TiO2 nanocomposite photocatalysts. J. Hazard. Mater. 2009, 163, 1179–1184. [Google Scholar] [CrossRef] [PubMed]
- Sun, S.; Ding, J.; Bao, J.; Gao, C.; Qi, Z.; Yang, X.; He, B.; Li, C. Photocatalytic degradation of gaseous toluene on Fe-TiO2 under visible light irradiation: A study on the structure, activity and deactivation mechanism. Appl. Surf. Sci. 2012, 258, 5031–5037. [Google Scholar] [CrossRef]
- Dhada, I.; Nagar, P.K.; Sharma, M. Challenges of TiO2-based photooxidation of volatile organic compounds: Designing, coating, and regenerating catalyst. Ind. Eng. Chem. Res. 2015, 54, 5381–5387. [Google Scholar] [CrossRef]
- Li, X.; Zou, X.; Qu, Z.; Zhao, Q.; Wang, L. Photocatalytic degradation of gaseous toluene over Ag-doping TiO2 nanotube powder prepared by anodization coupled with impregnation method. Chemosphere 2011, 83, 674–679. [Google Scholar] [CrossRef]
- Restek Pro EZGC Chromatogram Modeler. Available online: https://ez.restek.com/proezgc/en (accessed on 30 June 2022).
- Boyjoo, Y.; Sun, H.; Liu, J.; Pareek, V.K.; Wang, S. A review on photocatalysis for air treatment: From catalyst development to reactor design. Chem. Eng. J. 2017, 310, 537–559. [Google Scholar] [CrossRef]
- Luo, Y.; Ollis, D.F. Heterogeneous photocatalytic oxidation of trichloroethylene and toluene mixtures in air: Kinetic promotion and inhibition, time-dependent catalyst activity. J. Catal. 1996, 163, 1–11. [Google Scholar] [CrossRef]
- D’hennezel, O.; Pichat, P.; Ollis, D.F. Benzene and toluene gas-phase photocatalytic degradation over H2O and HCL pretreated TiO2: By-products and mechanisms. J. Photochem. Photobiol. A—Chem. 1998, 118, 197–204. [Google Scholar] [CrossRef]
- Sauer, M.L.; Hale, M.A.; Ollis, D.F. Heterogeneous photocatalytic oxidation of dilute toluene–chlorocarbon mixtures in air. J. Photochem. Photobiol. A—Chem. 1995, 88, 169–178. [Google Scholar] [CrossRef]
- Einaga, H.; Futamura, S.; Ibusuki, T. Heterogeneous photocatalytic oxidation of benzene, toluene, cyclohexene and cyclohexane in humidifed air: Comparison of decomposition behavior on photoirradiated TiO2 catalyst. Appl. Catal. B Environ. 2002, 38, 215–225. [Google Scholar] [CrossRef]
Figure 1.
The diagrammatic illustration of the photocatalytic oxidation process.

Figure 2.
The schematic representation of the designed system.

Figure 3.
(a1) SEM image of 0.5% doped photocatalyst, (a2) SEM image of 1% doped photocatalyst, (a3) SEM image of 2.5% doped photocatalyst, (a4) SEM image of 5% doped photocatalyst, (b1) EDX mapping of Ag, Ni, and Ti element distribution of 0.5% doped photocatalyst, (b2) EDX mapping of Ag, Ni, and Ti element distribution of 1% doped photocatalyst, (b3) EDX mapping of Ag, Ni, and Ti element distribution of 2.5% doped photocatalyst, (b4) EDX mapping of Ag, Ni, and Ti element distribution of 5% doped photocatalyst.

Figure 4.
(a) XRD diffraction graphs of a 0.5% doped photocatalyst (Photocatalyst 1), (b) XRD diffraction graphs of a 1% doped photocatalyst (Photocatalyst 2), (c) XRD diffraction graphs of a 2.5% doped photocatalyst (Photocatalyst 3), (d) XRD diffraction graphs of a 5% doped photocatalyst (Photocatalyst 4).

Figure 5.
(a1) 2D AFM image of 0.5% doped photocatalyst, (a2) 2D AFM image of 1% doped photocatalyst, (a3) 2D AFM image of 2.5% doped photocatalyst, (a4) 2D AFM image of 5% doped photocatalyst, (b1) 3D AFM image of 0.5% doped photocatalyst, (b2) 3D AFM image of 1% doped photocatalyst, (b3) 3D AFM image of 2.5% doped photocatalyst, (b4) 3D AFM image of 5% doped photocatalyst.

Figure 6.
Comparison of benzene and toluene percentage removal efficiencies.

Figure 7.
The influence of temperature on the removal efficiency of benzene and toluene.

Figure 8.
The influence of doping percentage on the removal efficiency of benzene and toluene.

Figure 9.
The influence of humidity on the removal efficiency of benzene and toluene.

Figure 10.
The impact of doping percentage on the removal efficiency of benzene and toluene at varying temperatures and humidity levels.
Figure 10.
The impact of doping percentage on the removal efficiency of benzene and toluene at varying temperatures and humidity levels.

Figure 11.
Chromatogram showing the unexpected peaks at 180 °C and 50% humidity.


Table 1.
Thin film thickness of material surfaces and parameters used in the calculation.
| Samples with Different Doping Percentages | Parameters | Measured Values | Thin Film Thickness (µm) |
|---|---|---|---|
| 0.5% | Viscosity (mPa.s) | 1.5 | 5.9 |
| Surface Tension (dyn/cm) | 23.77 | ||
| Density (g/cm3) | 0.86 | ||
| Dip Speed (mm/s) | 2 | ||
| 1% | Viscosity (mPa.s) | 1.7 | 6.4 |
| Surface Tension (dyn/cm) | 21.606 | ||
| Density (g/cm3) | 0.87 | ||
| Dip Speed (mm/s) | 2 | ||
| 2.5% | Viscosity (mPa.s) | 2 | 7.1 |
| Surface Tension (dyn/cm) | 22.99 | ||
| Density (g/cm3) | 0.865 | ||
| Dip Speed (mm/s) | 2 | ||
| 5% | Viscosity (mPa.s) | 1.4 | 5.7 |
| Surface Tension (dyn/cm) | 21.57 | ||
| Density (g/cm3) | 0.867 | ||
| Dip Speed (mm/s) | 2 |
Table 2.
Photocatalytic Oxidation Reactions of TiO2 [7].
Table 2.
Photocatalytic Oxidation Reactions of TiO2 [7].
| Reactions |
|---|
| Photonic Excitation Reaction: TiO2 + hv → h+ + e− |
| Oxidation Reaction: OH− + h+ → OH* |
| Reduction Reaction: O2 + e− → O2− |
| Ionization of Water: H2O → OH− + H+ |
| Protonization of Super-oxide: O2*− + H+ → HOO* |
| Electron Removal: HOO* + e− → HOO− |
| Formation of H2O2: HOO− + H+ → H2O2 |
| OH* + pollutant + O2 → products CO2, H2O, vb.) |
Table 3.
Summary of the results obtained by experiments.
| Pollutant | Photocatalyst | Removal Efficiency (%) | ||||||
|---|---|---|---|---|---|---|---|---|
| at 120 °C, 25% Humidity | at 120 °C, 50% Humidity | at 150 °C, 25% Humidity | at 150 °C, 50% Humidity | at 180 °C, 25% Humidity | at 180 °C, 50% Humidity | Avg. | ||
| Benzene | Photocatalyst 1 | 77.04 | 71.71 | 30.55 | 54.32 | 84.17 | 90.15 | 67.99 |
| Photocatalyst 2 | 95.39 | 89.81 | 83.35 | 88.38 | 89.63 | 82.53 | 88.18 | |
| Photocatalyst 3 | 81.23 | 83.60 | 94.12 | 87.34 | 68.95 | 79.64 | 82.48 | |
| Photocatalyst 4 | 74.35 | 83.43 | 71.47 | 71.45 | 40.48 | 56.72 | 66.32 | |
| Avg. | 82.00 | 82.14 | 69.87 | 75.37 | 70.81 | 77.26 | ||
| Toluene | Photocatalyst 1 | 95.81 | 96.32 | 96.48 | 95.36 | 89.73 | 86.61 | 93.39 |
| Photocatalyst 2 | 90.35 | 92.35 | 93.52 | 92.28 | 89.75 | 89.97 | 91.38 | |
| Photocatalyst 3 | 85.49 | 85.62 | 93.74 | 87.15 | 94.48 | 94.46 | 90.16 | |
| Photocatalyst 4 | 96.81 | 96.27 | 94.48 | 94.46 | 91.12 | 68.74 | 90.32 | |
| Avg. | 92.12 | 92.65 | 94.56 | 92.32 | 91.27 | 84.95 | ||
Disclaimer/Publisher’s Note: The statements, opinions and data contained in all publications are solely those of the individual author(s) and contributor(s) and not of MDPI and/or the editor(s). MDPI and/or the editor(s) disclaim responsibility for any injury to people or property resulting from any ideas, methods, instructions or products referred to in the content. |
© 2024 by the authors. Licensee MDPI, Basel, Switzerland. This article is an open access article distributed under the terms and conditions of the Creative Commons Attribution (CC BY) license (https://creativecommons.org/licenses/by/4.0/).
Share and Cite
MDPI and ACS Style
Ayturan, Z.C.; Dursun, S. Photocatalytic Reduction of VOCs with Ag/Ni-Doped Photocatalyst in Different Temperature and Humidity Environments. Atmosphere 2024, 15, 70. https://0-doi-org.brum.beds.ac.uk/10.3390/atmos15010070
AMA Style
Ayturan ZC, Dursun S. Photocatalytic Reduction of VOCs with Ag/Ni-Doped Photocatalyst in Different Temperature and Humidity Environments. Atmosphere. 2024; 15(1):70. https://0-doi-org.brum.beds.ac.uk/10.3390/atmos15010070
Chicago/Turabian StyleAyturan, Zeynep Cansu, and Sukru Dursun. 2024. "Photocatalytic Reduction of VOCs with Ag/Ni-Doped Photocatalyst in Different Temperature and Humidity Environments" Atmosphere 15, no. 1: 70. https://0-doi-org.brum.beds.ac.uk/10.3390/atmos15010070
Note that from the first issue of 2016, this journal uses article numbers instead of page numbers. See further details here.