

Study on the Spatial and Temporal Distribution of Thermal Comfort and Its Influencing Factors in Urban Parks

1
School of Geographical Science and Tourism, Xinjiang Normal University, Urumqi 830054, China
2
Xinjiang Key Laboratory of Lake Environment and Resources in Arid Zone, Urumqi 830054, China
*
Author to whom correspondence should be addressed.
Atmosphere 2024, 15(2), 183; https://0-doi-org.brum.beds.ac.uk/10.3390/atmos15020183
Submission received: 29 December 2023
/
Revised: 19 January 2024
/
Accepted: 20 January 2024
/
Published: 31 January 2024
(This article belongs to the Special Issue Effects of Climate Change on Human Health and Thermal Comfort Conditions and Adaptation)
Abstract
:In order to better understand the thermal comfort of urban parks and provide empirical reference for urban green space optimization design, 5 days’ field monitoring was conducted in People’s Park in Urumqi, an oasis city in an arid region of China. Combined with GIS spatial interpolation, correlation analysis, and regression analysis, the spatial and temporal distribution of thermal comfort (HI and WBGT) of urban parks was discussed. The results showed the following. (1) The thermal comfort in the morning was generally higher than that in the afternoon, and the thermal comfort near the water body and lush vegetation in the park was higher, while the thermal comfort on the road was lower, especially on Hotan Street and Binhenan Road, which were far away from the park. Therefore, it is recommended that nearby residents exercise outdoors in the morning as much as possible and in the park, and in the afternoon, keep to the park and its vicinity and try to sit quietly or walk slowly, avoiding the less comfortable areas, such as Hotan Road and Binhenan Road. (2) Due to dense vegetation and lack of infrastructure construction, the thermal comfort area does not have the conditions for crowd gathering. Therefore, it is recommended that the park improve the infrastructure of relevant areas. (3) Through the analysis of the significant influence of explanatory variables on the explained variables, it shows that the ventilation effect in the park is insufficient. Therefore, it is recommended to appropriately increase the number of trees, water bodies, and wind channels to promote ventilation in the park so as to improve the thermal comfort of the park. These findings provide a theoretical basis and technical reference for optimizing the thermal comfort of urban green space and establishing a healthier and more comfortable living environment for urban residents.
1. Introduction
Urbanization is a complex natural and social process involving an increase in population proportion, the expansion of urban construction land and the rapid growth of economic activities. Worldwide environmental problems caused or exacerbated by urban sprawl include biodiversity loss, climate change, and water and air quality degradation [1]. Among the many negative environmental effects of urbanization, the most common is the urban heat island (UHI) effect, which refers to the increase in the temperature of densely populated urban centers relative to rural environments. Rising temperatures in urban areas can lead to health problems (including deaths) and shortages in energy supply [2]. In addition, urban warming will reduce the thermal comfort of the city and hurt people’s healthy lives. Urban thermal comfort is an important parameter to measure the quality of the urban living environment, and also an important index to evaluate the urban thermal environment. Lack of outdoor thermal comfort can also have negative social and economic impacts [3]. In hot weather, people tend to only engage in some necessary outdoor activities, such as going to work and shopping, and related leisure activities will be greatly reduced. However, in developing countries, the problem of poor outdoor thermal comfort often receives little attention.
Urban parks are the main places for citizens to engage in outdoor activities, as well as an important part of the urban green space system, which plays an important role in alleviating the urban heat island effect and improving outdoor thermal comfort [4]. Outdoor thermal comfort is the most important factor in attracting city residents to the park. Thermal comfort is defined as “a state of mind that expresses satisfaction with the thermal environment and is evaluated by subjective evaluation” [5]. With the deterioration of the urban climate, people pay more and more attention to the urban environment, which makes researchers all over the world focus on outdoor thermal comfort, and the research results on outdoor thermal comfort are increasing year by year. There are many factors affecting thermal comfort, and subjective factors focus on the human body’s thermal perception (age, gender, physique, regional and cultural background, etc.) [6]. Objectively, passive and controllable thermal environment factors, such as temperature, humidity, wind speed, etc. [7], as well as actively regulated green space structure and water distribution [8], all have an impact on the thermal comfort of urban parks. To better understand and evaluate thermal comfort in an urban environment, researchers also use relevant technical means, such as on-site monitoring [9], numerical simulation [10], remote sensing technology [11] and index evaluation. Among these, more than 165 thermal comfort indexes have been developed for indoor and outdoor applications to quantify the thermal environment, but only a few are in use [12]. Standard effective temperature (SET) [13], wet-bulb globe temperature (WBGT) [14], heat index (HI) [15], physiologically equivalent temperature (PET) [7], PMV-PPD [16], thermal discomfort (DISC), etc., are all commonly used thermal environment evaluation indexes, but there is no conclusion as to which is the best index.
In recent years, China’s urbanization process has been accelerating, and the urbanization rate reached 63.89% in 2021 [17]. In 2013, the National Climate Change Adaptation Strategy issued by the National Development and Reform Commission of China took measures such as studying the regulation of urban heat island effect, promoting energy saving and emission reduction technologies, and encouraging low-carbon transportation as key measures to build ecologically friendly cities. In cities, high density, high buildings, less greenery, and large amounts of heat sources and waste heat discharge lead to problems such as rising urban temperature and declining air quality, resulting in continuous deterioration in the urban thermal environment, which is not conducive to human physical and mental health [4] and reduces urban thermal comfort. Many studies on outdoor thermal comfort in China mainly focus on the hot summer and warm winter climate areas in typical cities such as Guangzhou and Hong Kong. The second is the cold zone, represented by Harbin and Xi‘an [5]. However, less attention has been paid to cities in cold and arid regions, such as Urumqi. In addition, researchers have conducted studies on urban green space in Urumqi from different dimensions, including spatial landscape pattern [18], green space construction [19], accessibility and distribution equity [20], etc. It is urgent to conduct systematic integration studies from the perspective of thermal comfort. Therefore, discussing the thermal comfort of People’s Park is helpful to further analyze the thermal environment of Urumqi, Xinjiang, China.
Summer field monitoring was carried out in a typical cold arid area in Urumqi, China. Statistical analysis and GIS technology were used to quantitatively analyze the interaction mechanism between each component factor of the park green space system and microclimate. On this basis, an operational strategy for improving the thermal comfort of the park’s green space was summarized through integrated analysis, with the planning and design method of park green space with thermal comfort as the core. This research is expected to improve the comfort of outdoor activities of our residents, improve the environmental quality of our urban parks, and promote the healthy development of our public green space system. On the basis of previous studies on the evaluation of thermal comfort, the thermal comfort index (HI and WBGT) was calculated to evaluate the thermal comfort of People’s Park in Urumqi, Xinjiang with a view to summarizing the influencing factors and intensity of thermal comfort in and urban park microenvironment and to provide reference for urban green space planning and improve thermal comfort and the quality of outdoor life of residents.
The research on thermal comfort in arid areas provides the scientific community with a deep understanding of the unique thermal environment and human adaptive capacity in arid areas, and provides important scientific support for the development of adaptation technologies and the prediction of climate change. These studies provide important guidance and direction for solving the problem of thermal comfort in arid areas and improving people’s life quality.
2. Materials and Methods
2.1. Study Area
Urumqi is located in the center of Eurasia, northwest China, the northern foot of the middle Tianshan Mountains, the southern edge of Junggar Basin and the central part of Xinjiang. The Urumqi Municipal People’s Government announced in public data on 13 April 2023 that the total area is 13,800 square kilometers, with a permanent population of 4.0824 million and urban population accounting for over 90%. It is the capital of Xinjiang Uygur Autonomous Region and the political, economic and cultural center of Xinjiang, and is surrounded by mountains on three sides. With an average altitude of 800 m, it has a semi-arid continental climate in the middle-temperate zone. At the end of 2022, the green coverage rate of Urumqi was 40.38%, the per capita green park area of the city 12.93 square meters, the service radius coverage rate of park green activity venues 90.8%, 1321 small amusement parks had been built, and the ecological environment quality continued to improve. People’s Park is located at 3 Youyou South Road, Shaybak District, Urumqi at 87°36′ E and 43°48′ N. It is a comprehensive park with the largest area and the longest history in the center of Urumqi and integrating culture, entertainment and leisure. It covers an area of 300,000 m2 (about 450 mu), has a green coverage rate of 96%, and is 715–721 m above sea level. In addition to local micro-topography and artificial lakes, it is generally relatively flat and open. In 2006, the national 3A scenic tourism park was established, and in 2010, it was identified as the pilot unit of the national defense education theme park [21]. Looking at the development situation of the urban thermal environment in China, urban parks shoulder the mission of cooling and humidifying, alleviating urban heat islands and improving urban thermal comfort to a certain extent [4]. How to perceive the risks of the urban thermal environment and improve the thermal comfort of urban parks is a new task facing Urumqi People’s Park (Figure 1).
2.2. Experimental Design
Kestrel instruments are designed, built, sold and supported in the USA by Nielsen-Kellerman Company. A Kestrel 5400 was used for monitoring mainly temperature, humidity, heat index, wet-bulb globe temperature, wind speed and other meteorological data. A Kestrel 5500 handheld meteorological recorder was used for monitoring. A Garmin eTrex 201, developed in the USA by Jiaming International Avionics Switzerland Co., Ltd., was used for mobile monitoring routes and longitude and latitude. The basic performance parameters of the instrument are shown in Table 1.
This survey was conducted in the summer of the Northern Hemisphere from 1 July to 6 July 2023. A typical meteorological day with clear skies and no extreme weather was selected for field measurement (Table 2). Because the weather on 2 July did not meet the requirements of the experiment, the data from that day were excluded. The 5-day field measurement included working days and non-working days, and the daily experiment time was divided into two periods: 8:30–10:50 in the morning and 3:00–5:20 p.m. The specific times are shown in Table 2. This study was based on the method of combining mobile monitoring and fixed monitoring [13]. Figure 1 shows the location of fixed detection and the route of mobile monitoring. The length of the mobile monitoring route is about 10.54 km, which takes about 2 h and 20 min. The Garmin eTrex 201 was used to record the flight track. The monitoring personnel carried the monitoring instrument and walked along the prescribed route at a constant speed (Figure 2). The measuring height of the monitoring instrument was about 1.5 m above the ground. Data on temperature, humidity, wind speed, heat index and wet-bulb globe temperature were mainly obtained, and the data were recorded every 5 s on the hour. Before each monitoring, the instrument was calibrated and preheated.
2.3. Data Correction
The optimized noise reduction algorithm (ONA) developed by the EPA was used to correct the mobile measurement data to reduce the error. The fixed monitoring point located next to Chaoyang Pavilion recorded data every 5 s and used the fixed monitoring data to establish correction factors according to relevant studies. This correction factor is specific to each day, as shown below. All measured values are multiplied by the correction factor [22].
2.4. Index Selection
The thermal comfort index is an index to evaluate the thermal environment. Although the thermal comfort index is used to evaluate the thermal environment, it is ultimately related to the impact on residents [12]. The wet-bulb globe temperature (WBGT) and thermal index (HI) are both used to evaluate the degree of heat stress in outdoor environments [23].
Wet-bulb globe temperature (WBGT) is an international standard heat index used by health, industry, sports and climate departments to assess thermal comfort during extreme high temperatures. It is the most widely used heat stress index today [14] and is also considered to be the most suitable index for evaluating outdoor thermal comfort in hot and arid areas [24]. The formula is as follows:
While WBGT performed best for minimal activities of daily living and light walking, the HI was equally accurate in predicting compensatory heat stress under MinAct conditions. The HI is significantly correlated with subjects’ perception of temperature and humidity, as well as their body core temperature, linking the perception of the surrounding environment to physiological responses under MinAct conditions [15], and is also suitable for assessing the thermal comfort of a particular building or a particular area [25]. The heat index is calculated as follows:
3. Results
3.1. Thermal Comfort Time Variation Characteristics
3.1.1. Diurnal Variation Characteristics
The 5-day variation characteristics of temperature and humidity, heat index and wet-bulb globe temperature were obtained by averaging the monitoring data. Air temperature and relative humidity are the two main factors of thermal environment comfort, and have a crucial impact on the urban environmental quality of human settlements [26]. It can be seen from Figure 3a that the change characteristics of thermal comfort are consistent with the change in thermal index and temperature curve, and it can be inferred that the main factor affecting the thermal index is temperature. The curve of wet-bulb globe temperature and humidity is roughly symmetrical along a straight line. For example, on 4 July, the humidity is the lowest, but the wet-bulb globe temperature reaches a peak. Therefore, it can be inferred that humidity has a greater influence on the wet-bulb globe temperature and has a better cooling effect. However, thermal comfort is not the result of a single factor, so it is further discussed in a following article.
Daily monitoring data were averaged by morning and evening, and the intraday variation in wet-bulb globe temperature and heat index is shown in Figure 3b. It was found that during the monitoring period, the heat index was generally higher than the wet-bulb globe temperature. On the whole, the average value of the heat index was 21.8 °C in the morning and 27.6 °C in the afternoon, which was about 1.26 times that of the morning. The average highest wet-bulb globe temperature that appeared in the afternoon of 3 July was 22.1 °C, and the minimum value that appeared in the morning of 3 July was 16.0 °C. On the whole, the average value in the morning was 18.0 °C, the average value in the afternoon was 21.5 °C, and the perceived temperature in the afternoon was about 1.19 times that in the morning. It can be seen that the thermal comfort in the park during the morning in summer is better than that in the afternoon, and it is more suitable for nearby residents for activities in the park.
3.1.2. Minute Change Analysis
Summer vegetation plays an important role in reducing WBGT [27]. By averaging the monitoring data in the morning and evening within 5 days, the continuous minute change curve of the thermal comfort level in the morning and afternoon in the park is obtained, as shown in Figure 4a. The monitoring period between 8:30 a.m. and 9:43 a.m. in the park is characterized by high humidity and low temperature. From 9:43 to 10:50, the road and residential areas outside the park were monitored: the humidity decreased significantly and the temperature increased. On the whole, the thermal comfort in the morning showed a relatively stable increase and decrease with the change in time. The highest heat index value appeared at 10:30, 25.5 °C, and the highest wet-bulb globe temperature appeared at 10:33, 20.5 °C. In the afternoon, the monitoring period of internal movement in the park is 15:00–16:12, and the end time of external monitoring is 17:20. In the afternoon, the humidity inside the park was high, but it did not have much of a good cooling effect. The temperature and thermal comfort level were relatively stable and did not fluctuate significantly over time. The highest heat index value appeared at 15:00 (30.9 °C), and the highest wet-bulb globe temperature appeared at 15:02 (23.6 °C).
The canopy sky visibility factor (SVF) was used to estimate the effect of vegetation on local air circulation and outdoor thermal comfort [7,28]. The SVF was measured using a fisheye lens 1.5 m above the ground and PS to calculate the pixel ratio, and the average value was 0.653. Representative fisheye photos in the process of movement monitoring were selected in chronological order [29] (8:38, 8:52, 9:10 and 9:34 in four parks and 9:59 in a residential area) and are marked and displayed on the map in Figure 4b. Low SVF will affect ventilation and airflow [30], resulting in a more obvious accumulation of humidity in local areas. Vegetation cover shown by the sky visual factor can well explain the reason for the difference in humidity inside and outside the park. Therefore, when the perceived temperature is higher in the afternoon, outdoor exercise is not recommended, and you can walk or sit quietly.
3.2. Characteristics of Thermal Comfort Space Change
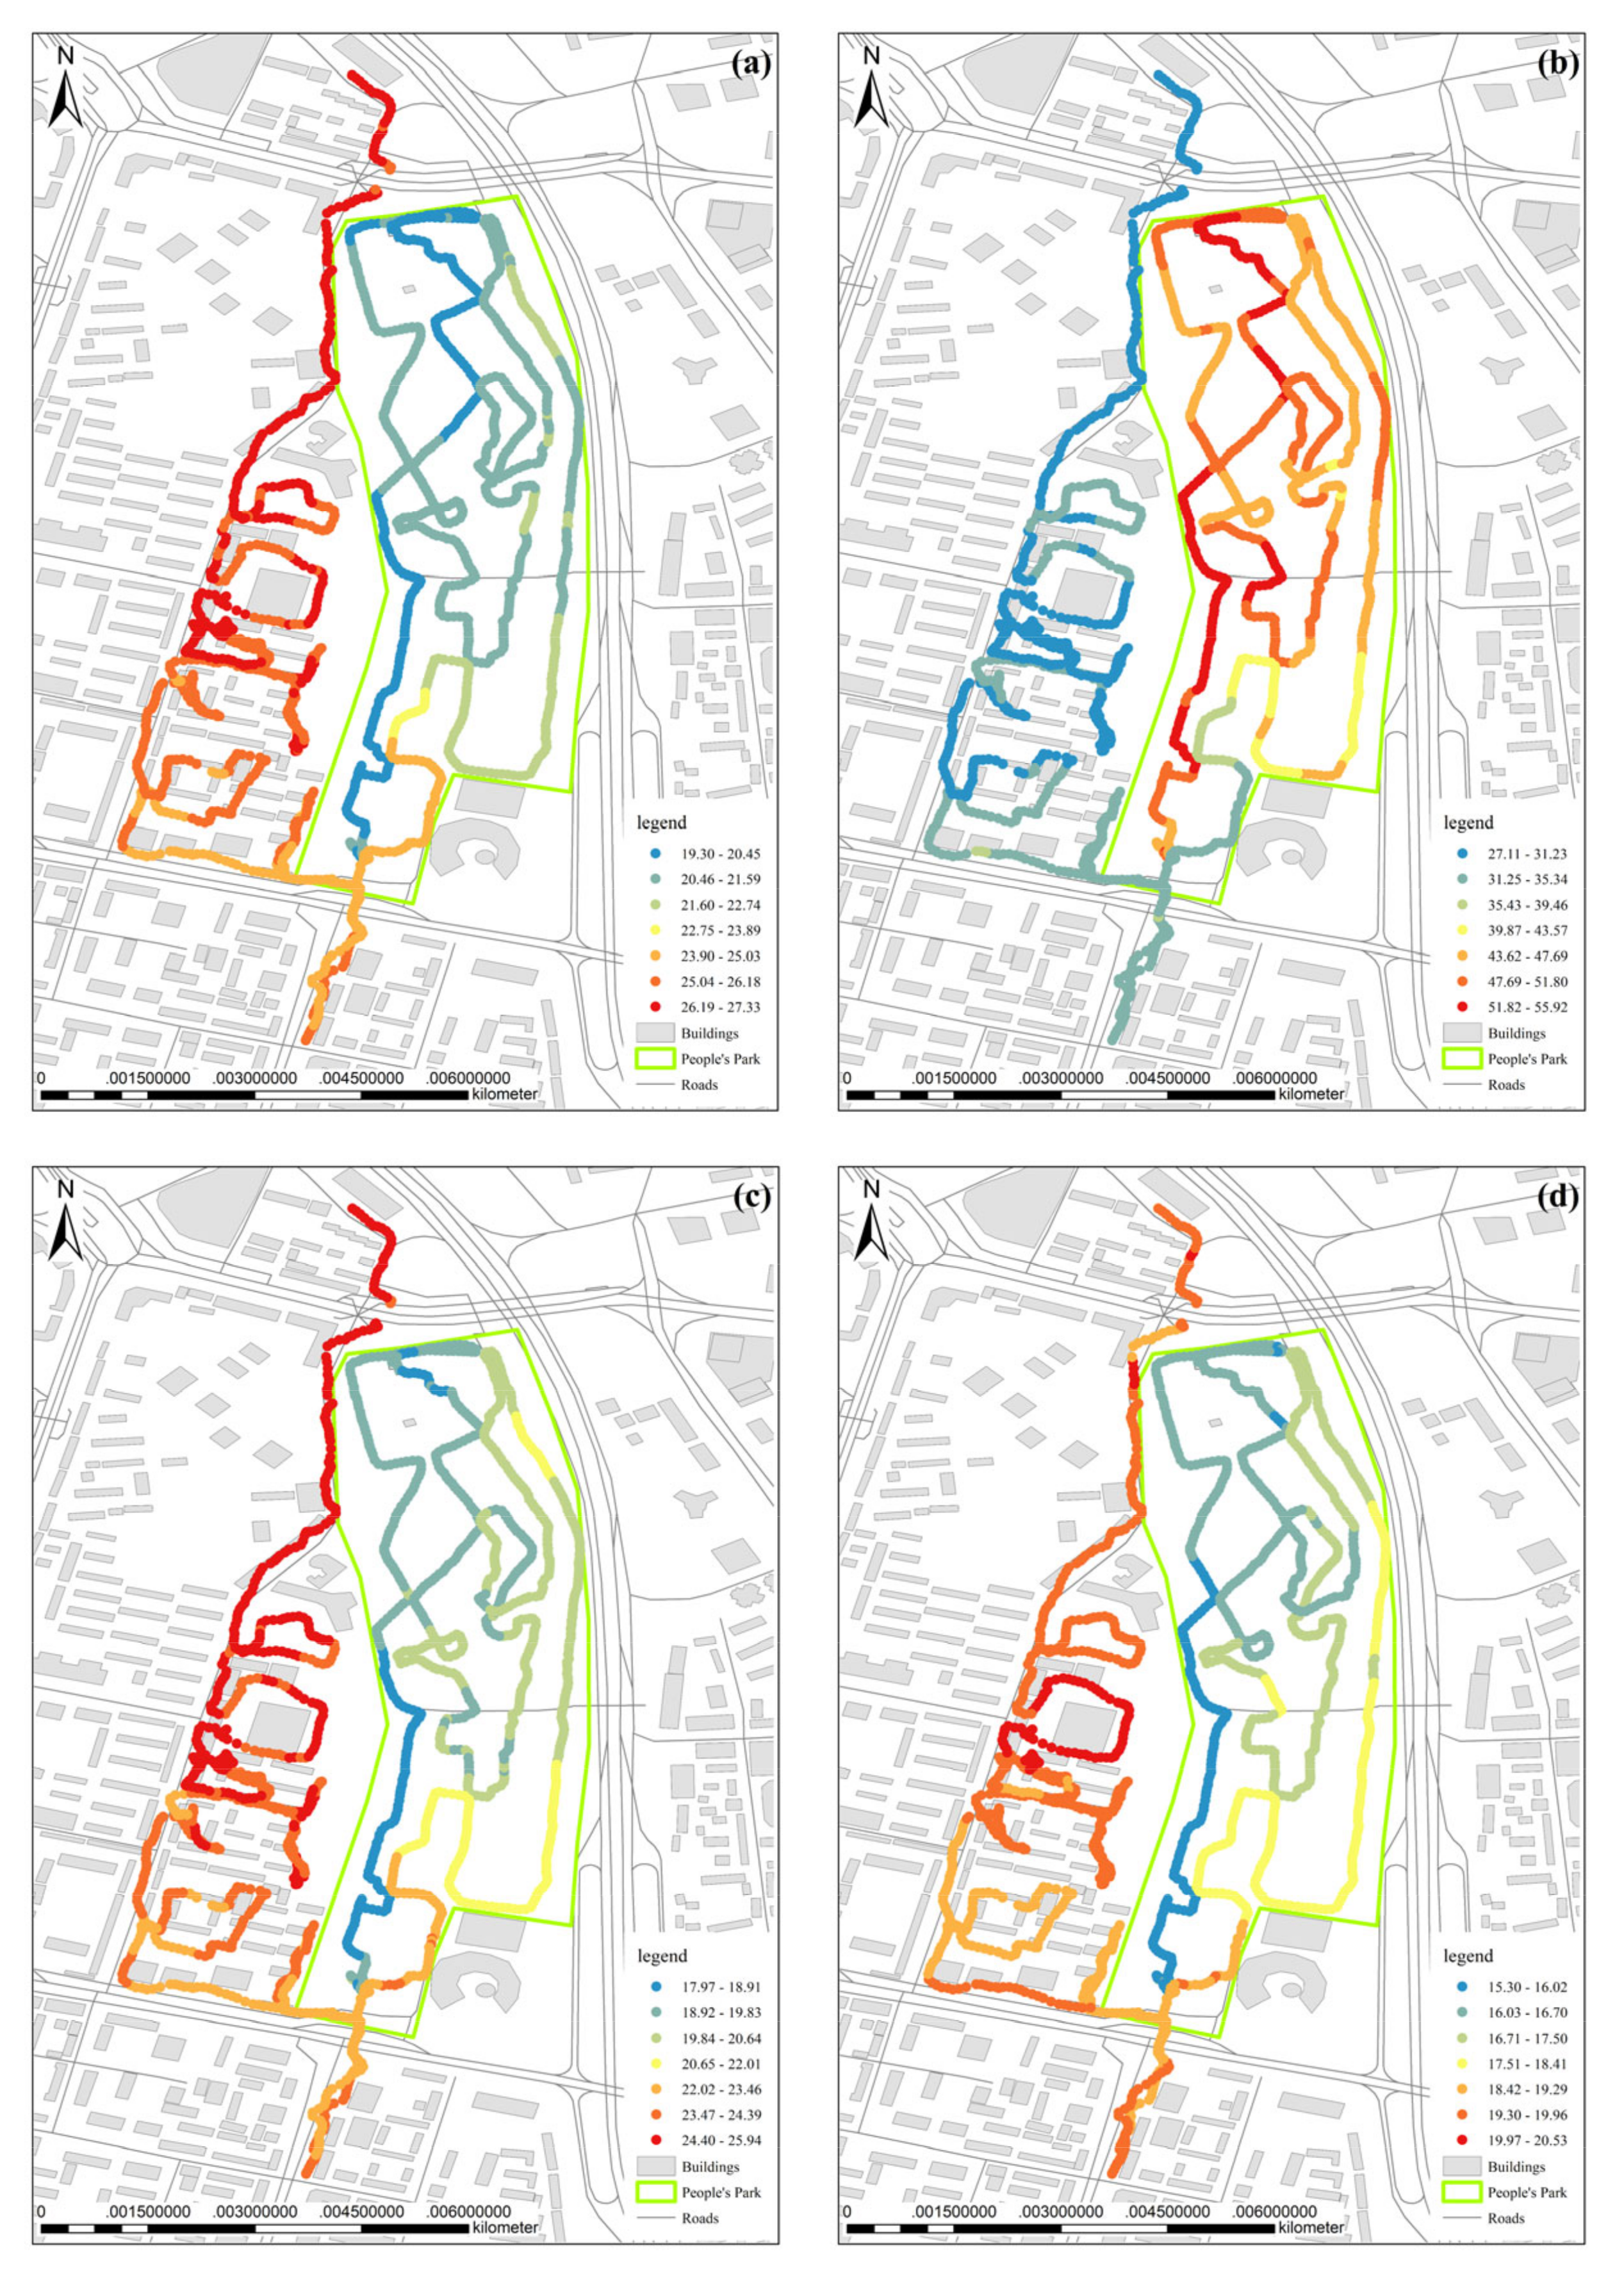
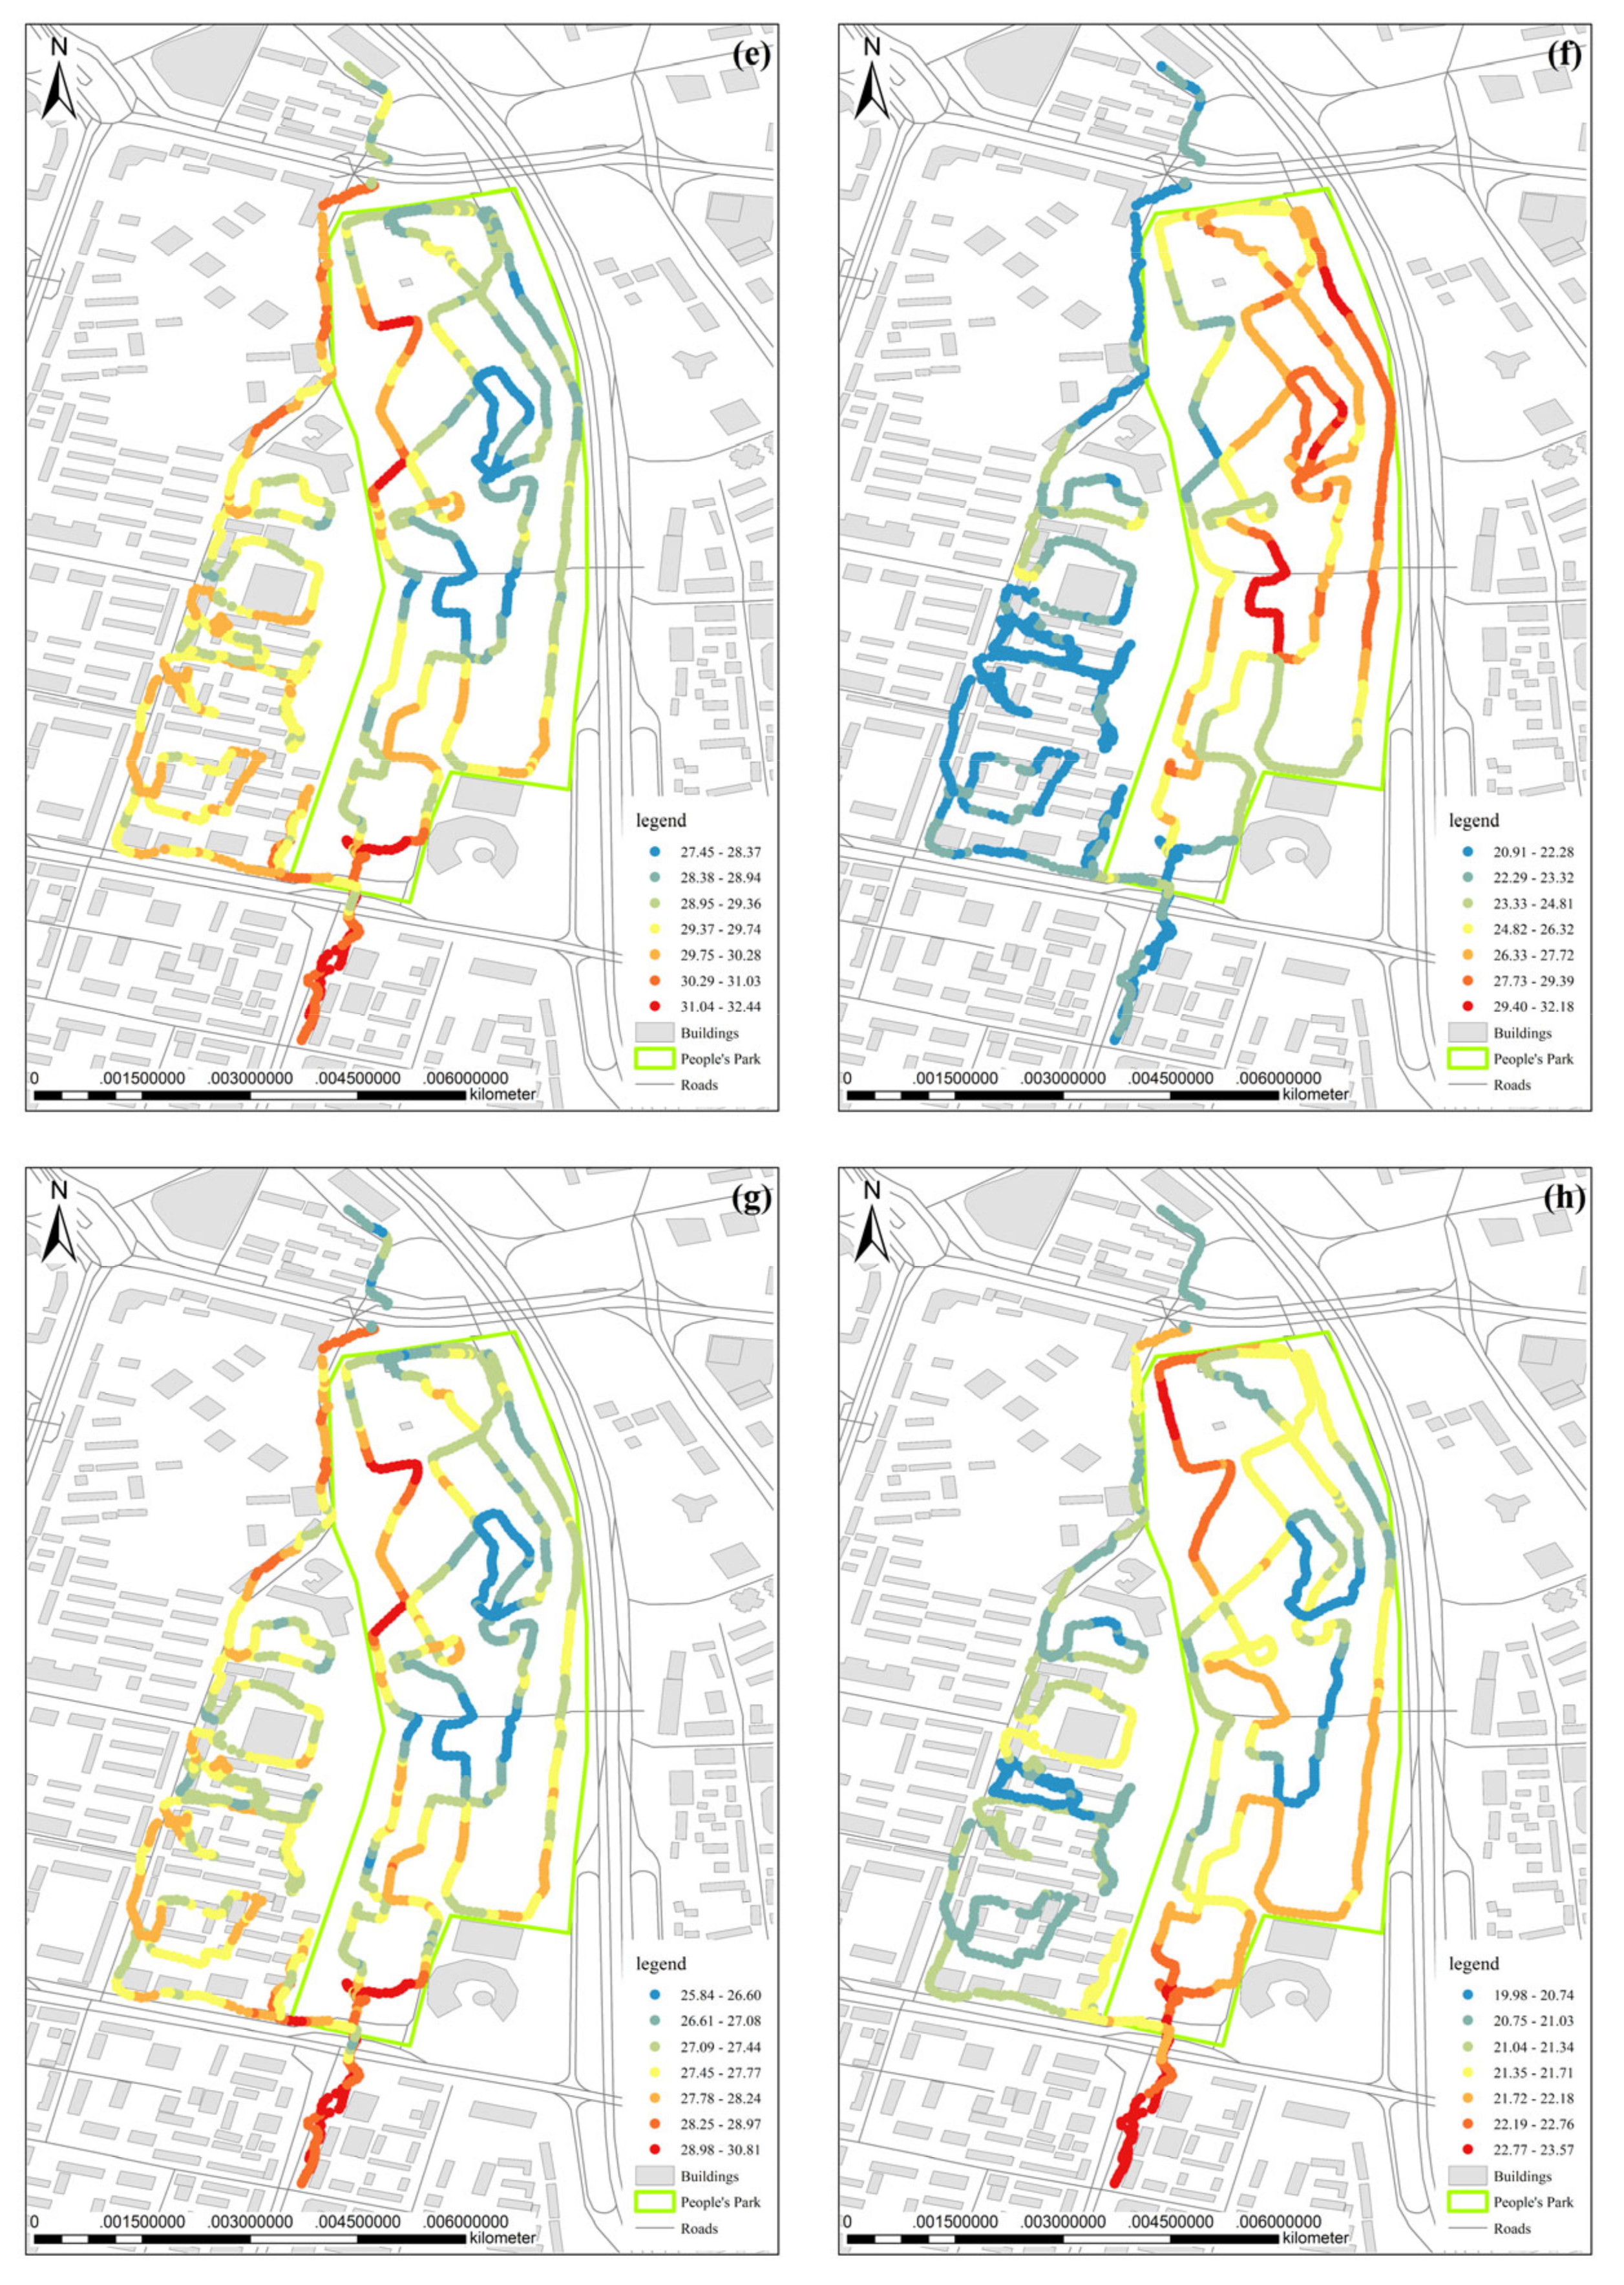
Spatial analysis of ArcGIS was used to interpolate the monitoring data within 5 days, and the distribution maps of temperature, humidity, heat index and wet-bulb globe temperature in People’s Park and its vicinity were obtained (Figure 5). On the whole, the distribution of temperature, heat index and wet-bulb globe temperature is generally the same, but the spatial distribution of humidity is opposite, showing high humidity inside the park, low perceived temperature and relatively cool, and low humidity near the park, high perceived temperature and relatively hot. The main reasons may be (1) high vegetation coverage and high humidity in the park [31] and (2) there are mostly cement roads outside the park, and the spacing between street trees is large [32]. Specifically, the areas with high thermal comfort are concentrated in the areas with dense vegetation inside the park or shaded by trees and high humidity near the artificial lake. The thermal comfort of the road away from the park is low, especially on Hotan Street and Binnan Road, where the heat index and wet-bulb globe temperature are higher. Therefore, it is suggested that the residents’ activities should be concentrated near the artificial lake and in areas with dense vegetation coverage, and to avoid the areas with low thermal comfort, e.g., Hotan Street and Binnan Road.
3.3. Analysis of Influencing Factors of Thermal Comfort
3.3.1. Correlation Analysis
Correlation between Heat Index and Wet-Bulb Globe Temperature
In parks, the heat index and wet-bulb globe temperature are important evaluation bases for thermal comfort [24,25]. Due to the unstable nature of the park environment, the correlation between the heat index and wet-bulb globe temperature was discussed using average rather than instantaneous data as far as possible [33]. IBM SPSS Statistics 27 was used for statistical analysis, and the tests found that the data were in line with normal distribution, so Pearson’s bivariate correlation analysis was used. From the analysis, it can be seen that the heat index from mobile monitoring and fixed-point monitoring is significantly positively correlated with the wet-bulb globe temperature, and the correlation coefficients are 0.994 and 0.978, respectively, indicating that the two are highly correlated, and the evaluation reliability of these two indexes on thermal comfort is high.
Correlation of Thermal Comfort Test Data
In the mobile monitoring period, the real-time data in the study area were monitored synchronously and taken as the background value of the study area. The correlation analysis was made between the mobile monitoring data and the background data, and it was found that both the heat index and the wet-bulb globe temperature of the mobile monitoring showed a very significant correlation with the background values (Table 3). The microclimate environment in the park was similar to that in the background environment, indicating that the mobile monitoring instrument used in the experiment had high accuracy and the experimental data were authentic and credible. Secondly, there is a close correlation between the park microclimate and the background climate, but there are still some differences between the measured values. The reason may be that the park itself has a certain cooling effect, and the vegetation coverage, water distribution and underlying surface characteristics in the park are all factors causing the differences between the park and the background climate.
Correlation Analysis between Thermal Comfort and Meteorological Factors
The characteristics of summer thermal comfort in the park are largely affected by meteorological factors. The meteorological data on temperature, humidity and wind speed obtained synchronously by Kestrel 5500 and Kestrel 5400 were used to conduct bivariate correlation analyses with the monitored heat index and wet-bulb globe temperature, respectively. It was found that the data did not conform to the normal distribution after a comprehensive test with graphic and descriptive methods, so Spearman’s correlation was used for correlation analysis.
As can be seen in Table 4, in the process of mobile monitoring, temperature and heat index showed a significant positive correlation at the 0.01 level (double-tailed). Temperature showed a significant positive correlation with wet-bulb globe temperature and heat index at 0.01 level (double-tailed). In addition to the two periods of “10:30-end” and “17:00-end”, the temperature and the wet-bulb globe temperature are not correlated. At this time, the detection instrument passed through North Park Street and South Youyou Road to Binnan Road, and may have encountered interference from traffic, pedestrian flow and other factors. There was a significant negative correlation between relative humidity and heat index and wet bulb globe temperature at the level of 0.01 (double-tailed), except that there was no correlation between humidity and wet-bulb globe temperature during the period of “17:00-end”. In general, in the process of mobile monitoring, temperature and humidity are important parameters that affect thermal comfort.
In the fixed-point detection process, temperature and heat index and wet-bulb globe temperature were significantly positively correlated at the level of 0.01 (double-tailed), except for the period of “16:00–17:00”, when heat index and temperature were not correlated. Relative humidity in the “8:30–10:30” period, “15:00–16:00” period and “17:00-end” period was significantly correlated with the heat index at the 0.01 level (double-tailed) and was negatively correlated with the heat index at the 0.05 level (double-tailed). No correlation was found during the “10:30-end” period; There was a significant positive correlation between relative humidity and wet-bulb globe temperature at the 0.01 level (two-tailed), except that the relative humidity did not correlate with wet-bulb globe temperature during the “17:00-end” period. Wind speed and thermal comfort in the “8:30–9:30” and “10:30-end” periods at the 0.01 level (double-tailed) significantly correlated negatively. The heat index was significantly negatively correlated at the 0.01 level (double-tailed) during the period of 15:00–17:00, and the wet-bulb globe temperature showed a significant positive correlation at the 0.01 level (double-tailed) during the periods of 9:30–10:30 and 15:00–17:00. Considering that trees in the park have a blocking effect on wind [13], the ventilation effect in the park is poor.
In summary, WBGT and HI showed a significant positive correlation under both mobile and fixed-point monitoring methods. Thermal comfort is significantly correlated with temperature and humidity, positively correlated with temperature, and negatively correlated with humidity. Temperature and humidity are important parameters affecting thermal comfort. The weak correlation between thermal comfort and wind speed indicates that the park has poor ventilation [13,34].
3.3.2. Multiple Linear Regression Analysis
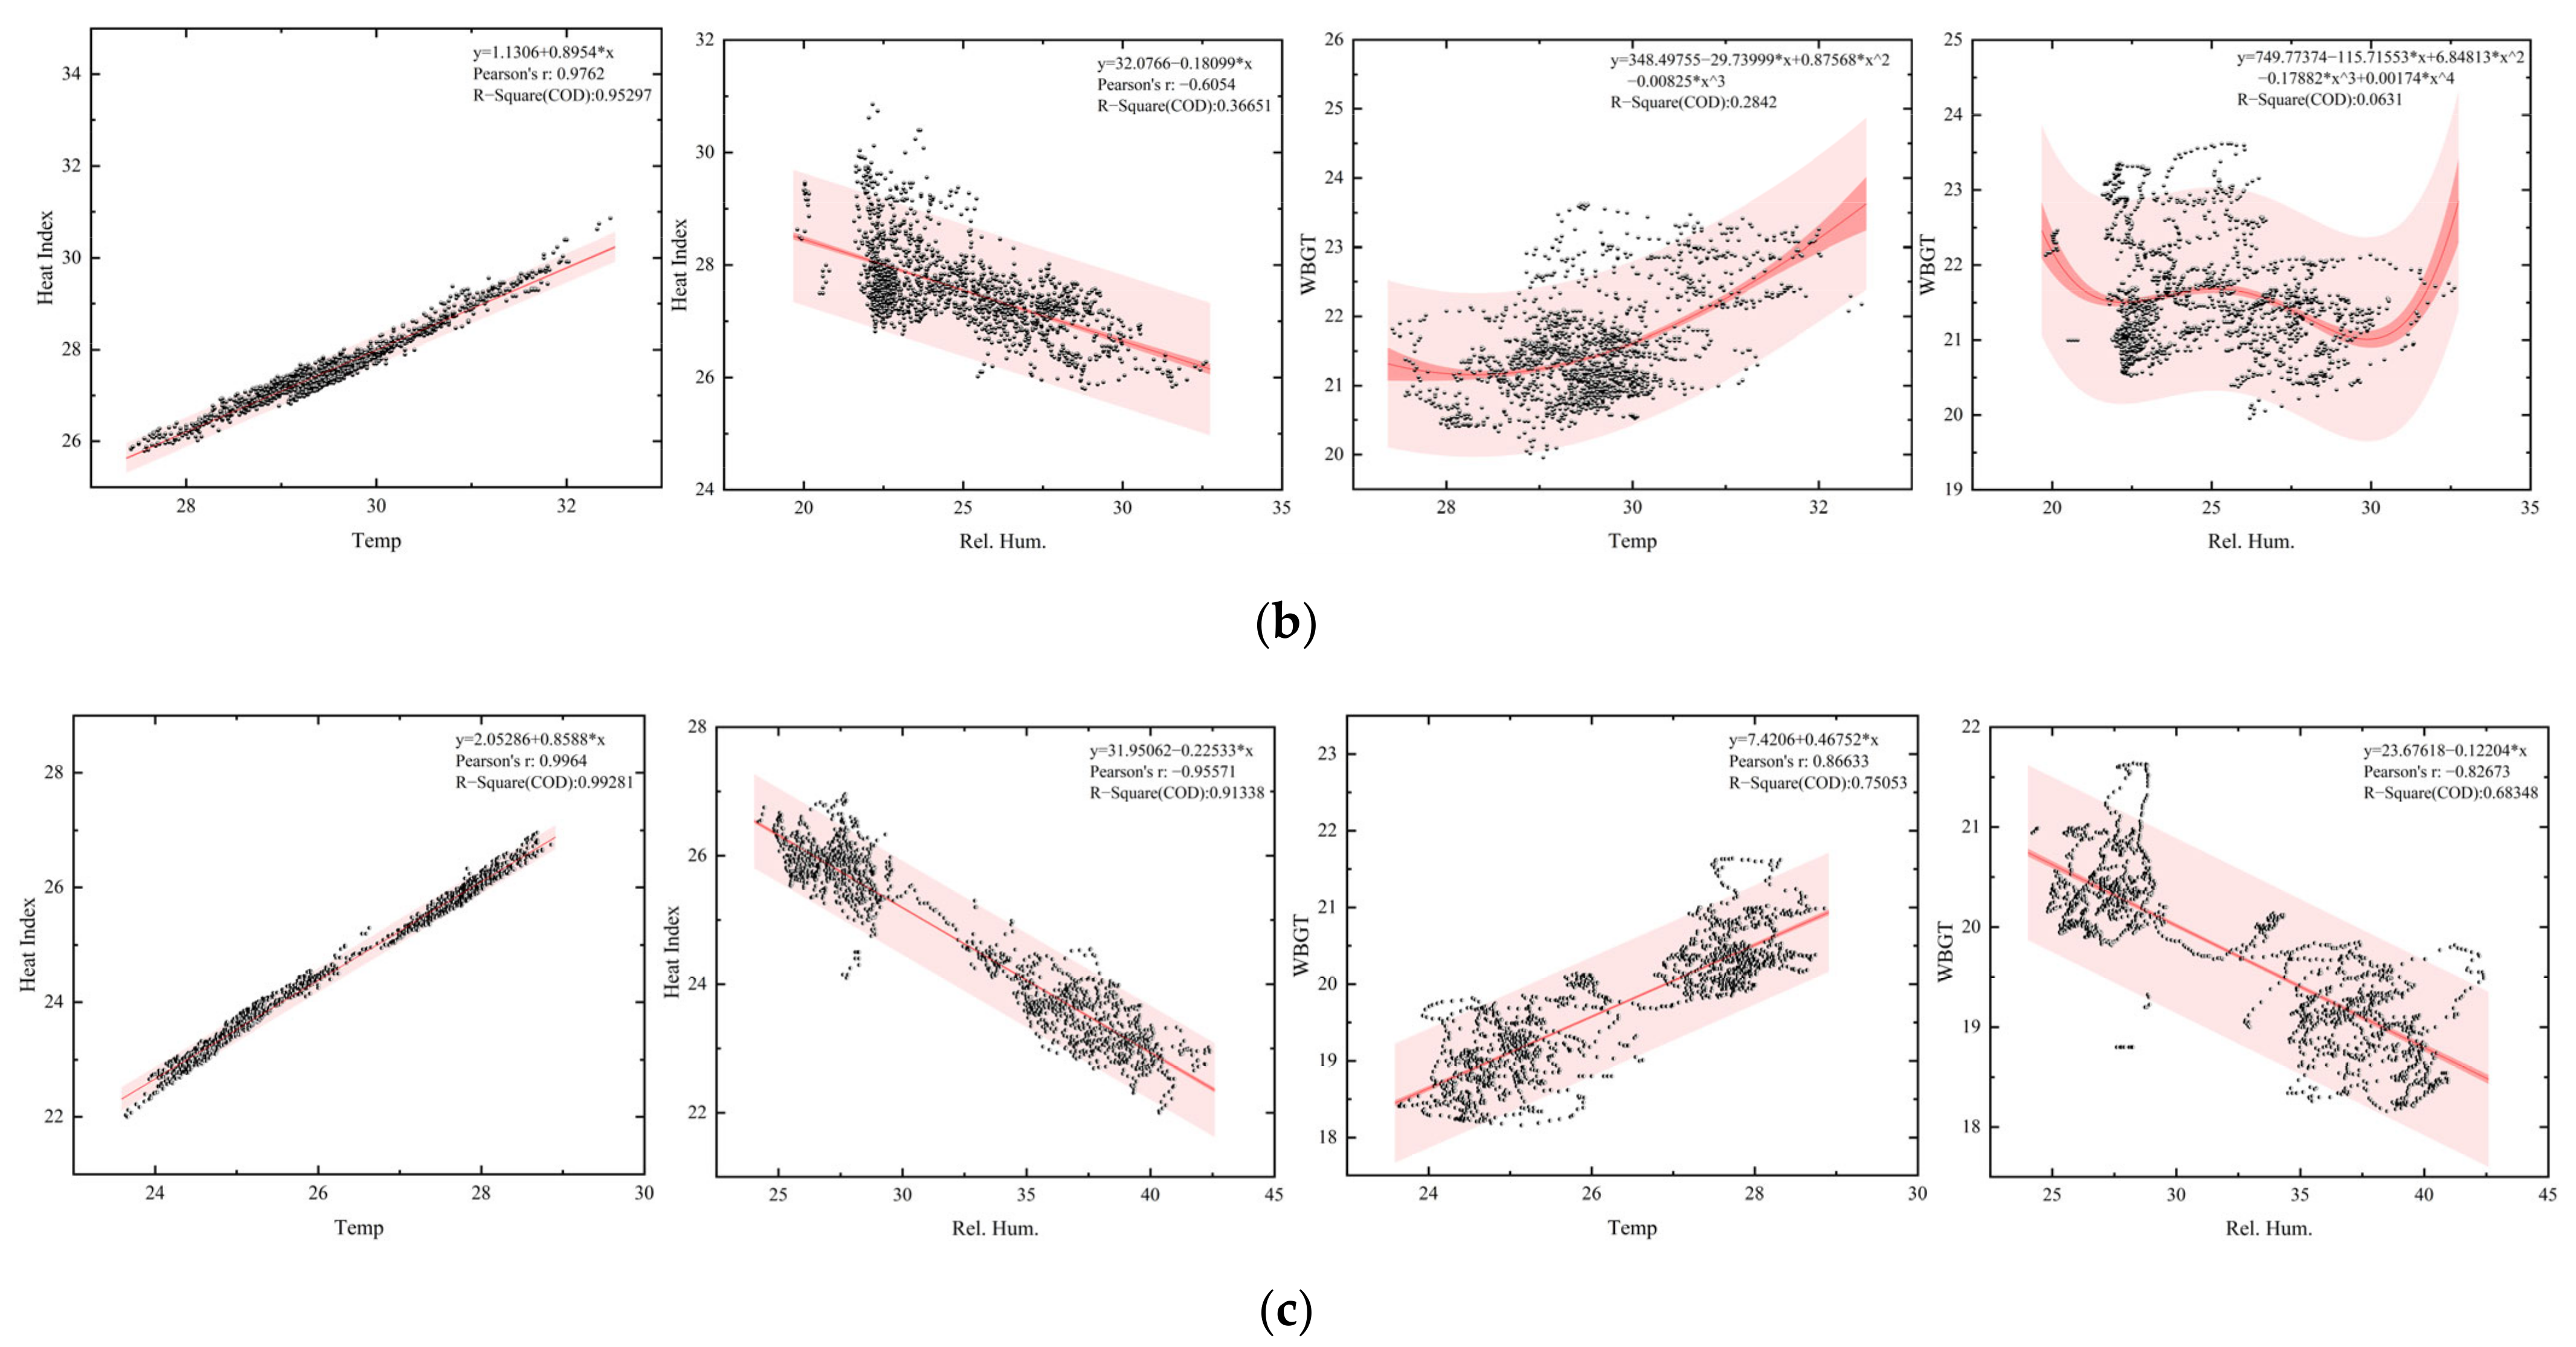
Through the analysis of mobile monitoring data, it can be seen that temperature and humidity may affect thermal comfort. Therefore, heat index and wet-bulb globe temperature were set as Y variables, temperature and humidity as X variables, and a 95% confidence interval was set. The fitting curve obtained is shown in Figure 6.
Figure 6a shows the influence of temperature and humidity on HI and WBGT in the morning, Figure 6b in the afternoon, and Figure 6c for the whole day.
As can be seen from the figure, the degree of influence of meteorological factors on thermal comfort is that temperature is greater than humidity, especially in the afternoon, when the cooling effect of humidity is relatively weak.
4. Discussion
4.1. Temporal and Spatial Characteristics of Thermal Comfort and Its Influencing Factors
The above analysis shows that the park has a certain cooling effect in summer and can significantly improve urban thermal comfort. However, through many field investigations, it is found that the crowd gathering point is not in a space with high thermal comfort, but in the open space under the shade or inside the artificial landscape building [5,35], because outdoor sports space, facilities and other factors have a significant impact on outdoor sports activities [36]. The space with high thermal comfort is dense with vegetation and lacks infrastructure construction. It does not have the conditions for crowds to gather.
Under the two monitoring methods of moving and fixed point, the two evaluation indexes of thermal comfort showed a significant positive correlation. The heat index and wet-bulb globe temperature were significantly correlated with temperature and humidity, positively correlated with temperature, and negatively correlated with humidity. Wind speed had little influence on thermal comfort. Regression analysis also showed that temperature is the primary factor affecting thermal comfort, followed by humidity. The results of the influence of temperature and humidity on thermal comfort are similar to those of Huang and Jie [37], while the results of wind speed on thermal comfort are somewhat different from those of Hsieh et al. [13]. Judging from this, the park ventilation effect is poor. These findings have wide-ranging implications and consequences in areas such as public health, urban planning, ecosystems and land management. These studies help to provide a more comfortable park environment, maintain biodiversity, improve land use and protect urban ecosystems.
Shade and shading structures in parks can effectively reduce the temperature and exposure to direct sunlight, providing a cooler environment for visitors. This can be achieved by planting trees and erecting pavilions and awnings. Adding green areas to parks and bodies of water, such as lawns and fountains, can help lower temperatures and provide a natural sense of wetness. Vegetation can absorb sunlight, reduce surface temperatures, and provide a comfortable atmosphere. Properly planned ventilation and ventilation systems in parks can help air flow and improve air quality and thermal comfort. For example, natural wind direction is taken into account in the design of roads and paths, as well as ventilation holes and open spaces. Shade and comfortable seating in the park can provide visitors with a place to rest and relax. These seats can be designed to be well ventilated to reduce discomfort for visitors in high temperatures. Information signs or mobile apps for the park could be set up to provide current temperature, humidity and wind speed information, as well as give advice to visitors on how to stay comfortable in different weather conditions. Such information can help visitors make proper preparations to better enjoy the park. In the design of parks, the needs of special groups such as the elderly, children and the disabled should also be taken into account, so as to provide them with special facilities and environments tailored to their needs to ensure their comfort in the park.
These recommendations can help park managers improve the thermal comfort of parks based on research insights and provide a better visitor experience, while focusing on environmental sustainability and ecosystem protection.
4.2. Limitations of the Study
Satisfactory results have been obtained, but there are some limitations. First, the measurement period was in the hottest months, but the monitoring time was only 5 days, and the next step is to plan a longer monitoring period; Secondly, vegetation types in landscape space were not considered, and the influence of different plant species on the thermal environment was inconsistent. According to the limitations of the present study, the potential field for future research and exploration is to explore the influence of vegetation combinations in different seasons on thermal comfort according to local conditions.
5. Conclusions
By selecting a typical green park in Urumqi, an oasis city in an arid region, fixed-point monitoring and continuous mobile monitoring were conducted in the morning and evening to analyze the spatial and temporal distribution characteristics of thermal comfort in the park, and the following conclusions were drawn.
(1) In general, warming in the morning in the park is slow, and the thermal comfort in the park is higher than that in nearby areas. In the afternoon, the temperature is more stable, and the thermal comfort inside the park is not obvious compared with the nearby area, but it is better than Hotan Road and Binnan Road. Therefore, it is recommended that nearby residents exercise outdoors as much as possible in the morning, and in the park. In the afternoon, keep to the park and its vicinity, sit quietly or walk slowly as much as possible, avoiding the less comfortable areas, such as Wada Road and Binhonam Road.
(2) At the same time, it is suggested that the park improve the infrastructure of relevant areas, especially the space with high thermal comfort, so that people in the park can better enjoy the comfortable environment, improving the satisfaction and happiness of the park population. Psychological behavior has also been proven to be an important parameter affecting thermal sensation.
(3) Through discussion, it is found that the two evaluation indexes of thermal comfort show a significant positive correlation under the two methods of mobile monitoring and fixed-point detection. The heat index and wet-bulb globe temperature were significantly correlated with temperature and humidity, positively correlated with temperature, and negatively correlated with humidity, similar to the findings of related studies. Wind speed has a weak effect on improving the thermal comfort of the park, but it has been observed that wind speed and shading are the two main variables that influence the human comfort index [14]. Combined with the results of regression analysis, it is suggested that the park and its vicinity should appropriately increase trees and pools for cooling down and humidification to improve the thermal comfort of the park. Ventilation corridors through urban parks can promote shade and ventilation and improve thermal comfort, so the layout and pruning of plants should be considered in the design, not only taking into account shade and ventilation but also the prevailing local wind direction and season.
Author Contributions
Conceptualization, Y.L. and X.C.; methodology, Y.L., J.F. and S.X.; software, Y.L., J.F. and S.X.; validation, Y.L. and X.C.; formal analysis, Y.L.; data curation, Y.L.; writing—original draft preparation, Y.L.; writing—review and editing, Y.L.; visualization, Y.L.; supervision, X.C.; funding acquisition, X.C. All authors have read and agreed to the published version of the manuscript.
Funding
The research was sponsored by the Natural Science Foundation of Xinjiang Uygur Autonomous Region (2022D01A212).
Institutional Review Board Statement
Not applicable.
Informed Consent Statement
Not applicable.
Data Availability Statement
The original contributions presented in the study are included in the article, further inquiries can be directed to the corresponding author.
Conflicts of Interest
The authors declare no conflicts of interest.
References
- Seto, K.C.; Fragkias, M. Quantifying spatiotemporal patterns of urban land-use change in four cities of China with time series landscape metrics. Landsc. Ecol. 2005, 20, 871–888. [Google Scholar] [CrossRef]
- Algretawee, H. The effect of graduated urban park size on park cooling island and distance relative to land surface temperature (LST). Urban Clim. 2022, 45, 101255. [Google Scholar] [CrossRef]
- Elnabawi, M.H.; Hamza, N. Behavioural Perspectives of Outdoor Thermal Comfort in Urban Areas: A Critical Review. Atmosphere 2020, 11, 51. [Google Scholar] [CrossRef]
- Wei, D.; Yang, L.C.; Bao, Z.K.; Lu, Y.; Yang, H.T. Variations in outdoor thermal comfort in an urban park in the hot-summer and cold-winter region of China. Sustain. Cities Soc. 2022, 77, 103535. [Google Scholar] [CrossRef]
- Zhang, L.L.L.; Wei, D.; Hou, Y.Y.; Du, J.F.; Liu, Z.; Zhang, G.M.; Shi, L. Outdoor Thermal Comfort of Urban Park-A Case Study. Sustainability 2020, 12, 1961. [Google Scholar] [CrossRef]
- Knez, I.; Thorsson, S. Themal, emotional and perceptual evaluations of a park: Cross-cultural and environmental attitude comparisons. Build. Environ. 2008, 43, 1483–1490. [Google Scholar] [CrossRef]
- Mahmoud, A.H.A. Analysis of the microclimate and human comfort conditions in an urban park in hot and arid regions. Build. Environ. 2011, 46, 2641–2656. [Google Scholar] [CrossRef]
- Amani-Beni, M.; Zhang, B.; Xie, G.D.; Xu, J. Impact of urban park’s tree, grass and waterbody on microclimate in hot summer days: A case study of Olympic Park in Beijing, China. Urban For. Urban Green. 2018, 32, 1–6. [Google Scholar] [CrossRef]
- Zhang, H.C.; Guo, F.; Liu, K.T.; Wang, J.; Dong, J.; Zhu, P.S. Spatial differences in thermal comfort in summer in coastal areas: A study on Dalian, China. Front. Public Health 2022, 10, 1024757. [Google Scholar] [CrossRef]
- Rui, L.Y.; Buccolieri, R.; Gao, Z.; Gatto, E.; Ding, W.W. Study of the effect of green quantity and structure on thermal comfort and air quality in an urban-like residential district by ENVI-met modelling. Build. Simul. 2019, 12, 183–194. [Google Scholar] [CrossRef]
- Wang, Y.F.; Ni, Z.B.; Chen, S.Q.; Xia, B.C. Microclimate regulation and energy saving potential from different urban green infrastructures in a subtropical city. J. Clean. Prod. 2019, 226, 913–927. [Google Scholar] [CrossRef]
- Kumar, P.; Sharma, A. Study on importance, procedure, and scope of outdoor thermal comfort–A review. Sustain. Cities Soc. 2020, 61, 102297. [Google Scholar] [CrossRef]
- Hsieh, C.M.; Jan, F.C.; Zhang, L. A simplified assessment of how tree allocation, wind environment, and shading affect human comfort. Urban For. Urban Green. 2016, 18, 126–137. [Google Scholar] [CrossRef]
- Ren, J.L.; Shi, K.Z.; Li, Z.; Kong, X.F.; Zhou, H.Z. A Review on the Impacts of Urban Heat Islands on Outdoor Thermal Comfort. Build. 2023, 13, 1368. [Google Scholar] [CrossRef]
- Vecellio, D.J.; Wolf, S.T.; Cottle, R.M.; Kenney, W.L. Utility of the Heat Index in defining the upper limits of thermal balance during light physical activity (PSU HEAT Project). Int. J. Biometeorol. 2022, 66, 1759–1769. [Google Scholar] [CrossRef]
- Charai, M.; Mezrhab, A.; Moga, L. A structural wall incorporating biosourced earth for summer thermal comfort improvement: Hygrothermal characterization and building simulation using calibrated PMV-PPD model. Build. Environ. 2022, 212, 108842. [Google Scholar] [CrossRef]
- Rui, J.; Gui, L.; Liu, W.; Wan, Y.; Ran, J.; Zeng, Y. Characteristics and Trends of Thermal Comfort Research on Urban Green Infrastructure: Based on CiteSpace Knowledge Graph Analysis. Econ. Geogr. 2023, 43, 84–92. [Google Scholar]
- Kasmu, A.; Aimaiti, Y. Research on Green Landscape Pattern of Urumqi City Based on ALOS Data. Reg. Res. Dev. 2012, 31, 86–89. [Google Scholar]
- Zhou, J.; Yan, C.; Guo, R.; Yan, Z. A study on the configuration model of plant communities in protective green spaces in arid gravel desert areas. Res. Arid. Areas 2021, 38, 812–820. [Google Scholar]
- Liu, T.; Yang, D.; Zhang, Y.; Cai, T. The spatiotemporal changes and influencing factors of accessibility of urban parks and green spaces: A case study of Urumqi. J. Univ. Chin. Acad. Sci. 2021, 38, 350–359. [Google Scholar]
- Pan, Y.; Liqun, P.; Ce, W. Research on the Strategy of Aging Adaptation and Renovation of Old Parks in Severe Cold Regions: Taking Urumqi People’s Park as an Example. Green Technol. 2022, 24, 59–62. [Google Scholar]
- Minet, L.; Liu, R.; Valois, M.-F.; Xu, J.; Weichentha, S.; Atzopoulou, M. Development and comparison of air pollution exposure surfaces derived from n-road mobile monitoring and short-term stationary sidewalk measurements. Environ. Sci. Technol. 2018, 52, 3512–3519. [Google Scholar] [CrossRef] [PubMed]
- Ghalhari, G.F.; Dehghan, S.F.; Shakeri, F.; Ghanadzadeh, M.J.; Asghari, M. Assessing the monthly changes of heat stress indices in outdoor environment during a 15-year period: Case of study in a dry and warm climate. Urban Clim. 2020, 31, 100538. [Google Scholar] [CrossRef]
- Ghani, S.; Mahgoub, A.O.; Bakochristou, F.; ElBialy, E.A. Assessment of thermal comfort indices in an open air-conditioned stadium in hot and arid environment. J. Build. Eng. 2021, 40, 102378. [Google Scholar] [CrossRef]
- Saikia, D.; Sarma, U.; Boruah, P.K. Development of an Online Heat Index Measurement System for Thermal Comfort Determination. Mapan J. Metrol. Soc. India 2014, 29, 67–72. [Google Scholar] [CrossRef]
- Kuang, W.H. Seasonal Variation in Air Temperature and Relative Humidity on Building Areas and in Green Spaces in Beijing, China. Chin. Geogr. Sci. 2020, 30, 75–88. [Google Scholar] [CrossRef]
- Feitosa, R.C.; Wilkinson, S.J. Small-scale experiments of seasonal heat stress attenuation through a combination of green roof and green walls. J. Clean. Prod. 2020, 250, 119443. [Google Scholar] [CrossRef]
- He, X.D.; Miao, S.G.; Shen, S.H.; Chen, X.J.; Zhang, B.Z.; Zhang, Z.Y.; Chen, X.J. Influence of sky view factor on outdoor thermal environment and physiological equivalent temperature. Int. J. Biometeorol. 2015, 59, 285–297. [Google Scholar] [CrossRef]
- Chafer, M.; Tan, C.L.; Cureau, R.J.; Hien, W.N.; Pisello, A.L.; Cabeza, L.F. Mobile measurements of microclimatic variables through the central area of Singapore: An analysis from the pedestrian perspective. Sustain. Cities Soc. 2022, 83, 103986. [Google Scholar] [CrossRef]
- Zhang, J.; Gou, Z.H.; Lu, Y.; Lin, P.Y. The impact of sky view factor on thermal environments in urban parks in a subtropical coastal city of Australia. Urban For. Urban Green. 2019, 44, 126422. [Google Scholar] [CrossRef]
- Meili, N.; Acero, J.A.; Peleg, N.; Manoli, G.; Burlando, P.; Fatichi, S. Vegetation cover and plant-trait effects on outdoor thermal comfort in a tropical city. Build. Environ. 2021, 195, 107733. [Google Scholar] [CrossRef]
- Li, L.; Zou, Z.Q.; Zhou, T.T.; Zhou, X.Q.; Li, Q.L. Simulation and Analysis of Influencing Factors of Pavement Thermal Environments in Guangzhou. Sustainability 2022, 14, 7251. [Google Scholar] [CrossRef]
- Mughal, M.O.; Kubilay, A.; Fatichi, S.; Meili, N.; Carmeliet, J.; Edwards, P.; Burlando, P. Detailed investigation of vegetation effects on microclimate by means of computational fluid dynamics (CFD) in a tropical urban environment. Urban Clim. 2021, 39, 100939. [Google Scholar] [CrossRef]
- Müller, N.; Kuttler, W.; Barlag, A.B. Counteracting urban climate change: Adaptation measures and their effect on thermal comfort. Theor. Appl. Climatol. 2016, 115, 243–257. [Google Scholar] [CrossRef]
- Tsai, K.T.; Lin, Y.H. Identification of urban park activity intensity at different thermal environments and visible sky by using sound levels. Int. J. Biometeorol. 2018, 62, 1987–1994. [Google Scholar] [CrossRef] [PubMed]
- Ye, J.Y.; Lai, W.L.; Wu, Z.W. Study on Xiamen’s Spring and Winter Thermal Comfort of Outdoor Sports Space in the Residential Community. Buildings 2023, 13, 2369. [Google Scholar] [CrossRef]
- Huang, H.J.; Jie, P.Y. Research on the Characteristics of High-Temperature Heat Waves and Outdoor Thermal Comfort: A Typical Space in Chongqing Yuzhong District as an Example. Buildings 2022, 12, 625. [Google Scholar] [CrossRef]
Figure 1.
Horizontal section of the park and monitoring route.

Figure 2.
Field monitoring: (a) fixed-point measuring instrument; (b) mobile monitoring personnel and instruments; (c) Kestrel 5400 mobile monitoring instrument; (d) Garmin eTrex 201 mobile monitoring instrument.
Figure 2.
Field monitoring: (a) fixed-point measuring instrument; (b) mobile monitoring personnel and instruments; (c) Kestrel 5400 mobile monitoring instrument; (d) Garmin eTrex 201 mobile monitoring instrument.

Figure 3.
Thermal comfort diurnal variation characteristics: (a) 5-day change characteristics were monitored; (b) the change characteristics of morning and evening were monitored.
Figure 3.
Thermal comfort diurnal variation characteristics: (a) 5-day change characteristics were monitored; (b) the change characteristics of morning and evening were monitored.

Figure 4.
Thermal comfort varies by minute: (a) Diagram of temperature, humidity and thermal comfort changes in the morning and afternoon inside and outside the park; (b) Sampling point location diagram of SVF.
Figure 4.
Thermal comfort varies by minute: (a) Diagram of temperature, humidity and thermal comfort changes in the morning and afternoon inside and outside the park; (b) Sampling point location diagram of SVF.

Figure 5.
Spatial distribution of thermal comfort during monitoring period: (a) morning temperature; (b) morning relative humidity; (c) morning HI; (d) morning WBGT; (e) afternoon temperature; (f) afternoon relative humidity; (g) afternoon HI; (h) afternoon WBGT.
Figure 5.
Spatial distribution of thermal comfort during monitoring period: (a) morning temperature; (b) morning relative humidity; (c) morning HI; (d) morning WBGT; (e) afternoon temperature; (f) afternoon relative humidity; (g) afternoon HI; (h) afternoon WBGT.


Figure 6.
Meteorological factor and thermal comfort fitting curve: (a) morning data fitting; (b) afternoon data fitting; (c) daily data fitting.
Figure 6.
Meteorological factor and thermal comfort fitting curve: (a) morning data fitting; (b) afternoon data fitting; (c) daily data fitting.


Table 1.
Monitoring instrument parameters.
| Instrument Name and Model | Measurement Parameters | Measuring Range | Accuracy | Resolution Ratio | Sampling Type and Frequency |
|---|---|---|---|---|---|
| Kestrel 5400 | Heat index | −29 to 70 °C | ±0.5 °C | 0.1 °C | Continuation, 5 s average |
| Wet-bulb globe temperature | −29 to 70 °C | ±0.5 °C | 0.1 °C | Continuation, 5 s average | |
| Temp | −29 to 70 °C | ±0.5 °C | 0.1 °C | Continuation, 5 s average | |
| Relative humidity | 10% RH | 2.0% RH | 0.1% | Continuation, 5 s average | |
| Kestrel 5500 | Temp | −29 °C to 70 °C | ±0.5 °C | 0.1 °C | Continuation, 5 s average |
| Relative humidity | 0–100% | 3% | 0.1% | Continuation, 5 s average | |
| Wind Speed | 0.6–40 m/s | ±3% | 0.1 m/s | Continuation, 5 s average | |
| Garmin eTrex 201 | Track | 0–10,000 dot | 3 m | - | Continuation, 1 s average |
Table 2.
Meteorological data for monitoring day.
| Date | Maximum Temperature | Minimum Temperature | Weather | Wind Speed | Morning Monitoring Period | Afternoon Monitoring Period |
|---|---|---|---|---|---|---|
| 1 July 2023 | 25 °C | 16 °C | sunny | 3 level | 8:30:00–10:53:20 | 15:00:00–17:18:05 |
| 2 July 2023 | 25 °C | 17 °C | cloudy | 4 level | - | - |
| 3 July 2023 | 31 °C | 17 °C | sunny | 3 level | 8:30:00–10:49:05 | 15:00:00–17:19:25 |
| 4 July 2023 | 29 °C | 20 °C | sunny | 3 level | 8:30:00–10:48:25 | 15:00:00–17:22:10 |
| 5 July 2023 | 31 °C | 20 °C | sunny | 3 level | 8:30:00–10:48:00 | 15:00:00–17:15:30 |
| 6 July 2023 | 30 °C | 19 °C | sunny | 1 level | 8:30:00–10:50:50 | 15:00:00–17:21:20 |
Table 3.
Correlation analysis between thermal comfort and fixed point detection.
| Project | Fixed-Point Monitoring HI | Fixed-Point Monitoring WBGT |
|---|---|---|
| Mobile monitoring HI | 0.994 ** | 0.991 ** |
| Mobile monitoring WBGT | 0.978 ** | 0.996 ** |
** At the 0.01 level (double-tailed), the correlation is significant.
Table 4.
Correlation analysis between thermal comfort and meteorological factors.
| Time | Thermal Comfort | Mobile Monitoring | Fixed-Point Monitoring | |||
|---|---|---|---|---|---|---|
| Temperature | Relative Humidity | Temperature | Relative Humidity | Wind Speed | ||
| 8:30–9:30 | HI | 0.989 ** | −0.671 ** | 0.798 ** | −0.377 ** | −0.214 ** |
| WBGT | 0.748 ** | −0.281 ** | 0.780 ** | −0.316 ** | −0.264 ** | |
| 9:30–10:30 | HI | 0.993 ** | −0.905 ** | 0.905 ** | −0.875 ** | 0.025 |
| WBGT | 0.746 ** | −0.698 ** | 0.837 ** | −0.868 ** | 0.231 ** | |
| 10:30-end | HI | 0.968 ** | −0.538 ** | 0.538 ** | −0.129 | −0.583 ** |
| WBGT | 0.002 | −0.294 ** | 0.399 ** | −0.265 ** | −0.178 ** | |
| 15:00–16:00 | HI | 0.979 ** | −0.724 ** | 0.349 ** | −0.365 ** | −0.099 ** |
| WBGT | 0.491 ** | −0.469 ** | 0.411 ** | −0.495 ** | 0.121 ** | |
| 16:00–17:00 | HI | 0.951 ** | −0.312 ** | −0.019 | −0.075 * | −0.249 ** |
| WBGT | 0.436 ** | 0.124 ** | 0.291 ** | 0.284 ** | 0.136 ** | |
| 17:00-end | HI | 0.957 ** | −0.288 ** | 0.301 ** | −0.451 ** | 0.008 |
| WBGT | −0.006 | −0.137 | −0.361 ** | 0.103 | −0.006 | |
* At the 0.05 level (two-tailed), the correlation is significant. ** At the 0.01 level (two-tailed), the correlation is significant.
Disclaimer/Publisher’s Note: The statements, opinions and data contained in all publications are solely those of the individual author(s) and contributor(s) and not of MDPI and/or the editor(s). MDPI and/or the editor(s) disclaim responsibility for any injury to people or property resulting from any ideas, methods, instructions or products referred to in the content. |
© 2024 by the authors. Licensee MDPI, Basel, Switzerland. This article is an open access article distributed under the terms and conditions of the Creative Commons Attribution (CC BY) license (https://creativecommons.org/licenses/by/4.0/).
Share and Cite
MDPI and ACS Style
Liu, Y.; Fan, J.; Xie, S.; Chen, X. Study on the Spatial and Temporal Distribution of Thermal Comfort and Its Influencing Factors in Urban Parks. Atmosphere 2024, 15, 183. https://0-doi-org.brum.beds.ac.uk/10.3390/atmos15020183
AMA Style
Liu Y, Fan J, Xie S, Chen X. Study on the Spatial and Temporal Distribution of Thermal Comfort and Its Influencing Factors in Urban Parks. Atmosphere. 2024; 15(2):183. https://0-doi-org.brum.beds.ac.uk/10.3390/atmos15020183
Chicago/Turabian StyleLiu, Yujie, Jiayu Fan, Siqi Xie, and Xuegang Chen. 2024. "Study on the Spatial and Temporal Distribution of Thermal Comfort and Its Influencing Factors in Urban Parks" Atmosphere 15, no. 2: 183. https://0-doi-org.brum.beds.ac.uk/10.3390/atmos15020183
Note that from the first issue of 2016, this journal uses article numbers instead of page numbers. See further details here.