Article

Indoor Air Quality in Naturally Ventilated Italian Classrooms

by
Fernanda Carmen Fuoco
1,*,
Luca Stabile
1,
Giorgio Buonanno
1,2,
Concepcion Vargas Trassiera
1,
Angelamaria Massimo
1,
Aldo Russi
1,
Mandana Mazaheri
2,
Lidia Morawska
2 and
Alexandro Andrade
3
1
Department of Civil and Mechanical Engineering, University of Cassino and Southern Lazio, Cassino (FR) 03043, Italy
2
International Laboratory for Air Quality and Health, Queensland University of Technology, Brisbane (QLD) 4001, Australia
3
Center of Health Sciences and Sport, Santa Catarina State University, Florianopolis 88080-350, Brazil
*
Author to whom correspondence should be addressed.
Atmosphere 2015, 6(11), 1652-1675; https://0-doi-org.brum.beds.ac.uk/10.3390/atmos6111652
Submission received: 22 September 2015 / Revised: 24 October 2015 / Accepted: 27 October 2015 / Published: 2 November 2015
(This article belongs to the Special Issue Indoor and Outdoor Air Quality)

Abstract

:
Characterization of indoor air quality in school classrooms is crucial to children’s health and performance. The present study was undertaken to characterize the indoor air quality in six naturally ventilated classrooms of three schools in Cassino (Italy). Indoor particle number, mass, black carbon, CO2 and radon concentrations, as well as outdoor particle number were measured within school hours during the winter and spring season. The study found the concentrations of indoor particle number were influenced by the concentrations in the outdoors; highest BC values were detected in classrooms during peak traffic time. The effect of different seasons’ airing mode on the indoor air quality was also detected. The ratio between indoor and outdoor particles was of 0.85 ± 0.10 in winter, under airing conditions of short opening window periods, and 1.00 ± 0.15 in spring when the windows were opened for longer periods. This was associated to a higher degree of penetration of outdoor particles due to longer period of window opening. Lower CO2 levels were found in classrooms in spring (908 ppm) than in winter (2206 ppm). Additionally, a greater reduction in radon concentrations was found in spring. In addition, high PM10 levels were found in classrooms during break time due to re-suspension of coarse particles.

Graphical Abstract

1. Introduction

The indoor air quality (IAQ) has become a significant interest recently. Numerous studies from across the world have reported that greater levels of indoor pollutants can be found than in the outdoors [1,2,3]. Due to the adverse effects of air pollution on human health [4,5], levels of particulate matter (PM) in indoor environments are of great interest. Many epidemiological studies indicated that fine particles, PM2.5 (particles with aerodynamic diameter smaller than 2.5 µm) may have a greater potency to cause negative health effects [6,7,8,9] than larger particles, PM10 and PM2.5–10 (particles with aerodynamic diameter smaller than 10 µm and between 2.5 and 10 µm, respectively), due to their increased deposition rates in lower respiratory tract [10] and higher transition metal content [11,12].
Furthermore, recent attention has pointed towards ultrafine particles (UFPs, particles with diameter smaller than 100 nm), which have also been suggested to be more toxic due to their smaller sizes, larger surface areas available for biologic interactions with lung cells [13], and high lung deposition fraction [14].
Associations between urban UFP exposures and adverse cardiovascular health outcomes have been reported in several epidemiological studies [15,16,17]. The evidence of adverse effects on respiratory and central nervous systems has also been of interest [18,19,20,21], suggesting UFP as a potential PM2.5 constituent to reflect health effects.
In view of the evidence on the negative health impact of UFPs, a great effort has been made based on the characterization of the main sources and processes that can affect their levels [22,23,24], but still much need to be done. Thus far, UFPs are still poorly controlled in urban areas. The air quality measurement networks commonly measure the mass concentrations, to which UFPs contribute slightly, due to their size. Therefore the data that many epidemiological studies rely on to represent the air quality in schools does not accurately represent the contribution of UFPs to air pollution.
There is increasing evidence that the IAQ exposure is the cause of adverse health impacts on human beings including morbidity and mortality [25,26], however, the attention paid to the measurement of air quality at indoor school environments has been limited. Based on the knowledge of the authors, the majority of previous effort on the IAQ in schools has been focused on a number of airborne pollutants (e.g., carbon dioxide (CO2), radon, volatile organic compound, formaldehyde, particles from indoor sources) [27,28,29,30,31,32], but there is limited information available on airborne particles. In fact, many studies have measured indoor particle concentrations at schools in fine and coarse particle ranges [33,34,35,36,37,38], while only few studies have examined UFP levels in school classrooms [39,40,41,42].
A number of studies have recently been carried out in assessing IAQ in school classrooms, including in Europe. However, limited information is available for IAQ in Italian schools. Considering that air quality in general and IAQ in particular depends on the environmental factors and is specific to each study area, this pilot study provides useful information on the indoor air pollutant levels in Italian schools.
The ratio between indoor and outdoor particle concentrations (Ni/Nout) has been identified as an important research topic as it depends on different parameters: the air exchange rate between the indoor and outdoor air, the deposition rate of aerosols, the penetration factor, and the indoor activities that release UFPs (cooking, writing with chalk, vacuuming etc.) [43]. The results in Zhu et al. [44] and Chao and Tung [45] showed that the Ni/Nout ratio with windows open was higher than the ratio with windows closed. However, the results of Guo et al. [46] showed the opposite conclusion. Also, the Ni/Nout ratios under natural ventilation were compared with ratios under mechanical ventilation [47,48,49,50]. However, there is no uniform conclusion on this issue. The penetration factor (fraction of particles that pass through the building shell) has been identified as an important influential factor on Ni/Nout ratio. It varies depending on the ventilation mechanisms used in buildings (e.g., natural ventilation by opening windows or by infiltration) [51] and it is a strong function of air exchange rate, particle size and the geometry of cracks in the building envelope [52].
Therefore, the investigation of the relationship of Ni/Nout as function of the mechanism of natural ventilation (by opening windows), which also depends on the perceived indoor thermal comfort of the occupants, is of crucial interest in the recent scientific literature because of its multidisciplinary aspect (IAQ, ventilations characteristics, and indoor thermal comfort). Children represent a highly susceptible population group to air pollution [53] due to their higher inhalation rates resulting in larger specific doses while their organs and tissues are growing [54] and they spend most of their day at school [55,56] so that a major part of their daily exposure to air pollution could occur at schools. Therefore, studies focusing on the IAQ in typical school classrooms need to be carried out, in order to guarantee the minimum requirements for acceptable indoor air quality levels in classrooms and to prevent children’s exposure to risk.
In this context, the aim of this study is to characterize the indoor air quality in typical Italian naturally ventilated classrooms in terms of particle concentrations, black carbon, CO2, and radon levels. Additionally, to investigate the influence of indoor and outdoor sources, as well as the effect of airing by opening windows on indoor air pollutant levels.

2. Materials and Methods

2.1. Sampling Site

Air quality data were collected in six classrooms (hereinafter called IS1, IS2, IS3, IS4, IS5 and IS6) of three public primary schools (hereinafter called S1, S2 and S3) selected in the urban area of Cassino (Central Italy, 41°30′0′′ N–13°50′0′′ E). The selected classrooms were equipped with standard school tables and chairs, and a blackboard with chalk at the front. The classroom’s floor surface covering was made of marble.
The school buildings ranged in age from about 30 to 60 years old. The sizes of the classrooms varied from 41 to 82 m2. During the measurement period, classrooms were occupied by 16–27 children.
The selected schools were investigated during two experimental campaigns. The first was during the cold season (fall/winter period), from November 2014 to March 2015, and the second was during the warm season (spring period), from May to June 2015.
All the schools under investigation were naturally ventilated (by opening windows). It is of note that the mechanism of natural ventilation by opening windows is named as “airing” by the UNI EN 12792 [57]. For this reason, the term “airing” will be used hereafter in this work to indicate the mechanism of natural ventilation by opening windows.
All the schools were equipped with a radiator heating system in operation during the cold season. The authors point out that the first experimental campaign was carried out during the fall/winter period (November–March), the “heating season” in Cassino. During this season, schools as well as all the public and residential buildings and houses kept the heating systems in operation. In contrast, during spring (March–June), due to the warm outdoor temperatures, heating systems, air conditioning, and fans were not in use at schools or in the public and residential buildings (“non-heating season”).
Particle number, mass concentration, black carbon, and CO2 levels were measured in five of the selected classrooms (IS1, IS2, IS3, IS4 and IS5) on a regular school day (from the start to the end of school day: 8:30 a.m.–13:00 p.m. for S1 and S2 and 8:30 a.m.–13:30 p.m. for S3) during winter and spring seasons. Therefore, one regular school day in winter and one in spring were selected for sampling in each selected classroom. Particle mass concentration and black carbon were measured only during the experimental campaign carried out in spring. A further experimental campaign was carried out in order to investigate indoor radon concentrations in school classrooms. Measurements were performed over five consecutive days (three weekdays, plus the weekend) in three classrooms (IS1, IS5 and IS6) during winter and spring season.
Thermal parameters such as temperature and relative humidity were measured in all the selected classrooms during school hours during winter and spring season.
Data were collected at indoor and outdoor sites. The classrooms were selected as indoor sampling sites. The instruments for indoor sampling were placed on a desk, close to the walls, away from blackboards (to avoid direct exposure to chalk), and away from windows (to avoid influence from outdoor levels), at a distance of 0.8 m above the ground, in proximity to the student seating area.
The outdoor site was set at the schools entrance gate, facing the closest busy road to represent traffic effects on school air quality as best as possible. The instruments for outdoor sampling were placed at the same height as the indoor sampling height.
During both measurement campaigns, traffic intensity was monitored and recorded by video cameras placed on the busiest and closest road around each school during school hours.
Cleaning activities were carried out after school hours, and no cooking activities occurred at the studied schools.

2.2. Instrumentation and Quality Assurance

The following instruments were used at the indoor sampling sites:
-
A Diffusion Charger Particle Counter (Testo DiSCmini) to measure particle number concentration in the 10–700 nm size range, based on the electrical charging of the aerosols, with a time resolution of 1 s.
-
A DustTrak™ DRX Aerosol Monitors (Model 8534, TSI Incorporated, St. Paul, MN, USA) to measure different PM fractions (PM10, PM2.5, and PM1) operating on the base of a light scattering technique, where the amount of scattered light is proportional to the aerosol particle volume concentration. Data were obtained with a 1-min time resolution. The instrument was calibrated by comparison with the PM10 mass concentration measurement obtained using gravimetric time-integrated sampler (Zambelli 6000 Plus). Additionally, the instrument was calibrated daily to a zero filter, used to re-zero the units and ensure reading accuracy.
-
An Aethalometer (AE51, Magee Scientific) to detect black carbon (BC) concentration operating through light’s absorption (attenuation) of optically absorbing particles technique with a time resolution of 1 min.
-
A non-dispersive infrared analyzer (Testo—Ambient CO2 probe) to measure temperature, humidity, CO2 and pressure with 1-min time resolution.
-
An Alpha Guard Professional Radon Monitor (Genitron, Germany) to measure radon activity concentration through a 0.6 L ionization chamber where the radon gas enters by spontaneous diffusion. The instrument was calibrated through the INMRI ENEA Radon reference measurement system before the experimental campaign. Radon concentration was measured in “diffusion mode” with a 60-min sampling time.
At the outdoor site, a second Diffusion Charger Particle Counter was used to measure particle number concentrations at school scale simultaneously with the indoor particle number sampling. Data were obtained with the same time resolution that was set indoors.
The counters were calibrated at the beginning of the experimental campaign, in order to allow for data quality assurance, by comparison with a Condensation Particle Counter (CPC, TSI Model 3775) to measure particle number concentration. The calibration was carried out within a closed volume space (about 16 L), with uniform and stationary particle number concentration. Details are reported in a study carried out by Buonanno et al. [58]. Quality assurance of the CPC measurements was conducted through flow checks at the start of the monitoring period in each school. The CPC was calibrated in the European Accredited Laboratory at the University of Cassino and Southern Lazio by comparison with a TSI 3068B Aerosol Electrometer [59].
All of the instruments used in the experimental campaign at schools were connected to main power and operated during school hours.
In order to monitor meteo-climatic parameters, a David Vantage Pro weather station, recording outdoor temperature (Tout) and relative humidity (RHout) with a 15-min resolution, was placed on the rooftop of University of Cassino and the Southern Lazio building. Data related to the experimental campaign days were collected and averaged during school hours.

2.3. Methodology Description

Indoor particle number, mass (PM1, PM2.5, PM10) concentrations, BC and CO2, were simultaneously measured on a regular school day in classrooms, as well as indoor temperature (Tin), and relative humidity (RHin). Average values during school hours of such parameters were reported in the Results section. Data of radon concentrations were averaged both on school hours and 24 hours.
During the indoor measurement campaign, a logbook reporting length of window/door opening period and opening frequency, as well as classroom empty periods (e.g., break time or recreational activities performed in other rooms), was filled out by teachers within school hours and taken into account during data post processing.

3. Results

3.1. School and Classroom Characteristics

A detailed summary of the school and classroom characteristics as well as the average traffic density and peak times for each school is shown in Table 1.
Table 1. Summary of the school and classroom characteristics: description, location, traffic density and peak times, classrooms floor area and volume as well as the sampling period of the experimental campaigns.
SchoolDescriptionLocationTraffic Density and Peak Times (Vehicles·min−1)ClassroomFloor Area (m2)Volume (m3)Study Period
S1Public school
Built in 1980
One-story building
V: 3960 m3
Enrollment: 111
Classrooms equipped with aluminum windows single-glazed
Low trafficked zone (traffic allowed only during peak times) Not availableIS15921610 February and 15 May 2015
S2Public school
Built in 1980
Two-story building
V: 12,300 m3
Enrollment: 530
Classrooms equipped with aluminum windows single-glazed
Urban road (no heavy duty vehicles) *36 ± 2
44 ± 1; 08:30 a.m.
54 ± 2; 13:30 p.m.
IS24115116, 20, 21 January and 13,20,21 May 2015
IS345165
IS482302
S3Public school
Built in1960/70
One-story building
V:13,950 m3
Enrollment: 615
Classrooms equipped with aluminum windows single-glazed
Urban road (7.7% of heavy duty vehicles) **37 ± 11IS54715111 February, 20 March and 28–29 May 2015
46 ± 10; 08:30 a.m.
55 ± 11; 13:30 p.m.
IS647151
* Heavy-duty vehicles do not transit that area; ** % of heavy-duty vehicles counted at this site during the study period.
A negligible traffic density was detected around S1 because it was situated on a low traffic zone and the number of enrolled students was fewer than the other schools. Traffic density around S2 was 36 vehicles·min−1 and traffic peak times were detected at 08:30 a.m. and 13:30 p.m. All roads around S2 were occupied primarily by cars (50% of diesel cars). Three school buses were used to transport children to this school. Traffic density around S3 was comparable with that of S2, however, the type of vehicle traffic was different. S3 was placed on a road with a non-negligible percentage of heavy duty (HD) vehicles (7.7% of heavy duty vehicles, typically buses) [60].

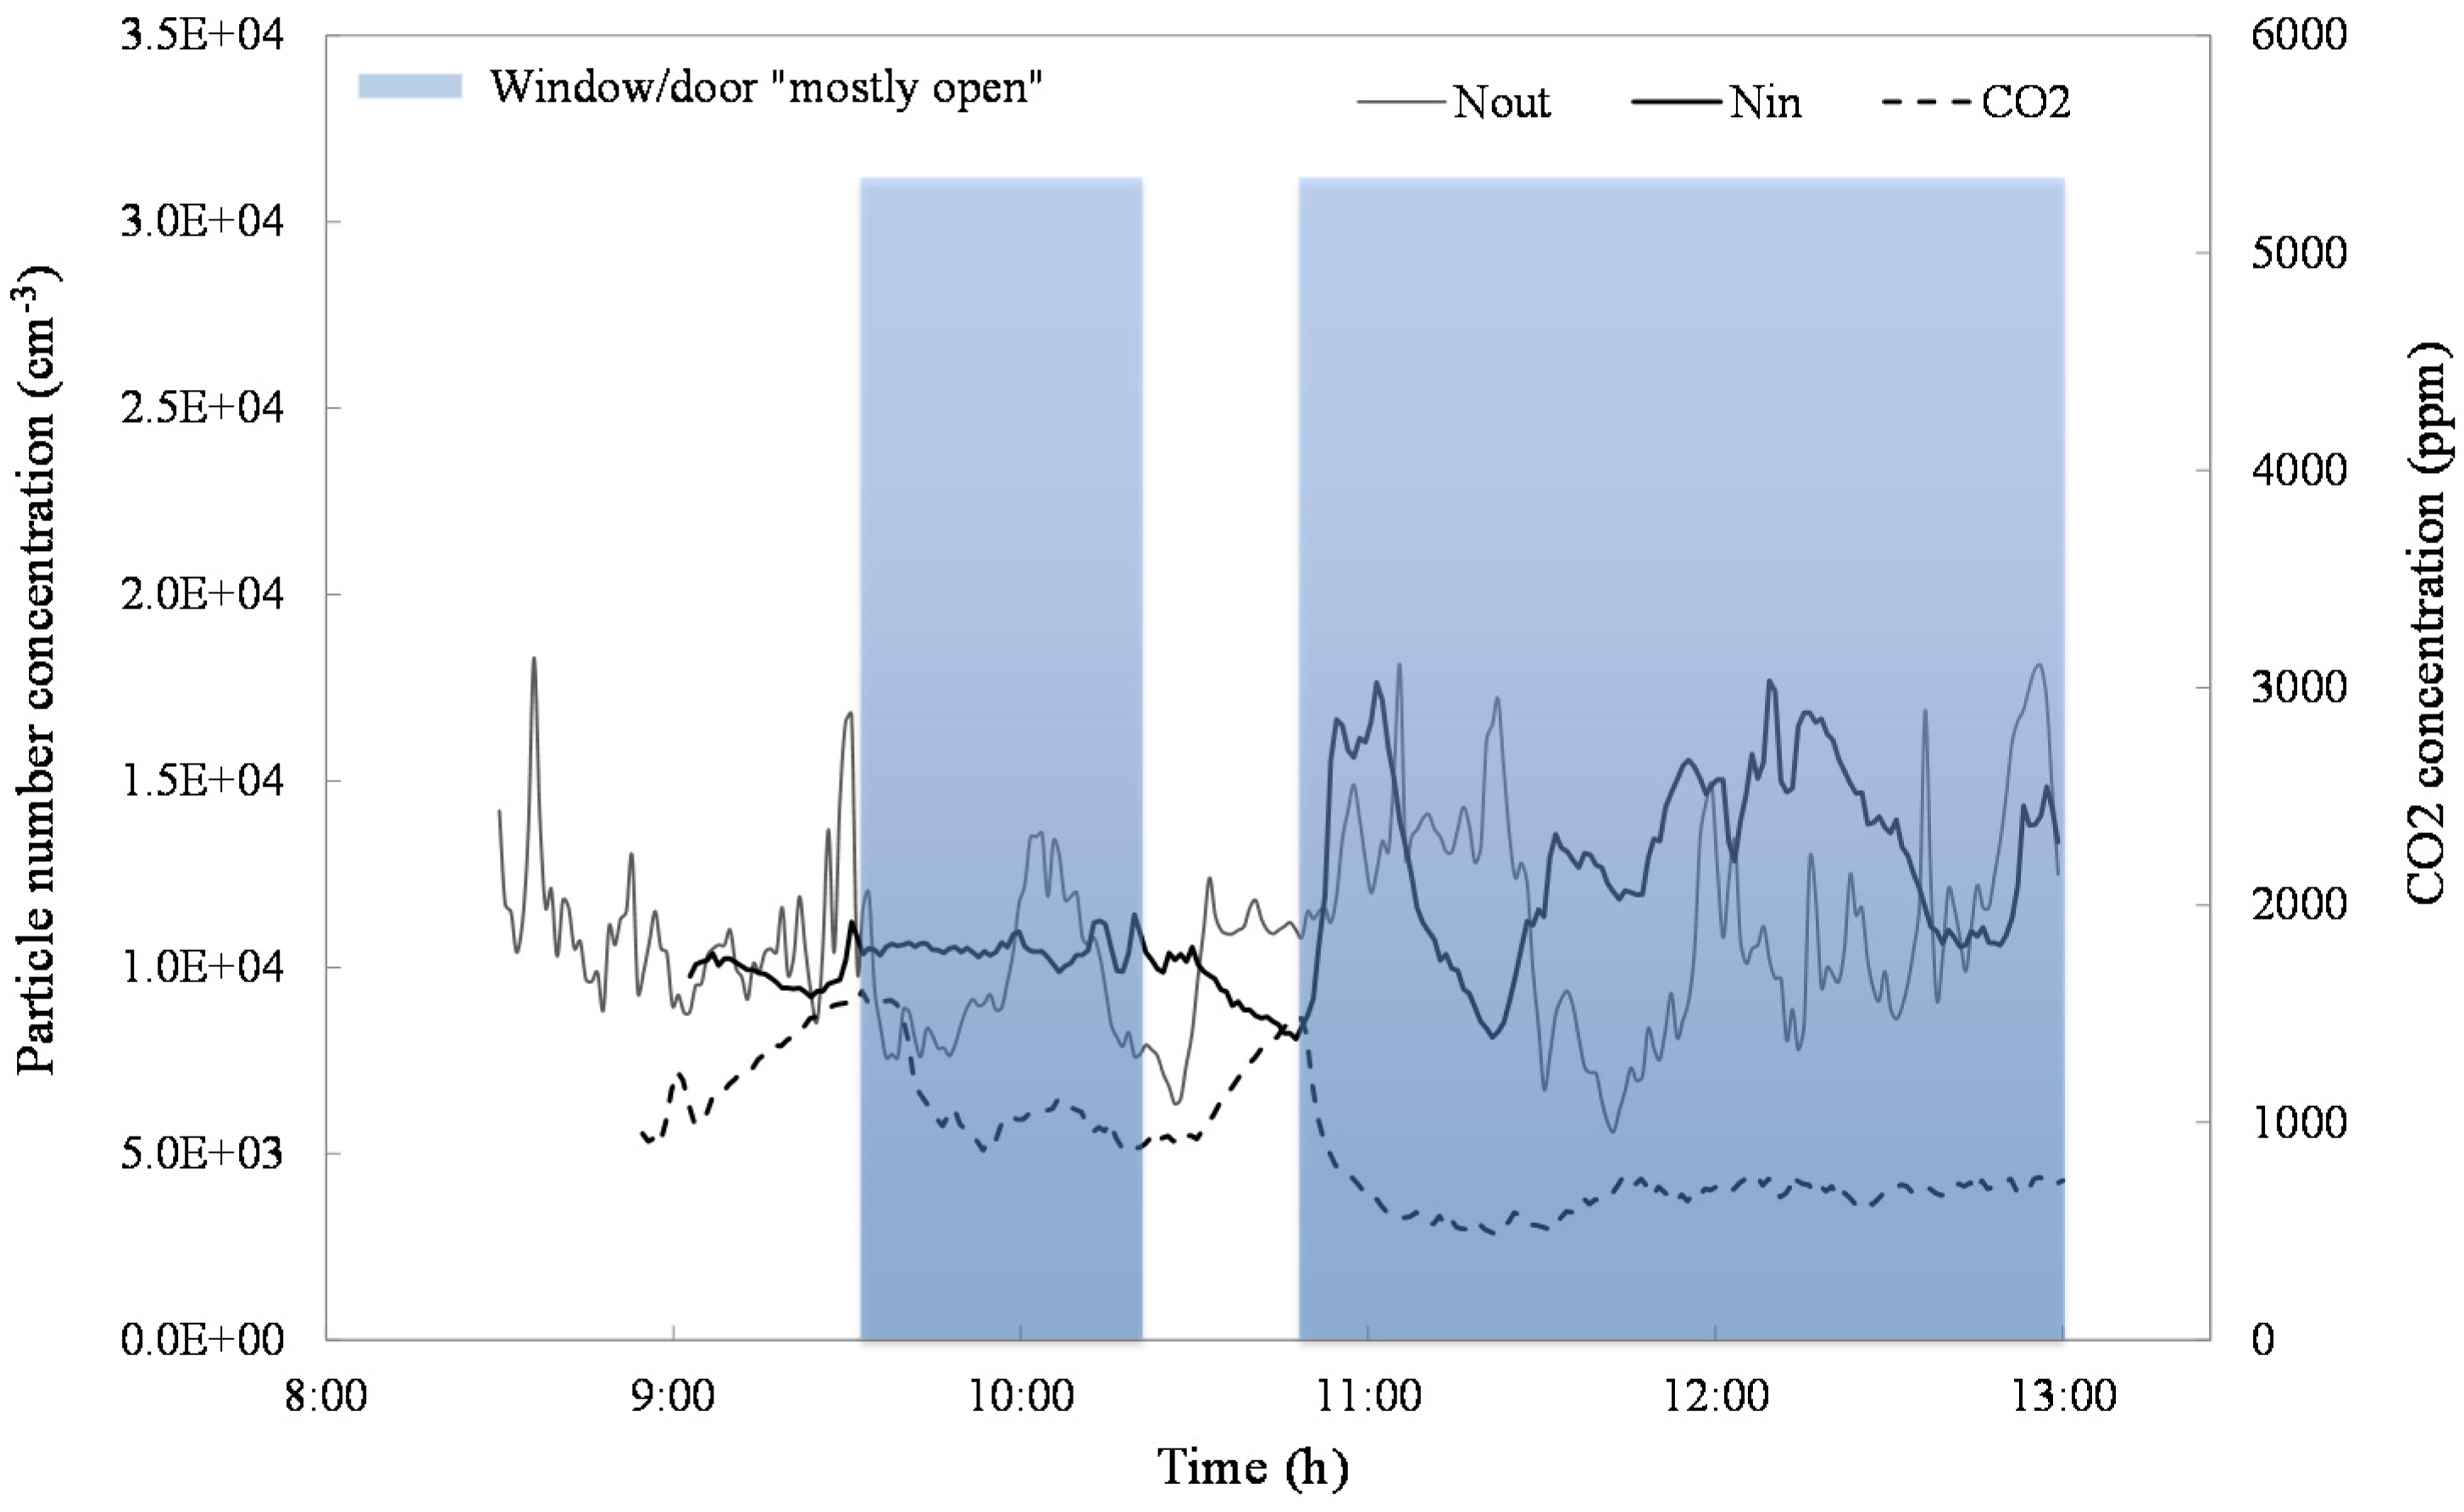
3.2. General Air Quality Characteristics

Average indoor and outdoor particle number concentrations found at each studied schools (S1, S2 and S3) for both campaigns were summarized in Table 2.
Table 2. Average indoor and outdoor particle number concentrations at schools (S1, S2 and S3) over the two experimental campaigns.
SchoolsNin (cm−3)Nout (cm−3)
S18.94 ± 1.82 × 1031.14 ± 0.27 × 10⁴
S21.08 ± 0.36 × 1041.25 ± 0.36 × 10⁴
S31.48 ± 0.50 × 1041.41 ± 0.94 × 10⁴
As expected, outdoor particle number concentrations for the three schools (S1, S2 and S3) were higher than indoors because the main sources of UFPs (main road traffic) were located outside the buildings. Among the studied schools, the highest outdoor concentration was found at S3, which was placed on the urban road with 7.7% of heavy-duty vehicles while the lowest was found at S1, which was placed on the low traffic zone. Similarly, the indoor particle number concentration was highest at school with the highest level of traffic (S3) and lowest at school with the lowest level (S1), confirming the influence of traffic emission on the UFP levels at school-scales as previously found in a study carried out in the urban area of Cassino [39].
Focusing on the IAQ monitored in classrooms, school-hours average data in terms of indoor particle number (Nin) and mass concentration (PM1, PM2.5, PM10), black carbon (BC) and CO2, are given in Table 3 for IS1, IS2, IS3, IS4 and IS5, distinguishing the two measurements campaigns (winter and spring) for each monitored classroom. Outdoor particle number concentration (Nout) and the ratio between indoor and outdoor particle number concentrations (Ni/Nout) are also reported in Table 3.
Table 3. School-hours average (and standard deviation) indoor particle number and mass concentration, BC, CO2, outdoor particle number concentration and Ni/Nout ratio for each classroom during school hours in winter (W) and spring (S).
Classroom (Storey Level)SeasonNin (cm−3)PM1 (µg·m−3)PM2.5 (µg·m−3)PM10 (µg·m−3)BC (µg·m−3)CO2 (ppm)Nout (cm−3)Ni/Nout
IS1 (ground floor)W8.24 ± (1.81) × 103--------1503 ± 405----
S9.65 ± (1.79) × 10311.6 ± 2.312.0 ± 2.319.4 ± 5.4--501 ± 351.14 ± (0.27) × 1040.85
IS2 (first floor)W1.29 ± (0.27) × 104-------3130 ± 12831.72 ± (0.46) × 1040.75
S1.17 ± (0.41) × 10415.4 ± 8.216.3 ± 8.730.1 ± 21.01.8 ± 0.6900 ± 3011.08 ± (0.26) × 1041.08
IS3 (first floor)W9.17 ± (3.03) × 103--------2746 ± 12351.03 ± (0.30) × 1040.89
S6.00 ± (1.84) × 10323.3 ± 14.824.7 ± 16.046.6 ± 43.21.4 ± 0.4858 ± 1696.57 ± (2.14) × 1030.91
IS4 (ground floor)W1.38 ± (0.18) × 104------1907 ± 4631.78 ± (0.25) × 1040.77
S1.11 ± (0.26) × 10416.5 ± 5.217.3 ± 5.530.7 ± 12.3--858 ± 217----
IS5 (ground floor)W1.60 ± (0.47) × 104--------1747 ± 5591.65 ± (1.04) × 1040.98
S1.36 ± (0.33) × 10419.3 ± 3.820.2 ± 3.936.7 ± 6.92.9 ± 1.51423 ± 3081.17 ± (0.22) × 1041.17
On average, outdoor particle number concentration, measured in the five classrooms, was 1.54 ± 0.35 × 104 cm−3 in winter and 1.01 ± 0.24 × 104 cm−3 in spring, indicating that exposure levels of particle number concentration were slightly higher in winter than in spring. This result could be explained by the fact that during winter, more outdoor particle sources such as heating systems were in operation in the city, rather than in spring when heating systems were off and the outdoor temperatures were not high enough to have the air conditioning on. Moreover, the higher outdoors particle number concentration in winter was also possibly related to the temperature inversion phenomena, which frequently occurred in wintertime with stable cold conditions. In fact, low winter incoming solar radiation often results in near neutral boundary layer conditions during daytime. Therefore, under these conditions, peaks of ground level aerosol concentrations, emitted during morning rush hours and by heating systems, could remain relatively high throughout the day due to inefficient ventilation.
However, the higher exposure levels of particle number concentration found in winter in this study was in accordance with the background pattern of particle number concentration (city-scale) in Cassino reported in a previous study [39].
Similarly, indoor particle number concentrations were also found to be higher in winter (1.20 ± 0.33 × 104 cm−3) than in spring (1.04 ± 0.28 × 104 cm−3). Particle number concentrations ranged from 8.24 ± 1.81 × 103 cm−3 to 1.60 ± 0.47 × 104 cm−3 during winter and from 6.00 ± 1.84 × 103 cm−3 to 1.36 ± 0.33 × 104 cm−3 during spring among the studied classrooms.
Indoor particle number concentrations were also found to be lower than in outdoors, with Ni/Nout average value below 1. However, ratios of indoor to outdoors particle concentrations varied between the seasons; in particular, it was observed to increase during springtime. The Ni/Nout ratios were of 0.85 ± 0.10 in winter and 1.00 ± 0.15 in spring.
PM1, PM2.5 and PM10 concentrations measured in the five classrooms during spring were, on average, 17.2 ± 4.4, 18.1 ± 4.7, 32.7 ± 10.0 µg·m−3 respectively. The 24-h threshold values suggested recently by WHO [53] for indoor spaces for PM2.5 and PM10 are 25 μg·m−3 and 50 μg·m−3, respectively. Even if a proper comparison with the WHO threshold values was not carried out in this study because of different average exposure times, the authors highlighted that a high exposure level to PM concentration was found during school hours. In particular, high PM10 values were found in the classrooms indicating the presence of a significant coarse particles fraction (PM2.5–10) related to major PM indoor sources such as blackboard dust and organic matter of children [61,62], as well as the re-suspension phenomena of particles [63,64]. Conversely, the average indoor PM2.5 mass concentration was found to be close to PM1. Considering PM1 as a better indicator for vehicular emissions [65], this result indicated the influence of the traffic emissions in classrooms.
On average, BC concentration measured in IS2, IS3, and IS5 during spring, was 2.0 ± 0.8 µg·m−3. The highest level of BC was found at IS5 classroom (2.9 ± 1.5 µg·m−3) of S3, which had the greatest traffic problem.
The average CO2 concentrations measured at IS1, IS2, IS3, IS4 and IS5, were higher in winter (2206 ± 696 ppm), rather than in spring (908 ± 330 ppm). The highest CO2 values were found in winter at IS2 and IS3, which were the classrooms with the smaller floor area and volume compared to the others. Moreover, in winter, all the studied classrooms were found to have exceed the CO2 ASHRAE Standard 62.1 (equal to 1000 ppm) and the threshold value of good air quality proposed by EN 13779 (equal to 1200 ppm) [66,67]. Lower levels of CO2 concentrations were conversely found in spring.
In Table 4, average values of indoor temperature (Tin) and relative humidity (RHin) within school hours are reported for each classroom in winter (W) and in spring (S). School-hours average values of outdoor temperature and relative humidity are also reported in Table 4.
The average indoor temperature was 21.5 ± 1.8 °C and 25.9 ± 2.1 °C in winter and spring respectively, while the outdoor temperature was, of 8.7 °C and 15.5 °C respectively. Similar indoor relative humidity values were measured in the classrooms between the seasons: an average value of 50% was found both in winter and spring.
Indoor temperature values suggested by the Italian technical standard UNI TS 11300 [68] for school buildings are 20 °C during winter and 26 °C during spring. Similar values for thermal comfort range were recommended by ASHRAE (from 20 °C to 26 °C Tin and from 20% to 60% RHin) [69].
The indoor temperatures found in this study were slightly above the Italian reference values in winter, but thermal parameters such as temperature and relative humidity are difficult to control in naturally ventilated classrooms, where the ventilation is totally controlled by the user.
Table 4. Average values (and standard deviation) of indoor temperature (Tin) and relative humidity (RHin) for each classroom during school time in winter (W) and spring (S) season. School-hours average values of outdoor temperature (Tout) and relative humidity (RHout) are also reported.
SchoolClassroomSeasonTin (°C)RHin (%)Tout (°)Rhout (%)
S1IS1W21.7 ± 1.645.2 ± 5.36.2 ± 1.280.0 ± 3.8
S27.1 ± 0.445.3 ± 1.518.4 ± 2.261.5 ± 5.9
S2IS2W20.7 ± 1.267.4 ± 3.49.2 ± 1.692.1 ± 6.4
S25.4 ± 0.652.5 ± 5.013.5 ± 1.885.8 ± 7.5
IS3W19.8 ± 1.167.7 ± 3.19.6 ± 0.591.2 ± 1.5
S29.0 ± 1.547.8 ± 2.413.2 ± 1.486.6 ± 5.6
IS4W24.2 ± 2.240.1 ± 3.04.7 ± 2.794.4 ± 3.4
S26.5 ± 0.749.2 ± 1.815.6 ± 1.785.5 ± 3.4
S3IS5W19.7 ± 1.546.5 ± 2.88.5 ± 1.280.0 ± 3.8
S24.0 ± 0.847.8 ± 2.616.5 ± 2.680.7 ± 9.1
IS6W23.3 ± 1.330.1 ± 2.113.0 ± 1.072.0 ± 3.8
S23.5 ± 0.553.9 ± 7.515.8 ± 2.282.6 ± 6.4
From the notes reported in the logbook, two different modes in terms of airing were detected between the seasons, as expected. Since the airing (by opening windows) is associated with thermal comfort reasons for the occupants, it was not surprising to find that in winter the occupants did not frequently open the windows due to cold air coming in from outside, while in spring the windows were kept open for the most of school hours.
In particular, short window opening periods with a low opening frequency were found in winter, while in spring a longer opening period (and low opening frequency) was detected.

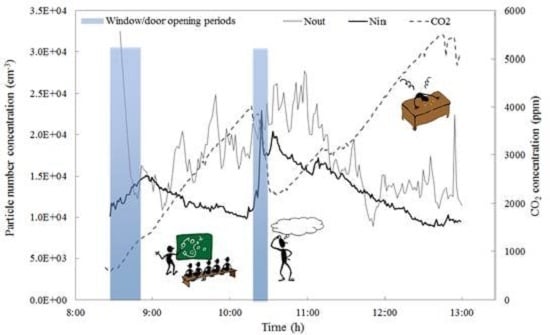
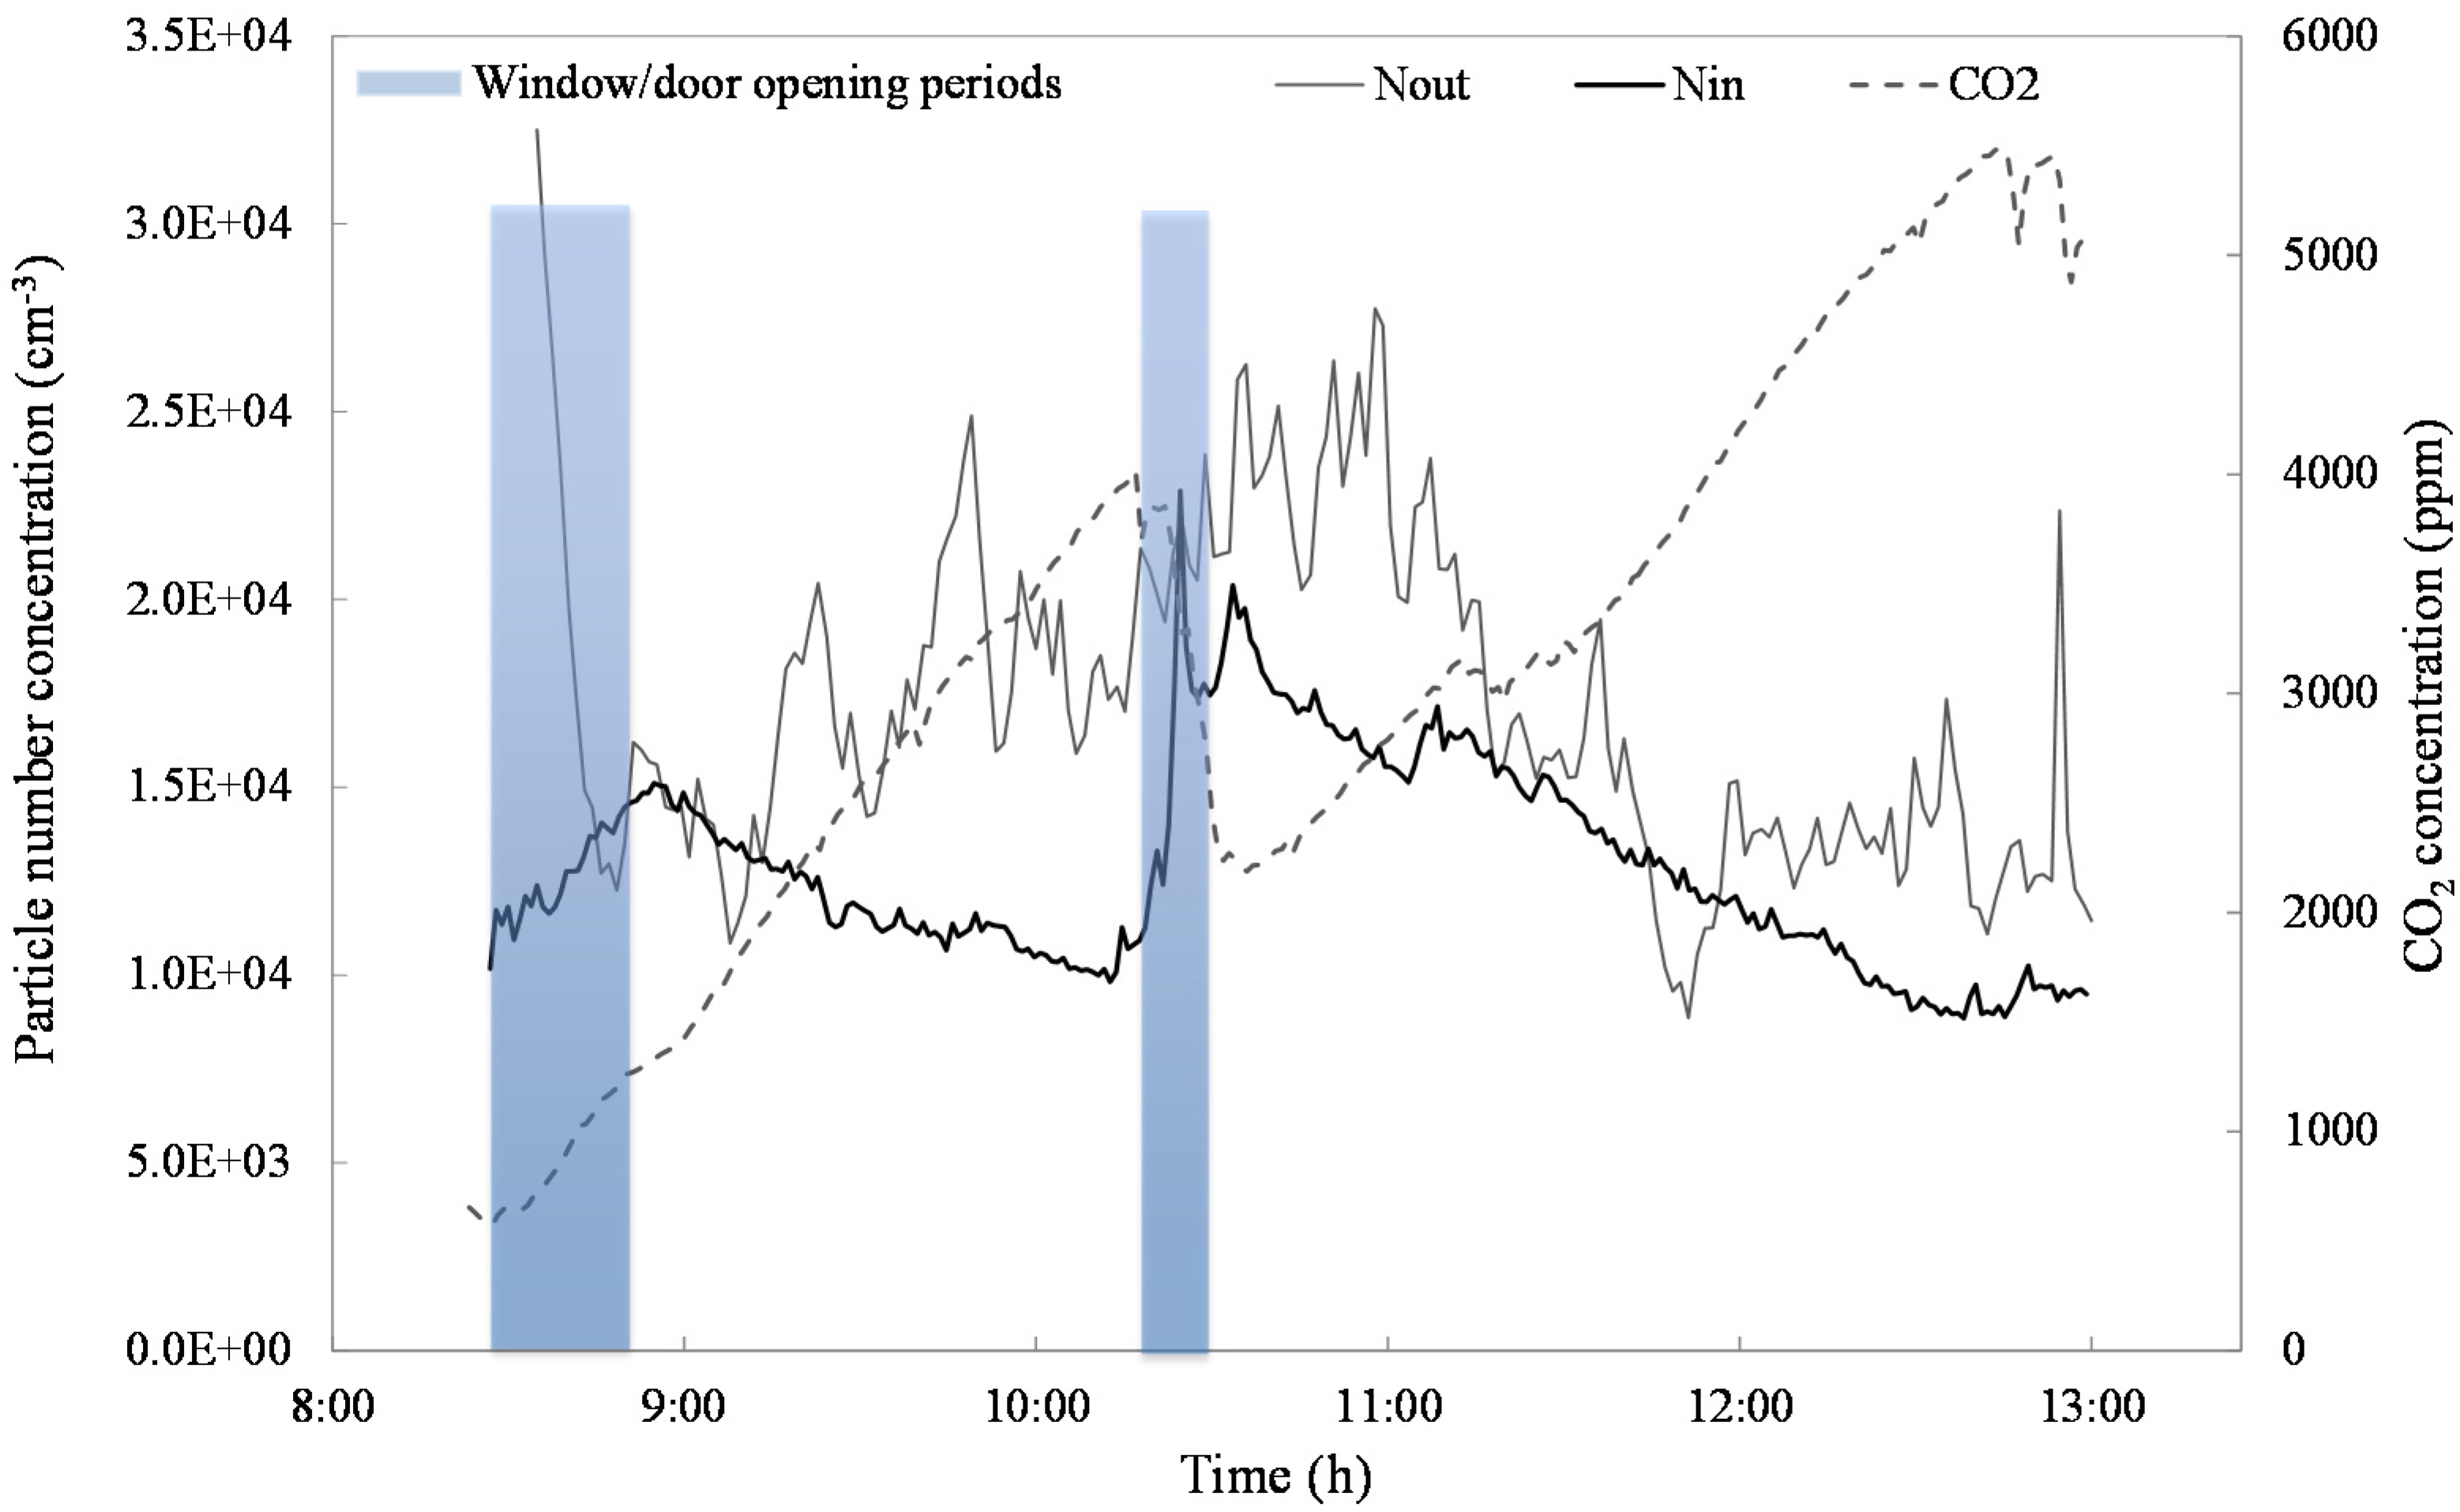
3.3. Temporal Variation of Indoor Air Quality during School Hours

In order to analyze in depth the findings previously summarized in Table 3, the indoor temporal variations of CO2 and particle number concentrations were hereafter shown with the aim to explain their variability within school hours.
For this purpose, the authors showed the temporal variation of indoor CO2 and particle number concentrations measured in one of the monitored classrooms for both the two measurements campaigns (winter and spring).
Figure 1 shows the temporal variation of indoor particle number and CO2 concentrations within school hours in IS2 during winter. The outdoor particle number concentration measured over the same period within school hours is also reported.
The outdoor particle number concentration showed variations with the time. Peaks could be identified around 08:30 a.m. (3.3 × 104 cm−3), 10:30 a.m. (2.8 × 104 cm−3) and 13:00 p.m. (2.3 × 104 cm−3), correlating with the traffic pattern around the school with peaks in the morning at 08:30 a.m. and at 13:30 p.m. as reported in Table 1. It was not surprising that high particle loadings were reported at these hours because of the high traffic in proximity to pick up and drop off school zones. However, the highest particle number event was detected at the start of school day (08:30 a.m.).
Figure 1. Temporal variation of indoor particle number (Ni) and CO2 concentrations within school hours in IS2 during winter. The outdoor particle number concentration (Nout) and the window/door opening periods are also indicated.
Atmosphere 06 01652 g001
The indoor particle number concentrations were observed to be lower than the outdoors’, indicating the main influence of the outdoor particle number concentrations. However, as shown in Figure 1, short-term increases of indoor particles were observed at 08:30 and 10:15 a.m. As reported in the classroom logbook, these times corresponded to window and door opening periods during school hours. In particular, for the studied school day, two door opening periods were reported in the logbook: the first one occurred from 08:30 (start of the school day) to 08:55 a.m., and the second one from 10:15 to 10:30 a.m. (break time). In addition, a window-opening period was also reported from 10:15 to 10:30 a.m.
In particular, a significant increase of indoor particles was observed during the second period (door and window opening from 10:15 to 10:30 a.m.) rather than the first period (only door opening).
During the short window-opening period (15-min), concentrations were two times higher than the average level in the classroom. This could be associated to the higher penetration of outdoor UFPs from traffic during the airing period.
When windows were closed, the indoor concentration decreased with time. This could be explained by the ventilation, the absence of specific indoor sources, and deposition.
The CO2 minimum concentration value (572 ppm) was found before students entered the classroom (08:30 a.m.). Afterwards, the CO2 started to build up and reaching a concentration of 4000 ppm until the opening window period (10:15 a.m.). During the opening window period, CO2 concentration decreased, but subsequently it increased again when the window was closed, reaching a value of 5500 ppm until the end of school day. Similar variations in CO2 and indoor particle number levels, related to the usage of classrooms, were observed in all the monitored classrooms.
Figure 2 shows the temporal variation of indoor particle number and CO2 concentrations within school hours in IS2 during spring. The outdoor particle number concentration measured over the same period within school hours is also reported.
Figure 2. Temporal variation of indoor particle number (Nin) and CO2 concentrations within school hours in IS2 during spring. The outdoor particle number concentration (Nout) and the periods during which window/door were “mostly open” are also indicated.
Atmosphere 06 01652 g002
The concentration of outdoor particle number measured in spring was observed to vary within school hours as found for winter, even though this was in a relatively narrow range.
Conversely, a greater variation of the indoor particles with respect to the outdoors was found in spring rather than in winter. In fact, as shown in Figure 2, indoor and outdoor particle concentrations were very similar and only higher in the indoors when window/door were “mostly open” (from 09:30 to 10:25 a.m. and from 10:45 to 13:00 p.m.). This could be due to a greater penetration of particles from outdoors as the windows were opened for a longer period. The Ni/Nout averaged ratio, for this analyzed classroom, was in fact higher in spring (1.08) than in winter (0.75).
Furthermore, a wider variability of indoor and outdoor levels with not simultaneous short period peaks was observed in Figure 2 between 10:45 a.m. to 13:00 p.m. During this period, windows/doors were reported to be “mostly open”, not continuously open. Therefore this variability was explained by the transient effect due to possible temporary window/door closing. The CO2 trend also suggested that short-terms window closings (and then sudden CO2 increases) were performed during that period causing this variation.
However, it should be noted that further investigations are required to fully explain this phenomenon, including indoor and outdoor particle size distributions and particle chemical composition. The CO2 concentration level fluctuated between minimum value of 500 ppm and maximum value of 1600 ppm without reaching the high levels found in winter. This was because the windows were kept open most of the time during school day. However, high CO2 values were detected when windows were mostly closed.
In Figure 3, the statistics (minimum value, 1st quartile, median, 3rd quartile, and maximum value) obtained from indoor and outdoor particle number, as well as the measured indoor CO2 concentrations in classrooms during school hours are given for winter and spring.
Figure 3. Minimum and maximum values, 1st (q1) and 3rd (Q3) quartile and median value of indoor (Ni) and outdoor (Nout) particle number concentrations as well as the measured indoor CO2 concentrations in classrooms during school hours for winter (W) and spring (S). Upper (U) and lower (L) whiskers were evaluated as U = Q3 + 1.5 × (Q3 − Q1) and L = Q1 − 1.5 × (Q3 − Q1), respectively. Measurement data higher than the “upper whisker” or lower than the “lower whisker” were considered outliers and are not showed here.
Atmosphere 06 01652 g003
The purpose of Figure 3 was to highlight the influence of airing (by opening windows) on the IAQ in classrooms in relation to indoor and outdoor particles and CO2 levels, giving an indication to the range of measured concentrations in all of the studied classrooms.
The median value of indoor concentration in winter (1.2 × 104 cm−3) was significantly lower than outdoors (1.7 × 104 cm−3). Similar variations were seen both in indoor and outdoor. This indicated the absence of main UFP indoor sources, as the building filtrated a substantial fraction of outdoor UFPs.
Conversely, the data of particle number concentrations were similar for both indoor and outdoor in spring, with median values equal to 9.9 × 103 cm−3. This indicated a higher degree of penetration of outdoor UFPs.
In terms of CO2 concentrations, the median values were lower in spring than in winter (900 and 1800 ppm, respectively) with higher variation in winter. The higher variation in winter was associated with the effect of windows opened for short periods of time during cold months.

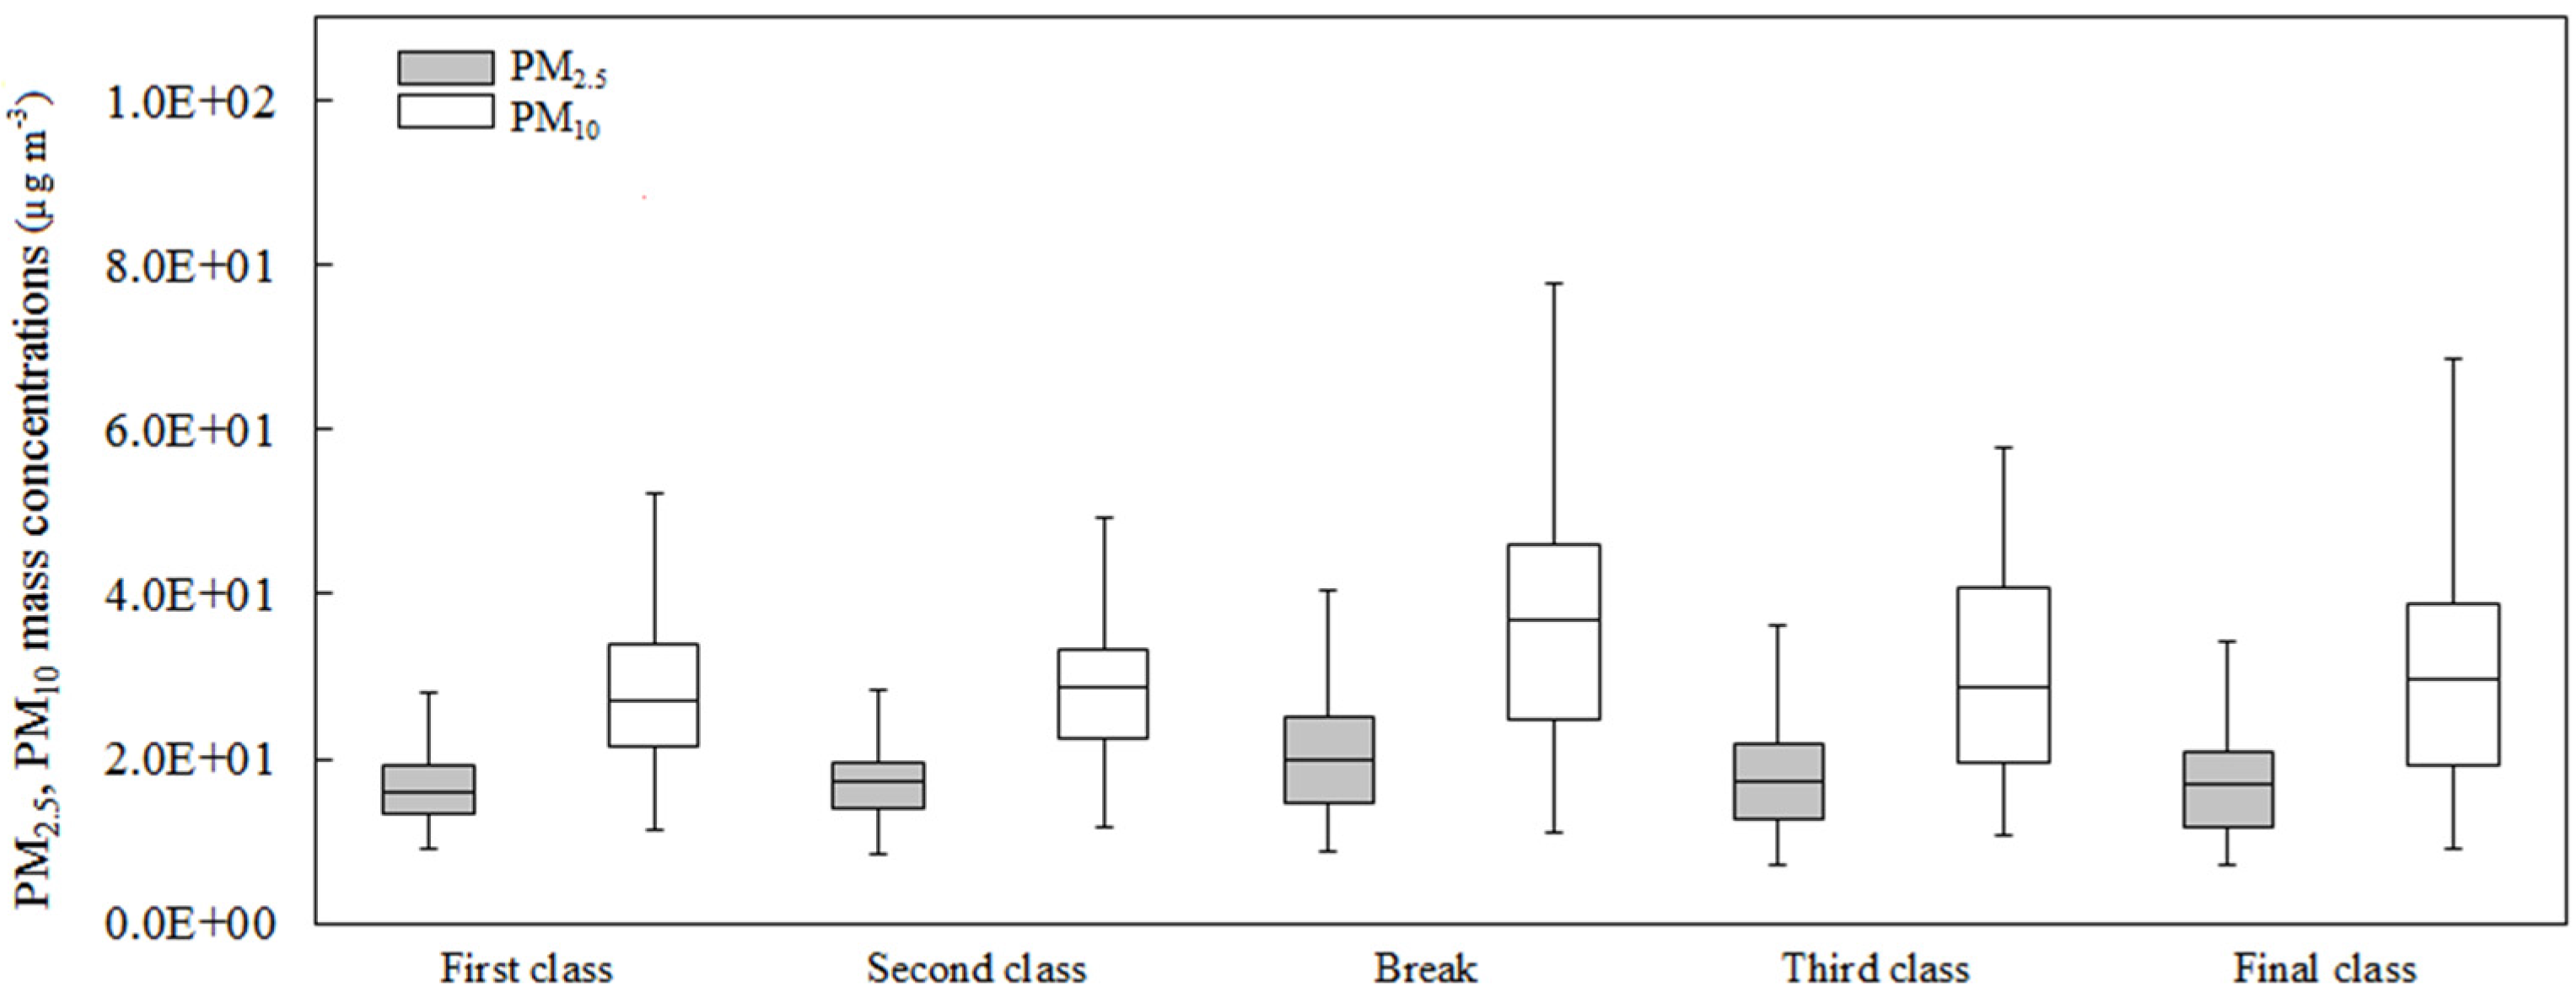
3.4. Indoor PM Concentrations within School Hours

To better identify the influence of indoor particle sources on the particle mass concentration, the indoor PM2.5 and PM10 concentrations measured at classrooms during spring were apportioned within each class of school day, including break time: the first class (08:30–09:30 a.m.) which includes the traffic peak time (08:30 a.m.), the second (09:30–10:15 a.m.), the break (10:15 to 10:30 a.m.), the third (10:30–11:30 a.m.) and the final class of school day (11:30 a.m.–13:00 a.m. for S1 and S2 and 11:30 a.m.–13:30 p.m. for S3).
Figure 4 shows the statistics (minimum value, 1st quartile, median, 3rd quartile, and maximum value) obtained from indoor PM2.5 and PM10 mass concentrations, measured in IS1, IS2, IS3, IS4 and IS5 in spring, within each class of school day.
Figure 4. Minimum and maximum values, 1st (Q1) and 3rd (Q3) quartile and median value of indoor PM2.5 and PM10 mass concentrations, measured in spring in IS1,IS2, IS3, IS4 and IS5 and apportioned within each class of school day. Upper (U) and lower (L) whiskers were evaluated as U = Q3 + 1.5 × (Q3 − Q1) and L = Q1 − 1.5 × (Q3 − Q1), respectively. Measurement data higher than the “upper whisker” or lower than the “lower whisker” were considered outliers and are not showed here.
Atmosphere 06 01652 g004
The median indoor PM2.5 mass concentrations for the first class, the second, the break, the third and the final one were, respectively, of 16, 17, 20, 17, 17 µg·m−3 while median PM10 values were of 27, 29, 37, 28 and 30 µg·m−3.
As shown in Figure 4, the highest particle mass concentrations were found during the break when major indoor activities occurred, rather than during class time when children were seated at their tables. The indoor activities performed during break time were: movement of children going in and out of the classrooms, and recreational activities inside the building (as running, playing and eating their morning lunch inside classrooms).
High values of PM10 were also detected during the final class of school day, before the children’s departure, highlighting the effect of the indoor activities on the indoor PM concentrations.
Moreover, increases of PM10 concentrations were higher than PM2.5 during break time and the final class, and higher variations were also observed. A significant concentration of coarse particle fraction, PM2.5–10 was found especially during break time (17 µg·m−3 as median value). Considering the major movement of children and recreational activities during break time, the significant concentration of coarse particle fraction found during this period could indicate the effect of the re-suspension phenomena of particles previously emitted by writing with chalk and organic matter of children. This result was also in accordance with the evidence of re-suspension phenomena due to children’s movements and physical activities in schools recently reported in the literature [70]; for example, Buonanno et al., 2012 found that the particle re-suspension produced by the activity of exercising pupils was the dominant source in 12 schools gyms in Cassino and, among the various PM fractions, the effect on coarse particles, was found to be the most important with concentrations of 4.8 ± 2.0 times higher than the background (outdoor) [71].

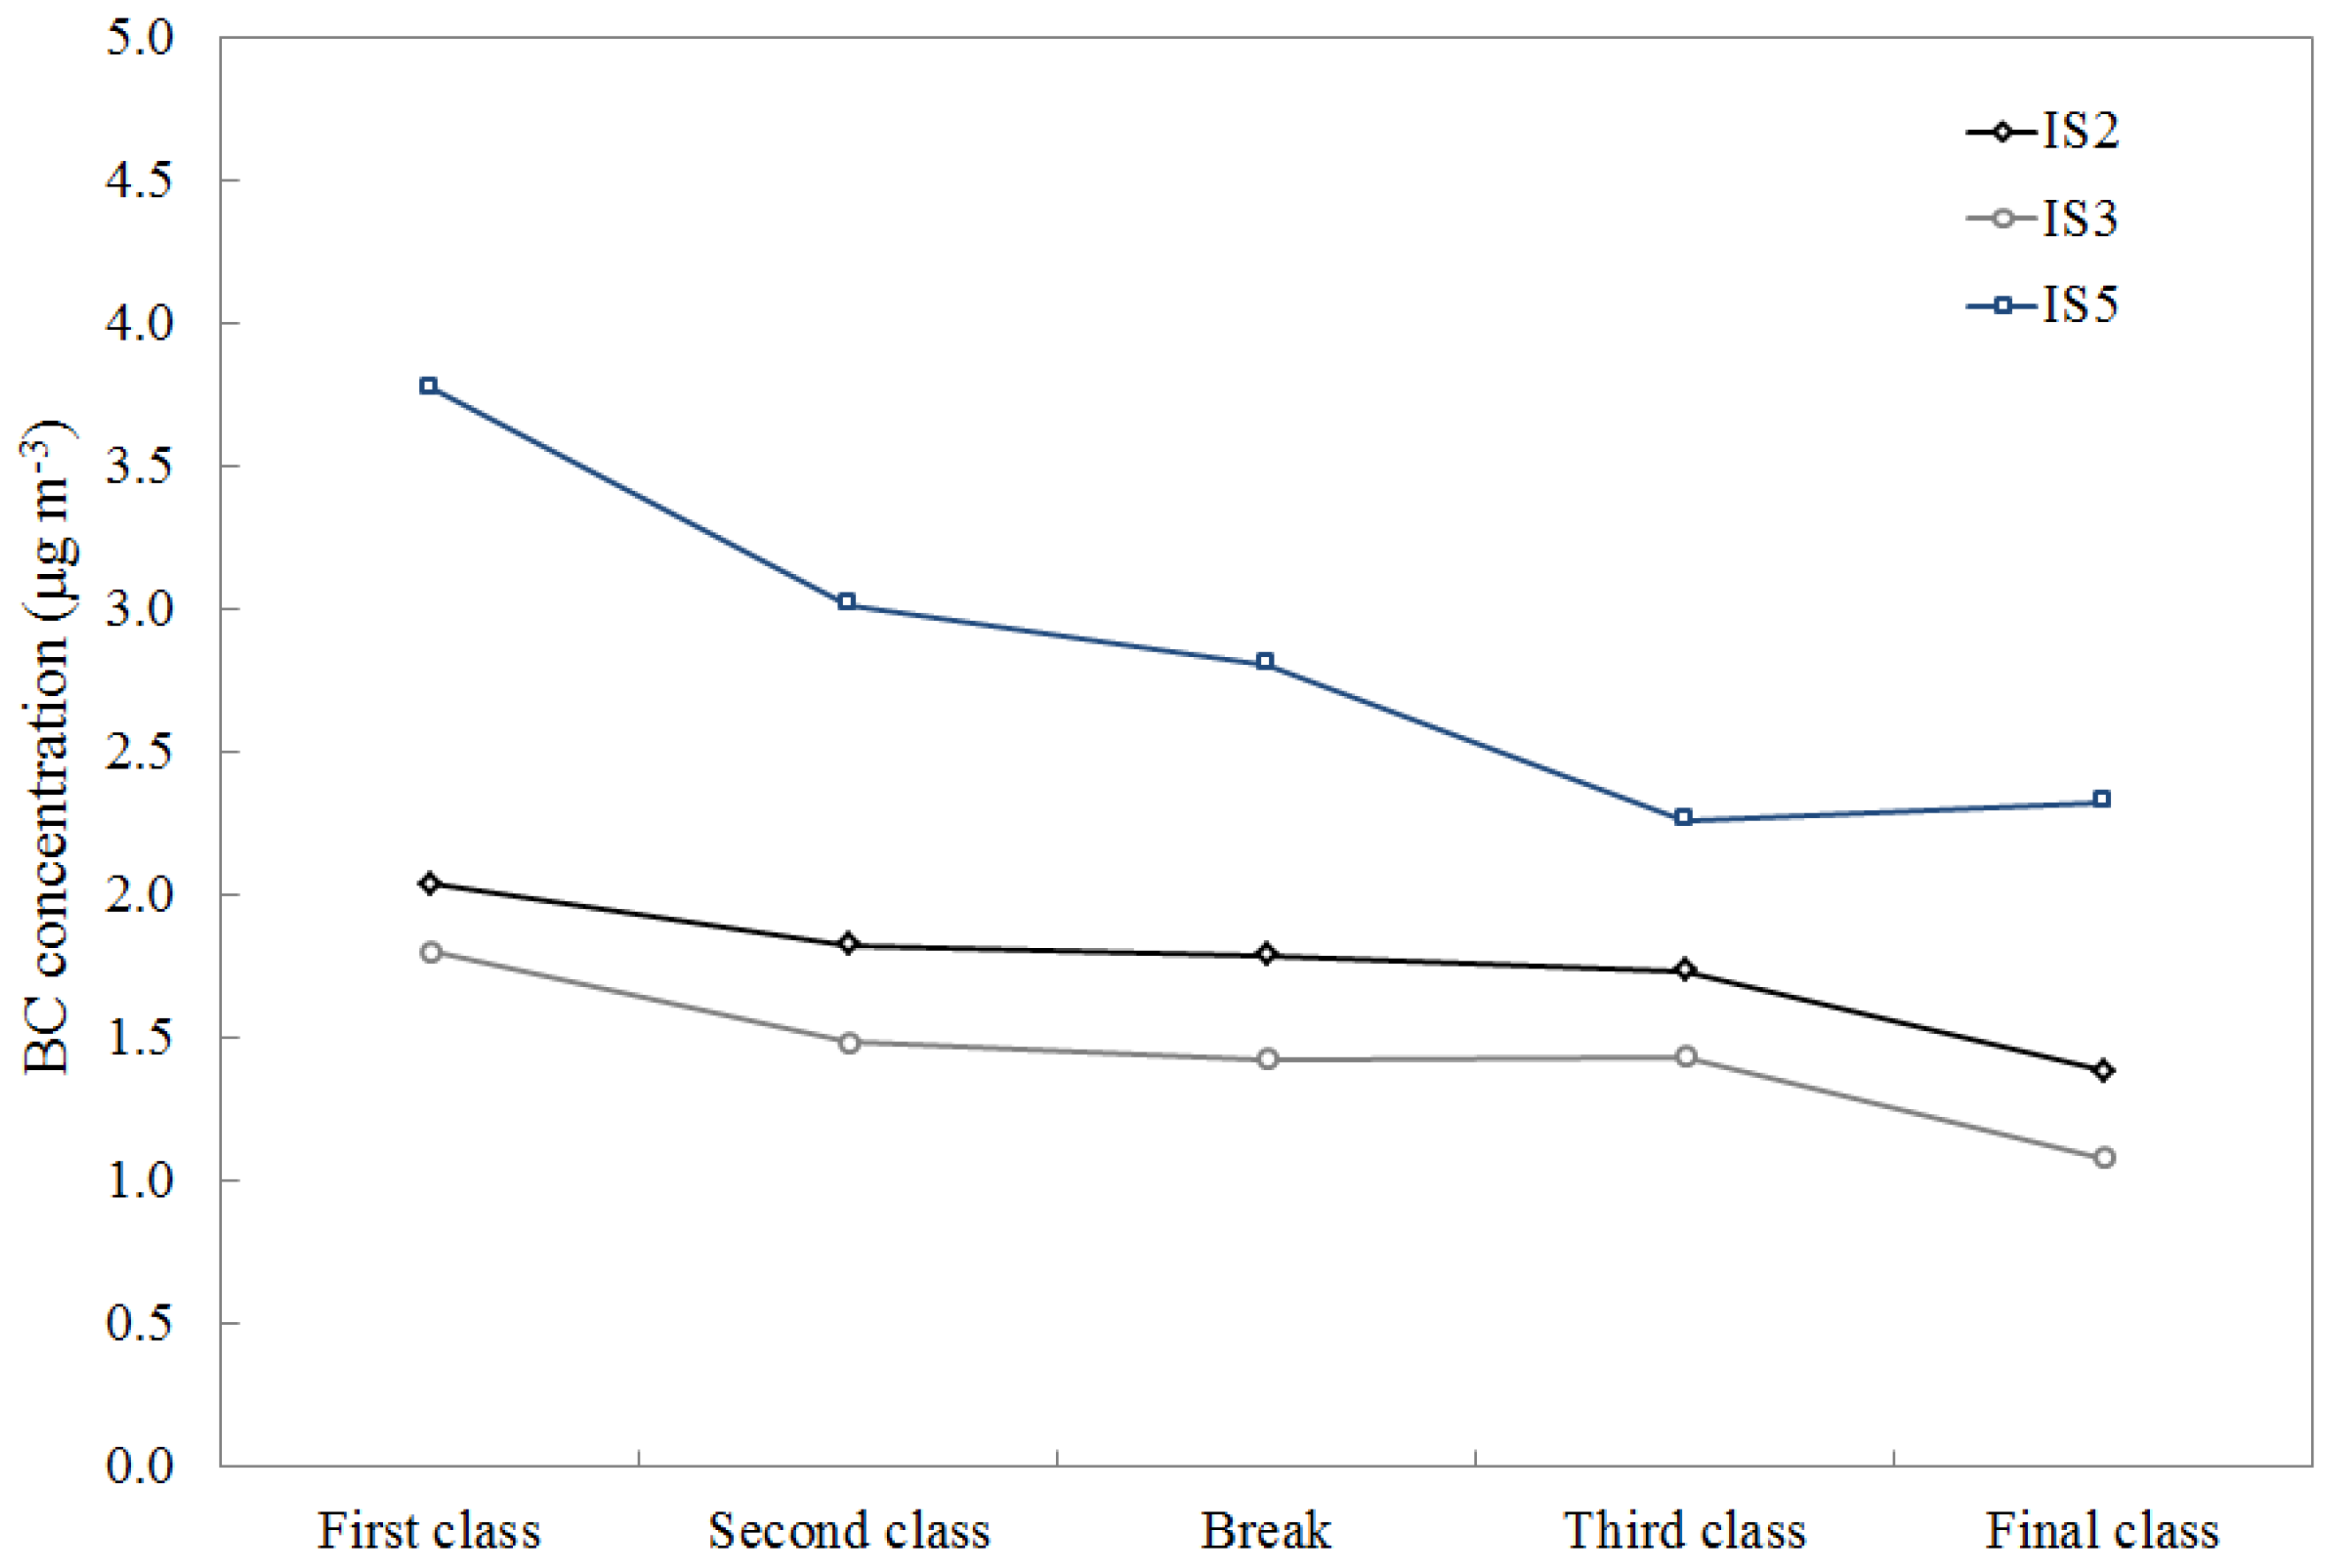
3.5. BC Concentrations within School Hours

In order to better assess the influence of outdoor particle sources on the indoor concentrations, the indoor BC concentrations measured at school classrooms during spring were also apportioned within each class of school day, including break time: the first class (08:30–09:30 a.m.) which includes the traffic peak time (08:30 a.m.), the second (09:30–10:15 a.m.), the break (10:15 to 10:30 a.m.), the third (10:30–11:30 a.m.) and the final class of school day (11:30 a.m.–13:00 p.m. for S1 and S2 and 11:30 a.m.–13:30 p.m. for S3).
BC concentration data, averaged on the duration of each class, for the three monitored classrooms (IS2, IS3 and IS5) are shown in Figure 5.
Figure 5. Average values of BC concentrations within the duration of each class of school day for IS2, IS3 and IS5.
Atmosphere 06 01652 g005
The highest BC concentrations were found at the classroom IS5 of school S3 that was located on the road with the highest traffic conditions in respect to the others classrooms (IS2 and IS3) indicating the relationship between the spatial variation of BC with the location of the schools and thus, its proximity to high traffic conditions.
Furthermore, the highest values of BC occurred, for all the classrooms, during the first class of school day coinciding with morning traffic peak hour (08:30 a.m.). Also, among the analyzed classrooms, the highest BC value was found at IS5 (3.8 µg·m−3). Considering BC concentrations are a proxy of traffic emissions [72,73], this result suggested further support that indoor particle level in classrooms was greatly affected by traffic emissions.

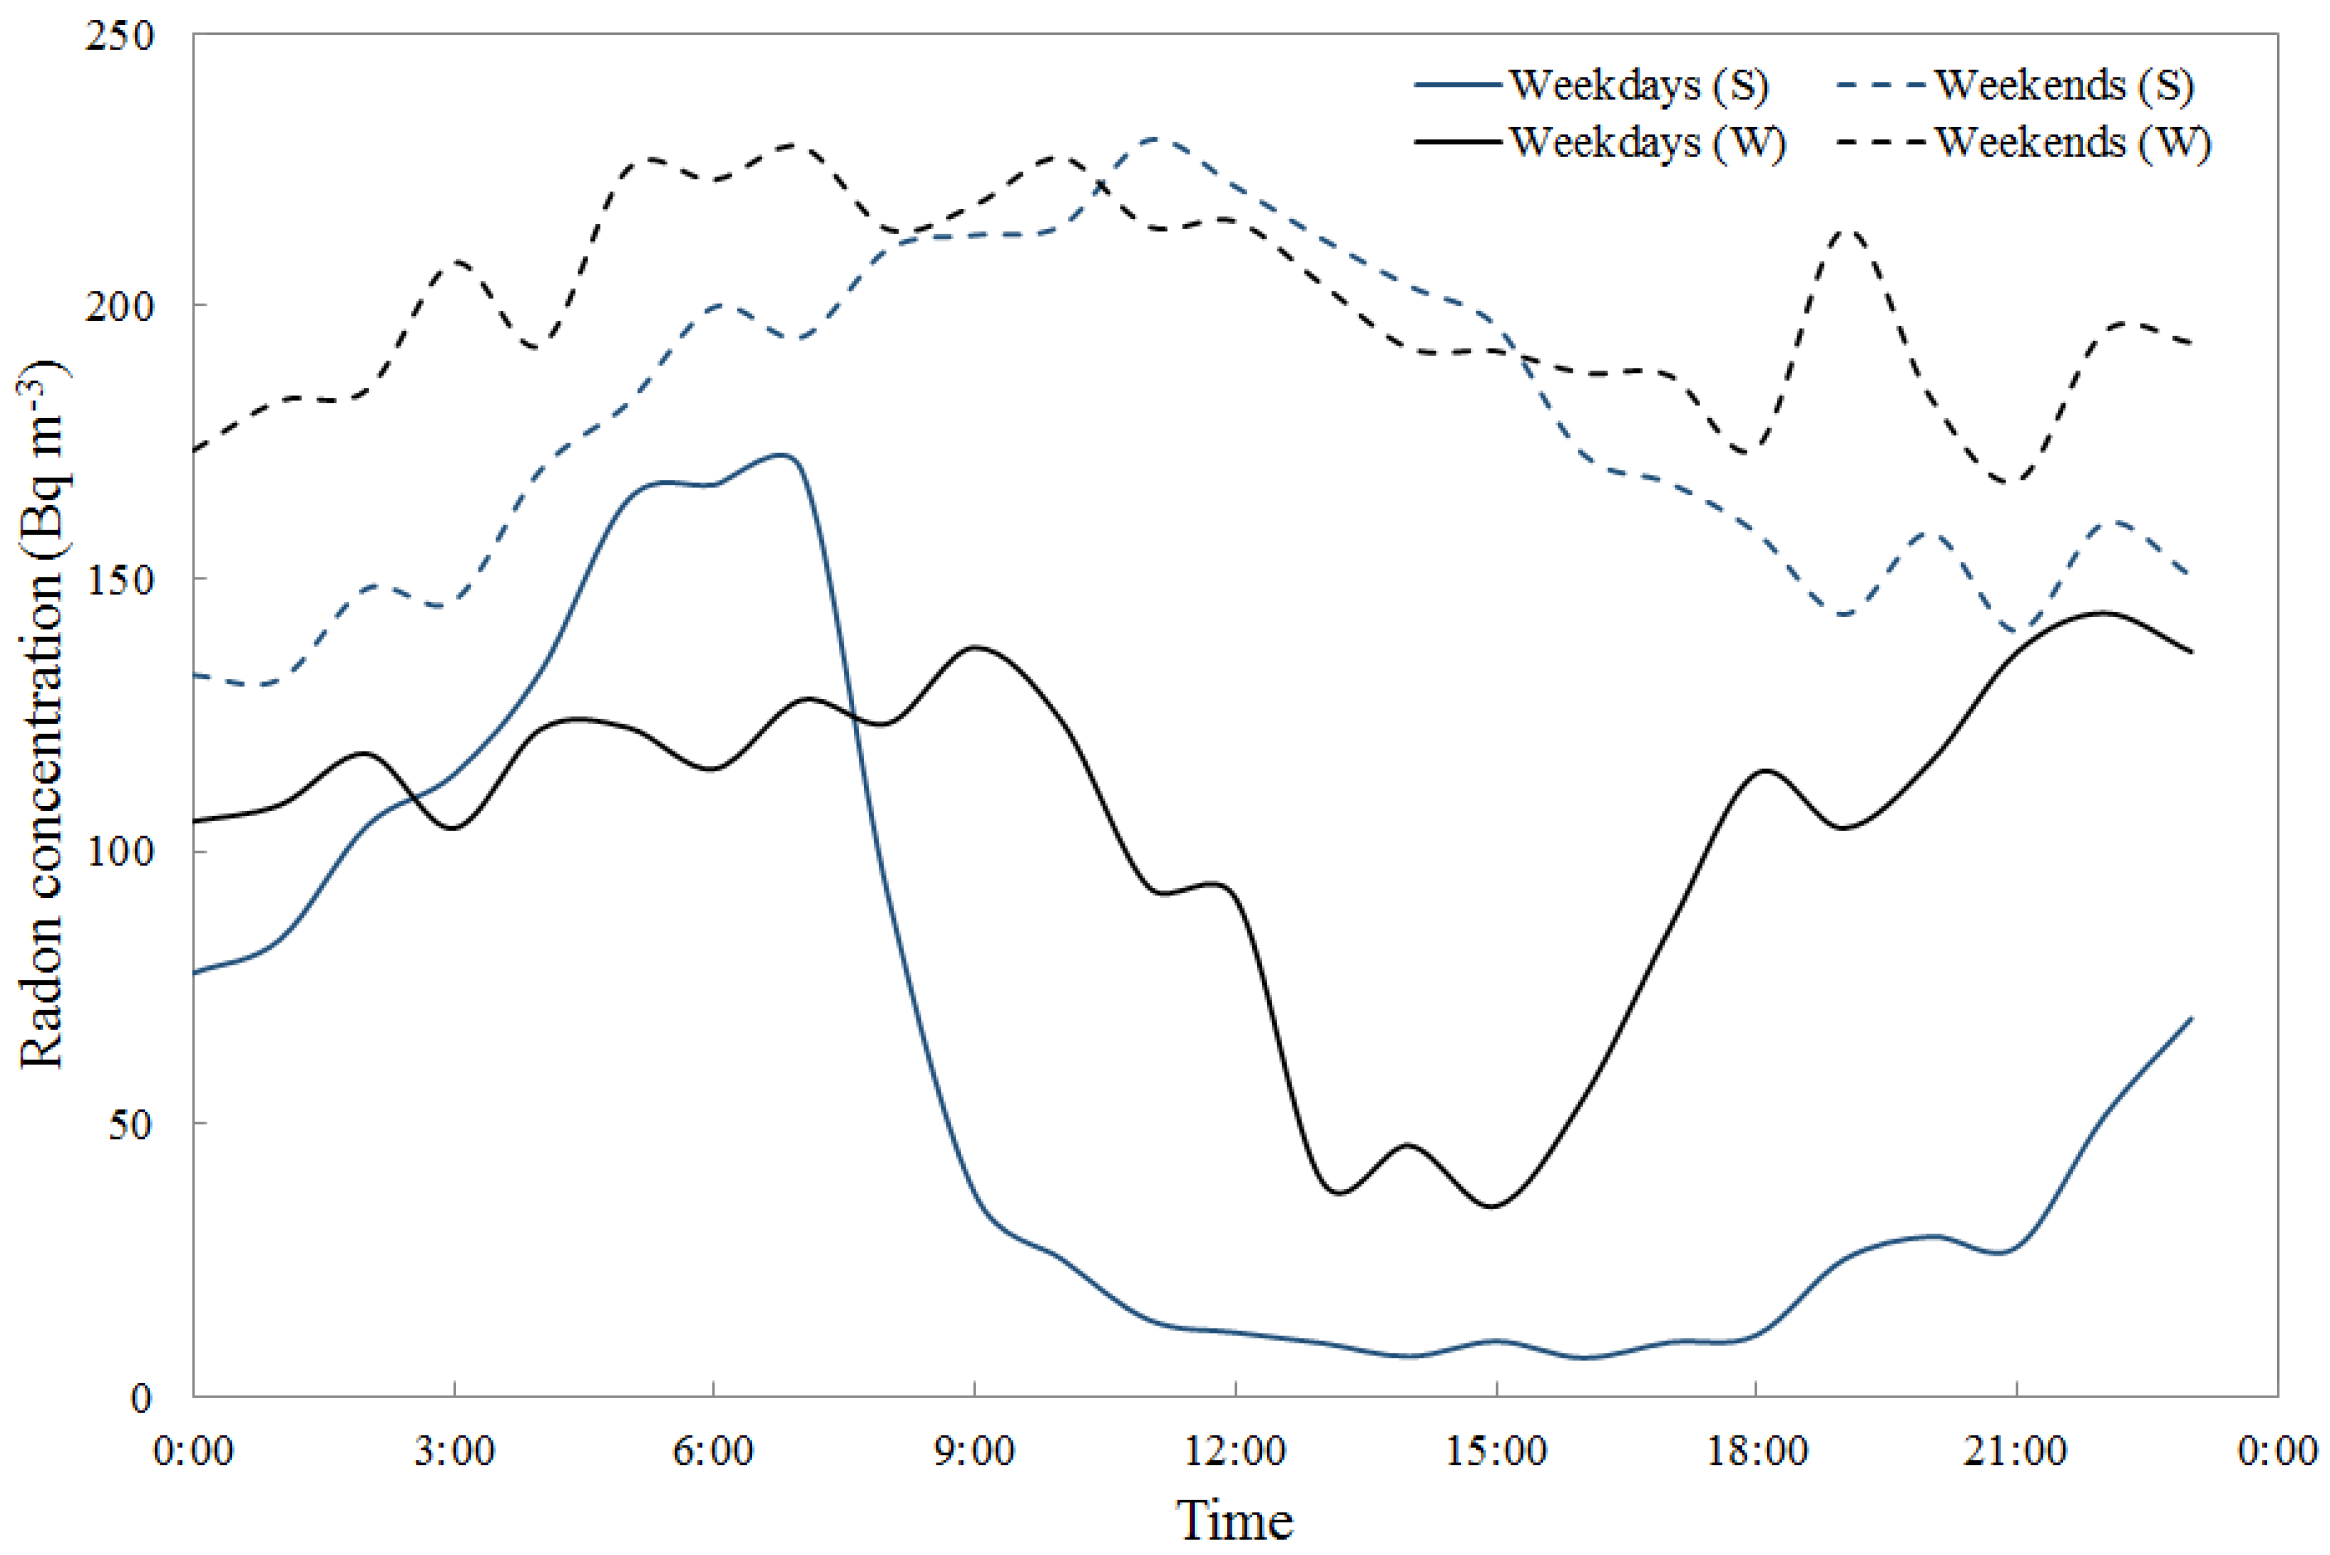
3.6. Characteristics of Radon Concentration

In order to investigate the influence of airing on radon levels in classrooms, the radon concentrations were measured within school hours and 24 h in weekdays and during weekends. Table 5 summarizes the averaged school hours and 24 h radon concentrations measured at IS1, IS5 and IS6 during winter and spring campaigns.
Table 5. School-hours and 24-h average radon concentrations for IS1, IS5 and IS6 for weekdays and weekends during winter and spring campaigns.
ClassroomRadon Concentrations (Bq·m−3)
Story LevelSeasonWeekdays (School Hours)Weekdays (24 h)
IS1Ground floorW174 ± 63156 ± 58
S41 ± 48115 ± 128
IS5Ground floorW29 ± 925 ± 9
S
IS6Ground floorW21 ± 1228 ± 9
S24 ± 1228 ± 16
On weekdays, the averaged 24 h radon concentrations ranged from 25 to 156 Bq·m−3 between the investigated classrooms, while the averaged school hours values varied from 21 to 174 Bq·m−3. The school hours and 24-h average radon concentrations complied with the European limit reference value, which is 300 Bq·m−3 [74].
In addition to the averaged values of radon concentrations measured at schools, the authors also aimed to investigate the influence of airing on indoor radon levels within school hours between winter and spring season. For this purpose, 1-h time resolution of radon concentrations measured on weekdays and weekends in the monitored classrooms were analyzed.
In Figure 6, the daily trends of radon concentration, calculated using all the data collected at IS1, IS5 and IS6 classrooms are reported for weekdays and weekends during winter and spring season.
Figure 6. Average daily trends of indoor radon concentration, as measured in the classrooms (IS1, IS5 and IS6) on weekdays and weekends during winter (W) and spring (S).
Atmosphere 06 01652 g006
As expected, radon concentrations were continuously high in winter and spring during weekends. Conversely, during weekdays, decreases were observed upon school opening and they were markedly higher in spring than in winter.
For this purpose, the reduction of radon concentration within school hours (08:30–13:00 p.m.), with respect to school opening hour was evaluated; it was found to be 81% in spring and 21% in winter. The greater reduction, seen in spring, was associated with longer opening window period rather than the short window opening periods in winter. This result confirmed the effect of different seasons’ airing mode on the reduction of radon concentrations within school hours.

4. Discussion

This study investigated the indoor air quality in Italian naturally ventilated classrooms. For this purpose, particle number and mass concentrations, black carbon, CO2, and radon levels were measured in indoor classrooms and data were given within school hours for winter and spring season. In order to evaluate the relationship of indoor and outdoor number based particles, the outdoor particle number concentration was also measured. The influence of indoor and outdoor sources as well as the effect of airing on indoor pollutants was analyzed.
As expected, this study found the outdoor particle number concentrations at schools were related to the peak traffic times, and also higher in winter than in spring, according to the background pattern of particle number concentration (city scale) in Cassino reported in a previous study [39].
The concentrations of indoor particle number were also found to be higher in winter than in spring. Few studies have reported average indoor particle number concentration levels during school hours. Zhang and Zhu [42] reported average indoor and outdoor particle number concentrations of 0.6 ± 29.3 × 103 cm−3 and 1.6 ± 16.0 × 103 cm−3 respectively, for five schools with different ventilation systems in South Texas. While in Ontario, Weichenthal et al. [75] found averaged values of 5.0 × 10³ (indoors) and 9.0 × 103 cm−3 (outdoors) for 37 classrooms areas during wintertime. Fromme et al. [63] reported daily averaged indoor levels of 6.5 × 103 cm−3, measured in 36 schools in Munich, while Guo et al. [46] reported an average of 3.2 × 103 cm−3 (indoors) and 2.6 × 103 cm−3 (outdoors) from one school in Brisbane. The indoor and outdoor levels in 39 schools in Barcelona were respectively, 1.88 × 104 cm−3 and 2.31 × 104 cm−3 in spring and 1.37 × 104 cm−3 and 2.35 × 104 cm−3 in winter [76]. It is difficult to make a direct comparison, because of different sampling time and measuring instrument used (with different lowest particle size limit) between studies. However, the concentrations found in this study tended to be higher than those reported in the studies mentioned above, except for the study performed in Barcelona.
In relation to PM levels, results found in this study were similar to studies carried out in schools in Germany and in Poland, which reported averaged indoor PM2.5 concentrations, respectively, of 22 µg·m−3 [63], and 14 µg·m−3 [77] during warm season, and it was lower than those reported in classrooms in Northern Italy [78]. Furthermore, this study highlighted that coarse particle fraction could reflect the indoor activities better than the finer fraction, since high coarse particle levels were found during break time of the school day, when the majority of children’s movements and activities occurred. Similar values of PM2.5 and PM1 indicated the influence of outdoor combustion source, and this suggested PM1 was a better indicator for vehicular emissions than PM2.5.
The influence of traffic emissions on indoor levels was also highlighted in this study by the highest indoor BC concentration, which was detected at the classroom with the highest traffic impact and during the first class of school day (including the morning traffic peak time). In addition, averaged indoor BC concentrations recorded in this study (2.0 ± 0.8 µg·m−3) were similar to other studies carried out in European school classrooms, which found equivalent black carbon, EBC ranged from 1.5 to 2.0 µg·m−3 [76,79,80].
The authors point out that the PM and BC concentrations discussed in this study were measured during the experimental campaign carried out in spring season. Data were not available for the winter season, which was when higher particles concentrations were expected. It was therefore, recommended to carry out further investigation on this matter.
No significant indoor UFP sources were detected within the school hours, even though possible contributions to indoor formation of secondary particles and/or activities like painting, or printers (placed in others rooms) was not considered in this analysis.
Regarding the relationship between indoor and outdoor particles, particle number concentrations were usually higher outdoors than indoors, indicating that no major indoor UFP sources were in operation during the experimental campaign. Therefore, indoor particle number concentrations were consequently driven by outdoor particles (mainly from traffic emissions). However, averaged ratios of indoor to outdoors particle concentrations were higher in spring than in winter. When temporal variations of indoor and outdoor particle concentrations were considered, it was found that the airing directly influenced the relationship between indoor and outdoor particles and CO2 levels. In particular, this study found Ni/Nout ratio of 0.85 ± 0.10 in winter associated with a low airing (short opening window periods and low frequency), while Ni/Nout ratio of 1.00 ± 0.15 in spring was associated with a longer airing (longer opening window periods and low frequency). The increase of Ni/Nout ratio in spring was related to a much higher degree of penetration of outdoor particles from traffic (due to longer opening window periods). Conversely, Ni/Nout ratios found in winter was comparable with the average penetration ratios (0.6–0.9) based on infiltrating airflows through leakage reported in previous studies [44,81,82].
In relation to the CO2 levels, lower indoor CO2 values were found in spring (due to longer window opening periods), however high concentrations were also measured when children were in classrooms with windows closed, this indicated that the longer airing was insufficient to maintain good air quality during the full school day, even if the windows were kept open for most of the school time. Conversely, high indoor CO2 values were found in winter (due to the low airing) within school hours. Short opening window periods led to short-term decrease in CO2. Moreover, the averaged CO2 values found in this study were similar to the majority of studies carried out in European naturally ventilated schools, ranging from 600 to 1500 ppm [83,84,85,86,87].
The influence of airing was also detected, in terms of indoor radon concentrations within school hours. Significant reductions (81%) of radon concentrations were found when the windows were opened for a longer period of time. The averaged school-hours radon concentrations found in this study complied with the European limit reference value, which is 300 Bq·m−3 [74]. However, a reference level of 100 Bq·m−3 has been proposed by the World Health Organization (WHO) in order to minimize the health hazards due to radon exposure [53].
In the light of these results, it can be concluded that the mechanism of ventilation based on the airing in classrooms was not efficient, as it significantly influenced the penetration of outdoor particles in classrooms. Additionally, it was not effective in ensuring good air quality at all times in a full school day, in terms of indoor CO2 concentrations.
To this purpose, the use of new and more efficient ventilation strategies should be adopted in order to guarantee the minimum requirements for acceptable indoor air quality levels in classrooms, and to prevent children’s exposure to risk. Instead of opening window with low frequency or keeping the window open for quite a long period of time, the best method of airing could be short opening time and a relatively high opening frequency, also mentioned by Heiselberg and Perino [88], which highlighted the transient behavior of short-term window airing reporting that it was most effective at the beginning. Alternatives could also be the integrations with natural ventilation devices such as motorized windows and louvers, or the installation of “CO2 traffic lights” in classrooms in order to alert teachers to open windows when the CO2 concentration reaches the limit value.

5. Conclusions

Epidemiological studies have shown a clear association between urban UFP exposures and adverse health outcomes. Few studies have reported indoor particle number concentrations at school classrooms, and there is a lack of understanding between the relationship of the levels and influential factors. Since children represent the most susceptible group to air pollution, studies focusing on the IAQ in schools need to be developed in order to address these issues.
In this context, indoor measurements for number and mass concentration, black carbon, CO2, and radon levels were carried out in six classrooms of three schools located in the urban area of Cassino.
Indoor and outdoor sources as well as the effect of airing were discussed to explain the variability of indoor air pollutant levels.
The main results from this study can be summarized as follows:
-
The concentrations of indoor particle number within school hours were mainly influenced by the concentrations of outdoor particle number. This was attributed to two aspects:
  • The proximity of schools to trafficked roads: the averaged indoor and outdoor particle concentrations were higher at school that was placed near the highest traffic conditions. Highest indoor BC values were also detected during the first class of school day coinciding with morning traffic peak hour. This result underlined the impact of urban planning decisions on children’s exposure to particles from traffic emissions.
  • The effect of airing: differences in terms of Ni/Nout ratios were found between the cold and warm season, this indicated the influence of penetration of outdoor particles. Ratio value of 0.85 ± 0.10 was found in winter under short opening window periods and low opening frequency; this was comparable with penetration ratios (0.6–0.9), based on infiltrating airflows through leakage reported in previous studies. While in spring, the Ni/Nout ratio was 1.00 ± 0.15, under longer opening window periods and low opening frequency, and this was related to a higher degree of penetration of outdoor particles.
-
Higher level of CO2 was recorded in classrooms in winter than in spring. However, the airing that was performed by the occupants, was not effective neither in winter nor in spring at maintaining good air quality (CO2 < 1000 ppm) in classrooms at all time during a full school day.
-
Children movement and recreational activities led to re-suspension of mainly indoor coarse particles and greatly contributed to the increase of PM10 in classrooms especially during break time. Large particles indeed appeared to play a greater role in PM exposure in classrooms than the finer fraction. PM2.5 was also found to be very close to PM1, indicating PM1 was a better indicator for traffic emission in school classrooms.
-
A greater reduction of radon concentrations (81%) was found, within school hours in spring. This was associated with longer opening window period rather than the short window opening periods in winter.

Acknowledgment

Fernanda Carmen Fuoco was supported by 2015 Endeavour Fellowship—Australian Government, Department of Education. The authors thank school principals and teachers for their help and cooperation.

Author Contributions

Fernanda Carmen Fuoco and Luca Stabile: experimental campaign, data analysis and interpretation, manuscript writing. Giorgio Buonanno: scientific supervisor of the experimental campaign, data interpretation and manuscript writing. Concepcion Vargas Trassiera and Angelamaria Massimo: experimental campaign, data treatment and quality control. Aldo Russi: administration, experimental campaign, and data treatment. Mandana Mazaheri, Lidia Morawska, and Alexandro Andrade: data interpretation and manuscript writing.

References

  1. Buonanno, G.; Giovinco, G.; Morawska, L.; Stabile, L. Tracheobronchial and alveolar dose of submicrometer particles for different population age groups in Italy. Atmos. Environ. 2011, 45, 6216–6224. [Google Scholar] [CrossRef] [Green Version]
  2. Kotzias, D.; Geiss, O.; Tirendi, S.; Josefa, B.M.; Reina, V.; Gotti, A.; Graziella, C.R.; Casati, B.; Marafante, E.; Sarigiannis, D. Exposure to multiple air contaminants in public buildings, schools and kindergartens-the european indoor air monitoring and exposure assessment (airmex) study. Fresenius Environ. Bull. 2009, 18, 670–681. [Google Scholar]
  3. Mendell, M.J.; Heath, G.A. Do indoor pollutants and thermal conditions in schools influence student performance? A critical review of the literature. Indoor Air 2005, 15, 27–52. [Google Scholar] [CrossRef] [PubMed]
  4. Boldo, E.; Medina, S.; LeTertre, A.; Hurley, F.; Mücke, hG.; Ballester, F.; Aguilera, I.; Eilstein, D. Apheis: Health impact assessment of long-term exposure to PM2.5 in 23 European cities. Eur. J. Epidemiol. 2006, 21, 449–458. [Google Scholar] [CrossRef] [PubMed]
  5. Pope Iii, C.A.; Burnett, R.T.; Thun, M.J.; Calle, E.E.; Krewski, D.; Ito, K.; Thurston, G.D. Lung cancer, cardiopulmonary mortality, and long-term exposure to fine particulate air pollution. J. Am. Med. Assoc. 2002, 287, 1132–1141. [Google Scholar] [CrossRef]
  6. Jerrett, M.; Burnett, R.T.; Ma, R.; Arden Pope Iii, C.; Krewski, D.; Newbold, K.B.; Thurston, G.; Shi, Y.; Finkelstein, N.; Calle, E.E.; et al. Spatial analysis of air pollution and mortality in Los Angeles. Epidemiology 2005, 16, 727–736. [Google Scholar] [CrossRef] [PubMed]
  7. Krewski, D.; Jerrett, M.; Burnett, R.T.; Ma, R.; Hughes, E.; Shi, Y. Extended follow-up and spatial analysis of the american cancer society study linking particulate air pollution and mortality. Available online: http://scientificintegrityinstitute.net/Krewski052108.pdf (accessed on 22 September 2015).
  8. Lepeule, J.; Laden, F.; Dockery, D.; Schwartz, J. Chronic exposure to fine particles and mortality: An extended follow-up of the harvard six cities study from 1974 to 2009. Environ. Health Perspect. 2012, 120, 965–970. [Google Scholar] [CrossRef] [PubMed]
  9. Pope Iii, C.A.; Dockery, D.W. Health effects of fine particulate air pollution: Lines that connect. J. Air Waste Manag. Assoc. 2006, 56, 709–742. [Google Scholar] [CrossRef]
  10. Jaques, P.A.; Kim, C.S. Measurement of total lung deposition of inhaled ultrafine particles in healthy men and women. Inhal. Toxicol. 2000, 12, 715–731. [Google Scholar] [PubMed]
  11. Anderson, H.R.; Bremner, S.A.; Atkinson, R.W.; Harrison, R.M.; Walters, S. Particulate matter and daily mortality and hospital admissions in the west midlands conurbation of the United Kingdom: Associations with fine and coarse particles, black smoke and sulphate. Occupat. Environ. Med. 2001, 58, 504–510. [Google Scholar] [CrossRef]
  12. Janhäll, S.; Molnar, P.; Hallquist, M. Traffic emission factors of ultrafine particles: Effects from ambient air. J. Environ. Monit. 2012, 14, 2488–2496. [Google Scholar] [CrossRef] [PubMed]
  13. Cho, M.; Cho, W.S.; Choi, M.; Kim, S.J.; Han, B.S.; Kim, S.H.; Kim, H.O.; Sheen, Y.Y.; Jeong, J. The impact of size on tissue distribution and elimination by single intravenous injection of silica nanoparticles. Toxicol. Lett. 2009, 189, 177–183. [Google Scholar] [CrossRef] [PubMed]
  14. Unfried, K.; Albrecht, C.; Klotz, L.O.; Von Mikecz, A.; Grether-Beck, S.; Schins, R.P.F. Cellular responses to nanoparticles: Target structures and mechanisms. Nanotoxicology 2007, 1, 52–71. [Google Scholar] [CrossRef]
  15. Cesaroni, G.; Badaloni, C.; Gariazzo, C.; Stafoggia, M.; Sozzi, R.; Davoli, M.; Forastiere, F. Long-term exposure to urban air pollution and mortality in a cohort of more than a million adults in Rome. Environ. Health Perspect. 2013, 121, 324–331. [Google Scholar] [CrossRef] [PubMed]
  16. Stölzel, M.; Breitner, S.; Cyrys, J.; Pitz, M.; Wölke, G.; Kreyling, W.; Heinrich, J.; Wichmann, H.E.; Peters, A. Daily mortality and particulate matter in different size classes in Erfurt, Germany. J. Exposure Sci. Environ. Epidemiol. 2007, 17, 458–467. [Google Scholar] [CrossRef] [PubMed]
  17. Atkinson, R.W.; Anderson, H.R.; Sunyer, J.; Ayres, J.; Baccini, M.; Vonk, J.M.; Boumghar, A.; Forastiere, F.; Forsberg, B.; Touloumi, G.; et al. Acute effects of particulate air pollution on respiratory admissions: Results from aphea 2 project. Am. J. Respir. Crit. Care Med. 2001, 164, 1860–1866. [Google Scholar] [CrossRef] [PubMed]
  18. Frampton, M.W. Systemic and cardiovascular effects of airway injury and inflammation: Ultrafine particle exposure in humans. Environ. Health Perspect. 2001, 109, 529–532. [Google Scholar] [CrossRef] [PubMed]
  19. Oberdörster, G.; Celein, R.M.; Ferin, J.; Weiss, B. Association of particulate air pollution and acute mortality: Involvement of ultrafine particles? Inhal. Toxicol. 1995, 7, 111–124. [Google Scholar] [CrossRef] [PubMed]
  20. Stone, V.; Brown, D.M.; Watt, N.; Wilson, M.; Donaldson, K.; Ritchie, H.; MacNee, W. Ultrafine particle-mediated activation of macrophages: Intracellular calcium signaling and oxidative stress. Inhal. Toxicol. 2000, 12, 345–351. [Google Scholar] [CrossRef] [PubMed]
  21. Timblin, C.R.; Shukla, A.; Berlanger, I.; BeruBe, K.A.; Churg, A.; Mossman, B.T. Ultrafine airborne particles cause increases in protooncogene expression and proliferation in alveolar epithelial cells. Toxicol. Appl. Pharmacol. 2002, 179, 98–104. [Google Scholar] [CrossRef] [PubMed]
  22. Kulmala, M.; Vehkamäki, H.; Petäjä, T.; Dal Maso, M.; Lauri, A.; Kerminen, V.M.; Birmili, W.; McMurry, P.H. Formation and growth rates of ultrafine atmospheric particles: A review of observations. J. Aerosol Sci. 2004, 35, 143–176. [Google Scholar] [CrossRef]
  23. Morawska, L.; Ristovski, Z.; Jayaratne, E.R.; Keogh, D.U.; Ling, X. Ambient nano and ultrafine particles from motor vehicle emissions: Characteristics, ambient processing and implications on human exposure. Atmos. Environ. 2008, 42, 8113–8138. [Google Scholar] [CrossRef] [Green Version]
  24. Buonanno, G.; Dell’Isola, M.; Stabile, L.; Viola, A. Uncertainty budget of the SMPS-APS system in the measurement of PM1, PM2.5, and PM10. Aerosol Sci. Technol. 2009, 43, 1130–1141. [Google Scholar] [CrossRef] [Green Version]
  25. Sundell, J. On the history of indoor air quality and health. Indoor Air Suppl. 2004, 14, 51–58. [Google Scholar] [CrossRef] [PubMed]
  26. Schneider, T.; Sundell, J.; Bischof, W.; Bohgard, M.; Cherrie, J.W.; Clausen, P.A.; Dreborg, S.; Kildesø, J.; Kjærgaard, S.K.; Løvik, M.; et al. “Europart”. Airborne particles in the indoor environment. A European interdisciplinary review of scientific evidence on associations between exposure to particles in buildings and health effects. Indoor Air 2003, 13, 38–48. [Google Scholar] [CrossRef] [PubMed]
  27. Daisey, J.M.; Angell, W.J.; Apte, M.G. Indoor air quality, ventilation and health symptoms in schools: An analysis of existing information. Indoor Air 2003, 13, 53–64. [Google Scholar] [CrossRef] [PubMed]
  28. Godwin, C.; Batterman, S. Indoor air quality in michigan schools. Indoor Air 2007, 17, 109–121. [Google Scholar] [CrossRef] [PubMed]
  29. Jones, B.M.; Kirby, R. Indoor air quality in U.K. School classrooms ventilated by natural ventilation windcatchers. Int. J. Vent. 2012, 10, 323–338. [Google Scholar]
  30. Jurado, S.R.; Bankoff, A.D.P.; Sanchez, A. Indoor air quality in brazilian universities. Int. J. Environ. Res. Public Health 2014, 11, 7081–7093. [Google Scholar] [CrossRef] [PubMed]
  31. Colgan, P.A.; Madden, J.S.; Synnott, H.; Fennell, S.; Pollard, D.; Fenton, D. Current status of programmes to measure and reduce radon exposure in irish workplaces. J. Radiol. Prot. 2004, 24, 121–129. [Google Scholar] [CrossRef] [PubMed]
  32. Ennemoser, O.; Schneider, P.; Ambach, W.; Brunner, P. Increased radon concentrations in classrooms used for pottery workshops. Sci. Total Environ. 1992, 116, 291–295. [Google Scholar] [CrossRef]
  33. Blondeau, P.; Iordache, V.; Poupard, O.; Genin, D.; Allard, F. Relationship between outdoor and indoor air quality in eight French schools. Indoor Air 2005, 15, 2–12. [Google Scholar] [CrossRef] [PubMed]
  34. Diapouli, E.; Chaloulakou, A.; Spyrellis, N. Indoor and outdoor particulate matter concentrations at schools in the Athens area. Indoor Built Environ. 2007, 16, 55–61. [Google Scholar] [CrossRef]
  35. Fromme, H.; Diemer, J.; Dietrich, S.; Cyrys, J.; Heinrich, J.; Lang, W.; Kiranoglu, M.; Twardella, D. Chemical and morphological properties of particulate matter (PM10, PM2.5) in school classrooms and outdoor air. Atmos. Environ. 2008, 42, 6597–6605. [Google Scholar] [CrossRef]
  36. Heudorf, U.; Neitzert, V.; Spark, J. Particulate matter and carbon dioxide in classrooms - the impact of cleaning and ventilation. Int. J. Hyg. Environ. Health 2009, 212, 45–55. [Google Scholar] [CrossRef] [PubMed]
  37. Janssen, N.A.H.; Hoek, G.; Harssema, H.; Brunekreef, B. Childhood exposure to pm10: Relation between personal, classroom, and outdoor concentrations. Occup. Environ. Med. 1997, 54, 888–894. [Google Scholar] [CrossRef] [PubMed]
  38. Tippayawong, N.; Khuntong, P.; Nitatwichit, C.; Khunatorn, Y.; Tantakitti, C. Indoor/outdoor relationships of size-resolved particle concentrations in naturally ventilated school environments. Build. Environ. 2009, 44, 188–197. [Google Scholar] [CrossRef]
  39. Buonanno, G.; Fuoco, F.C.; Morawska, L.; Stabile, L. Airborne particle concentrations at schools measured at different spatial scales. Atmos. Environ. 2013, 67, 38–45. [Google Scholar] [CrossRef]
  40. Morawska, L.; He, C.; Johnson, G.; Guo, H.; Uhde, E.; Ayoko, G. Ultrafine particles in indoor air of a school: Possible role of secondary organic aerosols. Environ. Sci. Technol. 2009, 43, 9103–9109. [Google Scholar] [CrossRef] [PubMed]
  41. Reche, C.; Viana, M.; Rivas, I.; Bouso, L.; Àlvarez-Pedrerol, M.; Alastuey, A.; Sunyer, J.; Querol, X. Outdoor and indoor UFP in primary schools across Barcelona. Sci. Total Environ. 2014, 493, 943–953. [Google Scholar] [CrossRef] [PubMed]
  42. Zhang, Q.; Zhu, Y. Characterizing ultrafine particles and other air pollutants at five schools in South Texas. Indoor Air 2012, 22, 33–42. [Google Scholar] [CrossRef] [PubMed]
  43. Das, P.; Shrubsole, C.; Jones, B.; Hamilton, I.; Chalabi, Z.; Davies, M.; Mavrogianni, A.; Taylor, J. Using probabilistic sampling-based sensitivity analyses for indoor air quality modelling. Build. Environ. 2014, 78, 171–182. [Google Scholar] [CrossRef]
  44. Zhu, Y.; Hinds, W.C.; Krudysz, M.; Kuhn, T.; Froines, J.; Sioutas, C. Penetration of freeway ultrafine particles into indoor environments. J. Aerosol Sci. 2005, 36, 303–322. [Google Scholar] [CrossRef]
  45. Chao, C.Y.H.; Tung, T.C. An empirical model for outdoor contaminant transmission into residential buildings and experimental verification. Atmos. Environ. 2001, 35, 1585–1596. [Google Scholar] [CrossRef]
  46. Guo, H.; Morawska, L.; He, C.; Gilbert, D. Impact of ventilation scenario on air exchange rates and on indoor particle number concentrations in an air-conditioned classroom. Atmos. Environ. 2008, 42, 757–768. [Google Scholar] [CrossRef] [Green Version]
  47. Baker, P.H.; Sharples, S.; Ward, I.C. Air flow through cracks. Build. Environ. 1987, 22, 293–304. [Google Scholar] [CrossRef]
  48. Ho, K.F.; Cao, J.J.; Harrison, R.M.; Lee, S.C.; Bau, K.K. Indoor/outdoor relationships of organic carbon (OC) and elemental carbon (EC) in PM2.5 in roadside environment of Hong Kong. Atmos. Environ. 2004, 38, 6327–6335. [Google Scholar] [CrossRef]
  49. Poupard, O.; Blondeau, P.; Iordache, V.; Allard, F. Statistical analysis of parameters influencing the relationship between outdoor and indoor air quality in schools. Atmos. Environ. 2005, 39, 2071–2080. [Google Scholar] [CrossRef]
  50. Gupta, A.; David Cheong, K.W. Physical characterization of particulate matter and ambient meteorological parameters at different indoor-outdoor locations in singapore. Build. Environ. 2007, 42, 237–245. [Google Scholar] [CrossRef]
  51. Chen, C.; Zhao, B. Review of relationship between indoor and outdoor particles: I/o ratio, infiltration factor and penetration factor. Atmos. Environ. 2011, 45, 275–288. [Google Scholar] [CrossRef]
  52. Liu, D.L.; Nazaroff, W.W. Particle penetration through building cracks. Aerosol Sci. Technol. 2003, 37, 565–573. [Google Scholar] [CrossRef]
  53. WHO Guidelines for Indoor Air Quality: Selected Pollutants. Available online: http://www.euro.who.int/__data/assets/pdf_file/0009/128169/e94535.pdf (accessed on 22 September 2015).
  54. Selgrade, M.K.; Plopper, C.G.; Gilmour, M.I.; Conolly, R.B.; Foos, B.S.P. Assessing the health effects and risks associated with children’s inhalation exposures - asthma and allergy. J. Toxicol. Environ. Health - Part A: Curr. Issues 2008, 71, 196–207. [Google Scholar] [CrossRef] [PubMed]
  55. Mazaheri, M.; Clifford, S.; Jayaratne, R.; Megat Mokhtar, M.A.; Fuoco, F.; Buonanno, G.; Morawska, L. School children’s personal exposure to ultrafine particles in the urban environment. Environ. Sci. Technol. 2014, 48, 113–120. [Google Scholar] [CrossRef] [PubMed] [Green Version]
  56. International Review of Curriculum and Assessment Framework Internet Archive (INCA). Available online: http://www.nfer.ac.uk/what-we-do/information-and-reviews/inca/INCAcomparativetablesMarch2012.pdf (accessed on 22 September 2015).
  57. UNI EN 12792: 2005. Ventilation for Buildings—Symbols, Terminology and Graphical Symbols. Available online: http://infostore.saiglobal.com/store/details.aspx?ProductID=657286 (accessed on 22 September 2015).
  58. Buonanno, G.; Jayaratne, R.E.; Morawska, L.; Stabile, L. Metrological performances of a diffusion charger particle counter for personal monitoring. Aerosol Air Qual. Res. 2014, 14, 156–167. [Google Scholar] [CrossRef]
  59. Stabile, L.; Trassierra, C.V.; Dell’Agli, G.; Buonanno, G. Ultrafine particle generation through atomization technique: The influence of the solution. Aerosol Air Qual. Res. 2013, 13, 1667–1677. [Google Scholar] [CrossRef]
  60. Buonanno, G.; Fuoco, F.C.; Stabile, L. Influential parameters on particle exposure of pedestrians in urban microenvironments. Atmos. Environ. 2011, 45, 1434–1443. [Google Scholar] [CrossRef]
  61. Amato, F.; Rivas, I.; Viana, M.; Moreno, T.; Bouso, L.; Reche, C.; Àlvarez-Pedrerol, M.; Alastuey, A.; Sunyer, J.; Querol, X. Sources of indoor and outdoor PM2.5 concentrations in primary schools. Sci. Total Environ. 2014, 490, 757–765. [Google Scholar] [CrossRef] [PubMed]
  62. Viana, M.; Rivas, I.; Querol, X.; Alastuey, A.; Sunyer, J.; Álvarez-Pedrerol, M.; Bouso, L.; Sioutas, C. Indoor/outdoor relationships and mass closure of quasi-ultrafine, accumulation and coarse particles in Barcelona schools. Atmos. Chem. Phys. 2014, 14, 4459–4472. [Google Scholar] [CrossRef]
  63. Fromme, H.; Twardella, D.; Dietrich, S.; Heitmann, D.; Schierl, R.; Liebl, B.; Rüden, H. Particulate matter in the indoor air of classrooms-exploratory results from Munich and surrounding area. Atmos. Environ. 2007, 41, 854–866. [Google Scholar] [CrossRef]
  64. Morawska, L.; Afshari, A.; Bae, G.N.; Buonanno, G.; Chao, C.Y.H.; Hänninen, O.; Hofmann, W.; Isaxon, C.; Jayaratne, E.R.; Pasanen, P.; et al. Indoor aerosols: From personal exposure to risk assessment. Indoor Air 2013, 23, 462–487. [Google Scholar] [CrossRef] [PubMed] [Green Version]
  65. Lee, S.C.; Cheng, Y.; Ho, K.F.; Cao, J.J.; Louie, P.K.K.; Chow, J.C.; Watson, J.G. Pm1.0 and pm2.5 characteristics in the roadside environment of Hong Kong. Aerosol Sci. Technol. 2006, 40, 157–165. [Google Scholar] [CrossRef]
  66. ASHRAE Standard 62.1-2007: Ventilation for Acceptable Indoor Air Quality. Available online: http://www.mintie.com/assets/pdf/education/ASHRAE%2062.1-2007.pdf (accessed on 22 September 2015).
  67. Ventilation for Non-Residential Buildings—Performance Requirements for Ventilation and Room-Conditioning Systems. Available online: http://www.cres.gr/greenbuilding/PDF/prend/set4/WI_25_Pre-FV_version_prEN_13779_Ventilation_for_non-resitential_buildings.pdf (accessed on 22 September 2015).
  68. UNI TS 111300—Technical Standards Reference on Savings and Energy Certification of Buildings. Available online: http://www.expoclima.net/en/focus/regulations/uni_ts_11300_technical_standards_reference_on_savings_and_energy_certification_of_buildings.htm (accessed on 22 September 2015).
  69. ASHRAE. ASHRAE Handbook-Fundamentals; American Society of Heating, Refrigerating and Air-Conditioning Engineers, Inc.: Atlanta, GA, USA, 1997. [Google Scholar]
  70. Braniš, M.; Šafránek, J. Characterization of coarse particulate matter in school gyms. Environ. Res. 2011, 111, 485–491. [Google Scholar] [CrossRef] [PubMed]
  71. Buonanno, G.; Fuoco, F.C.; Marini, S.; Stabile, L. Particle re-suspension in school gyms during physical activities. Aerosol Air Qual. Res. 2012, 12, 803–813. [Google Scholar]
  72. Rodríguez, S.; Cuevas, E.; González, Y.; Ramos, R.; Romero, P.M.; Pérez, N.; Querol, X.; Alastuey, A. Influence of sea breeze circulation and road traffic emissions on the relationship between particle number, black carbon, PM1, PM2.5 and PM2.5–10 concentrations in a coastal city. Atmos. Environ. 2008, 42, 6523–6534. [Google Scholar] [CrossRef]
  73. Reche, C.; Querol, X.; Alastuey, A.; Viana, M.; Pey, J.; Moreno, T.; Rodríguez, S.; González, Y.; Fernández-Camacho, R.; de la Campa, A.M.S.; et al. New considerations for PM, black carbon and particle number concentration for air quality monitoring across different European cities. Atmos. Chem. Physics 2011, 11, 6207–6227. [Google Scholar] [CrossRef] [Green Version]
  74. European Council Directive 2013/59/EURATOM—Protection Against Ionising Radiation. Available online: http://www.ecolex.org/ecolex/ledge/view/RecordDetails?index=documents&id=LEX-FAOC130004 (accessed on 22 September 2015).
  75. Weichenthal, S.; Dufresne, A.; Infante-Rivard, C.; Joseph, L. Characterizing and predicting ultrafine particle counts in Canadian classrooms during the winter months: Model development and evaluation. Environ. Res. 2008, 106, 349–360. [Google Scholar] [CrossRef] [PubMed]
  76. Rivas, I.; Viana, M.; Moreno, T.; Pandolfi, M.; Amato, F.; Reche, C.; Bouso, L.; Àlvarez-Pedrerol, M.; Alastuey, A.; Sunyer, J.; et al. Child exposure to indoor and outdoor air pollutants in schools in Barcelona, Spain. Environ. Int. 2014, 69, 200–212. [Google Scholar] [CrossRef] [PubMed]
  77. Zwoździak, A.; Sówka, I.; Krupińska, B.; Zwoździak, J.; Nych, A. Infiltration or indoor sources as determinants of the elemental composition of particulate matter inside a school in Wrocław, Poland? Build. Environ. 2013, 66, 173–180. [Google Scholar] [CrossRef]
  78. Rovelli, S.; Cattaneo, A.; Nuzzi, C.P.; Spinazzè, A.; Piazza, S.; Carrer, P.; Cavallo, D.M. Airborne particulate matter in school classrooms of northern Italy. Int. J. Environ. Res. Public Health 2014, 11, 1398–1421. [Google Scholar] [CrossRef] [PubMed] [Green Version]
  79. Stranger, M.; Potgieter-Vermaak, S.S.; Van Grieken, R. Characterization of indoor air quality in primary schools in Antwerp, Belgium. Indoor Air 2008, 18, 454–463. [Google Scholar] [CrossRef]
  80. Wichmann, J.; Lind, T.; Nilsson, M.A.M.; Bellander, T. PM2.5, soot and NO2 indoor-outdoor relationships at homes, pre-schools and schools in Stockholm, Sweden. Atmos. Environ. 2010, 44, 4536–4544. [Google Scholar] [CrossRef]
  81. Ghirga, G.; Pipere, M. Are children safe indoor from outdoor air pollution? A short review. Open J. Pediatr. 2012, 2, 93–96. [Google Scholar] [CrossRef]
  82. Wardoyo, A.Y.P.; Santjojo, D.H.; Putri, I.I.H. Indoor outdoor ultrafine particle measurements in lecture rooms. Int. J. Basic Appl. Sci. 2012, 12, 198–201. [Google Scholar]
  83. Almeida, S.M.; Canha, N.; Silva, A.; Do Carmo Freitas, M.; Pegas, P.; Alves, C.; Evtyugina, M.; Pio, C.A. Children exposure to atmospheric particles in indoor of Lisbon primary schools. Atmos. Environ. 2011, 45, 7594–7599. [Google Scholar] [CrossRef]
  84. Santamouris, M.; Synnefa, A.; Asssimakopoulos, M.; Livada, I.; Pavlou, K.; Papaglastra, M.; Gaitani, N.; Kolokotsa, D.; Assimakopoulos, V. Experimental investigation of the air flow and indoor carbon dioxide concentration in classrooms with intermittent natural ventilation. Energy Build. 2008, 40, 1833–1843. [Google Scholar] [CrossRef]
  85. Coley, D.A.; Beisteiner, A. Carbon dioxide levels and ventilation rates in schools. Int. J. Vent. 2002, 1, 45–52. [Google Scholar]
  86. Jurelionis, A. Indoor air quality in classrooms of renovated school building in Lithuania. In Proceedings of the 25th AIVC Conference, Prague, Czech Republic, 15–17 September 2004.
  87. Samudio, M.J.J.V.; Silva, E.; Fernandes, O.; Cuedes, J.; Vasconcelos, M. Detailled air study in a school in Porto. Proc. Healthy Build. 2006, 345–350. [Google Scholar]
  88. Heiselberg, P.; Perino, M. Short-term airing by natural ventilation - implication on iaq and thermal comfort. Indoor Air 2010, 20, 126–140. [Google Scholar] [CrossRef] [PubMed]

