Integrating Stakeholder Views and System Dynamics to Assess the Water–Energy–Food Nexus in Andalusia


1
Department of Agricultural Economics, Universidad Politécnica de Madrid, ETSIAAB, Avda. Puerta Hierro 2, 28040 Madrid, Spain
2
CEIGRAM, Universidad Politécnica de Madrid, Calle Senda del Rey 13, 28040 Madrid, Spain
*
Author to whom correspondence should be addressed.
Water 2020, 12(11), 3172; https://0-doi-org.brum.beds.ac.uk/10.3390/w12113172
Submission received: 30 September 2020
/
Revised: 8 November 2020
/
Accepted: 11 November 2020
/
Published: 13 November 2020
(This article belongs to the Special Issue Water-Food-Energy-Ecosystems Interlinkages in a Context of Global Change)
Abstract
:A nexus approach can support the transition to sustainability by addressing trade-offs and pursuing synergies to improve water, energy, and food security. In this paper, a participatory system dynamics model was developed to identify and assess the key interlinkages between water, food, and energy in Andalusia (Spain). A panel of relevant stakeholders contributed to all stages of the model’s development. Further, by calibrating the model to CAPRI-Water projections until 2050, the evolution of the system under a plausible climate scenario, as well as effects of water prices changes, was evaluated. The results revealed a close link between water cost, irrigation water use, energy consumption, and the economic development of agriculture in the region. Large variability was observed in the effects of water pricing policies across crops. This paper concludes that a participatory system dynamics model can help in understanding the nexus synergies and can support the design of more coherent sustainability strategies in the region.
1. Introduction
Water–energy–food (WEF) dynamics shape a complex system with multi-directional interrelations; therefore, integrated approaches are needed to identify the synergies and trade-offs between the various components and manage the nexus [1,2,3]. In a broad sense, the term WEF nexus also includes other sectors, such as ecosystems, land, climate, or emissions. There is increasing evidence that applying a nexus approach is essential to analyse WEF interlinkages and to identify coherent policies that can promote the transition to sustainability [4,5,6,7].
Likewise, systemic approaches can also help in understanding these interrelations, because they facilitate the analysis of the whole system and integrated sub-systems simultaneously. The literature applying this methodology to analyse the nexus often addresses qualitative analysis through conceptual interlinkages (Muiznuece et al. [8]; Cai et al. [9]). For a better nexus understanding, some studies also engage stakeholders and experts (Foran [10]; Johnson et al. [11]). Other studies apply complexity-based approaches, such as modelling, to obtain quantitative results (Howells et al. [12]; Daher and Mohtar [13]). However, a participatory modelling approach that combines both qualitative and quantitative methods may be the key to a comprehensive understanding of the complexity of the nexus and to tackling uncertainties. For instance, De Strasser et al. [14] presented a quantitative participatory methodology to assess the WEF nexus in transboundary river basins, encompassing questionnaires, workshops, demographic data analysis, and cross-sectoral and cross-boundary dialogues. Similarly, Smajgl et al. [15] assessed the WEF nexus in a river basin, suggesting a combination of methods, including the Delphi technique, the participatory modelling process, the qualitative relationship between variables, and stochastic approaches, while Yung et al. [16] combined participatory quantitative modelling and future-based thinking in a policy-making context for a case study in Cambodia.
System dynamics modelling (SDM) is a systemic approach that facilitates the integrated analysis of sectors, structures, processes, and interrelations among different system variables [17,18,19]. As a result, the application of SDM to analyse the nexus is increasing [20,21,22,23]. Additionally, according to its iterative development process [24], SDM is well-suited to integrating quantitative and qualitative information through participatory modelling. Participatory SDMs have been developed to identify potential cross-sectoral synergies and trade-offs due to policy interventions [25,26,27,28,29].
The novelty of this research is that we developed a participatory SDM in a future scenario analysis framework in which the baseline scenario is aligned with the climate scenarios developed by the Intergovernmental Panel on Climate Change (IPCC) and WEF projections at the regional level. In this sense, by reproducing the trend scenario, the SDM makes it possible to contribute to the design of sustainability strategies to achieve the Sustainable Development Goals (SDGs) [30].
The objective of this study is twofold: (1) to quantify the interlinkages between water, food, energy, land, and climate; and (2) to analyse how agricultural and environmental policies can be better coordinated to deal with major pressures on land, water, and energy in future scenarios by 2050. This approach was applied in the Andalusia region (Spain) in the framework of the SIM4NEXUS project [31], which aims at developing complex tools to inform the design of nexus-compliant policies from the regional to the global level.
To identify nexus-coherent policies, we developed a SDM of the WEF nexus in close collaboration with a panel of stakeholders who contributed to the design of the SDM at each stage of development. First, stakeholders contributed to identifying the main WEF nexus interlinkages and challenges in Andalusia. These interlinkages were represented in a conceptual model, discussed, and validated by the stakeholders. From the conceptual model, a graphic and quantitative SDM was developed. The SDM was calibrated with data and projections to 2050 from European and regional sources, generating a baseline scenario. Furthermore, simulations with the bio-economic Common Agricultural Policy Regionalised Impact (CAPRI)-Water model were used to better represent food–water linkages. Finally, the SDM enabled us to simulate policy changes. The policy selected for analysis is a water pricing policy. By comparing the simulations results against the baseline, SDM can be used as a decision support tool to design nexus-coherent policies to guide sustainability strategies.
The rest of the paper is organized as follows: Section 2 presents the region chosen for the case study—Andalusia—with an emphasis on the WEF nexus challenges. Section 3 explains the methodological approach for participatory system dynamics modelling and describes the baseline and simulation scenarios. Section 4 presents the model results focusing on the effects of water pricing scenarios on some key indicators. Section 5 discusses the methodology and the model results. Finally, in the last section, the relevant points are outlined, and conclusions are drawn.
2. Andalusia (Spain) WEF Nexus Case Study Region
Andalusia is an autonomous Mediterranean region in southern Spain, where agriculture plays an important role. In 2017, the primary sector (agriculture, forestry, and fishing) contributed €7958.6 million, representing 5.5% of the region’s gross value added (GVA) at basic prices. It also employs 263 thousand people, comprising 8.6% of the working population [32]. According to Massot [33], in the 2013 holdings survey on structures, the utilised agricultural area (UAA) covers 4.3 million hectares, of which about one million hectares are irrigated. The UAA is shared among 244,566 farms, with an average of 18.12 ha per holding. The most common form of land tenure is ownership, with 87% of holding, versus other forms of tenure such as leasing or farm sharing. The main crops are olives; vegetables, such as tomatoes; fruits, such as citrus; cereals, such as wheat; and oilseeds, such as sunflowers, among others. Andalusia is the global market leader for olive oil and the main exporting region of fruits and vegetables in Europe [32].
For the energy sector, in 2017, the final energy consumption in Andalusia was 12.99 million tonnes of oil equivalent, of which the primary sector consumed 8%. Regarding the use of renewable energy, around 20% of the total primary energy consumption (primary energy consumption measures the total energy demand of a region) comes from renewable sources, with biomass and solar thermal energy being the most relevant. Additionally, the degree of energy self-sufficiency in the region is 18.4% [34]. To face the problem of energy sustainability, in 2015, the Andalusian Energy Agency developed an energy strategic plan for 2020 with the following objectives: to reduce the consumption trend of primary energy by 25%, to make renewable energy contribute 25% of the gross final energy consumption, and to self-consume 5% of the electrical energy generated via renewable sources (for example, on-farm solar energy) [35].
According to the 2018 Andalusian environmental report [36], the region has an irregular and dry climate, characterized by short periods of rain followed by long periods of droughts, which have caused erosion and desertification to worsen. “Andalusia is the autonomous region most affected by soil erosion by water in the Spanish Mediterranean region. Water erosion is the main cause of soil degradation in Andalusia. In Andalusia, soil erosion rates are high due to climatic conditions, soil characteristics, and the nature of tillage systems employed, mainly, in many olive groves” [37]. To face this problem, the environmental agency conducts continuous monitoring and control of erosive phenomena [36]. Furthermore, regional authorities have also been developing water management measures. Despite the measures and monitoring mentioned before, “all the Andalusian river basins are subject to high levels of quantitative and qualitative water stress” [38].
Because the area’s food production depends heavily on irrigation, access to water is a determining factor for increasing the productivity of the Andalusian agricultural sector [36]. Agricultural water consumption accounts for more than 80% of the total water consumption in the region, which, together with the semi-arid Mediterranean climate, results in a fragile water balance (Peña-Gallardo et al. [39]). In addition, the irrigated agricultural sector is increasingly subjected to external pressures that compromise its resilience. For example, because the irrigated agricultural sector consumes a high volume of water, it is in constant competition with other sectors, such as industry and society at large, that demand water for other uses. Likewise, groups of environmentalists also exert pressure denouncing the environmental flow reduction resulting in water quality being compromised [40]. From a political point of view, the European water framework directive (WFD) [41,42], with measures such as cost recovery through water pricing, directly impacts food production costs [43]. Finally, pressures on water and land resources will likely be aggravated by climate change in the future ([36,37,38]; Blanco et al. [44]; CEDEX [45]), which will also affect food production. Some of the present strategic measures in agriculture and water management focus on the reduction of irrigation water use by deficit irrigation strategies, monitoring of irrigation management in the plot by means of individual meters [46], and risk management through agricultural insurance [47].
The use of irrigation water has an associated cost that is mainly regulated by the river basin authorities and irrigation water user associations. The river basin authorities apply abstraction charges designed to finance operational and maintenance costs, as well as the amortization of investments. Irrigation water user associations provide and distribute water to their associated farmers, usually at a fixed volumetric price. The Guadalquivir river basin is the main basin of the Andalusia region. In 2012, for this river basin, up-stream water service tariffs are priced around €0.034/m3, and downstream water service tariffs are around €0.064/m3. On the other hand, for individual farmers to extract groundwater, an administrative license is required, and the water use operating costs supported by irrigators are around €0.15/m3 [43].
To preserve the high agricultural potential of the region, public policies that encourage efficiency in the use of water, such as improvements in the water distribution system and modernisation of the irrigation systems, have been implemented over the last decades [48,49]. As a result, according to the Spanish Ministry of Agriculture [50], by 2017, more than 84% of the total irrigated land was irrigated with sprinklers and drip irrigation systems. The above efforts of modernisation have improved the efficiency and flexibility in the use of water, as well as the profitability of the Andalusian agricultural sector [40]. However, the advantage gained by saving water will prove short-lived as the irrigated area will be expanded to grow high-value crops such as fruits and vegetables, which require substantial irrigation [51,52].
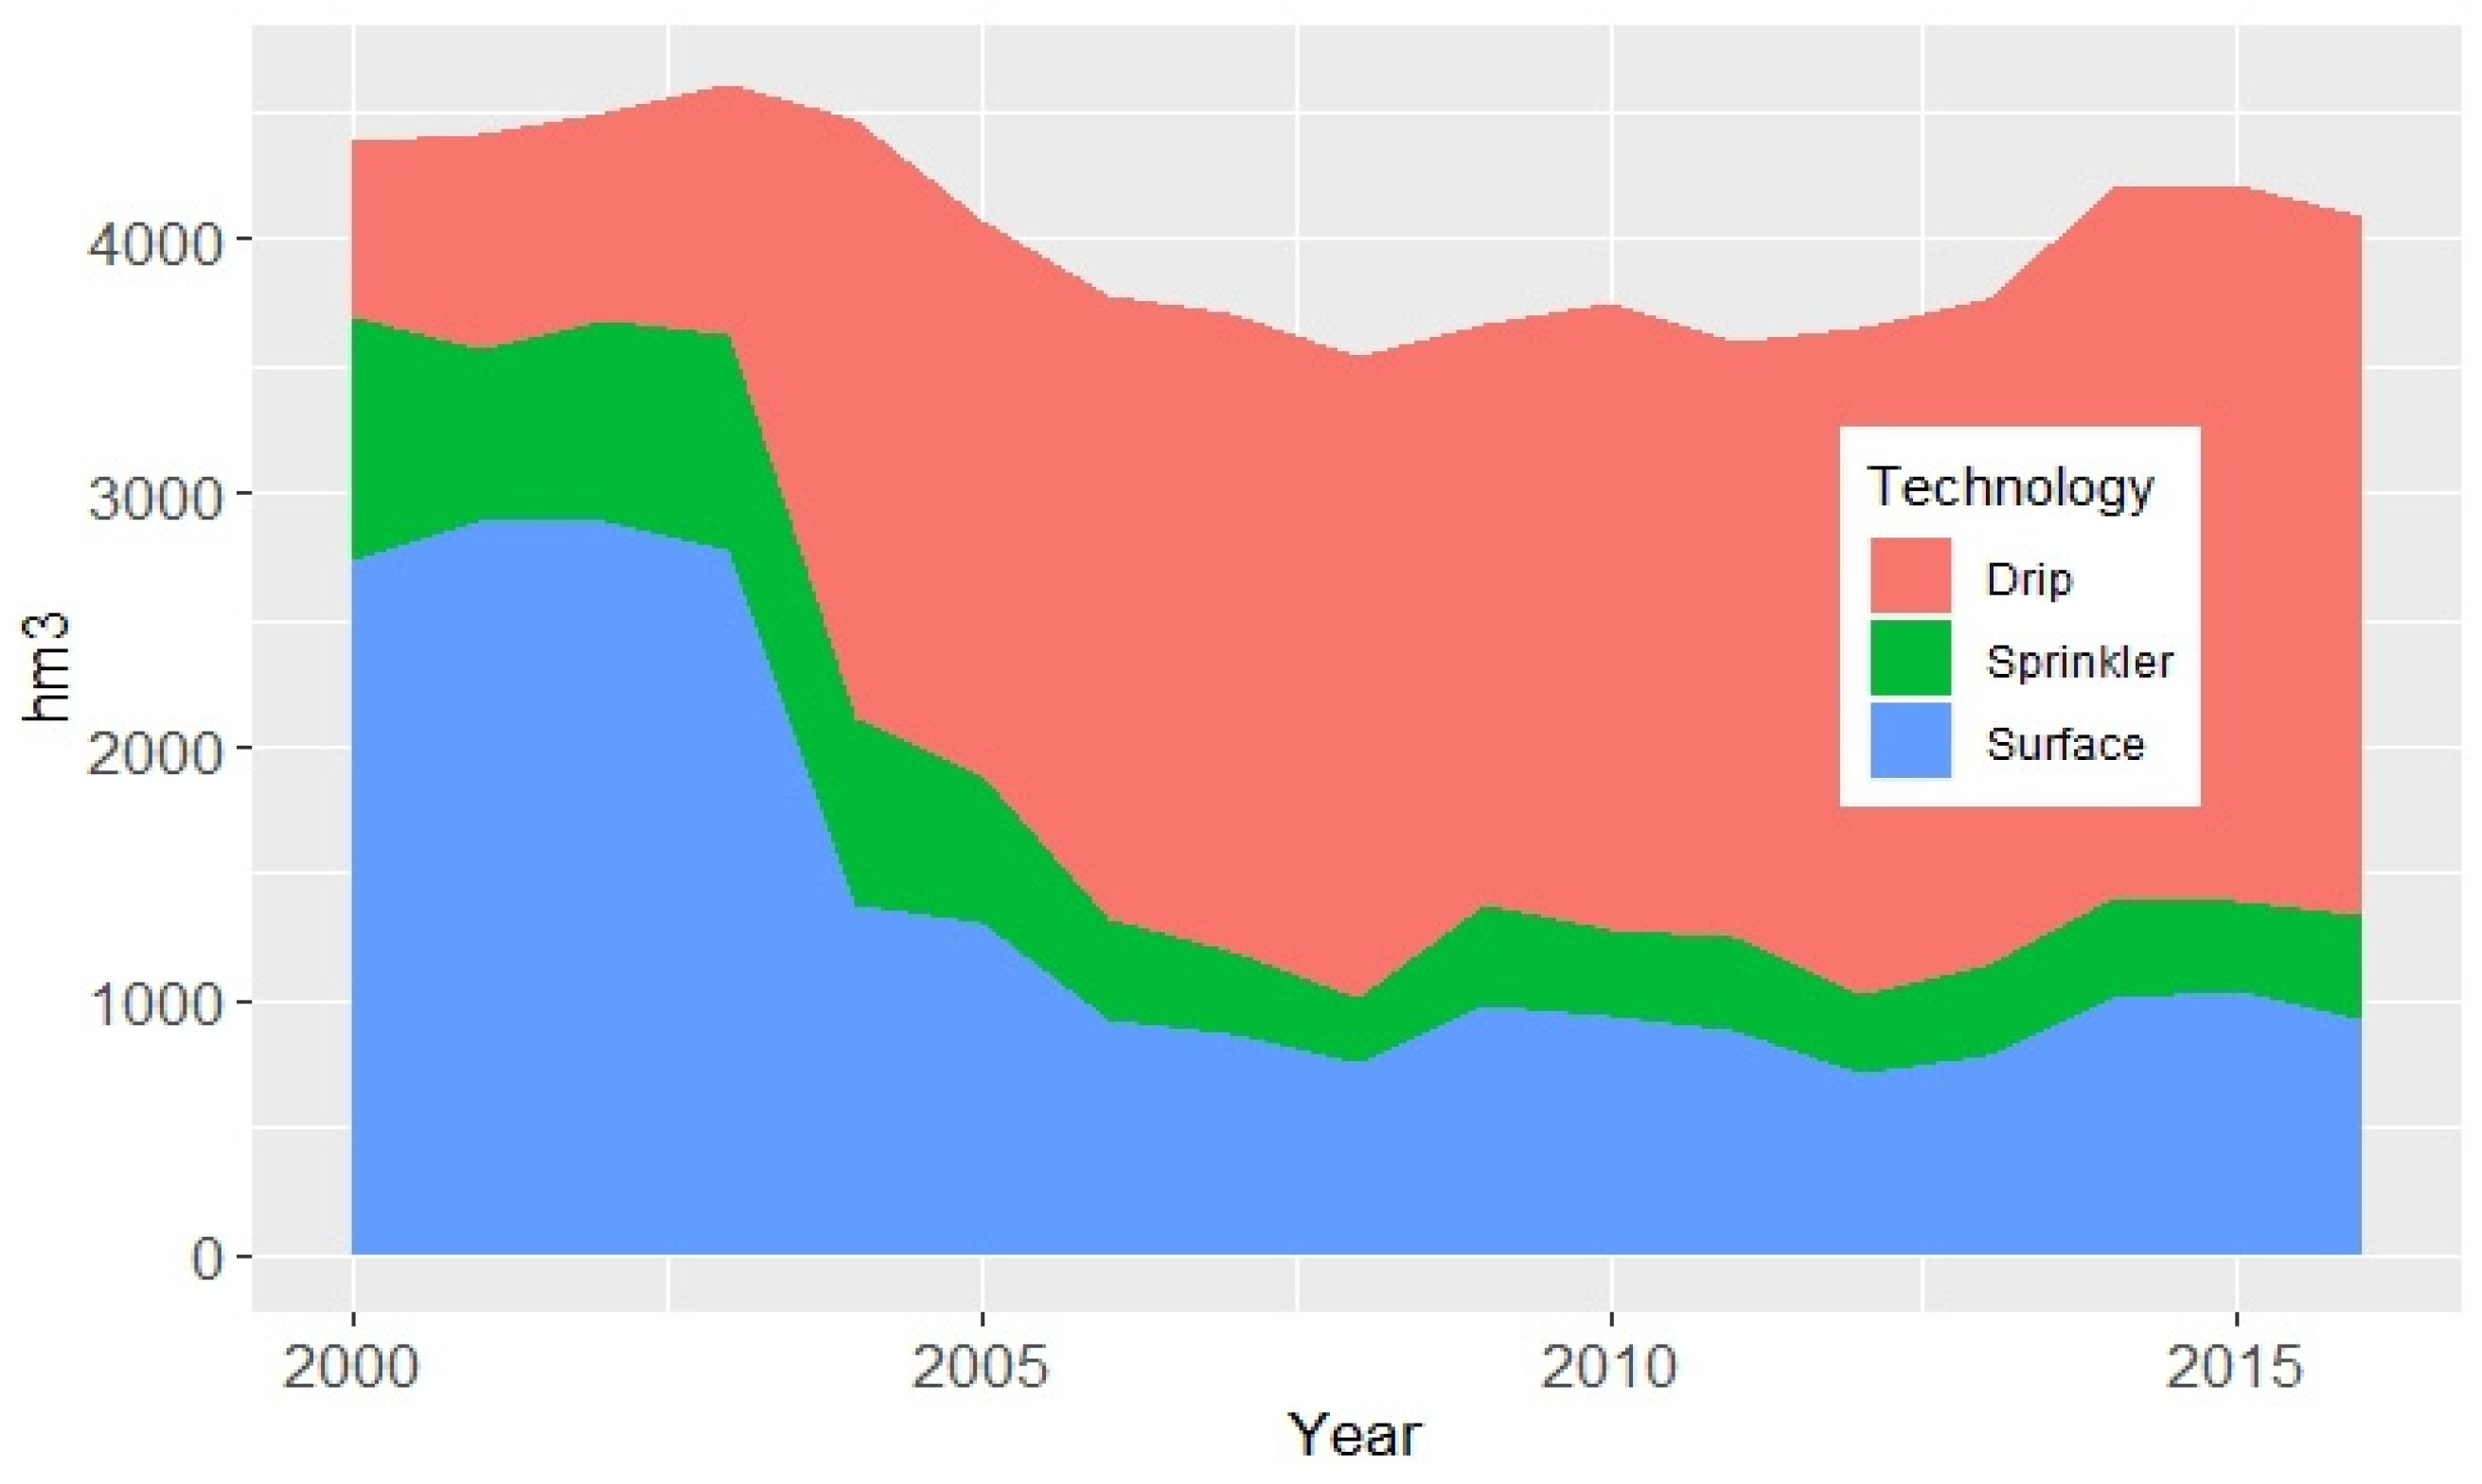
Figure 1 shows the water use by type of irrigation technology in Andalusia. An increase in water savings can be seen between 2002 and 2005 due to the change from surface to drip irrigation. This saving was reversed from 2012 onwards, as water use for drip irrigation increased.
Progress towards modern irrigation systems has also led to intensive energy consumption. In Andalusia, irrigation water use decreased by 25%, while agricultural energy consumption increased by 29% between 1997 and 2008 (Corominas et al. [54]). In addition to the increase in energy consumption, energy price tariffs have also increased. Both factors combined have potentiated the increase in irrigation costs, putting the economic sustainability of irrigated agriculture at risk (Camacho et al. [49]). Borrego-Marín and Berbel [55] analysed the socioeconomic impact of the modernization of irrigation in western Andalusia, taking nine irrigation water user associations as a population sample. The authors determined that changes in irrigation technology increased the average irrigation costs by 128%, with the energy cost experiencing the highest percentage increase, with an increase of 379% (Table 1).
Currently, Andalusia has developed a sustainable strategy to achieve the SDG for 2030 (Junta de Andalucía [56]). In this context, nexus-coherent policies are needed to address nexus challenges to promote sustainable water and energy management and sustain food production, as well as economic development, in the region.
3. Methodology to Assess the WEF Nexus in Andalusia
A key aspect of this research is its combination of qualitative and quantitative methods. To that end, a participatory system dynamics methodology was developed. This methodology consists of integrating stakeholder participation throughout the development of an SDM. The actors involved come from the water, energy, and food sectors in Andalusia and included 14 representatives drawn from the regional government (departments of agriculture, energy, environment and water), water agencies, professional associations (farmers’ organizations, association of irrigation communities), academic institutions (Andalusian universities and research centres), non-governmental organizations (environmental organizations) and independent experts. In this sense, the stakeholders involved are responsible for formulating policies and making decisions on regional strategies and regulations on the different sectors of the nexus. Stakeholder participation was carried out through interviews, workshops, seminars, and constant communication. Furthermore, as an important factor from a quantitative point of view, the model was populated with a large number of statistical data alongside projections from other models, as well as projections from regional, national, and global scale studies.
3.1. Methodological Approach
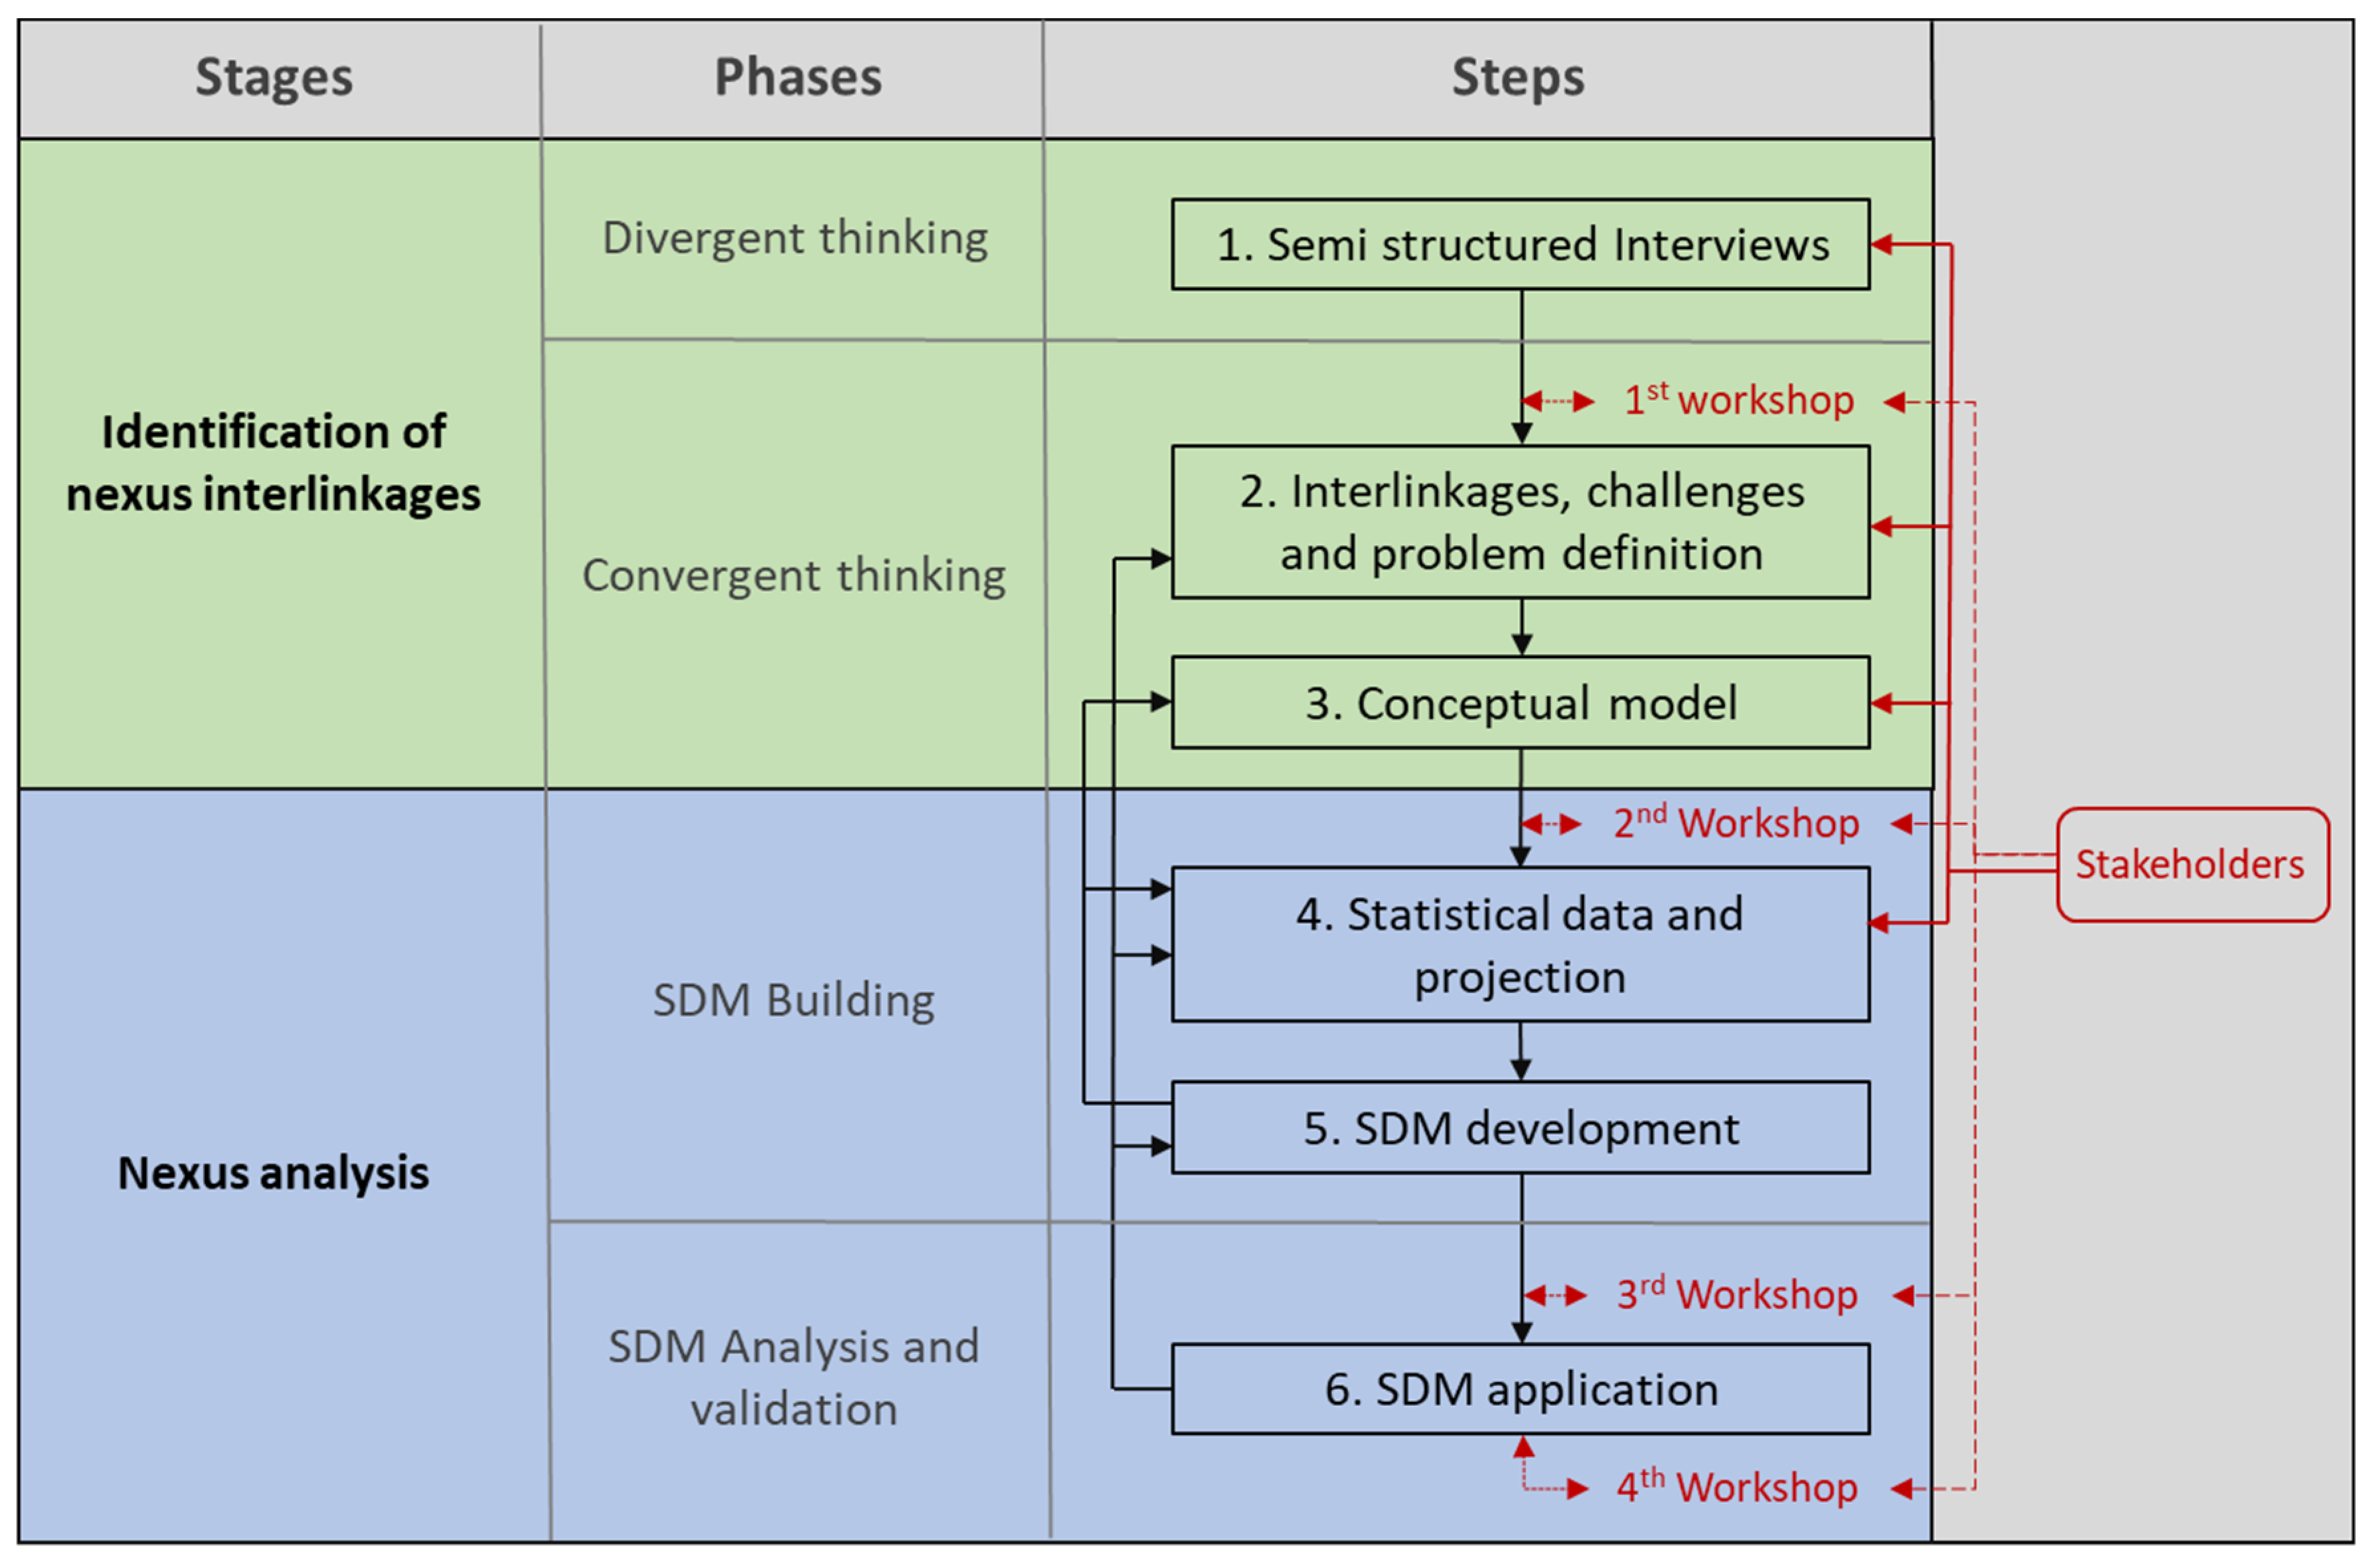
The methodological process was divided into six steps grouped into four phases: divergent thinking, convergent thinking, SDM building, and SDM analysis and validation. The first two phases provided the identification of the nexus interlinkage stage, and the last two constituted the nexus analysis stage. Figure 2 shows an overview of the steps in the process, as well as the workshops aligned within the methodological process. Due to the dynamic and interactive nature of the methodology, the process has multiple feedback loops. Constant dialogue with the stakeholders led to redefinitions of the nexus interlinkages and challenges on several occasions.
In the first step, individual semi-structured interviews were conducted to obtain the stakeholders’ preliminary overview of the main nexus challenges. This step was part of the divergent thinking phase, since stakeholders gave their perspectives on the nexus. Later, the first stakeholder workshop took place, initiating the convergent thinking phase. The aim of this workshop was to obtain an integrated view of the nexus interlinkages, challenges, and problem definitions (second step). In this step, eleven individual “nexus maps” were outlined and later compiled into a group map.
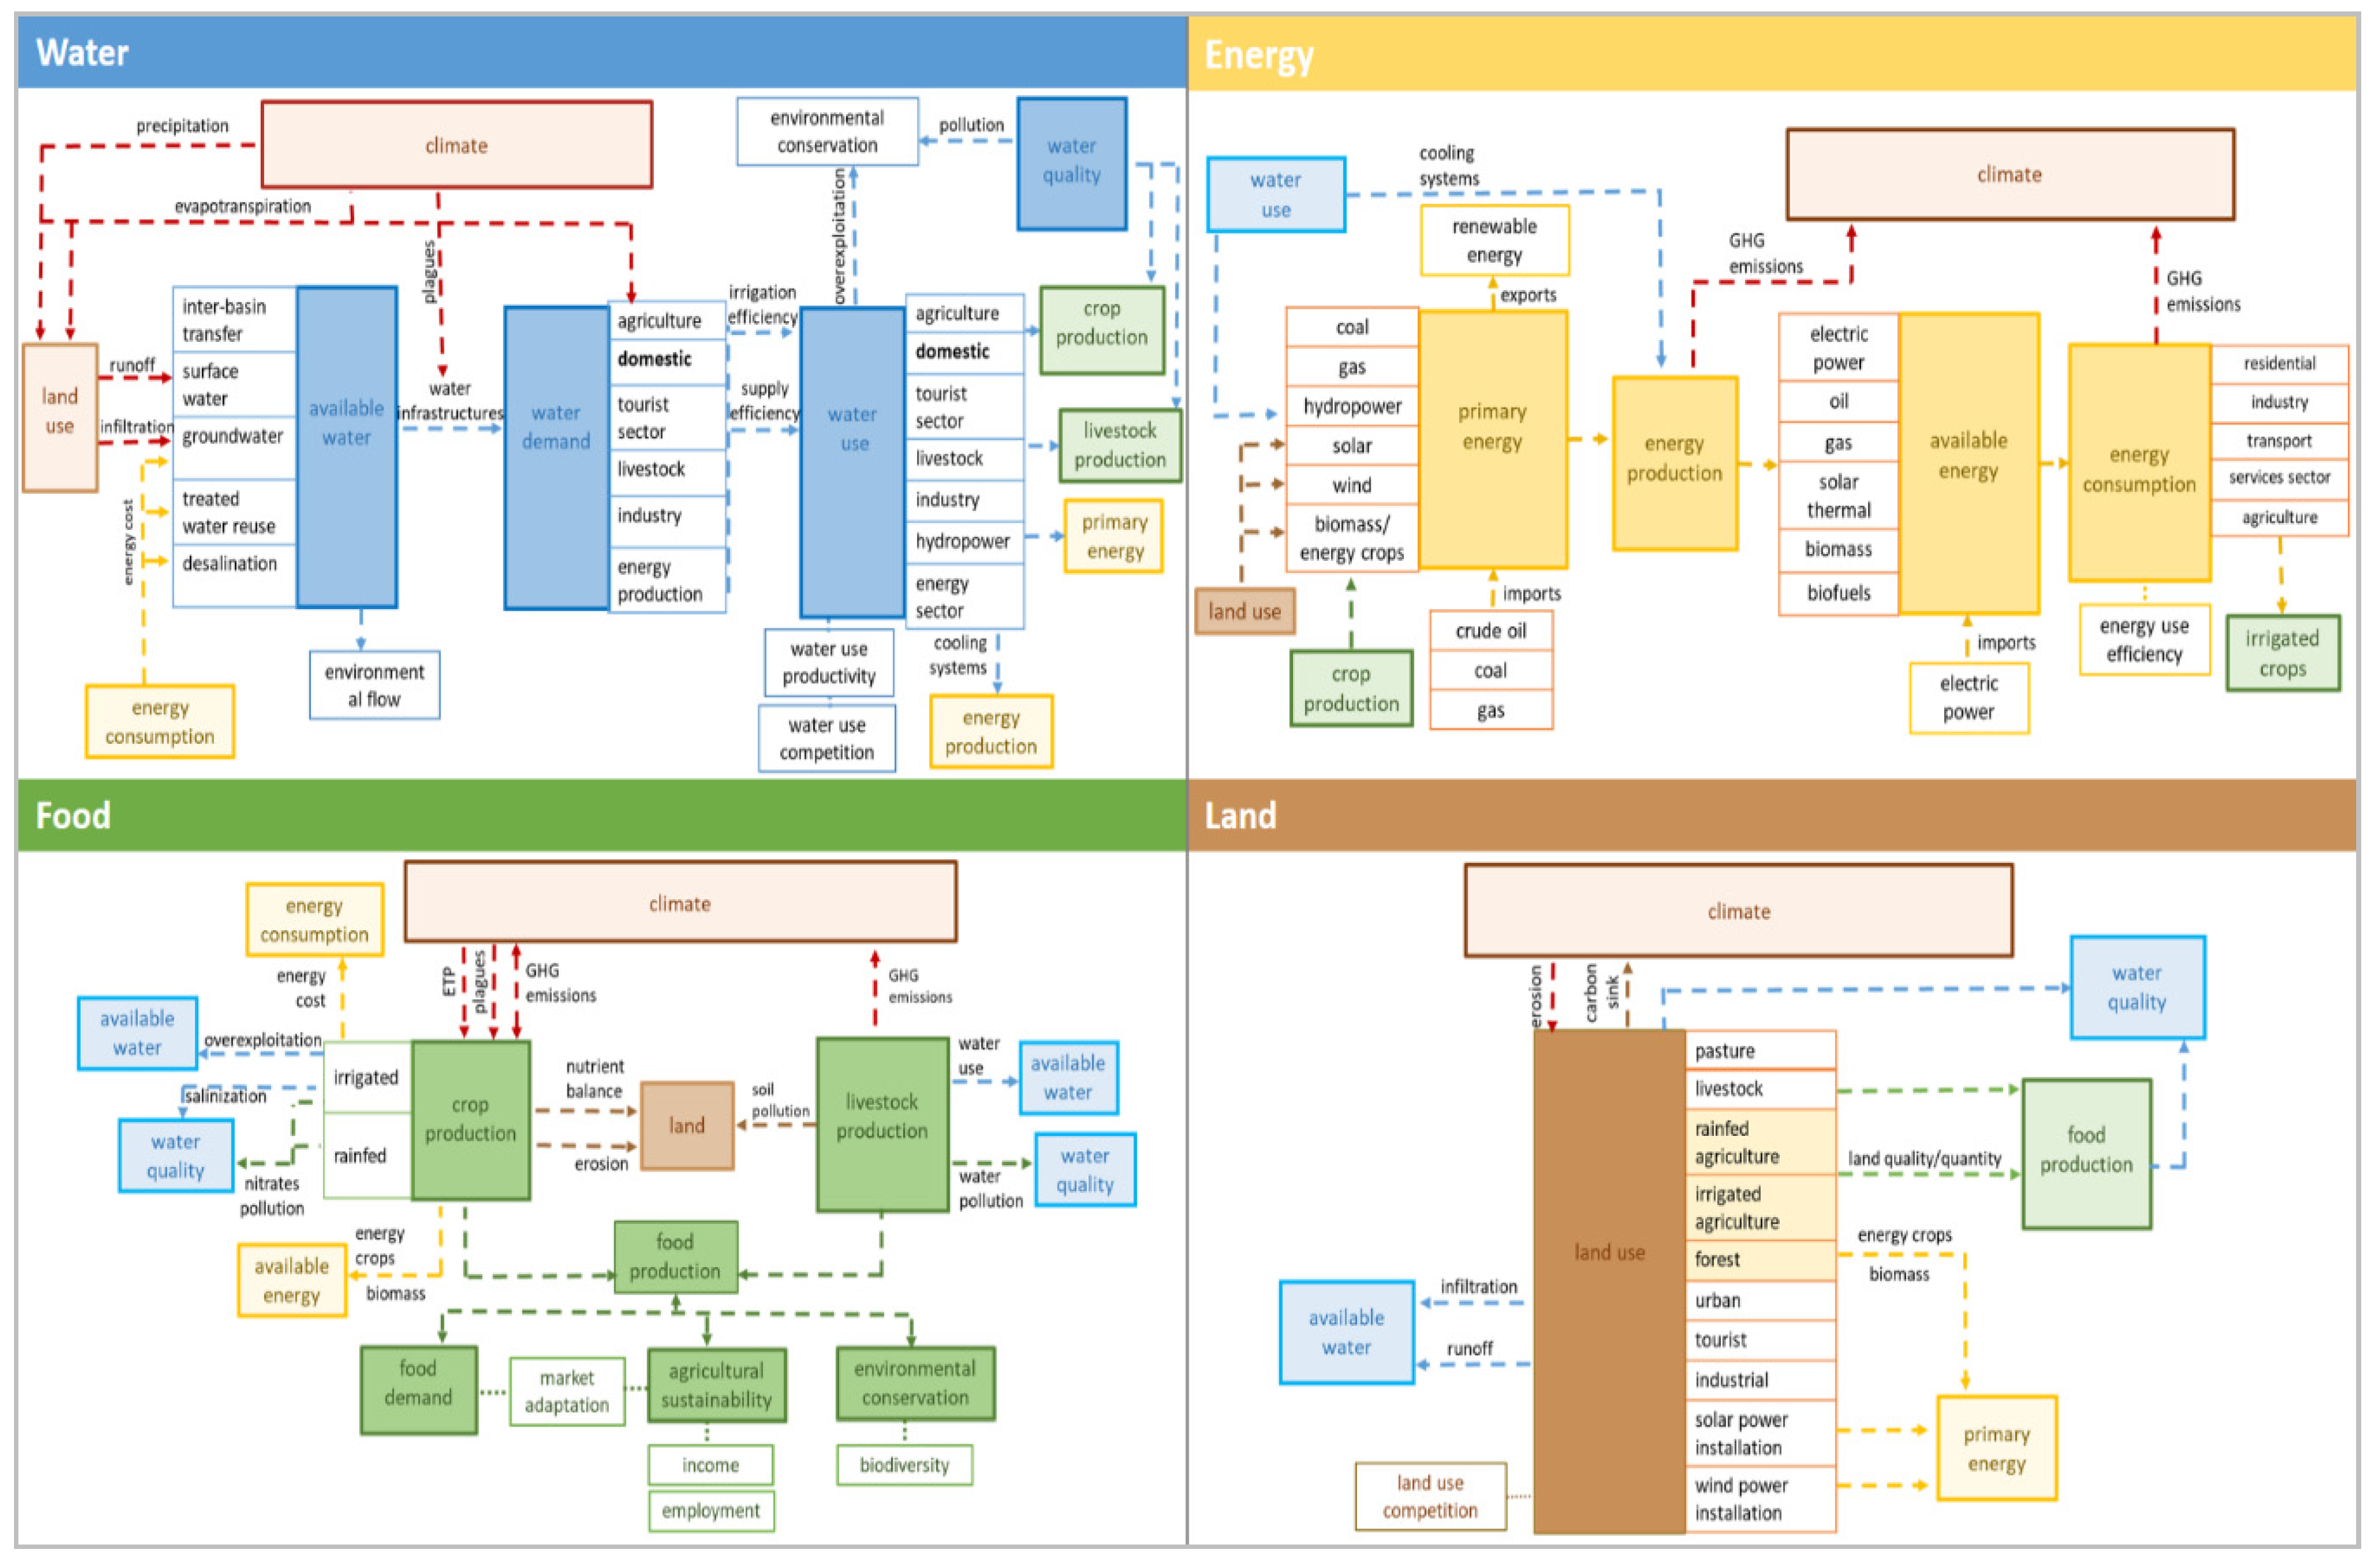
From the individual and group nexus maps, a nexus conceptual model (Figure 3) was developed (third step). In this model, the stakeholders’ and research team’s opinions were integrated. In this step, the water–agriculture link was also identified as one of the most crucial components of the nexus in Andalusia. In addition, the validation of interlinkages was based on a fuzzy cognitive mapping methodology carried out by Martínez et al. [57].
In the second stakeholder workshop, the conceptual model was presented and validated. In addition, as part of the fourth step in the process, stakeholders provided valuable information regarding the databases and previous studies from the different sectors in the region. In addition, the characteristics of the base scenario were discussed, and possible policy scenarios were identified (e.g., water pricing, a decrease in agricultural subsidies, and energy pricing). Within these, the water pricing policy was identified as one of the most relevant, so it was the one selected for this study.
Based on the conceptual model and datasets, an SDM baseline was developed (fifth step) through a dynamic process that integrated the previous two steps. The inter-links of the conceptual model were then redefined, and diverse databases were consulted several times to develop a model that better represented reality. Later, in the third workshop, the SDM baseline results for the Andalusian case study were discussed and validated by the stakeholders.
Once the SDM baseline results were validated, the water pricing policy scenario was modelled in the SDM application step (sixth step). As in the fifth step, the application of the SDM led to review of the previous steps through several feedback loops. Simulating the scenarios in the model involved identifying new interrelationships related to the context of the scenario (second step), and, in the same way, entailed consulting new data sources (fourth step) and redesigning some segments of the model (fifth step). Once the scenario was designed, the consistency of the results was evaluated within the sixth step.
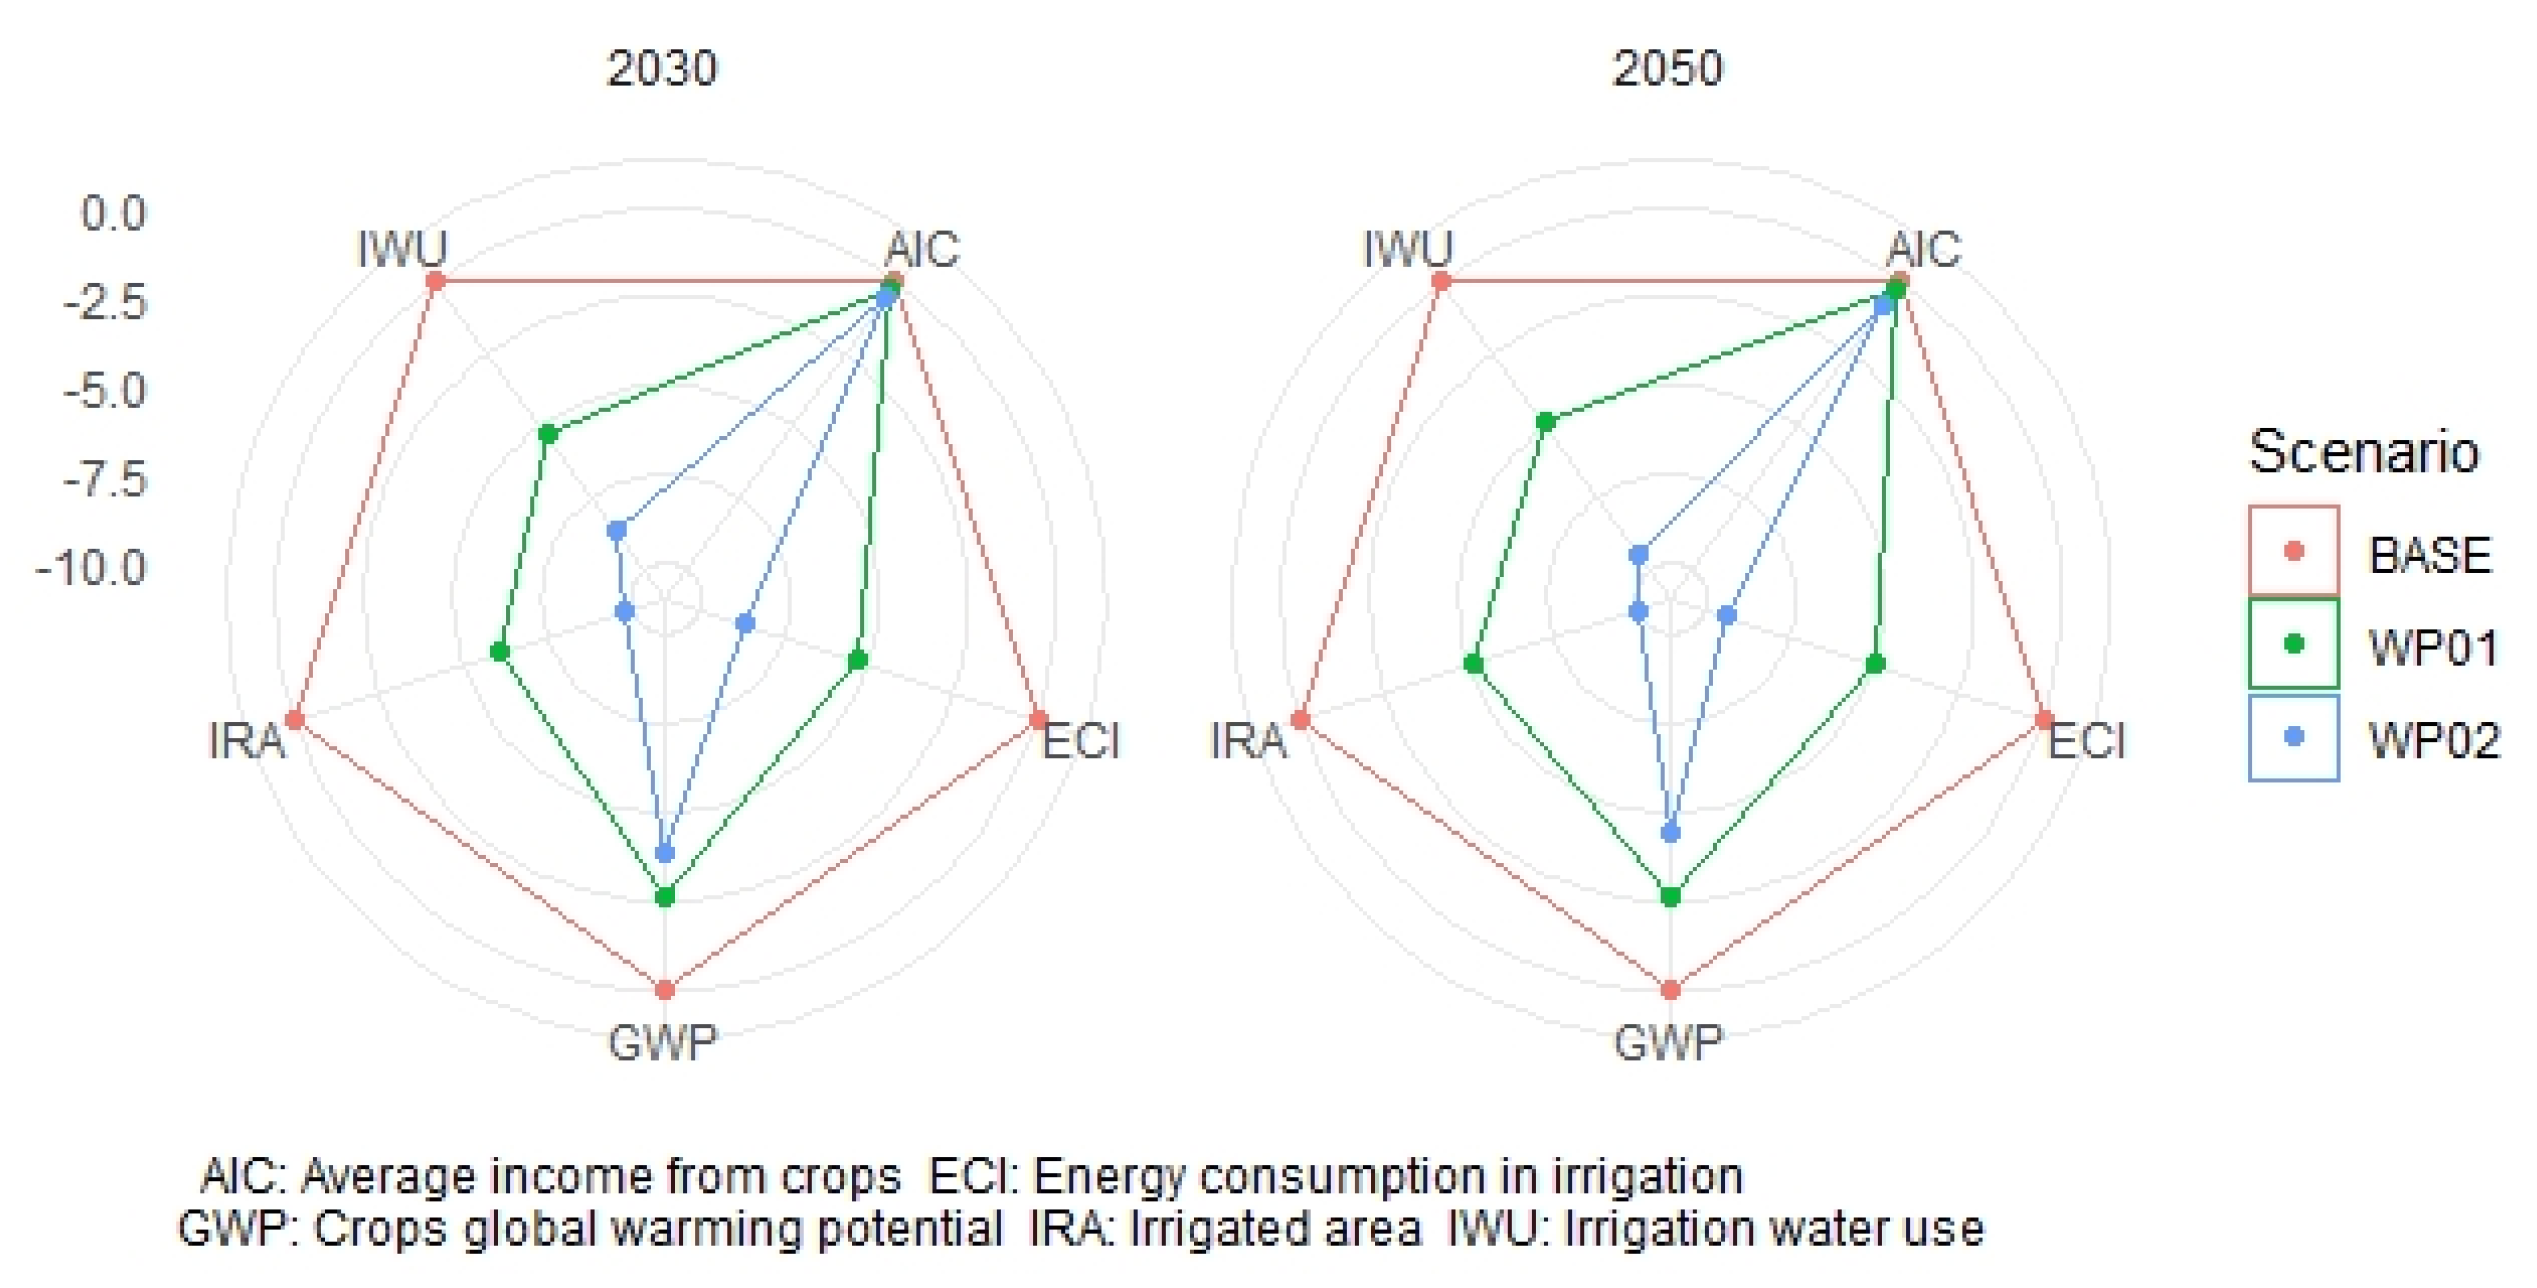
After checking the consistency of the scenario results, a visual analysis tool was used to evaluate the synergy and trade-offs between the components of the nexus through a set of indicators. One of the most widely used visualization tools to analyse various nexus indicators simultaneously is radar charts (Flammini et al. [58]; Mabhaudhi et al. [59]; Momblanch et al. [60]). In these charts, the variation of each of the indicators can be analysed by comparing the scenarios against the baseline for each year. To measure the variations of the different indicators, the indicators were homogenized on a scale between −10 and +10, where zero is considered as the baseline. Linear plots were also used to complement the analysis. These analysis tools allowed us evaluate the policy scenario and identify if it was a nexus-compliant policy.
Finally, in the fourth workshop (replaced by a webinar), the SDM results from water pricing scenarios and policy recommendations were presented to the stakeholders. Their opinions and feedback were then considered and recorded for the development of future studies.
3.2. System Dynamics Model of the WEF Nexus
SDM is a methodology that facilitates analysing and understanding complex systems through schematic models and consist of the mathematical expression of relationships between different types of elements, such as stocks, flows, converters, connectors, and decision process priorities [18,19,24]. The SDM is largely feedback-driven; the value of a stock during one time-step influences the values of the stocks, flows, and converters at the next time-step. The SDM model was developed in Stella (Stella is a visual programming language for system dynamics modelling, distributed by Isee Systems [61]) and integrated the three sectoral models of the nexus: water, energy, and food/land. It enabled joint analysis of all three sectors and could simulate different future scenarios. Since this research explored short-term, medium-term and long-term sustainability, the simulation period was set from 2010 to 2050. With 2010 as the base year, simulations were made for time horizons of 2020, 2030, 2040, and 2050. In addition, the software uses an annual time-step that allows one to view the results for intermediate years.
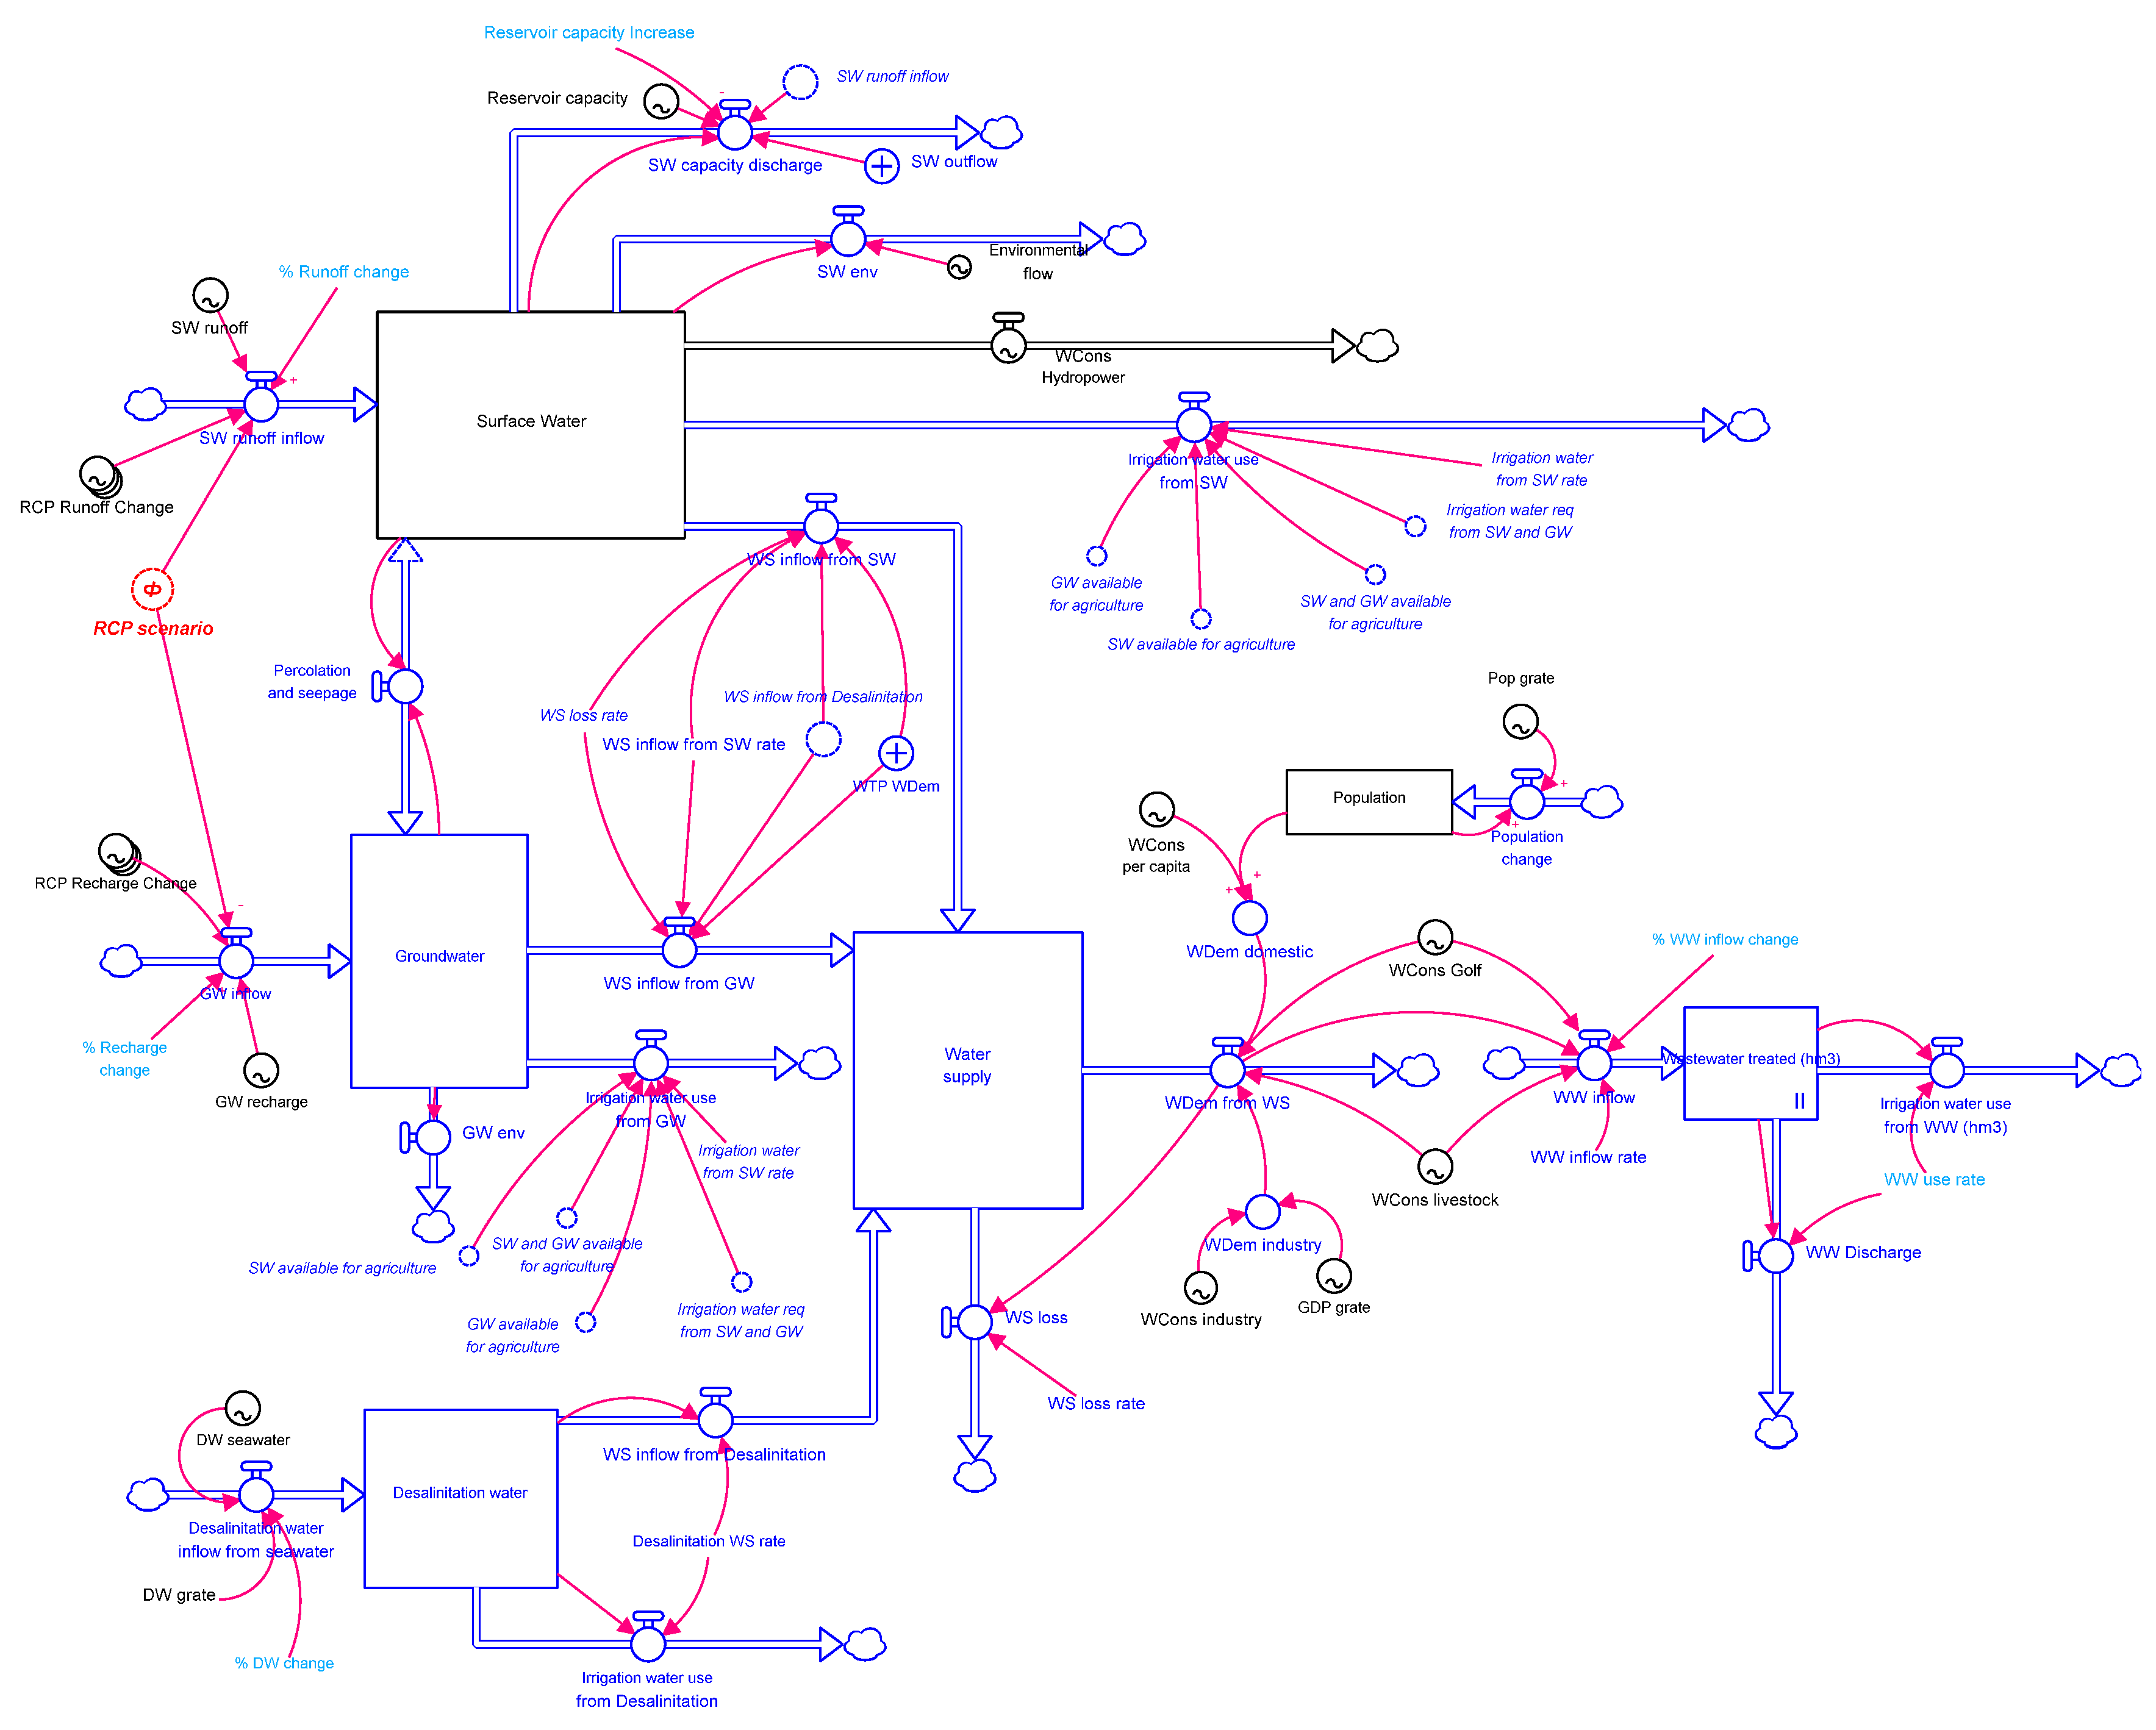
The water sector (Figure 4) shows the relations between the availability of water and water consumption in Andalusia. To this end, five water stocks (surface water, groundwater, desalination water, water supply, and wastewater) and their corresponding flows were modelled. The relevant inflows of the whole system are runoff, groundwater recharge, and desalinated water. The relevant outflows are irrigation water, environmental flow, water consumption for hydropower generation, industrial and domestic water consumption, and wastewater discharge. To link the agricultural sector with the water sector, the available water for irrigation was estimated according to the decision processes priorities. The demand of water for industrial and domestic use and the demand for hydropower generation have higher priority than the demand for irrigation. The available water for irrigation in a period is calculated according to Equation (1):
where is the water source (i.e., groundwater or surface water). The available water for irrigation in a period depends on the amount of water in the water stocks in the period of time on the balance of water inflows and outflow, such as domestic demand () industrial demand (), and environmental outflow (). In addition, it depends on the wastewater recovery available for irrigation () and the desalinisation water available for irrigation ().
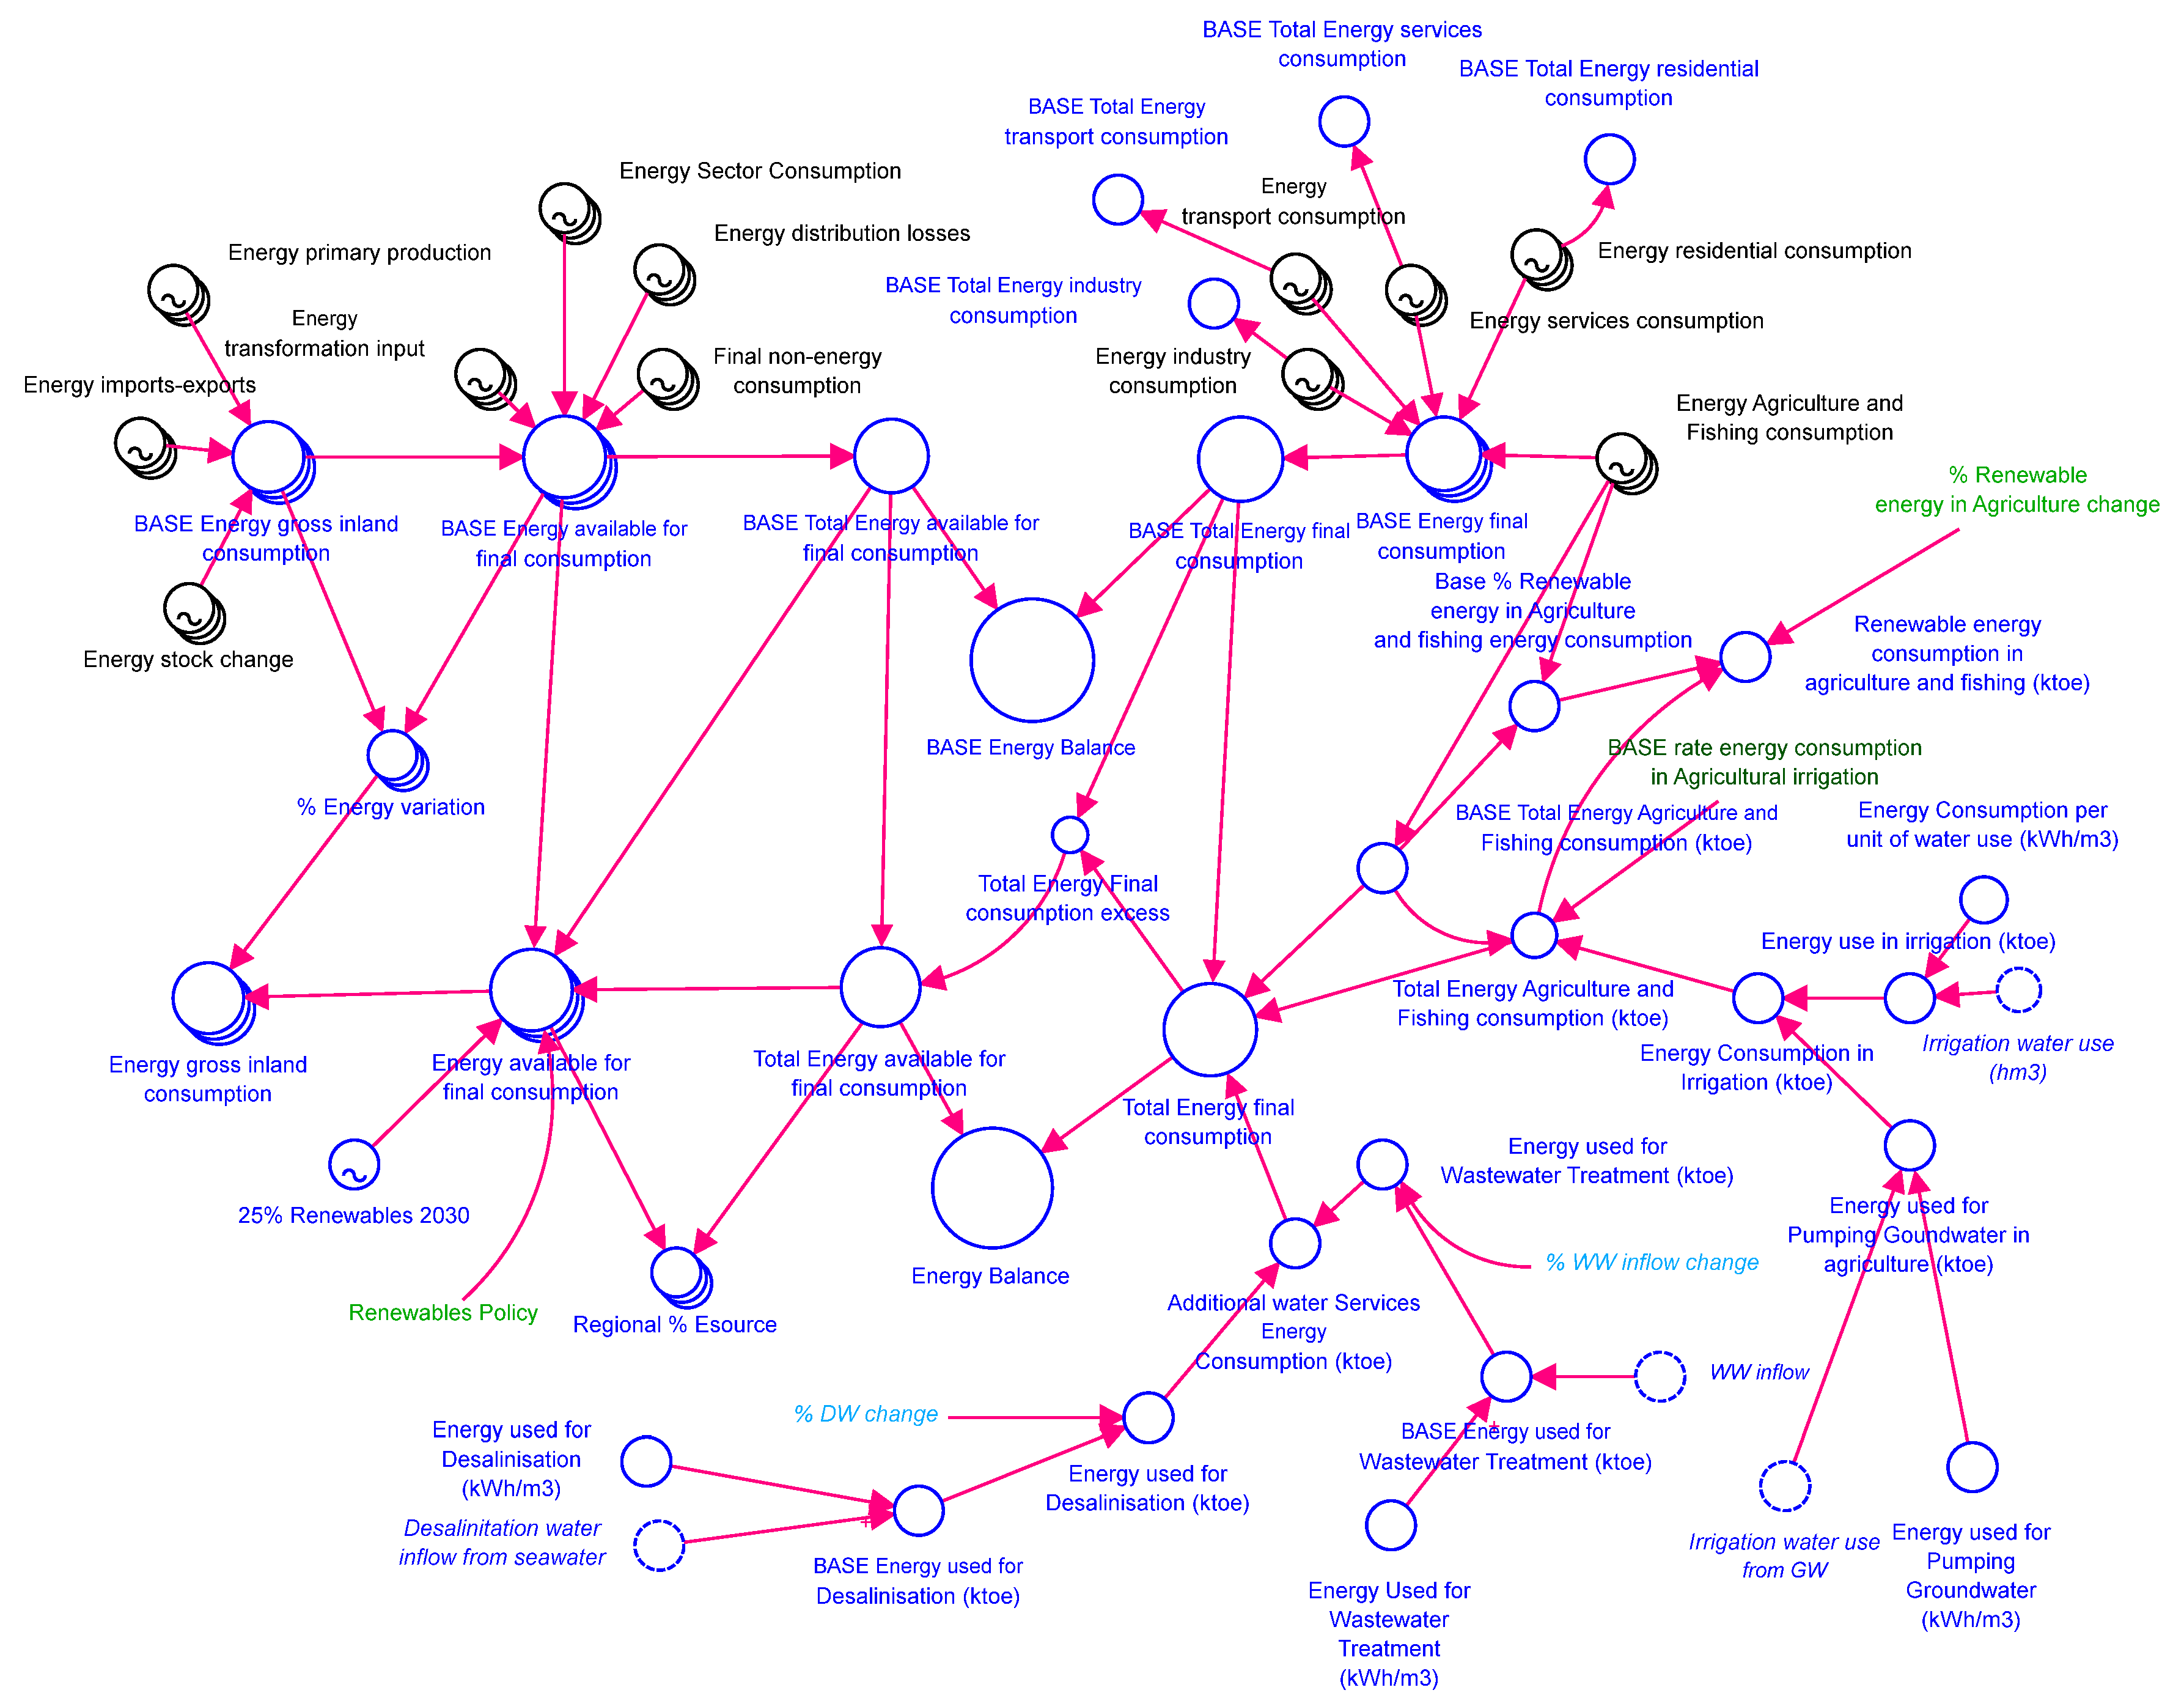
In the energy sector (Figure 5), an energy balance was struck. The energy available for final consumption derived from the energy sources was compared with the energy consumed by different economic sectors. The energy balance was then calculated according to Equation (2).
where is time, and is the energy source (i.e., solids, oil, gas, renewables, electricity, and heat). From the left side of the equation, is the gross inland consumption, is the energy transformation input, is the energy sector consumption, is the distribution losses, and is the final non-energy consumption. From the right side, is industrial consumption, is residential consumption, is transport consumption, is service consumption, and is agricultural and fishing consumption.
Within energy consumption, the model showed in greater detail the energy consumption by the agricultural sector, especially the consumption for irrigation. Energy consumption corresponding to the energy used for desalination and wastewater treatment was also shown.
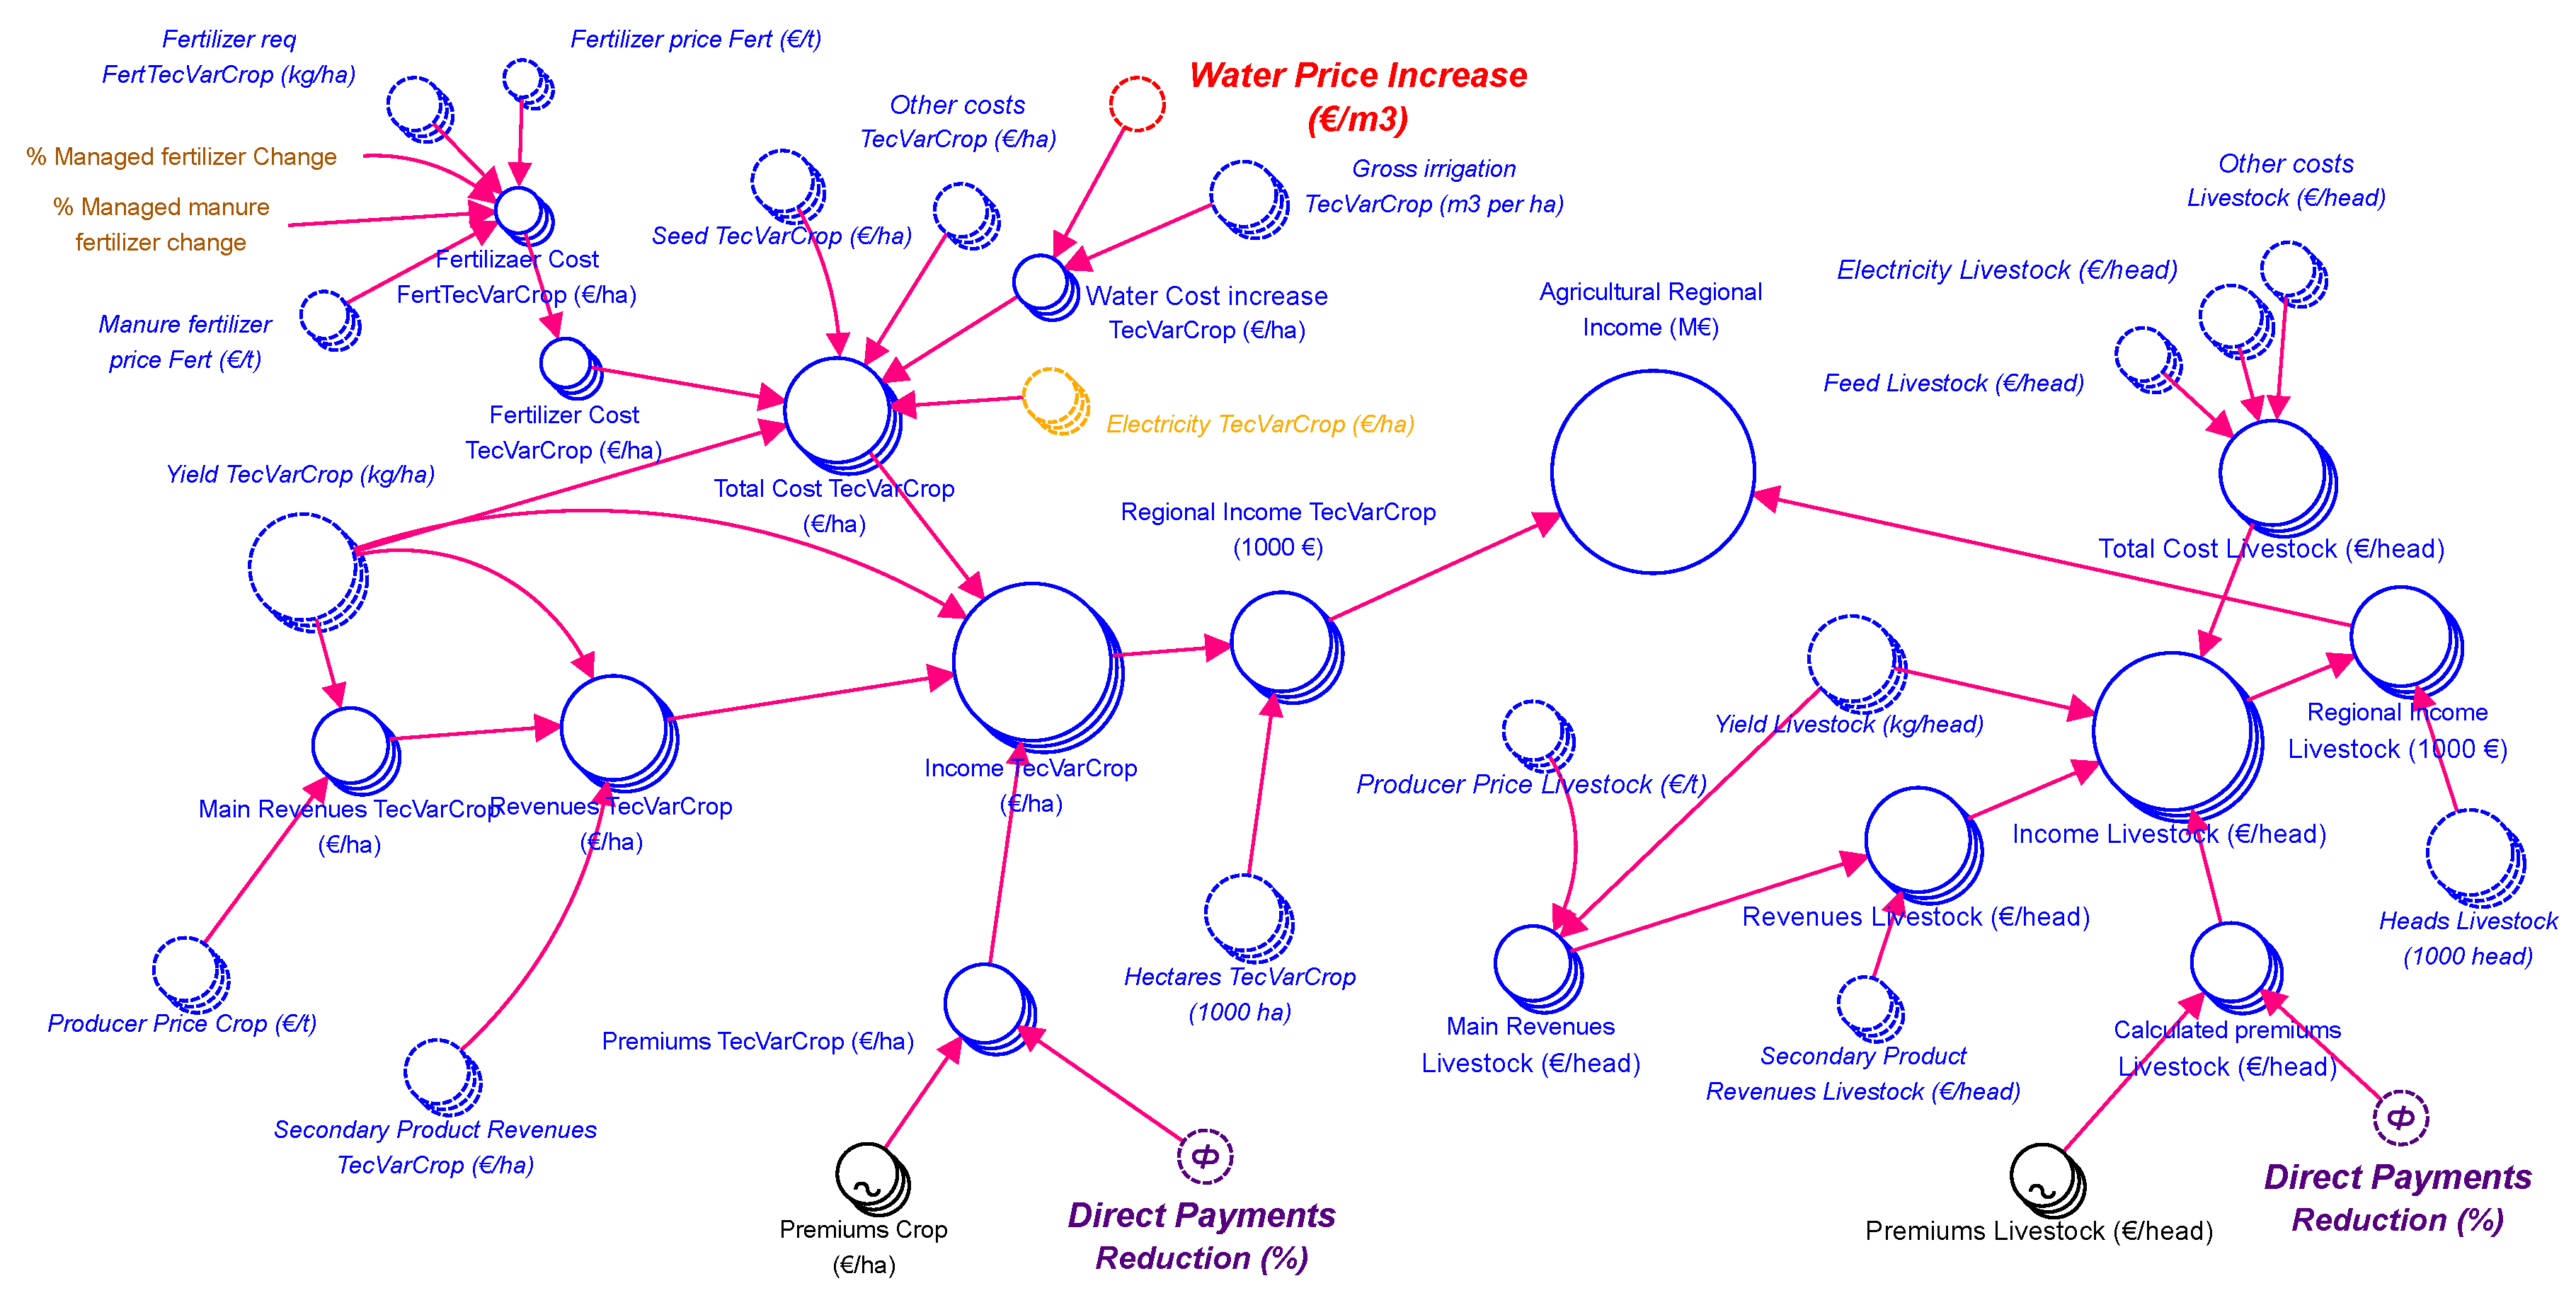
The food/land sector is the core of the model and was divided into food and land sub-sectors. The food sub-sector (Figure 6) is focused on the productive and economic aspects of the agricultural sector, such as the yields, costs, revenues, and incomes per activity and per hectare. In addition, it is the most strongly interrelated with the rest of the sectors (e.g., agricultural energy consumption with the energy model and the use of water for irrigation with the water model). The activities modelled included 33 crops and 14 livestock activities. Each of these activities had its own sub-model to better represent the particular conditions of production. Despite simulating livestock, this research focused more on crop activities. In this sense, for crops that require irrigation, differentiation in the amount of irrigation water required was made. Therefore, there were certain crops with two variants, i.e., irrigated and rainfed. Data projections for prices, premiums, yields, and cultivated hectares were taken from other models (as explained in Section 3.3, in food/land data sources), but were calculated in the SDM through linear interpolations. Variables such as gross irrigation, fertilizer requirements, secondary revenues, and specific costs were calculated in the model with constants as the functions from the yields for each crop. To calculate the economic effects of the sector in the region, the average income from crops was calculated according to Equation (3).
where is the crop, is a variant (i.e., irrigated or rainfed), and is time. For all crops, the yield () is multiplied by the crop price (); then, the secondary revenues () and premiums are added, and the total costs are subtracted to calculate the income per crop. Finally, the weighted averages are calculated based on the number of hectares cultivated (i.e., for each crop and for the utilised agricultural area ) to calculate the average income from crops ().
In the land subsector, a balance of surfaces was carried out. This balance consisted of calculating the surface for each sector and verifying that it did not exceed the available surface according to the land use projections from the region. For example, if the hectares planted with a crop increase, the sum of the hectares for the rest of the crops must decrease by the same amount so that the total UAA does not exceed the permissible limit. In that sense, all the sums must be consistent; the cultivated hectares per crop and the set-aside and fallow land were added to calculate the UAA. Finally, the total land use was calculated by adding the UAA, built-up areas, forests and natural areas, and water surface.
3.3. Data and Projections
The model development was initially based on a nexus conceptual model, validated by the stakeholders in the study carried out by Martínez et al. [57], which was also based on assumptions aligned with other models and studies, as explained in Section 3.4. For the model population, data until 2018 were collected primarily from local statistical sources, stakeholders, and the literature. Data to 2050 were gathered from projections made for national and regional plans, EU outlooks, and the CAPRI-Water model.
CAPRI is a partial equilibrium economic model developed to evaluate the agricultural sector and analyse the ex-ante impacts of agricultural, environmental, and trade policies in the European Union [62]. CAPRI-Water is a CAPRI version that differentiates between irrigated and rainfed agricultural activities. This version enables the exploration of the likely impacts of climate change and water availability on agriculture at the regional level in Europe, as well as the effects of the implementation of policy measures such as water pricing (Blanco et al. [63]). CAPRI-Water was applied to Andalusia in a previous study by Martínez and Blanco [64], which allowed the authors to test and improve the CAPRI data for this region. In the present work, since the water–agriculture interlinkage is one of the most crucial components of the nexus in Andalusia, a number of simulations with CAPRI-Water were undertaken to feed the SDM.
The full details of the data sources by sector are shown below:
- Water
- Statistical data and projections from the hydrological management plans, provided by Andalusian authorities.
- Projections from the CEDEX national study on water availability and the impacts of climate change on water resources (CEDEX [45]).
- Energy
- Food/Land
- Statistical data on agricultural production and land use from Eurostat [68].
- Projections on agricultural markets and land use from the EU agricultural outlook (European Commission [69]).
- Statistical data and projections on agricultural production, irrigation water use, and land use, from the CAPRI-Water model.
3.4. Scenario Definition
The reference scenario, or the baseline, was aligned with the foreseeable evolution of agricultural and industrial markets by 2050 under a status quo situation (European Commission [69]). In policy terms, this represents the continuation of the agricultural policies of CAP 2014–2020 (European Commission [70]) and environmental and water policies. In environmental terms, this is aligned with the IPCC climate scenarios and represents a combination of the shared socio-economic pathway SSP2 (O’Neill et al. [71]) and the representative concentration pathway RCP6.0 (Van Vuuren et al. [72]).
The simulation scenario was built on one of the major drivers identified by stakeholders, i.e., the price of irrigation water (€/m3). Cost recovery through water pricing is considered by the European Union WFD to be a substantial policy measure for economic efficiency, transparency, fairness, and sustainability in the use of water resources (Expósito [43]). Therefore, the scenarios were based on an increase in the price of water per cubic meter over the baseline from 2020 onwards. Two scenarios were modelled; the first scenario envisaged an increase of €0.01/m3 (WP01), and the other predicated an increase of €0.02/m3 (WP02).
4. Results
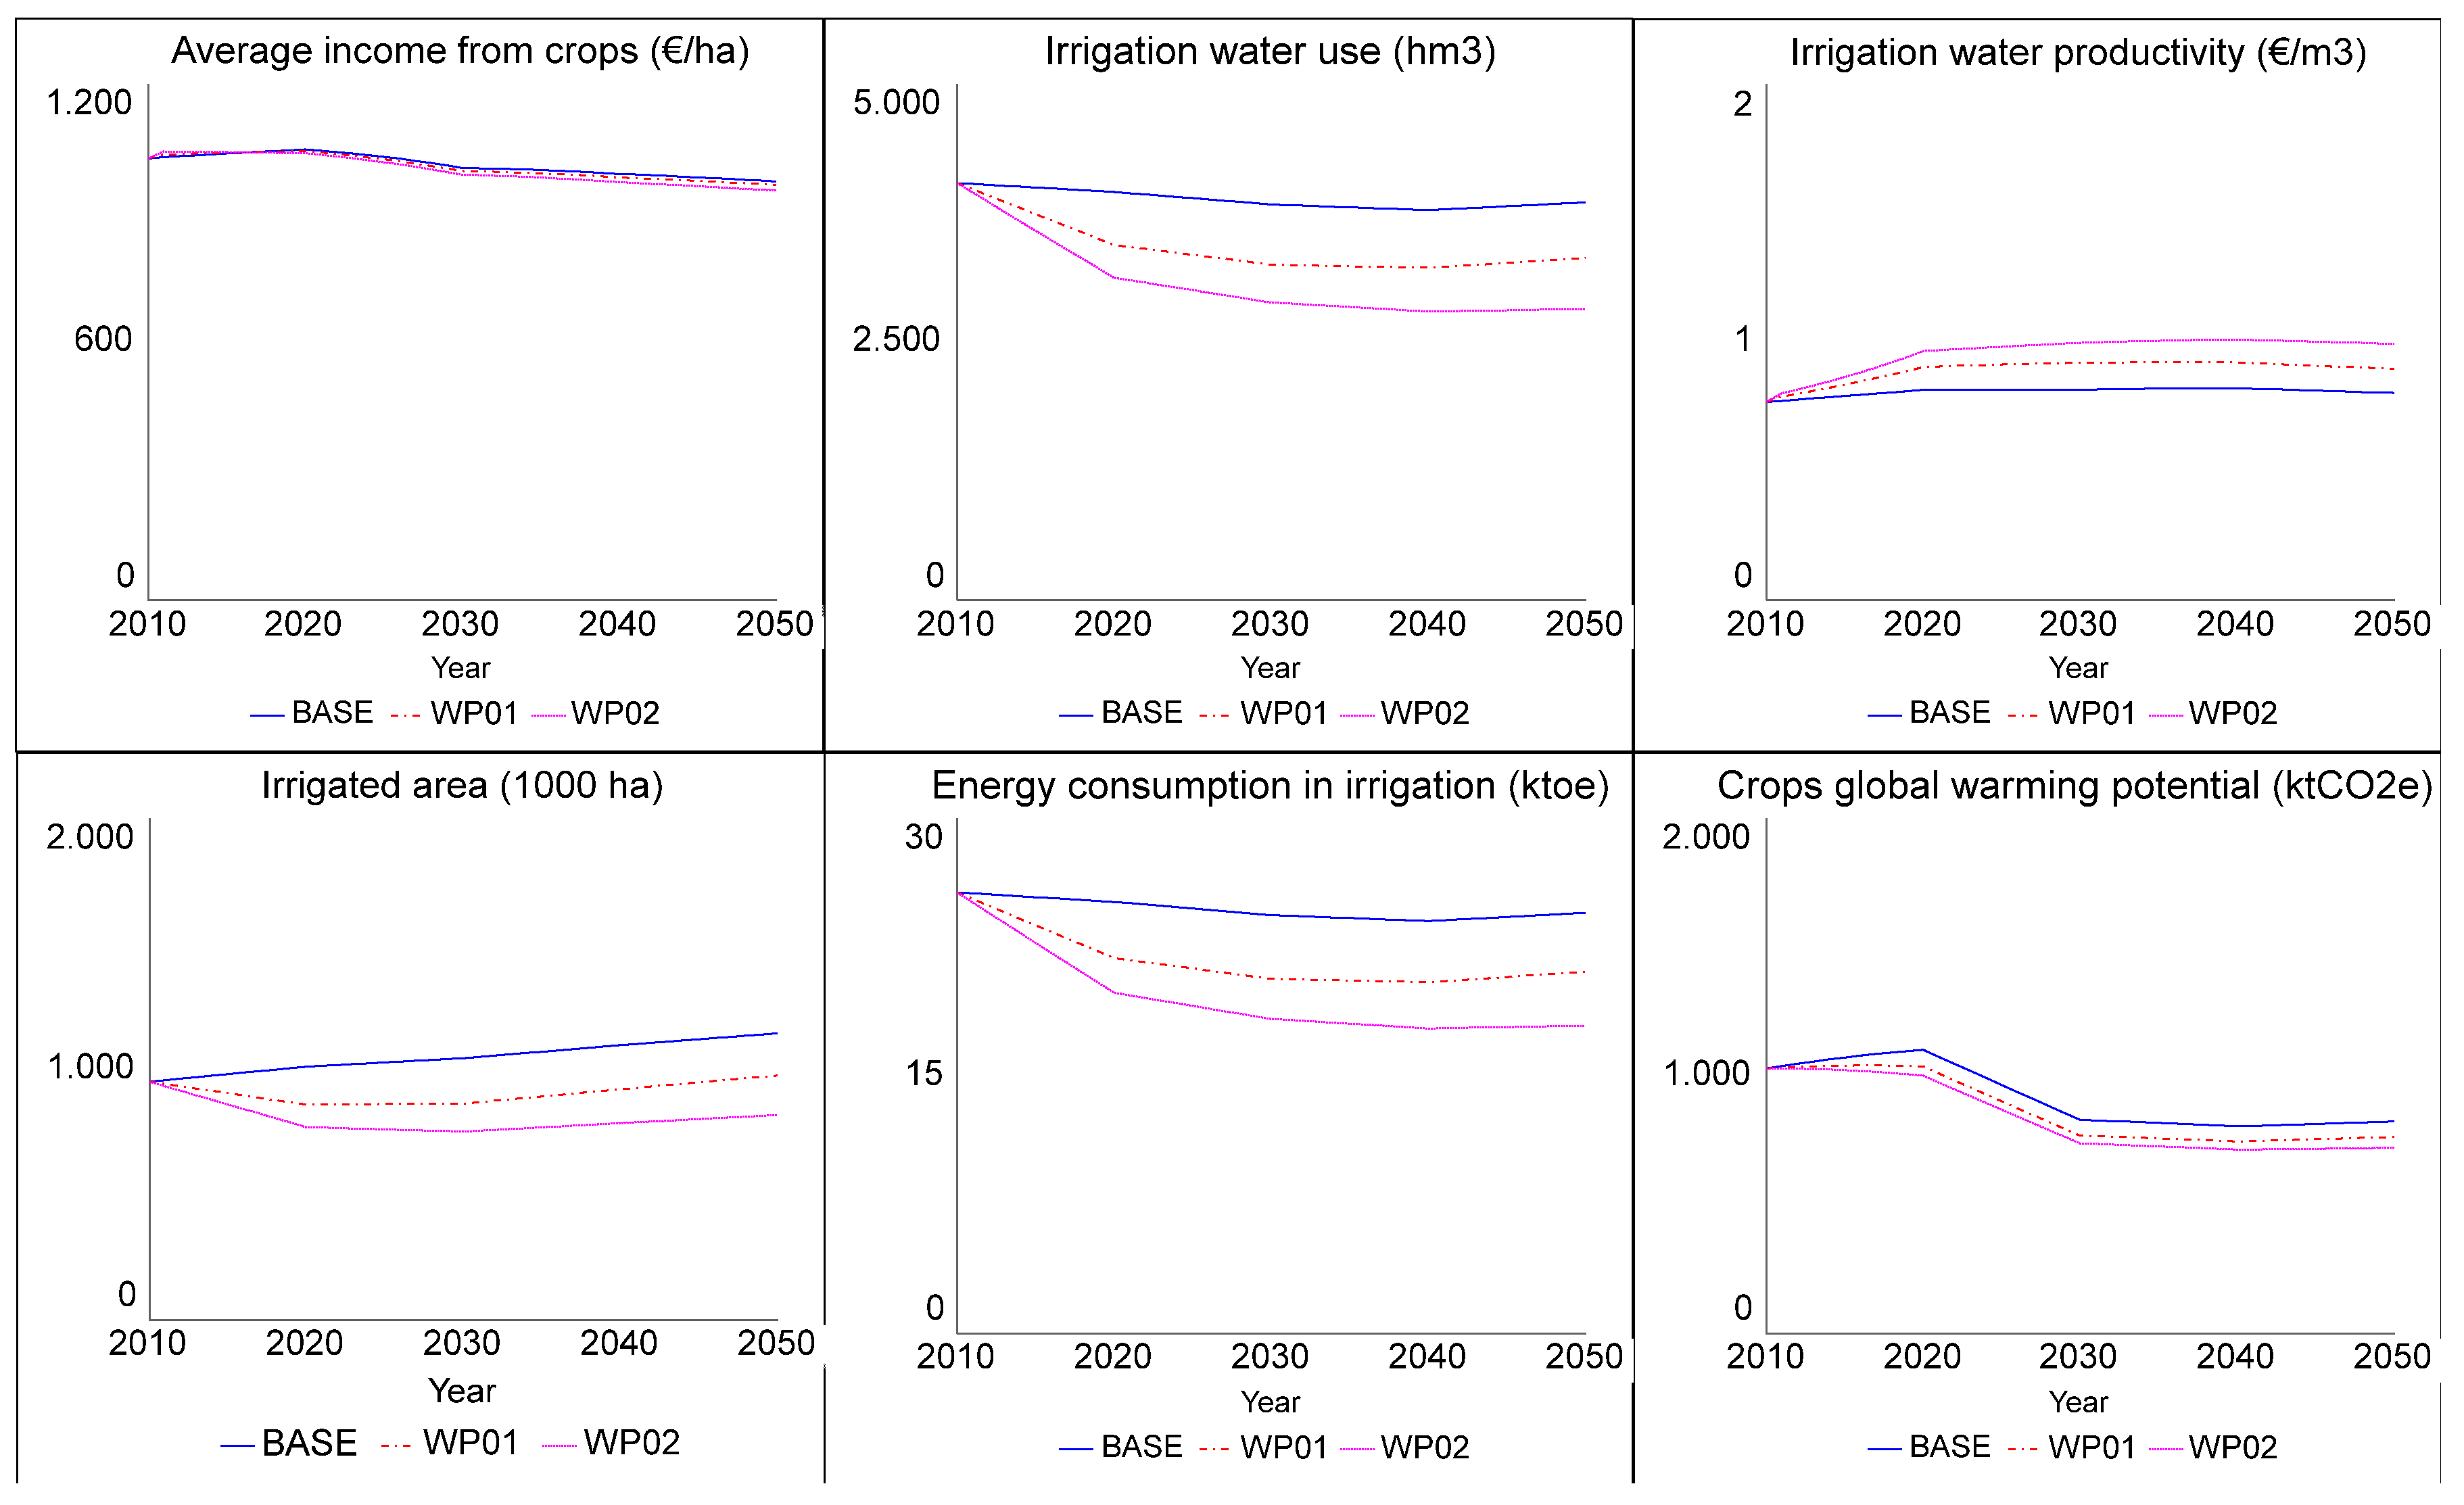
An analysis of the SDM results was made to assess the impact of water pricing policies on some relevant regional level nexus indicators. On the one hand, irrigation water use (cubic hectometres, hm3), energy consumption in irrigation (thousand tonnes of oil equivalent, ktoe), and irrigated area (thousand hectares, 1000 ha) were used to measure the impacts over the utilisation of resources. The average income from crops (euros per hectare, €/ha) and irrigation water productivity (euro per cubic meters, €/m3) were evaluated to measure the per hectare economic profit from agriculture in the region and the productivity of water in economic terms. In addition, the global warming potential (GWP) (thousand tons of carbon dioxide equivalents, ktCO2e) was measured as an environmental sustainability indicator. Finally, the cultivated area (thousands of hectares, thousands ha) for the main crops was analysed to measure the specific impacts on different crops.
Looking at the baseline (BASE) in Figure 7, the average income from crops showed a slight long-term decrease. There was a more pronounced decline between 2020 and 2030, which was mainly due to the decrease in income from vegetable crops, which are highly dependent on water resources. The highest value, €1050/ha, was observed in 2020, and the lowest, €975/ha, was observed in 2050. Irrigation water use and energy consumption for irrigation showed similar slightly negative trends. Irrigation water use was around 3850 hm3, and energy consumption for irrigation was around 24.5 ktoe. However, a steady increase in the irrigated area was observed, from 915 thousand ha in 2010 to 1140 thousand ha in 2050. Irrigation water productivity remained steady throughout the analysed period at around €0.81/m3. Finally, the crops’ GWP showed a strong decrease, notably between 2020 and 2030. It decreased from 1100 ktCO2e to 830 ktCO2e and then remained constant until 2050.
For the main crops produced in Andalusia, continuing with the analysis of the baseline, olives for oil occupied the largest area, with 1675 thousand ha in 2010. This area is expected to continue to increase to 2108 thousand ha in 2050. Of this, approximately 67.7% will be occupied by the rainfed variety of olives for oil. The second most produced crop was durum wheat, which covered 327 thousand ha in 2010. However, it is expected to decrease to 57% of the 2010 area by 2050. Another important crop, sunflower, covered 287 thousand ha in 2010. Among the irrigated crops, citrus fruits have high economic relevance and were an irrigated crop cultivated on around 50 thousand ha in 2010. Citrus is expected to increase to cover 78 thousand ha by 2050. However, stakeholders mentioned that the current demand for citrus is constant and may decrease in the coming years. Rice grown in the region requires substantial irrigation and causes substantial methane emissions. In 2010, rice occupied about 40.4 thousand ha. However, the results show that this crop might almost disappear by 2030, which explains the decrease in GWP during this period. Vegetables are also an important contributor to regional income; among them, tomato crop covering 19 thousand ha in 2010 may occupy a slightly greater area, 21 thousand ha, in 2050. Fodder activities are mainly rainfed and do not have much economic relevance but cover a considerable area. In 2010, they occupied about 1197 thousand ha and are expected to decrease to cover 1111 thousand ha by 2050.
Radar charts allowed the simultaneous analysis of synergies and the trade-offs between different indicators among the scenarios. Figure 8 shows the radar charts of the model results for years 2030 and 2050. The analysis consisted of evaluating the standardized variation of the indicators with respect to the baseline. Looking at the temporal aspect, greater long-term (2050) variations compared to medium-term (2030) variations could be seen. For the synergy analysis, for the average income from crops, a water price increase in both the WP01 and WP02 scenarios causes a decrease of 0.7% and 2.2%, respectively, over the baseline by 2050. Irrigation water use decreased by 13.9% and 26.7%, energy consumption in irrigation decreased by 14.3% and 26.9%, and the irrigated area decreased by 14.4% and 28.2% in the WP1 and WP2 scenarios, respectively, by 2050. Decreases in crop GWP were also observed; WP1 decreased by 7.3%, and WP02 decreased by 12.5% over the baseline by 2050. In addition to the radar chart results, irrigation water productivity increased by 11.7% for WP1 and 23.9% for WP2 over the baseline by 2050.
The crops also will be affected by the water price changes, especially crops that depend heavily on irrigation. In this case, only the WP02 scenario was analysed to observe the most outstanding effects. Under this scenario (WP02), the olives for oil area will change from irrigated to rainfed. The irrigated variant will decrease to 70%, and the rainfed variant will increase by 20.3% from the baseline by 2050. For durum wheat, a mainly rainfed crop, the area under the crop will increase by 1.2% from the baseline by 2050. Similarly, the area of rainfed sunflower will increase by 0.8% from the baseline by 2050. In the case of irrigated citrus fruit, the surface will decrease by 14.7% from the baseline by 2050. The trends for rice were identical in comparison with the baseline, and rice was predicted to almost disappear by 2050. However, the disappearance of this crop occurred early in the water price scenario. Finally, another important irrigated crop is tomato. Despite its high water-demand, the area under irrigated tomato was not sensitive to water price, as it did not show any significant variation in either water price scenario. This is due to its high level of income per hectare, which is up to 39 times greater than the average income from crops by 2050.
5. Discussion
To comprehensively understand the complexity of the WEF nexus [4] and identify coherent policies, we developed a participatory SDM approach to analyse the nexus in Andalusia (Spain). The SDM approach allows one to analyse the synergies and trade-offs of the nexus (Bakhshianlamouki et al. [26]). However, collaborative stakeholder participation is crucial to developing a meaningful model (Sušnik et al. [25]). In this sense, our methodology is well suited for this analysis, as it integrates stakeholder participation in all phases of the SDM development process. Quantifying trade-offs and synergies within the nexus is also a key part of the methodology. In our research, we modelled short- (2020), medium- (2030 and 2040), and long-term (by 2050) projections for the baseline and scenarios. The data used to populate the model are based and aligned on previous studies and models [45,53,63,64,65,66,67,68,69,70,71,72]. The baseline scenario is aligned with the foreseeable evolution of agricultural and industrial markets [69], current agricultural policy [70], and IPCC climate scenarios [71,72]. Water pricing policies were the selected scenarios simulated in the model. The analysis of these policies was identified by the stakeholders and mentioned by different authors (Expósito [43], Iglesias and Blanco [73], Fernández García et al. [52]) as one of the most relevant for the region. However, we have to be cautious performing such an analysis since “projections on water use and water costs are highly uncertain” (Martínez and Blanco [64]).
To our knowledge, this is the first study that has developed a participatory SDM to analyse data projections of the WEF nexus in Andalusia. To develop the analysis, we selected six relevant nexus indicators at the regional level. The selected indicators were as follows: irrigation water use (hm3), energy consumption in irrigation (ktoe), irrigation water productivity (€/m3), irrigated area (thousand ha), GWP (ktCO2e), and average income from crops (€/ha). Given that analysis of the nexus is receiving increasing attention, different research focuses on identifying methodologies to better measure the nexus interlinkages ([1,2,3], Stylianopoulou et al. [74]). Several methodologies are based on an analysis of indicators, such as indicators based on SDGs or WEF security indexes (Stylianopoulou et al. [74], Venghaus and Dieken [75]). Overall, the selected indicators must be selected specifically for each case study; for our selection criteria, the nexus challenges in the region, data projection availability, and the SDM variables were taken into account.
Regarding the results obtained, for the baseline, a reduction in irrigation water use was observed over time. This agrees with the regional study on the availability and use of water carried out by CEDEX [45]. Likewise, energy consumption in irrigation decreased due to the high correlation between both (Corominas et al. [54]; Camacho et al. [49]; Borrego-Marín and Berbel [55]). However, a slight increase in irrigation water productivity was observed. This was due to the technical improvement of irrigation technologies over time, which increased water efficiency (less loss) (Fader et al. [76]), and the growth of more economically productive crops. In this sense, an increase in the irrigated area was also observed, mainly due to the increase in irrigated olive for oil and citrus fruits in pursuit of a decrease in crops such as rice, rainfed fodder activities, and some irrigated cereals, which was endorsed by the stakeholders. However, the average income from crops slightly decreased, mainly due to the decrease in income from vegetable crops, which are highly dependent on water resources. In addition, GWP showed a strong decrease between 2020 and 2030 due to the decrease in rice cultivation, which is a crop that emits a large amount of methane.
For scenarios, some studies developed models to analyse the effect of water pricing policies on the use of irrigation water in Andalusia (Iglesias and Blanco [73], Expósito and Berbel [77], Borrego-Marín et al. [78]). These studies mention that water demand has an inelastic nature for low increases in water prices (€0.01/m3 or €0.02/m3). In general, these studies address water pricing policies through a static analysis, where policy scenarios are analysed from a base year. In our case, the use of data projections in the model increased the effects of the water pricing scenario on the variable analysed; consequently, the elasticity of water demand was increased since the application of water pricing policies in the scenarios reduces the use of irrigation water to a greater extent. Furthermore, as mentioned before, the trend in irrigation water use is already decreasing in the baseline, which starts our model from a different state.
For the rest of variables, a few studies analysed the related effects of water price policies. Similar to the baseline analysis, an increase in water price causes a decrease in energy consumption due to the high correlation between energy consumption in irrigation and irrigation water use. Likewise, water pricing policies increase irrigation water productivity. Decrease in the irrigated area is also seen. Moreover, there is great variability in changing the area between the different crops, and water pricing policies make farmers switch their crops from irrigated to rainfed. Expósito and Berbel analysed in more detail the effects of these policies on the different crops in the region. Similar to our results, these authors mentioned that some crops that depend heavily on irrigation water, such as rice, tend to disappear under certain water pricing scenarios. GWP is also reduced by an increase in water price; this is related to a decrease in energy consumption. Finally, an increase in the price of water has a direct effect on costs, so the average income from crops tends to decrease.
In our study, one of the main limitations is that the analysis is carried out at the regional level; therefore, it does not allow us to analyse in detail the effects at the sub-regional level. These limitations were pointed out by the stakeholders during the fourth workshop (webinar). They mentioned that it is important to improve the water model sector by introducing provincial water sub-systems. According to Sušnik et al. [25], “Appropriate spatial scale selection for the case study and nexus sectors is important in producing reliable model outputs”. In this sense, future research could focus on detailing an analysis for the river basin or provincial water sub-systems. This adds greater difficulty due to the need to reconcile the scale at which political decisions are made (regional scale) with the appropriate scale to analyse the different sectors (water at the basin scale; and energy and agriculture at the regional or provincial scale). Likewise, the water, energy and food subsectors must be disaggregated, and the different phases of production and consumption must be represented. In addition, in the process of identifying policy scenarios, the stakeholders raised as other possible scenarios a decrease in agricultural subsidies or energy pricing. In this sense, to model the new scenarios, the process must begin at the methodological step three, redefining the conceptual model to address the new challenges, and continue with the iterative process until step six, application of the SDM.
6. Concluding Remarks
This research developed a participatory SDM to identify interlinkages in the WEF nexus and analyse how agricultural and environmental policies can be better coordinated to deal with major pressures on land and water in Andalusia (Spain). To identify nexus-coherent policies, quantitative and qualitative methods were combined. On the one hand, statistical data and projections were used in the quantitative development process. On the other hand, this study was carried out in collaboration with a panel of stakeholders drawn from various groups ranging from policymakers responsible for deciding regional strategies and regulations to representatives of private associations and civil society. Stakeholders participated by expressing their opinions on the nexus interlinkages and the main nexus challenges. They also contributed their judgment of the result validation at each step of the study.
The results indicate that a water–energy–agriculture balance is crucial for the socio-economic development of the primary sector in Andalusia. Long-term results from the baseline scenario show a sensitive relationship between water availability, irrigation costs (including energy cost), and agricultural production. This is, in part, due to the large investment made in irrigation systems for agriculture. In the analysed scenarios, the increase in water price affects the average income from crops (€/ha) negatively. This is offset to a greater extent by the costs of saved irrigation water (hm3), irrigation energy savings (ktoe), and a reduction of the crops’ GWP (ktCO2e). In addition, the non-irrigated area can be used for growing rainfed crops or promoting ecological focus areas to counter soil erosion. The empirical findings show that a water pricing policy is necessary to promote water-savings to overcome the impending water scarcity. Our analysis suggests that the combination of water pricing and energy efficiency improvement has the highest systemic relevance for the economic aspects of the agricultural sector.
Beyond the results obtained, the present study provided the opportunity to share information and opinions among a diverse group, including policymakers, researchers, and private associations, with a common objective—to achieve sustainable development of the WEF nexus in Andalusia. In the various workshops, the debate on political decisions to solve current and future challenges helped identify sustainable strategies.
Author Contributions
Conceptualization, A.G.-R. and M.B.; methodology, A.G.-R. and M.B.; software, A.G.-R.; validation, M.B. and I.A.; formal analysis, A.G.-R.; data curation, A.G.-R.; writing—original draft preparation, A.G.-R.; writing—review and editing, M.B. and I.A.; supervision, M.B. All authors have read and agreed to the published version of the manuscript.
Funding
This research was funded by the European Union’s Horizon 2020 research and innovation programme, under Grant Agreement NO 689150 SIM4NEXUS, and the MINECO/ERDF in the framework of the 2013–2016 R&D National Plan, ECO2015-64438-R SYNERCAP.
Acknowledgments
Thanks to all the stakeholders who participated in the workshops for their invaluable contributions to the development of this research.
Conflicts of Interest
The authors declare no conflict of interest.
References
- Aboelnga, H.T.; Halifa, M.; McNamara, I.; Ribbe, L.; Sycz, J. The Water Energy Security Nexus. A Review of Nexus Literature and Ongoing Nexus Initiatives for Policy Makers; Nexus Regional Dialogue Program: Bonn, Germany, 2018; Available online: https://www.water-energy-food.org/resources/water-energy-food-nexus-literature-review-a-review-of-nexus-literature-and-ongoing-nexus-initiatives-for-policymakers (accessed on 12 November 2020).
- Albrecht, T.R.; Crootof, A.; Scott, C.J. The Water-Energy-Food Nexus: A systematic review of methods for nexus assessment. Environ. Res. Lett. 2018, 13, 043002. [Google Scholar] [CrossRef]
- Dai, J.; Wu, S.; Han, G.; Weinberg, J.; Xie, X.; Wu, X.; Song, X.; Jia, B.; Xue, W.; Yang, Q. Water-energy nexus: A review of methods and tools for macro-assessment. Appl. Energy 2018, 210, 393–408. [Google Scholar] [CrossRef]
- Hoff, H. Understanding the Nexus: Background Paper for the Bonn 2011 Conference: The Water, Energy and Food Security Nexus; Stockholm Environment Institute: Stockholm, Sweden, 2011; Available online: https://www.sei-international.org/publications?pid=1977 (accessed on 8 September 2020).
- Bazilian, M.; Rogner, H.; Howells, M.; Hermann, S.; Arent, D.J.; Gielen, D.; Steduto, P.; Mueller, A.; Komor, P.; Tol, R.S.; et al. Considering the energy, water and food nexus: Towards an integrated modelling approach. Energy Policy 2011, 39, 7896–7906. [Google Scholar] [CrossRef]
- Kurian, M. The water-energy-food nexus. Environ. Sci. Policy 2017, 68, 97–106. [Google Scholar] [CrossRef]
- Liu, J.; Hull, V.; Godfray, H.C.J.; Tilman, D.; Gleick, P.; Hoff, H.; Pahl-Wostl, C.; Xu, Z.; Chung, M.G.; Sun, J.; et al. Nexus approaches to global sustainable development. Nat. Sustain. 2018, 1, 466–476. [Google Scholar] [CrossRef]
- Muizniece, I.; Kubule, A.; Blumberga, D. Towards understanding the transdisciplinary approach of the bioeconomy nexus. Energy Procedia 2018, 147, 175–180. [Google Scholar] [CrossRef]
- Cai, X.; Wallington, K.; Shafiee-Jood, M.; Marston, L. Understanding and managing the food-energy-water nexus—Opportunities for water resources research. Adv. Water Resour. 2018, 111, 259–273. [Google Scholar] [CrossRef]
- Foran, T. Node and Regime: Interdisciplinary Analysis of Water-Energy-Food Nexus in the Mekong Region. Water Altern. 2015, 8, 655–674. Available online: http://www.water-alternatives.org/index.php/alldoc/articles/vol8/v8issue1/270-a8-1-3/file?auid=26 (accessed on 9 September 2020).
- Johnson, O.W.; Karlberg, L. Co-exploring the Water-Energy-Food Nexus: Facilitating Dialogue through Participatory Scenario Building. Front. Environ. Sci. 2017, 5, 24. [Google Scholar] [CrossRef] [Green Version]
- Howells, M.; Hermann, S.; Welsch, M.; Bazilian, M.; Segerstrom, R.E.; Alfstad, T.; Gielen, D.; Rogner, H.H.; Fischer, G.; Van Velthuizen, H.; et al. Integrated analysis of climate change, land-use, energy and water strategies. Nat. Clim. Chang. 2013, 3, 621–626. [Google Scholar] [CrossRef]
- Daher, B.T.; Mohtar, R.H. Water-energy-food (WEF) Nexus Tool 2.0: Guiding integrative resource planning and decision-making. Water Int. 2015, 40, 748–771. [Google Scholar] [CrossRef]
- De Strasser, L.; Lipponen, A.; Howells, M.; Stec, S.; Bréthaut, C. A Methodology to Assess the Water Energy Food Ecosystems Nexus in Transboundary River Basins. Water 2016, 8, 59. [Google Scholar] [CrossRef]
- Smajgl, A.; Ward, J.; Pluschke, L. The water–food–energy Nexus—Realising a new paradigm. J. Hydrol. 2016, 533, 533–540. [Google Scholar] [CrossRef]
- Yung, L.; Louder, E.; Gallagher, L.A.; Jones, K.; Wyborn, C. How Methods for Navigating Uncertainty Connect Science and Policy at the Water-Energy-Food Nexus. Front. Environ. Sci. 2019, 7, 37. [Google Scholar] [CrossRef] [Green Version]
- Forrester, J.W. Industrial Dynamics. J. Oper. Res. Soc. 1997, 48, 1037–1041. [Google Scholar] [CrossRef]
- Ford, A.; Ford, F.A. Modeling the Environment: An Introduction to System Dynamics Models of Environmental Systems; Island Press: Washington, DC, USA, 1999. [Google Scholar]
- Sterman, J. Business Dynamics; Irwin McGraw-Hill: New York, NY, USA, 2010. [Google Scholar]
- Feng, M.; Liu, P.; Li, Z.; Zhang, J.; Liu, D.; Xiong, L. Modeling the nexus across water supply, power generation and environment systems using the system dynamics approach: Hehuang Region, China. J. Hydrol. 2016, 543, 344. [Google Scholar] [CrossRef]
- Chhipi-Shrestha, G.; Hewage, K.; Sadiq, R. Water-Energy-Carbon Nexus Modeling for Urban Water Systems: System Dynamics Approach. J. Water Resour. Plan. Manag. 2017, 143, 04017016. [Google Scholar] [CrossRef]
- Hussien, W.A.; Memon, F.A.; Savić, D. An integrated model to evaluate water-energy-food nexus at a household scale. Environ. Model. Softw. 2017, 93, 366–380. [Google Scholar] [CrossRef] [Green Version]
- Sušnik, J. Data-driven quantification of the global water-energy-food system. Resour. Conserv. Recycl. 2018, 133, 179–190. [Google Scholar] [CrossRef]
- Aracil, J.; Gordillo, F. Dinámica de Sistemas, 1st ed.; Isdefe: Madrid, España, 1995. (In Spanish) [Google Scholar]
- Sušnik, J.; Chew, C.; Domingo, X.; Mereu, S.; Trabucco, A.; Evans, B.; Vamvakeridou-Lyroudia, L.; Savić, D.; Laspidou, C.S.; Brouwer, F. Multi-Stakeholder Development of a Serious Game to Explore the Water-Energy-Food-Land-Climate Nexus: The SIM4NEXUS Approach. Water 2018, 10, 139. [Google Scholar] [CrossRef] [Green Version]
- Bakhshianlamouki, E.; Masia, S.; Karimi, P.; Van Der Zaag, P.; Sušnik, J. A system dynamics model to quantify the impacts of restoration measures on the water-energy-food nexus in the Urmia lake Basin, Iran. Sci. Total Environ. 2020, 708, 134874. [Google Scholar] [CrossRef] [PubMed]
- Bréthaut, C.; Gallagher, L.; Dalton, J.; Allouche, J. Power dynamics and integration in the water-energy-food nexus: Learning lessons for transdisciplinary research in Cambodia. Environ. Sci. Policy 2019, 94, 153–162. [Google Scholar] [CrossRef] [Green Version]
- Sharifinejad, A.; Zahraie, B.; Majed, V.; Ravar, Z.; Hassani, Y. Economic analysis of Water-Food-Energy Nexus in Gavkhuni basin in Iran. J. Hydro Envrion. Res. 2020, 31, 14–24. [Google Scholar] [CrossRef]
- Kimmich, C.; Gallagher, L.; Kopainsky, B.; Dubois, M.; Sovann, C.; Buth, C.; Bréthaut, C. Participatory Modeling Updates Expectations forIndividuals and Groups, Catalyzing BehaviorChange and Collective Action inWater--Energy--Food NexusGovernance. Earth Futur. 2019, 7, 1337–1352. [Google Scholar] [CrossRef]
- Sistema de Indicadores de Desarrollo Sostenible de Andalucía para la Agenda 2030. (In Spanish). Available online: https://www.juntadeandalucia.es/institutodeestadisticaycartografia/ods/index.htm (accessed on 9 September 2020).
- SIM4NEXUS. Available online: https://www.sim4nexus.eu/ (accessed on 9 September 2020).
- Junta de Andalucía. Informe Económico de Andalucía 2017; Consejería de Economía y Conocimiento; Junta de Andalucía: Sevilla, España, 2018. Available online: https://www.juntadeandalucia.es/export/drupaljda/InformeEconomico2017.pdf (accessed on 5 November 2020). (In Spanish)
- Massot, A. Research for Agri-Comitee—Agriculture in Andalusia; European Parliament; Directorate General for Internal Policies: Brussels, Belgium, 2016. [Google Scholar] [CrossRef]
- Junta de Andalucía. Datos Energéticos de Andalucía 2017; Agencia Andaluza de Energía; Consejería de Empleo, Empresa y Comercio; Junta de Andalucía: Sevilla, España, 2018. (In Spanish)
- Junta de Andalucía. Estrategia Energética de Andalucía 2020; Consejería de Empleo; Empresa y Comercio; Junta de Andalucía: Sevilla, España, 2015. (In Spanish)
- Junta de Andalucía. Informe de Medio Ambiente de Andalucía 2018; Consejería de Agricultura, Ganadería; Pesca y Desarrollo Sostenible.: Sevilla, España, 2019; Available online: http://www.juntadeandalucia.es/medioambiente/portal_web/ima/2018/iMA_2018.pdf (accessed on 6 November 2020). (In Spanish)
- Añó-Vidal, C.; Sánchez-Díaz, J. Bibliometric Analysis of the Scientific Production on Soil Erosion in Andalusia (1964–2008). Rev. Estud. Andal. 2018, 35, 193–213. [Google Scholar]
- Paneque, P.; Lafuente-Fernández, R.; Vargas, J. Public Attitudes toward Water Management Measures and Droughts: A Study in Southern Spain. Water 2018, 10, 369. [Google Scholar] [CrossRef] [Green Version]
- Peña-Gallardo, M.; Gámiz-Fortís, S.R.; Castro-Diez, Y.; Esteban-Parra, M.J. Comparative analysis of drought indices in Andalusia during the period 1901–2012. Geogr. Res. Lett. 2016, 42, 67–88. [Google Scholar]
- del Campo, A. La modernización del regadío español desde el punto de vista social. Ef. Mod. Regadíos España Econ. 2017, 30, 119–145. (In Spanish) [Google Scholar]
- European Commission. Directive (2000/60/ec) water framework directive of the European parliament and of the council. OJL 2000, 327, 1–73. [Google Scholar]
- European Commission. Towards Sustainable Water Management in the European Union. First Stage in the Implementation of the Water Framework Directive 2000/60/ec. In Accompanying Document to the Communication from the Commission to the European Parliament and the Council; Com 128 Final; European Commission: Brussels, Belgium, 2007. [Google Scholar]
- Expósito, A. Irrigated Agriculture and the Cost Recovery Principle of Water Services: Assessment and Discussion of the Case of the Guadalquivir River Basin (Spain). Water 2018, 10, 1338. [Google Scholar] [CrossRef] [Green Version]
- Blanco, M.; Ramos, F.; Van Doorslaer, B.; Martínez, P.; Fumagalli, D.; Ceglar, A.; Fernández, F.J. Climate change impacts on EU agriculture: A regionalized perspective taking into account market-driven adjustments. Agric. Syst. 2017, 156, 52–66. [Google Scholar] [CrossRef]
- CEDEX. Evaluación del Impacto del Cambio Climático en los Recursos Hídricos y Sequías en España; Centro de Estudios y Experimentación en Obras Públicas; Ministerio de Fomento, Gobierno de España: Madrid, España, 2017; Available online: http://www.cedex.es/NR/rdonlyres/3B08CCC1-C252-4AC0-BAF7-1BC27266534B/145732/2017_07_424150001_Evaluaci%C3%B3n_cambio_clim%C3%A1tico_recu.pdf (accessed on 5 November 2020). (In Spanish)
- Lorite, I.J.; Gabaldón-Leal, C.; Santos, C.; Cruz-Blanco, M.; León, L.; Porras, R.; Belaj, A.; de la Rosa, R. Impacto del Cambio Climático Sobre la Agricultura Andaluza: Olivar; Consejería de empleo, empresa y comercio; Junta de Andalucía: Sevilla, España, 2019. Available online: https://www.juntadeandalucia.es/export/drupaljda/CC_Olivar_Divulgacion_06-02-2019.pdf (accessed on 7 November 2020). (In Spanish)
- Seguros Agrario. Consejería de Agricultura, Ganadería, Pesca y Desarrollo Sostenible. Junta de Andalucía. Available online: https://www.juntadeandalucia.es/organismos/agriculturaganaderiapescaydesarrollosostenible/areas/agricultura/seguros-agrarios.html (accessed on 7 November 2020).
- BOE-A-2006-4415. Real Decreto 287/2006, de 10 de Marzo, por el que se Regulan las Obras Urgentes de Mejora y Consolidación de Regadíos, con Objeto de Obtener un Adecuado Ahorro de Agua que Palie los Daños Producidos por la Sequía; Ministerio de la Presidencia: Madrid, España, 2006; Available online: https://www.boe.es/diario_boe/txt.php?id=BOE-A-2006-4415 (accessed on 9 September 2020). (In Spanish)
- Camacho, E.; Rodríguez, J.A.; Montesinos, P. Ahorro de agua y consumo de energía en la modernización de regadíos. In Efectos de la Modernización de Regadíos en España; Serie Economía 30; Cajamar Caja Rural: Amería, España, 2017; pp. 221–249. (In Spanish) [Google Scholar]
- MAPA. Encuesta Sobre Superficies y Rendimientos (ESYRCE), Informe Sobre Regadíos en España; Ministerio de Agricultura, Pesca y Alimentación: Madrid, España, 2019; Available online: https://www.mapa.gob.es/es/estadistica/temas/estadisticas-agrarias/regadios2019_tcm30-526243.pdf (accessed on 9 September 2020). (In Spanish)
- Berbel, J.; Expósito, A.; Gutiérrez-Martín, C.; Mateos, L. Effects of the Irrigation Modernization in Spain 2002–2015. Water Resour. Manag. 2019, 33, 1835–1849. [Google Scholar] [CrossRef]
- Fernández García, I.; Rodríguez Díaz, J.; Camacho Poyato, E.; Montesions, P.; Berbel, J. Effects of modernization and medium term perspectives on water and energy use in irrigation districts. Agric. Syst. 2014, 131, 56–63. [Google Scholar] [CrossRef]
- Instituto Nacional de Estadísitica. Encuesta Sobre el Uso del Agua en el Sector Agrario, Serie 2000–2018. (In Spanish). Available online: https://www.ine.es/dynt3/inebase/few.htm?type=pcaxis&path=/t26/p067/p03/serie&file=pcaxis&L=0 (accessed on 9 September 2020).
- Corominas, J. Análisis de las Modernizaciones de Regadíos en Andalucía; Consejería de Agricultura y Pesca; Junta de Andalucía: Sevilla, Spain, 2011. (In Spanish) [Google Scholar]
- Borrego-Marín, M.M.; Berbel, J. Impacto de la Modernización de Regadíos Sobre el Uso del Agua y Otras Variables Socioeconómicas en Comunidades de Regantes de Andalucía Occidental. In Efectos de la Modernización de Regadíos en España; Serie Economía 30; Cajamar Caja Rural: Almería, España, 2017; pp. 345–354. (In Spanish) [Google Scholar]
- Junta de Andalucía. Estrategia Andaluza de Desarrollo Sostenible 2030; Consejería de Agricultura Ganadería; Pesca y Desarrollo Sostenible; Junta de Andalucía: Sevilla, España, 2019. (In Spanish) [Google Scholar]
- Martinez, P.; Blanco, M.; Castro-Campos, B. The Water-Energy-Food Nexus: A Fuzzy-Cognitive Mapping Approach to Support Nexus-Compliant Policies in Andalusia (Spain). Water 2018, 10, 664. [Google Scholar] [CrossRef] [Green Version]
- Flammini, A.; Puri, M.; Pluschke, L.; Dubois, O. Walking the Nexus Talk: Assessing the Water-Energy-Food Nexus in the Context of the Sustainable Energy for All Initiative; FAO: Rome, Italy, 2014. [Google Scholar]
- Mabhaudhi, T.; Nhamo, L.; Mpandeli, S.; Nhemachena, C.; Senzanje, A.; Sobratee, N.; Chivenge, P.; Slotow, R.; Naidoo, D.; Liphadzi, S.; et al. The Water-Energy-Food Nexus as a Tool to Transform Rural Livelihoods and Well-Being in Southern Africa. Int. J. Environ. Res. Public Health 2019, 16, 2970. [Google Scholar] [CrossRef] [PubMed] [Green Version]
- Momblanch, A.; Papadimitriou, L.; Jain, S.K.; Kulkarni, A.; Ojha, C.S.; Adeloye, A.J.; Holman, I.P. Untangling the water-food-energy-environment nexus for global change adaptation in a complex Himalayan water resource system. Sci. Total Environ. 2019, 655, 35–47. [Google Scholar] [CrossRef]
- Isee Systems. Available online: https://www.iseesystems.com/ (accessed on 9 September 2020).
- Britz, W.; Witzke, H. CAPRI Model Documentation. 2014. Available online: https://www.capri-model.org/docs/capri_documentation.pdf (accessed on 9 September 2020).
- Blanco, M.; Witzke, H.P.; Perez-Domínguez, I.; Salputra, G.; Martínez, P. Extension of the CAPRI Model with an Irrigation Sub-Module; EUR 27737 EN; Joint Research Centre; European Commission: Seville, Spain, 2015. [Google Scholar] [CrossRef]
- Martinez, P.; Blanco, M. Sensitivity of Agricultural Development to Water-Related Drivers: The Case of Andalusia (Spain). Water 2019, 11, 1854. [Google Scholar] [CrossRef] [Green Version]
- Junta de Andalucía. Inventario de Regadíos 2008 y Su Evolución en la Última Década; Consejería de Agricultura y Pesca; Junta de Andalucía: Sevilla, Spain, 2011. (In Spanish) [Google Scholar]
- Info-Energia. Agencia Andaluza de Energía. Available online: http://www.agenciaandaluzadelaenergia.es/info-web/loginController (accessed on 10 September 2020). (In Spanish).
- Capros, P.; De Vita, A.; Tasios, N.; Siskos, P.; Kannavou, M.; Petropoulos, A.; Evangelopoulou, S.; Zampara, M.; Papadopoulos, D.; Nakos, C. EU Reference Scenario 2016-Energy, Transport and GHG Emissions Trends to 2050; European Commission: Luxemburgo, The Netherlands, 2016. [Google Scholar] [CrossRef]
- Eurostat. European Statistical System. Available online: https://ec.europa.eu/eurostat (accessed on 10 September 2020).
- European Commission. EU Agricultural Outlook for the Agricultural Markets and Income 2018–2030; European Commission, DG Agriculture and Rural Development: Brussels, Belgium, 2018. [Google Scholar]
- European Commission. Overview of CAP Reform: 2014–2020. Agricultural Policy Perspectives Brief; European Commission, DG Agriculture and Rural Development: Brussels, Belgium, 2013. [Google Scholar]
- O’Neill, B.C.; Kriegler, E.; Ebi, K.L.; Kemp-Benedict, E.; Riahi, K.; Rothman, D.S.; Van Ruijven, B.J.; Van Vuuren, D.P.; Birkmann, J.; Kok, K.; et al. The roads ahead: Narratives for shared socioeconomic pathways describing world futures in the 21st century. Glob. Environ. Chang. 2015, 42, 169–180. [Google Scholar] [CrossRef] [Green Version]
- Van Vuuren, D.P.; Kriegler, E.; O’Neill, B.C.; Ebi, K.L.; Riahi, K.; Carter, T.R.; Edmonds, J.; Hallegatte, S.; Kram, T.; Mathur, R.; et al. A new scenario framework for Climate Change Research: Scenario matrix architecture. Clim. Chang. 2014, 122, 373–386. [Google Scholar] [CrossRef] [Green Version]
- Iglesias, E.; Blanco, M. New directions in water resources management: The role of water pricing policies. Water Resour. Res. 2008, 44, 06417. [Google Scholar] [CrossRef] [Green Version]
- Stylianopoulou, K.G.; Papapostolou, C.M.; Kondili, E.M. Water-Energy-Food Nexus: A Focused Review on Integrated Methods. Environ. Sci. Proc. 2020, 2, 46. [Google Scholar] [CrossRef]
- Venghaus, S.; Dieken, S. From a few security indices to the FEW Security Index: Consistency in global food, energy and water security assessment. Sustain. Prod. Consum. 2019, 20, 342–355. [Google Scholar] [CrossRef]
- Fader, M.; Shi, S.; Von Bloh, W.; Bondeau, A.; Cramer, W. Mediterranean irrigation under climate change: More efficient irrigation needed to compensate for increases in irrigation water requirements. Hydrol. Earth Syst. Sci. 2016, 20, 953–973. [Google Scholar] [CrossRef] [Green Version]
- Expósito, A.; Berbel, J. Why Is Water Pricing Ineffective for Deficit Irrigation Schemes? A Case Study in Southern Spain. Water Resour. Manag. 2017, 31, 1047–1059. [Google Scholar] [CrossRef]
- Borrego-Marín, M.M.; Expósito, A.; Berbel, J. A Simplified Hydro-Economic Model of Guadalquivir River Basin for Analysis of Water-Pricing Scenarios. Water 2020, 12, 1879. [Google Scholar]
Figure 1.
Water use by type of irrigation technology in Andalusia. Source: INE [53].
Figure 1.
Water use by type of irrigation technology in Andalusia. Source: INE [53].

Figure 2.
Overview of the steps in the development of the participatory system dynamics model. Source: our own elaboration.
Figure 2.
Overview of the steps in the development of the participatory system dynamics model. Source: our own elaboration.

Figure 3.
Andalusian conceptual model: water, energy, food, and land sub-models. Source: our own elaboration.
Figure 3.
Andalusian conceptual model: water, energy, food, and land sub-models. Source: our own elaboration.

Figure 4.
Water sector representation in the system dynamics model. Source: our own elaboration.

Figure 5.
Energy sector representation in the system dynamics model. Source: our own elaboration.

Figure 6.
Food sub-sector representation in the system dynamics model. Source: our own elaboration.

Figure 7.
System dynamics modelling (SDM) results. Source: our own elaboration.

Figure 8.
Synergies and trade-off analysis between nexus indicators. Source: own elaboration.


Table 1.
Irrigation costs before and after a change of irrigation technology.
| Item | Before | After | Increase | ||
|---|---|---|---|---|---|
| (€/ha) | (%) | (€/ha) | (%) | (%) | |
| 1. Water service tariffs | 68.75 | 46% | 86.33 | 25% | 26% |
| 2. General costs (staff, rentals, maintenance, etc.) | 55.19 | 37% | 134.55 | 40% | 144% |
| 3. Energy Cost | 24.71 | 17% | 118.48 | 35% | 379% |
| 4. Total Cost | 148.65 | 100% | 339.36 | 100% | 128% |
Source: Borrego-Marín and Berbel [55].
Publisher’s Note: MDPI stays neutral with regard to jurisdictional claims in published maps and institutional affiliations. |
© 2020 by the authors. Licensee MDPI, Basel, Switzerland. This article is an open access article distributed under the terms and conditions of the Creative Commons Attribution (CC BY) license (http://creativecommons.org/licenses/by/4.0/).
Share and Cite
MDPI and ACS Style
González-Rosell, A.; Blanco, M.; Arfa, I. Integrating Stakeholder Views and System Dynamics to Assess the Water–Energy–Food Nexus in Andalusia. Water 2020, 12, 3172. https://0-doi-org.brum.beds.ac.uk/10.3390/w12113172
AMA Style
González-Rosell A, Blanco M, Arfa I. Integrating Stakeholder Views and System Dynamics to Assess the Water–Energy–Food Nexus in Andalusia. Water. 2020; 12(11):3172. https://0-doi-org.brum.beds.ac.uk/10.3390/w12113172
Chicago/Turabian StyleGonzález-Rosell, Adrián, Maria Blanco, and Imen Arfa. 2020. "Integrating Stakeholder Views and System Dynamics to Assess the Water–Energy–Food Nexus in Andalusia" Water 12, no. 11: 3172. https://0-doi-org.brum.beds.ac.uk/10.3390/w12113172
Note that from the first issue of 2016, this journal uses article numbers instead of page numbers. See further details here.