A Review of Current and Emerging Approaches for Water Pollution Monitoring
by
 ,
,
Nurhasliza Zolkefli
1, 
Siti Suhailah Sharuddin
1,
Mohd Zulkhairi Mohd Yusoff
1,2,
Mohd Ali Hassan
1,
Toshinari Maeda
3 and
Norhayati Ramli
1,*
1
Department of Bioprocess Technology, Faculty of Biotechnology and Biomolecular Sciences, Universiti Putra Malaysia, Serdang 43400, Selangor, Malaysia
2
Laboratory of Biopolymer and Derivatives, Institute of Tropical Forestry and Forest Products (INTROP), Universiti Putra Malaysia, Serdang 43400, Selangor, Malaysia
3
Department of Biological Functions Engineering, Graduate School of Life Science and Systems Engineering, Kyushu Institute of Technology, 2-4 Hibikino, Wakamatsu, Kitakyushu 808-0196, Japan
*
Author to whom correspondence should be addressed.
Water 2020, 12(12), 3417; https://0-doi-org.brum.beds.ac.uk/10.3390/w12123417
Submission received: 19 October 2020
/
Revised: 17 November 2020
/
Accepted: 25 November 2020
/
Published: 4 December 2020
(This article belongs to the Special Issue Integrated Modeling of Emerging Contaminants in the Surface Water: Monitoring, Projections and Risk Analysis)
Abstract
:The aquatic ecosystem is continuously threatened by the infiltration and discharge of anthropogenic wastewaters. This issue requires the unending improvement of monitoring systems to become more comprehensive and specific to targeted pollutants. This review intended to elucidate the overall aspects explored by researchers in developing better water pollution monitoring tools in recent years. The discussion is encircled around three main elements that have been extensively used as the basis for the development of monitoring methods, namely the dissolved compounds, bacterial indicator, and nucleic acids. The latest technologies applied in wastewater and surface water mapped from these key players were reviewed and categorized into physicochemical and compound characterizations, biomonitoring, and molecular approaches in taxonomical and functional analyses. Overall, researchers are continuously rallying to enhance the detection of causal source for water pollution through either conventional or mostly advanced approaches focusing on spectrometry, high-throughput sequencing, and flow cytometry technology among others. From this review’s perspective, each pollution evaluation technology has its own advantages and it would be beneficial for several aspects of pollutants assessments to be combined and established as a complementary package for better aquatic environmental management in the long run.
1. Introduction
Wastewater is the used water from anthropogenic activities usually released from several sources which are domestic, storm, and urban runoff, agricultural runoff, and industrial discharge, where they could present as a combination within sewer inflow or infiltration (Figure 1) [1]. The release of those wastewaters would contribute to the unusual contents of dissolved or suspended waste materials in natural water. These polluting dissolved and suspended compounds which are commonly addressed as dissolved organic matters (DOM) and dissolved particulate matters (DPM) are used as one of the main monitoring elements for wastewater quality. They also act as the primary basis for the biodegradation process involving adaptable or resistant microorganisms which are capable of expressing genetic functionality during pollutants catabolism. The dissolved organic and particulate matters, microorganisms, and genetic materials are the three key elements which are significant for the advanced monitoring of wastewater and water quality in general.
Apart from the expectable deterioration of overall water quality, detrimental effects on human health and ecosystems can indirectly arise due to the release of an estimated 80% of untreated industrial and municipal wastewaters into the environment [7]. This matter demands continuously evolving monitoring technology to be developed and thus established, especially when it involves the wide variety of emerging pollutants in the water ecosystem [8]. This is agreed upon by Carstea et al. [9] who emphasized the importance of wastewater quality monitoring for the early warning of waterbodies pollution and remediation progress, besides ensuring regulatory compliances throughout wastewater treatments and discharges. Unfortunately, it is difficult to track down the source of pollutants in the receiving waterways since they are generally exposed to various anthropogenic wastewaters. While there are gaps in the standardized water quality assessment systems, it remains challenging to fully enforce the environmental policies to the responsible parties. This shows the importance of a comprehensive monitoring tool for the better assessment of the impact and detection of wastewater sources, to finally enable fitting solutions and preventive measures for targeted pollutants releases into the river [10]. In this review, the employment of water and wastewater monitoring technologies by physicochemical profiling, compound characterization, followed by biomonitoring and further enhanced by molecular approaches in taxonomical and functional analyses will be discussed in detail while mapping out the specific pollutant sources detectable through the application of these approaches.
2. Utilizable Elements for Wastewater Monitoring
Wastewater effluents comprising of the DOM releasable into the natural aquatic ecosystem either through discharges or reuse practices might cause changes of the natural compositions of the receiving water bodies [11]. The compounds from various wastewaters can be categorized into: (i) recalcitrant natural organic matter which is naturally present in drinking water sources, (ii) soluble microbial product, which is referring to products produced in wastewater partaking biological treatment system, (iii) synthetic organic compounds which are present in trace amounts resulting from domestic or industrial usage, and (iv) disinfectant by-products which are sequestered from disinfectants introduced during drinking or wastewater treatment [12]. The uniqueness of DOMs that originate from wastewater lies upon their greater organic nitrogen and aliphatic contents [13,14]. Some other researchers also reported on other DOM members including aromatic polymers containing oxygen, nitrogen, and sulfur functional groups, especially in engineered treatment systems [15]. The foreign or allochthonous compounds introduced by many sources including industrial wastewaters and urban or precipitate runoffs would undergo either biotic or abiotic transformation processes which lead to the abnormal ecological function resulting from the fluctuation of DOM composition in the natural aquatic environment [16]. The fatality of the hardly removed pharmaceuticals and endocrine-disrupting compounds coming from many industrial, agricultural, hospital activities, and wastewater treatment plants (WWTPs) are the most widely discussed emerging pollutants nowadays [17,18]. It is a concern that, even after the urban wastewater is treated, dissolved organic compounds and particulate matters, such as endocrine disrupting chemicals and cellulose fibers, are still bounded in the effluents [12,17]. Such concerns demand better pollutant monitoring in the aquatic environment. Conceptually, there are three main elements which are eligible for aquatic monitoring purposes, as shown in Figure 2.
The presence of organic and inorganic pollutants themselves can indicate a pollution through physicochemical characterization which are the basis of current monitoring practices. Additionally, compound profiling has been implemented for the monitoring of wastewater and the aquatic environment. Meanwhile, bacteria flourishing from biodegrading or metabolizing the DOM may become a potential bioindicator for the excessive release of wastewater effluent discharges, where this approach can be categorized under taxonomical or structural assortment. Other than individual enumeration or identification of indicator bacteria, bacterial community patterns have been opted to better evaluate the condition and sources of contaminants in water resources. Not only limited to the physical presence of the specific bioindicator organisms, nucleic acids carried and expressed by them during the biodegradation process are considered as valuable components utilizable for molecular based monitoring. Moreover, while the DNA and RNA contribute towards the better taxonomical enumeration of indicator species, they are also used to detect actively expressed genes stimulated by the pollutants, and this is classified as a functional approach in aquatic body monitoring. The applicability of wastewater effluent to be monitored by compound characterization, taxonomical structures approaches, and advanced genetic functional methods will be discussed further in this review.
2.1. Physicochemical Characterization in Monitoring Environmental Pollution
Physicochemical parameters, such as biological oxygen demand (BOD), chemical oxygen demand (COD), suspended solid, pH, temperature, and ammonium nitrogen, are among the typical measurements utilized in water quality index (WQI) to determine the severity of water pollution [19]. WQI has been adapted by European, African, and Asian countries since its introduction in 1965 [20] while improvements and modifications have taken place since then to fit the requirements for either national or international organizations [21]. Briefly, WQI is calculated from the scoring of several parameters including dissolved oxygen, fecal coliform, pH, BOD, temperature, total phosphate, nitrates, turbidity, and total solids, and the result will represent the level of water quality in a particular tested water basin based on the WQI scoring [22]. WQI has always been adopted as a reliable tool for determining the stability and quality of water such as groundwater [23] and river water [24]. However, due to the absence of a globally standardized composite index of water quality, the values for each surface water category would vary depending on the types and suitability of a particular region. Some examples for the indexing are presented in Table 1.
The parameters required for the indexing are determined differently in different countries. For instance, seven parameters, which were total dissolved solid, total hardness, pH, dissolved oxygen, BOD, nitrate (NO3), and phosphate concentrations, were proposed for WQI classification for the Tigris and Euphrates rivers in Iraq [28]. For some other cases, such as the Ganges River in India, up to 14 parameters, including conductivity, turbidity, and alkalinity, were measured for WQI determination [24]. As for Malaysia, only six parameters are prioritized for river water quality classification, which are BOD, dissolved oxygen, COD, suspended solids, ammonia-nitrogen, and pH.
Other than monitoring the natural aquatic set up, physicochemical profiling has been intensively utilized to monitor the polluting properties of treated wastewaters and effluents coming from either point source or non-point source pollution releasers. For instance, urban runoff which carries pollutants into receiving waterways [29], such as dissolved nitrogen, phosphorus associated particles, and suspended solids from roofing materials and roads runoffs known to exceed the standardized surface water quality [30] have been monitored through physical measurement of the mean concentration of these pollutants [31]. Some examples of physicochemical data of wastewaters are shown in Table 2.
It is agreeable that the physicochemical properties are unable to distinguish between different wastewater types and resources [44]. Moreover, the physicochemical measurements in river had shown inconsistency due to seasonal changes factor [45], thus not the best tool for a stringent environmental water monitoring. Other drawbacks, including cost and time inefficiency, flawed the independence of this system in terms of wastewater quality assessment [46]. The most distinguishable weakness of this method rather than technicality is that, apparently it harbors less accuracy to specifically detect the culprit for each pollutant detectable in the waterways. Due to that, more reliable and specific systems, such as pollutant compound monitoring by high-end spectroscopic approaches, fluorescent-based method, and molecular-based monitoring technology, are highly recommended as complementary tools in monitoring wastewaters processes and releases into the environment.
2.2. Spectrometry Technology in Detecting Toxicant in Wastewaters
Due to advances in the spectroscopic monitoring applications, DOM detection and characterization have also been utilized to address the quality of wastewaters and surface water basins. In order to measure the DOM, dissolved organic carbon is often used as a surrogate parameter, though this does not include the structural characterization [12]. The understanding of DOM in a wastewater treatment system is indeed important as it is now recognized as a resource rather than waste [15]. For example, sludge is widely used for energy recovery while organic compounds in wastewater can be recovered and converted into biopolymers [47]. Moreover, the occurrence of the emerging organic micro-pollutants carried by industrial effluents is ever concerning due to their highly polluting capacity for aquatic ecosystems [48]. This added to the reasons for improving the aquatic environment monitoring.
Many researchers are on frontier in establishing high-resolution mass spectrophotometry application for environmental water monitoring, primarily to overcome the data falsity for the analysis of complex matrixes [2]. Bade et al. [49] are among those who utilized liquid chromatography-tandem mass spectrometry (LC-MS-MS) in a large-scale research to detect new psychoactive synthetic cathinones and phenethylamines substances in several influent wastewaters from Zurich of Switzerland, Copenhagen of Denmark, Oslo of Norway, Castellon of Spain, Milan of Italy, Brussels of Belgium, Utrecht of The Netherlands, and Bristol of the United Kingdom. Kamjunke et al. [50] stepped up the utilization of ultra-high-resolution Fourier transform ion cyclotron resonance mass spectrometry (FTICR-MS) to understand the relativity of lignin compounds of leave leachates with bacterial activity. The combination of electrospray ionization Fourier transform ion cyclotron resonance mass spectrometry (ESI-FT-ICR-MS), for instance, was developed to assess DOM in industrial wastewater and environmental water samples [51]. Additionally, Verkh et al. [52] set up a DOM compositional evaluation system to monitor the treatment process of WWTP in Castell d’Aro, Spain at different stages with different retention times by performing a non-targeted liquid-chromatography high-resolution mass spectrometry (LC-HRMS) procedure. Meanwhile, the successfulness of a palm oil mill effluent (POME) treatment process had been evaluated through aromatic compounds and their residuals identification by using gas chromatography-mass spectrometry (GC-MS) (GC-MS) [53].
Other than the monitoring of wastewaters from treatment plants, spectrophotometric method has also been utilized for river pollution detection. Moreover, only about half of parent micro-pollutants in wastewaters were transformed during treatment [54], leaving the rest of post-transformed products in the receiving waterways a concern in aquatic environmental monitoring. Due to this reason, more holistic non-targeted species detection and identification which are doable through a high-resolution mass spectrometry approach has been suggested for better river pollution monitoring [55]. For example, liquid chromatography-electrospray ionization-mass spectrometry (LC-ESI-MS) procedure was developed to detect and thus monitor pesticides, herbicides, fungicides, insecticides, and some of their degradation products in surface and ground waters that potentially affected by agricultural activities throughout the wine-growing region in Spain [56]. With the application of GC-MS, diverse numbers of micro-pollutants coming from domestic wastewater were detectable in the Vietnam river sediment [57]. Additionally, Robles-Molina et al. [58] managed to identify 340 organic compounds by using liquid chromatography time-of-flight mass spectrometry (LC-TOF-MS) database and 63 compounds through GC-MS/MS method in the Guadalquivir River basin in Spain, confirming that it was polluted by olive harvesting and wastewater discharges. Moreover, the environmental pollution caused by organic micro-pollutants in the surface water samples of Tianjin, North China was confirmed by running GC-MS and GC-MS/MS, followed by LC-TOF-MS [59].
The application of spectrometry technology has always been challenged with the operations requiring high cost and expertise, added with a long operational time [60] among other factors such as analytes instability and matrix effects of the environmental samples which need continuous optimization for the extraction method [2]. Even so, this high-resolution mass spectrometric concept remains practical and worthy of all efforts for a comprehensive water pollution assessment. This is well supported by the most recent invention presented by Sun et al. [61] namely “fabric-phase sorptive extraction coupled with ion mobility spectrometry” with the optimized extraction method, simplified, more precise, cheaper, and more speedy ion mobility spectrometry-based tool developed for the in-situ detection of polycyclic aromatic hydrocarbons (PAHs) in the river. More inventions of this kind would thrive for the detection of other pollutants in the near future.
2.3. Biomonitoring Environmental Pollution
Biomonitoring is the observation and assessment of changes in the ecosystems, considering components of the biodiversity and landscape which include the alterations taking place in different types of natural habitats, populations, and species. In obtaining better accuracy of the natural environmental state, “bioindication”, which depends on the natural responses of living cells towards stress factors, has been applied as complementary for physicochemical parameters and analysis [5]. In this case, “bioindicator” is often used to forecast the occurrence of environmental disturbance due to its reflection of observable traits as manifestations of their surroundings [62]. The biological process is an aspect of bioindicator which is typically used for environmental quality assessments and the monitoring of its gradual changes [63] where the applicability of a bioindicator will be dependent upon the fundamental understanding of ecosystem structure and function themselves [64]. The measurement of bioindicator at different organizational levels as such in organism, population, community, or ecosystem levels can be used to figure out specific effects and process blueprints due to pollutant exposures [65]. The conceptual biomonitoring approaches applicable in aquatic pollution monitoring are illustrated in Figure 3.
Most environmental bioindicators used are from macroorganisms like fish, macroinvertebrates, macrophytes, protozoa, and algae [66]. Compromising with the premise that physicochemical analysis is not sufficient for multiple complexities of various unknown industrial toxicants evaluation, Lainé et al. [67] settled with the combination of different aquatic communities, including diatoms, macrophytes, benthic macroinvertebrates, and fish, as a comprehensive biological monitoring package. Meanwhile for microorganisms bioindicator, microbial source tracking was established to detect human fecal contamination in a river system [68]. E. coli, Enterococcus spp., and Bacteroides HF183 are among the commonly used pathogenic fecal indicators which were continuously established to monitor this kind of pollution in the environmental water [69]. Microorganisms are sensitive to their ecological fluctuation, which will lead towards the variation of their abundancy [70,71] and functional genetic expressions [72]. Moreover, the mechanisms of microorganisms in indicating particular environmental quality have been greatly understood and applied [69,73]. For example, Bacteroidales unique emergence in various fecal pollution has been recognized and thus researched elaborately so that it can be utilized effectively in scrutinizing such environmental issues [74]. Moreover, Wood et al. [75] also emphasized on the importance of biological samples assessment to measure the ‘health’ level of New Zealand aquatic environments which includes the microbial source tracking. More examples of bioindicators for aquatic environmental pollution detections are compiled in Table 3.
Reliability of Bacterial Community in Waterways Biomonitoring
Stringent monitoring is important to ensure that water quality complies with legal requirements set by legitimate bodies which are currently monitored through physicochemical-based assessments. However, Zamyadi et al. [97] had previously concluded on the irrelevancy of only physicochemical parameters such as turbidity, BOD, and COD, conductivity, temperature, and pH to rapidly identify Cyanobacterial bloom. Single species or a limited bacterial population is among the commonly used biological indicator in environmental assessments. However, their sensitivity towards limited pollutants and mixtures which is measured through their survival, mortality or reproduction was considered insufficient to indicate the complexity of contaminants and their impacts in freshwater resources [98]. Such concern directs the enhancement of the ecotoxicological monitoring through the gradient fluctuation of microbial community due to pollutants exposures [99]. Bacterial community is a strategic environmental indicator due to its omnipresence and abundance in most natural environments. It is worth noting that varying species within a community brings forward diverse sensitivities towards complex pollutants or stressors which enable better indication of environmental disturbances [100]. Wakelin et al. [101] also emphasized the importance of a close and continuous monitoring of microbial community composition and functions corresponding to the soil physicochemical properties to develop a reliable indicator for land usage effects. In a supportive stance of those requirements, Tlili et al. [99] concluded that the combination of pollution-induced community measurement and microbial community endpoints should be used to generate better ecological relevance data alongside the currently used environmental risk assessment scheme.
The introduction of industrial effluents into the receiving river water would not only change its physicochemical properties [102], but might also affect the bacterial community residing in the polluted area as they are known to be highly dynamic and can differ strongly in its response to resource availability such as the concentrations of organic carbon, nitrogen, and phosphorus in the environment [103]. Moreover, the bacterial community would act as a key player in transforming complex organic compounds in a WWTP [104]. Hence, the discharge of wastewater may introduce a significant load of bacteria into the river water, indicating it as unfit for usage and consumption [105].
Bacteria are considered to be highly sensitive to their surrounding environments owing to their rapid reproductive ability and simple structure [106]. Different populations of bacteria may emerge in different environmental conditions, depending on their abilities to metabolize certain compounds and nutrients [107]. For instance, in an anoxic environment, the composition of the strictly aerobic microbial community in the river water may be affected [73]. Plus, only certain microorganisms with the capability to tolerate the toxic level of contamination would survive in the environment which is a profound basis for bioindicator selection. For example, only a few species of bacteria with strong resistance to zinc and arsenic were able to be detected in river water polluted by heavy metals [108].
The changes in bacterial community pattern have been used to monitor Okeover Stream restoration from urban wastes contamination [109]. Other researchers were conducted using a bacterial community within biofilm to determine the water quality of the Great Barrier Reef [110] and tropical coastal coral reef ecosystems [111]. Borrero-Santiago et al. [112] also emphasized the potential utilization of bacterial community changes and respiration patterns in indicating CO2 emissions into marine ecosystems. Not restricted only into the individual function of bacterial indicator, a few researchers have started to develop a novel microbial community-based indexing which is deemed as a reliable tool in freshwater health assessment [113]. It is also impressive that bacterial community together with the cultivable coliform and environmental factors is now being considered in the routine monitoring of coral reef affected by the anthropogenic stressors carried by the freshwater into the sea in Brazil [114]. This shows that bacterial community-based assessment is getting more crucial to complement the established water management protocol as a whole. Concurrently, the presence of specific microbial community which involves directly in the biodegradation of the pollutants will inform researchers about the conditions of the contaminated bodies [115]. All in all, it can be said that microbial community consisting of diverse species which express different sensitivities to stimulants or stressors may reflect the biological variability and complexity of the environment to a certain extent [100]. This could support the better monitoring of the pollutant impacts in the environments.
The major drawback of the bacterial diversity study in an aquatic ecosystem is the inability to culture the environmental bacteria using conventional culturing techniques. In addition, the use of the conventional method may lead to misleading outcomes as only a small percentage of bacteria can be cultured and identified [116]. The integration of the molecular method with a specified bioindicator has become a well-accepted practice to gain more information and understanding regarding environmental pollution. As a rapidly advancing technique, molecular-based technology is being expanded to numerous methods applicable for identification and enumeration of target species or gene in environmental samples, thus able to provide information of an organism’s function and potential. Thus, it is highly recommended to complement biomonitoring with the widely available molecular-based technologies due to various advantages such as high-throughput capability [75]. There is probably a minor issue regarding PCR-bias subject to molecular methods, including denaturing gradient gel electrophoresis (DGGE), terminal restriction fragment length polymorphism (T-RFLP), and high-throughput sequencing, which disallows the acquisition of an absolute species abundance in the community [117]. However, this does not cloud the dominant role of this approach in the advancement of the aquatic bacterial community excavation as further discussed in this review.
2.4. Molecular Approaches in Taxonomical Analyses
2.4.1. Assessment of Microbial Community Using Molecular Fingerprinting Techniques
The information on bacterial community patterns and shifts can only be rapidly obtained with the integration of molecular biotechnology [118]. Molecular fingerprinting techniques have been widely used to overcome the limitations of the conventional methods since they are completely culture-independent and do not rely on the reproductive stage of the bacteria to provide information [4]. In fact, these techniques can be used to generate a profile of microbial diversity based on the direct analysis of the PCR products [119]. DGGE [120], random amplified polymorphic DNA (RAPD) [121], T-RFLP [122], length heterogeneity PCR (LH-PCR) [123], amplified ribosomal DNA restriction analysis (ARDA) [124], and ribosomal intergenic spacer analysis (RISA) [125] are among the molecular fingerprinting techniques that have been commonly applied to assess the compositions of microbial communities. In relation to the evaluation of the spatial and temporal effects towards the environmental microbial assemblages, DGGE and T-RFLP are the most reliable and thus greatly favored [126]. This is well acknowledged by Zhang et al. [127] where both techniques are worthwhile for the genetic diversity assessment of microeukaryotic communities in correlation to environmental changes of marine ecosystem.
The use of DGGE had been a popular choice for assessing the shift of the environmental microbial community based on the changes of the banding patterns, as is shown in Figure 4. However, low sensitivity for the detection of rare microbial community [128], separation of small DNA fragments [129], a need for selecting suitable primers, as well as the presence of chimeric products or fidelity errors during PCR amplification [130] had been considered as the major limitations of DGGE for assessing the microbial community structure. Regardless, this method is still able to provide a general and rapid structural characterization of water bacteria clusters, as supported by Du et al. [131] who observed the dominative river sediment bacteria which drive the overall increase of bacterial density in the presence of heavy metals. Plus, DGGE was utilized to elucidate excellent patterns of the bacterial communities in biofilm impacted by pharmaceutical compounds carried by WWTP discharged into the river over a three-year period [132].
On the other hand, T-RFLP was found to yield reproducible results and generated better resolution as compared to the other fingerprinting techniques [133]. However, there are several shortcomings of this method such as the time and cost inefficiency for the preparation and sequencing of clone libraries [134], while the actual bacterial taxonomic information [135] and diversity [136] could not be fully represented. Regardless, when compared with a high throughput sequencing (HTS), the DNA-fingerprinting is still able to obtain a similar microbial community composition of groundwater, even though it’s diversity capturing is pretty much lower [135]. It remains more astonishing when the combination of both HTS and T-RFLP can produce even more robust data regarding the microbial community, as was concluded by Lindström et al. [137] after an elaborated ecological analysis involving bacterial and fungal communities in an ant nest. This fact proved that T-RFLP remains a relatively relevant and considerably reliable tool for aquatic environmental study.
2.4.2. Advanced High-Throughput Sequencing for Complex Taxonomic Diversity Assessment
Despite the importance of molecular fingerprinting techniques as the culture-independent tools in assessing microbial community diversity, their applications were restricted due to the low density of organisms in water bodies. In contrast, HTS could assess complex and low-abundance populations that could not be done by using conventional sequencing methods [135]. HTS is widely reported as a reliable technique that allows the complete and accurate identification of species within a microbial community. Unlike the DGGE approach by which only abundant bacteria can be evaluated, the HTS approach allows us to analyze not only abundant bacteria, but also scarce ones which can also be key players for understanding the impact of environmental pollutants. In addition, the analyses of α- and β-diversities using the data obtained through HTS could be a powerful tool to visually indicate the differences of bacterial communities between samples [138]. GS 454 FLX Titanium by Roche (Switzerland), MiSeq and HiSeq 2500 provided by Illumina Inc., (USA), MGISEQ-2000 developed by MGI Tech Co. Ltd. (BGI Group, China) and SOLiD 5500 series (Life Technologies, USA) are several examples of the commonly available HTS platforms which are still actively employed by researchers for environmental metagenomics study [139].
Among the listed HTS technologies, the Illumina sequencer is more preferable due to its greater throughput and cost-effective approach which enable the study of the complex environmental microorganisms [140]. The adaptation of sequencing by synthesis method by Illumina MiSeq ensures the least falsity and lower per base error rate [141] of the partial sequences obtained directly from specific environmental samples as compared to other platforms [142]. The advantageous characteristic makes this sequencing method favorable for various environmental metagenomics studies which include wastewater [95,143,144] and sludge [145,146] samples. Most of the time, it can be observed that authors would analyze the overall microbial fluctuations in the presence of certain pollutants, while some would sort out the dominant community before appointing the suitable bioindicator for water monitoring and management purposes. This is supported by enormous examples of the utilization of Illumina sequencers for the metagenomic study of microbial communities in wastewaters and water basins, as tabulated in Table 4.
Due to the limited microbial species that have undergone full-length sequencing, the databases available are currently unable to taxonomically classify enormous number of operational taxonomic units (OTUs) up to species or genus level [154]. Even so, thousands of researches on microbial communities related to the river water ecosystem that can be found digitally published just in few recent years indirectly remarks the unending expansion of the database. Eventually, HTS would naturally become an inevitable tool in wastewater and marine ecosystem assessments. With the widely explored 16S rDNA sequencing, though it provides vast information on the microbial diversity in the environment, it does not necessarily contemplate their physiological and ecological relationship [155]. Hence, characterization of the functional genes reflecting the ecological change should be integrated as it provides a deeper understanding of the corresponding microbial diversity [156].
2.5. Gene Functionality Assessment in Aquatic Environment
2.5.1. Quantification of Functional Genes Involved in the Biodegradation of Pollutants Using qRT-PCR
The adverse impacts of wastewater disposal practices toward our water ecosystem have stirred a demand for new strategies and technologies to be incorporated into the wastewater monitoring system [157]. As the impacts of a certain significant concentration of pollutants on aquatic organisms are often subtle and could not be detected using conventional methods [158], more advanced approaches are needed to infer the ecosystem health status. As previously asserted by Cordier et al. [154], the expressed microbial functions are foreseen as better proxies than taxonomic profiles in detecting changes in the environment with a focus on the metabolically active fraction of the community that is actually involved in the pollutant biodegradation. Hence, this approach is regarded as a promising technique to complement the wastewater biomonitoring system. Several gene expression profiling methods have been developed and can be generally categorized into a PCR-based, array-based, and sequencing-based approaches [159].
The application of quantitative real time-PCR (qRT-PCR) is synonym with the quantification of functional genes expressed by bacteria which involve in the biodegradation of nutrients particularly pollutants in the environment. qRT-PCR enables a precise quantification of a low concentration of specific nucleic acids in a complex mixture with the introduction of specific primers and fluorescent reporter molecules where real-time monitoring of the specifically amplified target gene can be done [160]. For example, qPCR techniques were developed to analyze the presence of Campylobacters in 926 poultry samples by using three pairs of primers designed for glyA, hipO, and 16S rDNA genes carried by C. jejuni, C. coli, and Campylobacter spp., where all the primers were labeled with fluorescent reporter molecules [161]. This approach has been used for the quantification of genes or transcripts from environmental samples which allows deeper understanding on the complexity of the metabolic functionality of the indigenous microbiome and thus, initiate the development of potential molecular markers to be deployed in specific polluted environmental assessment.
Given the current concern regarding the antibiotic resistance genes emergence particularly among the pathogenic microorganisms, qRT-PCR concepts are being adapted to detect, quantify and thus understand the spread mechanisms of the genes in the aquatic environment. For instance, this technique was applied on the pharmaceutical industries effluents which confirmed on the high relative abundances of the antibiotic resistance genes (sul1, sul2, qacE/qacEΔ1 and tet(A)), class 1 integrons (intI1) and IncP-1 plasmids (korB) which would eventually be mobilized in the ecosystem [162]. Known as the final cure for a multidrug resistant Gram-negative bacteria infection, colistin resistance mediated by plasmid is currently monitored by qRT-PCR as an initiative to rapidly detect the colistin resistance genes (mcr-1 to mcr-5) directly from environmental samples [163]. In addition, Hafeez et al. [164] managed to develop a qRT-PCR assay to quantify the genes responsible for ammonia oxidation and the reduction of nitrate, nitrite, and nitrous in a contaminated industrial wasteland. Other than that, the application of qRT-PCR to quantify the abundance of targeted functional genes like cbbl, nifh, amoA, and apsA that play the key role in biogeochemical cycling in intertidal soil from the Arabian Sea had also been reported [165]. More recent research had quantified the expression levels of key genes which are likely involved in the toxic di(2-ethylhexyl)phthalate (DEHP)-catabolism pathway as an effort to enable a deeper understanding into the mechanisms of phthalate acid esters removal from polluted environment [166].
Regardless, there are gaps in this method especially on lesser conclusiveness in terms of direct relationship between the quantitated gene expression with a specific microbial activity or population [167]. On top of that, qRT-PCR requires prior knowledge of the known sequences of the genetic materials before the specific biomarker can be designed. This limits the representation of the overall sequence diversity that might present in a particular environment. Thus, modern approaches, such as HTS and full-length sequencing of either DNA or RNA, have been applied for the primary profiling of potential genes before being amplified by qRT-PCR for confirmation.
2.5.2. Microarray as Environmental Monitoring Tool
Considering the ever-growing threats of various types of pollution on the natural ecosystem, a significant study on the implementation of microarray in biomonitoring and waste management has also been conducted. Microarray, also known as a chip, is constructed on a solid surface such as a glass slide with different nucleic acid probes attached to detect a large number of targets simultaneously [168]. A widely used array in the environmental study is known as functional gene array (FGA) which contains probes for key genes that play role in major metabolic processes [169]. The FGA has been described as a sensitive tool in environmental functional gene analysis as shown in the previous research utilizing the GeoChip 5 array, containing over 60,000 probes in diverse gene categories including carbon, nitrogen, sulfur cycling, primary and secondary microbial metabolisms [170]. This array is used to address the functional genes diversities and potential metabolic capacity of microbial communities exposed to heavy metal contaminants in Xiangjiang River, China. A similar study was conducted using GeoChip 4 array which targeted over 142,000 genes that play role in various nutrient cycles at Shennongjia Mountain, China [171]. A novel FGA was also successfully established in the study of bacterial and archaeal functional profiles in activated sludge [172]. The FGA is targeting the functional amoA gene which is known as an effective phylogenetic and functional marker for the detection of ammonia-oxidizing microbes in the environment. A number of existing studies have also reported on the feasibility of using FGA for environmental study [169,173,174,175].
However, the pitfall of this approach is that previous knowledge on the genomic sequence of the organisms is required prior to describing the overall gene expression. Besides that, the use of microarray in the environmental study is costly as there would be the need to print the representative gene clusters onto the microarray after the metagenome sequencing, which also makes it laborious [176]. Moreover, the probe on the array is designed to be specific to known sequences that can cross-hybridize to similar sequences and consequently produce misleading results [168]. In addition, environmental samples such as water, soil and sediments often contain inhibitor elements that disrupt the DNA hybridization onto microarrays such as humic acids and other organic materials [167]. Due to the above reasons, the study of the transcriptome is shifting from hybridization-based array to next generation sequencing (NGS) platform as being extensively discussed in the literature [168,177].
2.5.3. Advanced Gene Expression Profiling for Wastewater and Aquatic System Monitoring Using Metatranscriptomics Approach
The emerging of NGS for microbiome research has brought a paradigm shift in environmental monitoring activities. Transcriptomics or metatranscriptomics is an approach implemented to gain functional insights into the activities of the complex microbial communities by studying their mRNA transcriptional profiles or expressed transcripts [176]. The deployment of metatranscriptomics through the technological advancement in RNA-sequencing has proved to be helpful in providing a snapshot of the whole transcripts that are actively expressed in complex bacterial communities, shedding lights on the active fraction of the community and their functional response to different environmental conditions [178]. This cutting-edge technology also provides unprecedented insights concerning the genes that play a key role in contaminant biodegradation especially in the various types of wastewater treatment systems [179]. Functional profiling of microbial communities allows the correlation of microbial phylogeny to function and also reveals the specific microbial groups that are most affected and the key genes that are actively expressed in a particular environmental condition [167]. This has been explored in a prior study where the genes involved in the degradation of cyclic aromatic compounds were identified through gene profiling conducted on microbial communities in tannery WWTP [180]. A comparative metatranscriptomics has also been conducted on WWTP to gain a deeper understanding of the functional and taxonomic attributes of the WWTP communities [181,182,183]. These studies have emphasized the correlation between microbiome functional profiles with nitrogen and carbon availability in WWTP, the differentially expressed antibacterial resistance across the WWTP compartments, and the functioning and regulation of antibiotic resistance genes in WWTP, respectively. A recent study had also been reported on the application of microbial metatranscriptomics to reveal the unique anabolic and catabolic pathways of the community in response to different concentrations of PAHs, polychlorinated biphenyls (PCBs) and organochloride residues in Detroit River, Canada [184]. These findings provide a potential mechanism to address the knowledge gap in wastewater management and water quality monitoring system. There have been other studies devoted by the scientific community towards the successful application of the whole transcriptomic approach on wastewater and the water ecosystem, as compiled in Table 5.
However, despite years of research, the administration and interpretation of the enormous data provided by metatranscriptome profiling remain challenging [191]. Up to date, there is no standard protocol available for analyzing the data, hence extensive experience and bioinformatics skills are needed to ensure reliable and accurate data reporting [168]. Despite the present limitations, gene expression studies hold promising potential in aquatic biomonitoring. Hence, the leveraging of metatranscriptomic sequencing is presumed to assist in the elucidation of functional transcripts which are likely exhibited under in situ conditions. It also helps in enabling the discovery of phylogenetic markers and genes encoding important biodegradation processes which are important in water quality monitoring and wastewater management system [192]. Collectively, these pioneering works will pave the way to fill important gaps in our understanding of using targeted indicators as next generation biomonitoring.
2.6. Functionality Analysis of Bacterial Nucleic Acids through Flow Cytometry
Carstea et al. [9] had thoroughly reviewed on the function of fluorescent spectroscopy in wastewater monitoring. From there, it can be emphasized that this method is advantageous in terms of time efficiency, environmental friendliness due to less introduction of reagents, easiness as in less preparation requirements and it promises better sensitivity while being less invasive. Conceptually, this technique works by the detection of excited fluorophores when exposed to light energy at specific wavelengths [193]. Other than generally applied on the detection of organic matters in wastewaters, fluorescence technology is now being utilized for the quantitative analysis of aquatic bacteria. As one of the fluorescent technology available, flow cytometry overcomes the limitations of the conventional bacterial culture plate counting method while enabling a higher bacterial count [194]. Many researchers have reported quantitative data regarding bacterial concentration, viability, and activity for environmental study especially for drinking water and quality monitoring of drinking water treatment facilities [195,196]. Similar approaches as in the bacterial cell intactness and total concentration quantification were also utilizable in assessing the treated water along a Scottish Water distribution networks outlet treated by secondary disinfectants (chlorine and chloramine) [197]. As of late, flow cytometry has been developed for a successful long-term assessment of bacterial community changes in a full-scale drinking water distribution system in Riga, Latvia, a network which received different water sources [198].
For the culture-independent assessment of surface water pollution, flow cytometry had been adopted to measure the impact of anthropogenic effluent discharges through the microbiological fluctuation patterns where the study was done along the Chicheley Brook watercourse which runs through a predominantly rural catchment area in England [6]. It was also interesting to discover that flow cytometry approach has been expanded to understand the bio-geographical pattern exerted by high nucleic acid (HNA) and low nucleic acid (LNA) populations in a large-river scale study of Songhua-River in China [199]. The same approach was used to analyze the pattern of LNA and HNA in POME final discharge polluted river as compared to the clean upstream river [200] and other non-POME polluted rivers [153]. Most encouraging is that flow cytometry has been recommended as a bio-assessment tool to complement the current water quality indexing implemented by the European Union Water Framework Directive, after the high nucleic acid populations along Caima River sites receiving anthropogenic pollutants, mining drainage, and the clean upstream of the river were successfully differentiated by this method [201].
Not only applied to water samples, many researchers had the abundance, dynamics and viability of bacteria assessed in activated sludge where bacterial cell quantification and bacterial viability analyses were done in activated sludge acquired from the extended aeration process of WWTPs located in Spain [202]. Deeper insight on the bacterial cell integrity and permeability in sludge was also emphasized through the statistical analysis of the flow cytometry data [203]. Other than that, a specific cell analysis of Candidatus Accumulibacter phosphatis diversity in activated sludge obtained from a wastewater treatment plant at Pohang University of Science and Technology in South Korea was able to be sorted out by integrating an advanced cell sorting equipment in the flow cytometry [204]. In relation to the specific cell evaluation by this amazing tool, the growth of pathogens in water which were Escherichia coli O157, Vibrio cholera, or Pseudomonas aeruginosa managed to be assessed, hence adding more credibility of this equipment for water pollution monitoring [205]. All of these vast studies show how versatile a flow cytometry is to rapidly assess the microbiological activities and fluctuations in watery or even slurry environmental samples. Even though extensive work might have to be done before a specific presence of identifiable microorganism in a certain sample can be assorted, the flow cytometry method had so far been reliable enough in defining the polluted state of a targeted aquatic ecosystem and hence highly recommended as a complementary tool for wastewater and water pollution monitoring.
3. Summary and Future Outlooks
Overall, regardless of any resources of water pollution, the basis of monitoring the water bodies quality circled around the measurement of physicochemical characterization of pollutant compounds in the water systems alongside other physical determination, such as pH, temperature, turbidity, and suspended solid. These approaches, although they help to address water quality in general, lacked the specificity to track the source of pollution. With the concept of “indicator tracking” either through conventional methods or modern approaches, not only is the physical presence of the bioindicator itself considered, but its biological mechanisms are also mapped into advanced technological development to improve the monitoring processes. The environmental scientists are now advancing with a more comprehensive, rapid, and specific method to complement the currently established aquatic monitoring procedure, so that the exact cause and source can be addressed. Due to that, key elements involved in a polluted ecosystem mainly the pollutants composition, bacterial indication and biomolecular components carried by the bacteria are extensively utilized in water pollution assessments. Through this review, it was shown that, aside from the continuous improvement done for bioindicator determination, identification, and detection through molecular approaches, other potential monitoring tools, especially spectrophotometry and flow cytometry, are being extensively explored to strengthen the aquatic pollution control in general. In further future, it is expectable that these elemental analyses would be combined as a well-established complementary package to address the cause and source of water pollutions with better specificity, efficiency, and comprehensiveness.
Author Contributions
Conceptualization, N.Z., N.R., and S.S.S.; validation, N.R., M.Z.M.Y., M.A.H., and T.M.; data curation, N.Z. and S.S.S.; writing—original draft preparation, N.Z.; writing—review and editing, N.Z., S.S.S., N.R., and T.M.; visualization, N.Z., and N.R.; supervision, N.R., M.Z.M.Y., M.A.H., and T.M. All authors have read and agreed to the published version of the manuscript.
Funding
This research was funded by PUTRA GRANT (GP/2018/9630500) provided by UNIVERSITI PUTRA MALAYSIA.
Acknowledgments
The authors would like to thank a Yang Di Pertuan Agong (YDPA) Scholarship for the financial support of Zolkefli, N.
Conflicts of Interest
The authors declare no conflict of interest. The funders had no role in the design of the study; in the collection, analyses, or interpretation of data; in the writing of the manuscript, or in the decision to publish the results.
References
- Tilley, E.; Ulrich, L.; Lüthi, C.; Reymond, P.; Zurbrügg, C. Compendium of Sanitation Systems and Technologies, 2nd ed.; Eawag: Duebendorf, Switzerland, 2014; p. 175. [Google Scholar]
- Nuria, C.-F.; Josep, C.; Munjanja, B.; Nollet, L.; Lambropoulou, D. High-resolution mass spectrometric techniques for structural characterization and determination of organic pollutants in the environment. In Chromatographic Analysis of the Environment: Mass Spectrometry Based Approaches, 4th ed.; Nollet, L.M., Lambropoulou, D.A., Eds.; CRC Press: Boca Raton, FL, USA, 2017; Volume 3, pp. 47–78. [Google Scholar]
- Şener, Ş.; Şener, E.; Davraz, A. Evaluation of water quality using water quality index (WQI) method and GIS in Aksu River (SW-Turkey). Sci. Total Environ. 2017, 584, 131–144. [Google Scholar] [CrossRef] [PubMed]
- Stachler, E.; Akyon, B.; De Carvalho, N.A.; Ference, C.; Bibby, K. Correlation of crAssphage qPCR markers with culturable and molecular indicators of human fecal pollution in an impacted urban watershed. Environ. Sci. Technol. 2018, 52, 7505–7512. [Google Scholar] [CrossRef] [PubMed]
- Bondaruk, J.; Janson, E.; Wysocka, M.; Chalupnik, S. Identification of hazards for water environment in the upper Silesian Coal Basin caused by the discharge of salt mine water containing particularly harmful substances and radionuclides. J. Sustain. Min. 2015, 14, 179–187. [Google Scholar] [CrossRef] [Green Version]
- Harry, I.S.K.; Ameh, E.; Coulon, F.; Nocker, A. Impact of treated sewage effluent on the microbiology of a small brook using flow cytometry as a diagnostic tool. Water Air Soil Pollut. 2016, 227, 57. [Google Scholar] [CrossRef] [PubMed]
- WWAP (United Nations World Water Assessment Programme). Executive summary. In The United Nations World Water Development Report 2017: Wastewater: The Untapped Resource; Connor, R., Renata, A., Ortigara, C., Koncagül, E., Uhlenbrook, S., Lamizana-Diallo, B.M., Zadeh, S.M., Qadir, M., Kjellén, M., Sjödin, J., Eds.; UNESCO: Paris, France, 2017; p. 2. [Google Scholar]
- Hollender, J.; Van Bavel, B.; Dulio, V.; Farmen, E.; Furtmann, K.; Koschorreck, J.; Kunkel, U.; Krauss, M.; Munthe, J.; Schlabach, M.; et al. High-resolution mass spectrometry-based non-target screening can support regulatory environmental monitoring and chemicals management. Environ. Sci. Eur. 2019, 31, 42. [Google Scholar] [CrossRef] [Green Version]
- Carstea, E.M.; Bridgeman, J.; Baker, A.; Reynolds, D.M. Fluorescence spectroscopy for wastewater monitoring: A review. Water Res. 2016, 95, 205–219. [Google Scholar] [CrossRef]
- Diamantini, E.; Lutz, S.R.; Mallucci, S.; Majone, B.; Merz, R.; Bellin, A. Driver detection of water quality trends in three large European river basins. Sci. Total Environ. 2018, 612, 49–62. [Google Scholar] [CrossRef]
- Meng, F.; Huang, G.; Yang, X.; Li, Z.; Li, J.; Cao, J.; Wang, Z.; Sun, L. Identifying the sources and fate of anthropogenically impacted dissolved organic matter (DOM) in urbanized rivers. Water Res. 2013, 47, 5027–5039. [Google Scholar] [CrossRef]
- Michael-Kordatou, I.; Michael, C.; Duan, X.; He, X.; Dionysiou, D.; Mills, M.; Fatta-Kassinos, D. Dissolved effluent organic matter: Characteristics and potential implications in wastewater treatment and reuse applications. Water Res. 2015, 77, 213–248. [Google Scholar] [CrossRef]
- Bolyard, S.C.; Reinhart, D. Evaluation of leachate dissolved organic nitrogen discharge effect on wastewater effluent quality. Waste Manag. 2017, 65, 47–53. [Google Scholar] [CrossRef]
- Mesfioui, R.; Love, N.G.; Bronk, D.A.; Mulholland, M.R.; Hatcher, P.G. Reactivity and chemical characterization of effluent organic nitrogen from wastewater treatment plants determined by Fourier transform ion cyclotron resonance mass spectrometry. Water Res. 2012, 46, 622–634. [Google Scholar] [CrossRef] [PubMed]
- Maizel, A.C.; Remucal, C.K. The effect of advanced secondary municipal wastewater treatment on the molecular composition of dissolved organic matter. Water Res. 2017, 122, 42–52. [Google Scholar] [CrossRef] [PubMed]
- Xu, H.; Guo, L. Intriguing changes in molecular size and composition of dissolved organic matter induced by microbial degradation and self-assembly. Water Res. 2018, 135, 187–194. [Google Scholar] [CrossRef] [PubMed]
- Patel, N.; Khan, M.D.; Shahane, S.; Rai, D.; Chauhan, D.; Kant, C.; Chaudhary, V.K. Emerging pollutants in aquatic environment: Source, effect, and challenges in biomonitoring and bioremediation—A review. Pollution 2020, 6, 99–113. [Google Scholar] [CrossRef]
- Tiwari, B.; Drogui, P.; Tyagi, R. Removal of emerging micro-pollutants from pharmaceutical industry wastewater. In Current Developments in Biotechnology and Bioengineering; Elsevier BV: Amsterdam, The Netherlands, 2020; pp. 457–480. [Google Scholar]
- Department of Environment (DOE). Available online: https://www.doe.gov.my/portalv1/wp-content/uploads/2019/05/Standard-Kualiti-Air-Kebangsaan.pdf (accessed on 28 January 2020).
- Horton, R.K. An index number system for rating water quality. J. Water Pollut. Control Fed. 1965, 37, 300–306. [Google Scholar]
- Tyagi, S.; Sharma, B.; Singh, P.; Dobhal, R. Water quality assessment in terms of water quality index. Am. J. Water Resour. 2020, 1, 34–38. [Google Scholar] [CrossRef]
- Srivastava, G.; Kumar, P. Water quality index with missing parameters. Int. J. Res. Eng. Technol. 2013, 2, 609–614. [Google Scholar]
- Abbasnia, A.; Yousefi, N.; Mahvi, A.H.; Nabizadeh, R.; Radfard, M.; Yousefi, M.; Alimohammadi, M. Evaluation of groundwater quality using water quality index and its suitability for assessing water for drinking and irrigation purposes: Case study of Sistan and Baluchistan province (Iran). Hum. Ecol. Risk Assess. Int. J. 2018, 25, 988–1005. [Google Scholar] [CrossRef]
- Meher, P.K.; Sharma, P.; Gautam, Y.P.; Kumar, A.; Mishra, K.P. Evaluation of water quality of Ganges River using water quality index tool. Environ. Asia 2015, 8, 124–132. [Google Scholar]
- Brown, R.M.; McClelland, N.I.; Deininger, R.A.; Tozer, R.G. A water quality index- do we dare? Water Sewage Work. 1970, 117, 339–343. [Google Scholar]
- Saffran, K.; Cash, K.; Hallard, K.; Neary, B.; Wright, C. CCME water quality index 1.0 user’s manual. Canadian Water Quality Guidelines for The Protection of Aquatic Life, Canadian Environmental Quality Guidelines; Canadian Council of Ministers of the Environment: Winnipeg, MB, Canada, 2001. [Google Scholar]
- Cude, C.G. Oregon water quality index a tool for evaluating water quality management effectiveness. JAWRA J. Am. Water Resour. Assoc. 2001, 37, 125–137. [Google Scholar] [CrossRef]
- Al-Shujairi, S.O.H. Develop and apply water quality index to evaluate water quality of Tigris and Euphrates Rivers in Iraq. Int. J. Mod. Eng. Res. 2013, 3, 2119–2126. [Google Scholar]
- Laurenson, G.; Laurenson, S.; Bolan, N.; Beecham, S.; Clark, I. The role of bioretention systems in the treatment of stormwater. In Advances in Agronomy; Elsevier BV: Amsterdam, The Netherlands, 2013; Volume 120, pp. 223–274. [Google Scholar]
- Wu, J.; Ren, Y.; Wang, X.; Wang, X.; Chen, L.; Liu, G. Nitrogen and phosphorus associating with different size suspended solids in roof and road runoff in Beijing, China. Environ. Sci. Pollut. Res. 2015, 22, 15788–15795. [Google Scholar] [CrossRef] [PubMed]
- Ballo, S.; Liu, M.; Hou, L.; Chang, J. Pollutants in stormwater runoff in Shanghai (China): Implications for management of urban runoff pollution. Prog. Nat. Sci. 2009, 19, 873–880. [Google Scholar] [CrossRef]
- Pillai, H.; Girish, K. Rubber processing industry effluent treatment using a bacterial consortium. Int. J. Curr. Microbiol. Appl. Sci. 2014, 3, 775–782. [Google Scholar]
- Elsergany, M.; Ahsan, A.; Aziz, M.A. Optimizing the performance of a paper mill effluent treatment. Sains Malays. 2015, 44, 101–106. [Google Scholar] [CrossRef]
- Phalakornkule, C.; Polgumhang, S.; Tongdaung, W.; Karakat, B.; Nuyut, T. Electrocoagulation of blue reactive, red disperse and mixed dyes, and application in treating textile effluent. J. Environ. Manag. 2010, 91, 918–926. [Google Scholar] [CrossRef] [PubMed]
- Bello, M.; Nourouzi, M.; Abdullah, L.C.; Choong, T.S.; Koay, Y.; Keshani, S. POME is treated for removal of color from biologically treated POME in fixed bed column: Applying wavelet neural network (WNN). J. Hazard. Mater. 2013, 262, 106–113. [Google Scholar] [CrossRef]
- Napoleão, D.; Zaidan, L.M.C.; Rodríguez-Díaz, J.; da Rocha Santana, R.; de Mendonça, M.B.d.S.; da Nova Araújo, A.; Benachour, M.; da Silva, V.L. Use of the photo-Fenton process to discover the degradation of drugs present in water from the wastewater treatment plants of the pharmaceutical industry. Afinidad 2018, 75, 23–31. [Google Scholar]
- Ramdani, N.; Benouis, K.; Lousdad, A.; Hamou, A.; Boufadi, M.Y. Physicochemical and bacteriological characterization of hospital effluents and their impact on the environment. Chem. Int. 2018, 4, 102–108. [Google Scholar]
- Noutsopoulos, C.; Andreadakis, A.; Kouris, N.; Charchousi, D.; Mendrinou, P.; Galani, A.; Mantziaras, I.; Koumaki, E. Greywater characterization and loadings—Physicochemical treatment to promote onsite reuse. J. Environ. Manag. 2018, 216, 337–346. [Google Scholar] [CrossRef] [PubMed]
- Shen, Z.; Liu, J.; Aini, G.; Gong, Y. A comparative study of the grain-size distribution of surface dust and stormwater runoff quality on typical urban roads and roofs in Beijing, China. Environ. Sci. Pollut. Res. 2016, 23, 2693–2704. [Google Scholar] [CrossRef] [PubMed]
- De Mello, K.; Valente, R.A.; Randhir, T.O.; Vettorazzi, C.A. Impacts of tropical forest cover on water quality in agricultural watersheds in Southeastern Brazil. Ecol. Indic. 2018, 93, 1293–1301. [Google Scholar] [CrossRef]
- Dikonketso, S.M.; Rasheed, A.; Olayinka, A.A. The analysis of physicochemical characteristics of pig farm seepage and its possible impact on the receiving natural environment. Afr. J. Environ. Sci. Technol. 2016, 10, 242–252. [Google Scholar] [CrossRef] [Green Version]
- Omofunmi, O.; Ilesanmi, O.; Alli, A. Assessing catfish pond effluent on soil physicochemical properties and its suitability for crop production. Arid Zone J. Eng. Technol. Environ. 2018, 14, 355–366. [Google Scholar]
- Huang, X.-F.; Ye, G.-Y.; Yi, N.-K.; Lu, L.-J.; Zhang, L.; Yang, L.-Y.; Xiao, L.; Liu, J. Effect of plant physiological characteristics on the removal of conventional and emerging pollutants from aquaculture wastewater by constructed wetlands. Ecol. Eng. 2019, 135, 45–53. [Google Scholar] [CrossRef]
- Chang, Y.-T.; Chang, Y.-J. The investigation of the bacterial indicators and point sources of pollution for the Nanshih River, Taiwan: A case study. Desalin. Water Treat. 2013, 52, 1130–1142. [Google Scholar] [CrossRef]
- Nazeer, S.; Hashmi, M.Z.; Malik, R.N. Heavy metals distribution, risk assessment and water quality characterization by water quality index of the River Soan, Pakistan. Ecol. Indic. 2014, 43, 262–270. [Google Scholar] [CrossRef]
- Yang, L.; Han, D.H.; Lee, B.-M.; Hur, J. Characterizing treated wastewaters of different industries using clustered fluorescence EEM–PARAFAC and FT-IR spectroscopy: Implications for downstream impact and source identification. Chemosphere 2015, 127, 222–228. [Google Scholar] [CrossRef]
- Van Loosdrecht, M.C.M.; Brdjanovic, D. Anticipating the next century of wastewater treatment. Science 2014, 344, 1452–1453. [Google Scholar] [CrossRef]
- Ruff, M.; Mueller, M.S.; Loos, M.; Singer, H. Quantitative target and systematic non-target analysis of polar organic micro-pollutants along the river Rhine using high-resolution mass-spectrometry—Identification of unknown sources and compounds. Water Res. 2015, 87, 145–154. [Google Scholar] [CrossRef] [PubMed]
- Bade, R.; Bijlsma, L.; Sancho, J.V.; Baz-Lomba, J.A.; Castiglioni, S.; Castrignanò, E.; Causanilles, A.; Gracia-Lor, E.; Kasprzyk-Hordern, B.; Kinyua, J.; et al. Liquid chromatography-tandem mass spectrometry determination of synthetic cathinones and phenethylamines in influent wastewater of eight European cities. Chemosphere 2017, 168, 1032–1041. [Google Scholar] [CrossRef] [PubMed] [Green Version]
- Kamjunke, N.; Von Tümpling, W.; Hertkorn, N.; Harir, M.; Schmitt-Kopplin, P.; Norf, H.; Weitere, M.; Herzsprung, P. A new approach for evaluating transformations of dissolved organic matter (DOM) via high-resolution mass spectrometry and relating it to bacterial activity. Water Res. 2017, 123, 513–523. [Google Scholar] [CrossRef] [PubMed]
- Fang, Z.; He, C.; Li, Y.; Chung, K.H.; Xu, C.; Shi, Q. Fractionation and characterization of dissolved organic matter (DOM) in refinery wastewater by revised phase retention and ion-exchange adsorption solid phase extraction followed by ESI FT-ICR MS. Talanta 2017, 162, 466–473. [Google Scholar] [CrossRef] [PubMed]
- Verkh, Y.; Rožman, M.; Petrovic, M. A non-targeted high-resolution mass spectrometry data analysis of dissolved organic matter in wastewater treatment. Chemosphere 2018, 200, 397–404. [Google Scholar] [CrossRef] [PubMed]
- Mohd-Nor, D.; Ramli, N.; Sharuddin, S.S.; Hassan, M.A.; Mustapha, N.A.; Ariffin, H.; Sakai, K.; Tashiro, Y.; Shirai, Y.; Maeda, T. Dynamics of microbial populations responsible for biodegradation during the full-scale treatment of palm oil mill effluent. Microbes Environ. 2019, 34, 121–128. [Google Scholar] [CrossRef] [Green Version]
- Eggen, R.I.L.; Hollender, J.; Joss, A.; Schärer, M.; Stamm, C. Reducing the discharge of micropollutants in the aquatic environment: The benefits of upgrading wastewater treatment plants. Environ. Sci. Technol. 2014, 48, 7683–7689. [Google Scholar] [CrossRef]
- Brack, W.; Hollender, J.; De Alda, M.L.; Müller, C.; Schulze, T.; Schymanski, E.; Slobodnik, J.; Krauss, M. High-resolution mass spectrometry to complement monitoring and track emerging chemicals and pollution trends in European water resources. Environ. Sci. Eur. 2019, 31, 1–6. [Google Scholar] [CrossRef] [Green Version]
- Hernández, E.H.; Andrades, M.; Álvarez-Martín, A.; Pose-Juan, E.; Rodríguez-Cruz, M.; Sánchez-Martín, M. Occurrence of pesticides and some of their degradation products in waters in a Spanish wine region. J. Hydrol. 2013, 486, 234–245. [Google Scholar] [CrossRef]
- Duong, H.T.; Kadokami, K.; Pan, S.; Matsuura, N.; Nguyen, T.Q. Screening and analysis of 940 organic micro-pollutants in river sediments in Vietnam using an automated identification and quantification database system for GC–MS. Chemosphere 2014, 107, 462–472. [Google Scholar] [CrossRef]
- Robles-Molina, J.; Gilbert-López, B.; García-Reyes, J.F.; Molina-Díaz, A. Monitoring of selected priority and emerging contaminants in the Guadalquivir River and other related surface waters in the province of Jaén, South East Spain. Sci. Total Environ. 2014, 479, 247–257. [Google Scholar] [CrossRef]
- Kong, L.; Kadokami, K.; Wang, S.; Duong, H.T.; Chau, H.T.C. Monitoring of 1300 organic micro-pollutants in surface waters from Tianjin, North China. Chemosphere 2015, 122, 125–130. [Google Scholar] [CrossRef]
- Hernández, F.; Sancho, J.V.; Ibáñez, M.; Abad, E.; Portolés, T.; Mattioli, L. Current use of high-resolution mass spectrometry in the environmental sciences. Anal. Bioanal. Chem. 2012, 403, 1251–1264. [Google Scholar] [CrossRef] [PubMed]
- Sun, T.; Wang, D.; Tang, Y.; Xing, X.; Zhuang, J.; Cheng, J.; Du, Z. Fabric-phase sorptive extraction coupled with ion mobility spectrometry for on-site rapid detection of PAHs in aquatic environment. Talanta 2019, 195, 109–116. [Google Scholar] [CrossRef] [PubMed]
- Siddig, A.A.; Ellison, A.M.; Ochs, A.; Villar-Leeman, C.; Lau, M.K. How do ecologists select and use indicator species to monitor ecological change? Insights from 14 years of publication in Ecological Indicators. Ecol. Indic. 2016, 60, 223–230. [Google Scholar] [CrossRef] [Green Version]
- Holt, E.A.; Miller, S.W. Bioindicators: Using organisms to measure environmental impacts. Nat. Educ. Knowl. 2011, 3, 8. [Google Scholar]
- Mccarty, L.; Power, M.; Munkittrick, K.R. Bioindicators versus biomarkers in ecological risk assessment. Hum. Ecol. Risk Assess. Int. J. 2002, 8, 159–164. [Google Scholar] [CrossRef]
- Adams, S.M.; Giesy, J.P.; Tremblay, L.A.; Eason, C. The use of biomarkers in ecological risk assessment: Recommendations from the Christchurch conference on biomarkers in ecotoxicology. Biomarkers 2001, 6, 1–6. [Google Scholar] [CrossRef]
- Marzin, A.; Archaimbault, V.; Belliard, J.; Chauvin, C.; Delmas, F.; Pont, D. Ecological assessment of running waters: Do macrophytes, macroinvertebrates, diatoms and fish show similar responses to human pressures? Ecol. Indic. 2012, 23, 56–65. [Google Scholar] [CrossRef]
- Lainé, M.; Morin, S.; Tison-Rosebery, J. A multicompartment approach - diatoms, macrophytes, benthic macroinvertebrates and fish - to assess the impact of toxic industrial releases on a small French river. PLoS ONE 2014, 9, e102358. [Google Scholar] [CrossRef]
- Green, H.C.; Haugland, R.A.; Varma, M.; Millen, H.T.; Borchardt, M.A.; Field, K.G.; Walters, W.A.; Knight, R.; Sivaganesan, M.; Kelty, C.A.; et al. Improved HF183 quantitative real-time PCR assay for characterization of human fecal pollution in ambient surface water samples. Appl. Environ. Microbiol. 2014, 80, 3086–3094. [Google Scholar] [CrossRef] [PubMed] [Green Version]
- Ahmed, W.; Sidhu, J.P.S.; Smith, K.; Beale, D.J.; Gyawali, P.; Toze, S. Distributions of fecal markers in wastewater from different climatic zones for human fecal pollution tracking in Australian surface waters. Appl. Environ. Microbiol. 2015, 82, 1316–1323. [Google Scholar] [CrossRef] [PubMed] [Green Version]
- Rousk, J.; Bååth, E.; Brookes, P.C.; Lauber, C.L.; Lozupone, C.; Caporaso, J.G.; Knight, R.; Fierer, N. Soil bacterial and fungal communities across a pH gradient in an arable soil. ISME J. 2010, 4, 1340–1351. [Google Scholar] [CrossRef] [PubMed]
- Bates, S.T.; Berg-Lyons, D.; Caporaso, J.G.; Walters, W.; Knight, R.; Fierer, N. Examining the global distribution of dominant archaeal populations in soil. ISME J. 2011, 5, 908–917. [Google Scholar] [CrossRef] [Green Version]
- Fierer, N.; Leff, J.W.; Adams, B.J.; Nielsen, U.N.; Bates, S.T.; Lauber, C.L.; Owens, S.; Gilbert, J.A.; Wall, D.H.; Caporaso, J.G. Cross-biome metagenomic analyses of soil microbial communities and their functional attributes. Proc. Natl. Acad. Sci. USA 2012, 109, 21390–21395. [Google Scholar] [CrossRef] [Green Version]
- Guo, J.; Zhao, L.; Lu, W.; Jia, H.; Sun, Y. Bacterial communities in water and sediment shaped by paper mill pollution and indicated bacterial taxa in sediment in Daling River. Ecol. Indic. 2016, 60, 766–773. [Google Scholar] [CrossRef]
- Lee, D.-Y.; Lee, H.; Trevors, J.T.; Weir, S.C.; Thomas, J.L.; Habash, M. Characterization of sources and loadings of fecal pollutants using microbial source tracking assays in urban and rural areas of the Grand River Watershed, Southwestern Ontario. Water Res. 2014, 53, 123–131. [Google Scholar] [CrossRef]
- Wood, S.A.; Smith, K.F.; Banks, J.C.; Tremblay, L.A.; Rhodes, L.L.; Mountfort, D.O.; Cary, S.C.; Pochon, X. Molecular genetic tools for environmental monitoring of New Zealand’s aquatic habitats, past, present and the future. N. Z. J. Mar. Freshw. Res. 2013, 47, 90–119. [Google Scholar] [CrossRef] [Green Version]
- Priac, A.; Badot, P.-M.; Crini, G. Treated wastewater phytotoxicity assessment using Lactuca sativa: Focus on germination and root elongation test parameters. Comptes Rendus Biol. 2017, 340, 188–194. [Google Scholar] [CrossRef]
- Charles, J.; Sancey, B.; Morin-Crini, N.; Badot, P.-M.; Degiorgi, F.; Trunfio, G.; Crini, G. Evaluation of the phytotoxicity of polycontaminated industrial effluents using the lettuce plant (Lactuca sativa) as a bioindicator. Ecotoxicol. Environ. Saf. 2011, 74, 2057–2064. [Google Scholar] [CrossRef]
- Ladislas, S.; El-Mufleh, A.; Gérente, C.; Chazarenc, F.; Andres, Y.; Béchet, B. Potential of aquatic macrophytes as bioindicators of heavy metal pollution in urban stormwater runoff. Water Air Soil Pollut. 2011, 223, 877–888. [Google Scholar] [CrossRef]
- Farias, D.; Hurd, C.; Eriksen, R.; MacLeod, C. Macrophytes as bioindicators of heavy metal pollution in estuarine and coastal environments. Mar. Pollut. Bull. 2018, 128, 175–184. [Google Scholar] [CrossRef] [PubMed]
- Klink, A.; Polechońska, L.; Cegłowska, A.; Stankiewicz, A. Typha latifolia (broadleaf cattail) as bioindicator of different types of pollution in aquatic ecosystems—Application of self-organizing feature map (neural network). Environ. Sci. Pollut. Res. 2016, 23, 14078–14086. [Google Scholar] [CrossRef] [PubMed]
- Baeta, A.; Vieira, L.R.; Lírio, A.V.; Canhoto, C.; Marques, J.C.; Guilhermino, L. Use of stable isotope ratios of fish larvae as indicators to assess diets and patterns of anthropogenic nitrogen pollution in estuarine ecosystems. Ecol. Indic. 2017, 83, 112–121. [Google Scholar] [CrossRef] [Green Version]
- Omar, W.A.; Mikhail, W.; Abdo, H.M.; El Defan, T.A.A.; Poraas, M.M. Ecological risk assessment of metal pollution along Greater Cairo Sector of the River Nile, Egypt, using nile tilapia, Oreochromis niloticus, as bioindicator. J. Toxicol. 2015, 2015, 1–11. [Google Scholar] [CrossRef] [Green Version]
- Lee, H.-C.; Lu, P.-N.; Huang, H.-L.; Chu, C.; Li, H.-P.; Tsai, H.-J. Zebrafish transgenic line huORFZ is an effective living bioindicator for detecting environmental toxicants. PLoS ONE 2014, 9, e90160. [Google Scholar] [CrossRef] [Green Version]
- Kumar, N.; Krishnani, K.K.; Singh, N.P. Oxidative and cellular stress as bioindicators for metal contamination in freshwater mollusk Lamellidens marginalis. Environ. Sci. Pollut. Res. 2017, 24, 16137–16147. [Google Scholar] [CrossRef]
- Júnior, C.D.S.M.; Juen, L.; Hamada, N. Analysis of urban impacts on aquatic habitats in the central Amazon basin: Adult odonates as bioindicators of environmental quality. Ecol. Indic. 2015, 48, 303–311. [Google Scholar] [CrossRef]
- Bråte, I.L.N.; Hurley, R.; Iversen, K.; Beyer, J.; Thomas, K.V.; Steindal, C.C.; Green, N.W.; Olsen, M.; Lusher, A. Mytilus spp. as sentinels for monitoring microplastic pollution in Norwegian coastal waters: A qualitative and quantitative study. Environ. Pollut. 2018, 243, 383–393. [Google Scholar] [CrossRef]
- Mahaut, M.-L.; Basuyaux, O.; Baudinière, E.; Chataignier, C.; Pain, J.; Caplat, C. The porifera Hymeniacidon perlevis (Montagu, 1818) as a bioindicator for water quality monitoring. Environ. Sci. Pollut. Res. 2012, 20, 2984–2992. [Google Scholar] [CrossRef]
- Wu, H.; Chen, P.; Tsay, T. Assessment of nematode community structure as a bioindicator in river monitoring. Environ. Pollut. 2010, 158, 1741–1747. [Google Scholar] [CrossRef] [PubMed]
- Filimonova, V.; Gonçalves, F.J.M.; Marques, J.C.; De Troch, M.; Gonçalves, F.J.M. Biochemical and toxicological effects of organic (herbicide Primextra® Gold TZ) and inorganic (copper) compounds on zooplankton and phytoplankton species. Aquat. Toxicol. 2016, 177, 33–43. [Google Scholar] [CrossRef] [PubMed] [Green Version]
- Xu, J.; Zhang, M. Primary consumers as bioindicator of nitrogen pollution in lake planktonic and benthic food webs. Ecol. Indic. 2012, 14, 189–196. [Google Scholar] [CrossRef]
- Neves, M.F.J.V.; Castro, B.B.; Vidal, T.; Vieira, R.H.S.D.F.; Marques, J.C.; Coutinho, J.A.P.; Goncalves, F.; Gonçalves, A. Biochemical and populational responses of an aquatic bioindicator species, Daphnia longispina, to a commercial formulation of a herbicide (Primextra® Gold TZ) and its active ingredient (S-metolachlor). Ecol. Indic. 2015, 53, 220–230. [Google Scholar] [CrossRef]
- Hamza, I.A.; Jurzik, L.; Überla, K.; Wilhelm, M. Evaluation of pepper mild mottle virus, human picobirnavirus and Torque teno virus as indicators of fecal contamination in river water. Water Res. 2011, 45, 1358–1368. [Google Scholar] [CrossRef]
- Yau, V.M.; Schiff, K.C.; Arnold, B.F.; Griffith, J.F.; Gruber, J.S.; Wright, C.C.; Wade, T.J.; Burns, S.; Hayes, J.M.; McGee, C.; et al. Effect of submarine groundwater discharge on bacterial indicators and swimmer health at Avalon Beach, CA, USA. Water Res. 2014, 59, 23–36. [Google Scholar] [CrossRef]
- Zhang, Y.; Kelly, W.R.; Panno, S.V.; Liu, Y.-Q. Tracing fecal pollution sources in karst groundwater by Bacteroidales genetic biomarkers, bacterial indicators, and environmental variables. Sci. Total Environ. 2014, 490, 1082–1090. [Google Scholar] [CrossRef]
- Sharuddin, S.S.; Ramli, N.; Hassan, M.A.; Mustapha, N.A.; Amran, A.; Mohd-Nor, D.; Sakai, K.; Tashiro, Y.; Shirai, Y.; Maeda, T. Bacterial community shift revealed Chromatiaceae and Alcaligenaceae as potential bioindicators in the receiving river due to palm oil mill effluent final discharge. Ecol. Indic. 2017, 82, 526–529. [Google Scholar] [CrossRef]
- Acosta, M.D.L.R.; Jiménez-Collazo, J.; Maldonado-Román, M.; Malavé-Llamas, K.; Musa-Wasil, J.C. Bacteria as potential indicators of heavy metal contamination in a tropical mangrove and the implications on environmental and human health. J. Trop. Life Sci. 2015, 5, 110–116. [Google Scholar] [CrossRef]
- Zamyadi, A.; McQuaid, N.; Prévost, M.; Dorner, S. Monitoring of potentially toxic cyanobacteria using an online multi-probe in drinking water sources. J. Environ. Monit. 2012, 14, 579–588. [Google Scholar] [CrossRef]
- Artigas, J.; Arts, G.H.; Babut, M.; Caracciolo, A.B.; Charles, S.; Chaumot, A.; Combourieu, B.; Dahllöf, I.; Despréaux, D.; Ferrari, B.J.D.; et al. Towards a renewed research agenda in ecotoxicology. Environ. Pollut. 2012, 160, 201–206. [Google Scholar] [CrossRef]
- Tlili, A.; Berard, A.; Blanck, H.; Bouchez, A.; Cássio, F.; Eriksson, K.M.; Morin, S.; Montuelle, B.; Navarro, E.; Pascoal, C.; et al. Pollution-induced community tolerance (PICT): Towards an ecologically relevant risk assessment of chemicals in aquatic systems. Freshw. Biol. 2015, 61, 2141–2151. [Google Scholar] [CrossRef] [Green Version]
- Clements, W.H.; Rohr, J.R. Community responses to contaminants: Using basic ecological principles to predict ecotoxicological effects. Environ. Toxicol. Chem. 2009, 28, 1789–1800. [Google Scholar] [CrossRef] [PubMed]
- Wakelin, S.A.; Gerard, E.; Van Koten, C.; Banabas, M.; O’Callaghan, M.; Nelson, P.N. Soil physicochemical properties impact more strongly on bacteria and fungi than conversion of grassland to oil palm. Pedobiology 2016, 59, 83–91. [Google Scholar] [CrossRef]
- Bolaji, E.J.; Opeyemi, I.E.; Eniola, O.O. Impact of palm oil mill effluent on physico-chemical parameters of a Southwestern River, Ekiti State, Nigeria. In 2nd Africa Regional Conference Technical Proceedings; Derkyi, M., Awuah, E., Obeng-Ofori, D., Derkyi, N.S.A., Owusu-Ansah, F., Eds.; University of Energy and Natural Resources: Sunyani, Ghana, 2015; pp. 638–646. [Google Scholar]
- Gözdereliler, E.; Boon, N.; Aamand, J.; De Roy, K.; Granitsiotis, M.S.; Albrechtsen, H.-J.; Sørensen, S.R. Comparing metabolic functionalities, community structures, and dynamics of herbicide-degrading communities cultivated with different substrate concentrations. Appl. Environ. Microbiol. 2012, 79, 367–375. [Google Scholar] [CrossRef] [PubMed] [Green Version]
- Ye, L.; Zhang, T. Bacterial communities in different sections of a municipal wastewater treatment plant revealed by 16S rDNA 454 pyrosequencing. Appl. Microbiol. Biotechnol. 2013, 97, 2681–2690. [Google Scholar] [CrossRef] [Green Version]
- Nshimyimana, J.P.; Ekklesia, E.; Shanahan, P.; Chua, L.H.C.; Thompson, J.R. Distribution and abundance of human-specific Bacteroides and relation to traditional indicators in an urban tropical catchment. J. Appl. Microbiol. 2014, 116, 1369–1383. [Google Scholar] [CrossRef] [Green Version]
- Ryall, B.; Eydallin, G.; Ferenci, T. Culture history and population heterogeneity as determinants of bacterial adaptation: The adaptomics of a single environmental transition. Microbiol. Mol. Biol. Rev. 2012, 76, 597–625. [Google Scholar] [CrossRef] [Green Version]
- Mlejnková, H.; Sovová, K. Impact of pollution and seasonal changes on microbial community structure in surface water. Water Sci. Technol. 2010, 61, 2787–2795. [Google Scholar] [CrossRef]
- Zhao, J.; Zhao, X.; Chao, L.; Zhang, W.; You, T.; Zhang, J. Diversity change of microbial communities responding to zinc and arsenic pollution in a river of northeastern China. J. Zhejiang Univ. Sci. B 2014, 15, 670–680. [Google Scholar] [CrossRef] [Green Version]
- Lear, G.; Ancion, P.-Y.; Harding, J.; Lewis, G. Use of bacterial communities to assess the ecological health of a recently restored stream. N. Z. J. Mar. Freshw. Res. 2012, 46, 291–301. [Google Scholar] [CrossRef]
- Witt, V.; Wild, C.; Uthicke, S. Effect of substrate type on bacterial community composition in biofilms from the Great Barrier Reef. FEMS Microbiol. Lett. 2011, 323, 188–195. [Google Scholar] [CrossRef] [PubMed] [Green Version]
- Kriwy, P.; Uthicke, S. Microbial diversity in marine biofilms along a water quality gradient on the Great Barrier Reef. Syst. Appl. Microbiol. 2011, 34, 116–126. [Google Scholar] [CrossRef] [PubMed]
- Borrero-Santiago, A.R.; Bautista-Chamizo, E.; DelValls, T.; Riba, I. A possible CO2 leakage event: Can the marine microbial community be recovered? Mar. Pollut. Bull. 2017, 117, 380–385. [Google Scholar] [CrossRef]
- Niu, L.; Li, Y.; Wang, P.; Zhang, W.; Wang, C.; Li, J.; Wu, H. Development of a microbial community-based index of biotic integrity (MC-IBI) for the assessment of ecological status of rivers in the Taihu Basin, China. Ecol. Indic. 2018, 85, 204–213. [Google Scholar] [CrossRef]
- Paulino, G.V.B.; Félix, C.R.; Silvan, C.G.; Andersen, G.L.; Landell, M.F. Bacterial community and environmental factors associated to rivers runoff and their possible impacts on coral reef conservation. Mar. Pollut. Bull. 2020, 156, 111233. [Google Scholar] [CrossRef] [PubMed]
- Shahi, A.; Ince, B.; Aydin, S.; Ince, O. Assessment of the horizontal transfer of functional genes as a suitable approach for evaluation of the bioremediation potential of petroleum-contaminated sites: A mini-review. Appl. Microbiol. Biotechnol. 2017, 101, 4341–4348. [Google Scholar] [CrossRef]
- Stewart, E.J. Growing Unculturable Bacteria. J. Bacteriol. 2012, 194, 4151–4160. [Google Scholar] [CrossRef] [Green Version]
- De Tender, C.; Schlundt, C.; Devriese, L.I.; Mincer, T.J.; Zettler, E.R.; Amaral-Zettler, L. A review of microscopy and comparative molecular-based methods to characterize “Plastisphere” communities. Anal. Methods 2017, 9, 2132–2143. [Google Scholar] [CrossRef]
- Lear, G.; Dopheide, A.; Ancion, P.; Lewis, G.D. A comparison of bacterial, ciliate and macroinvertebrate indicators of stream ecological health. Aquat. Ecol. 2011, 45, 517–527. [Google Scholar] [CrossRef]
- Díez, B.; Pedrós-Alió, C.; Marsh, T.L.; Massana, R. Application of Denaturing Gradient Gel Electrophoresis (DGGE) To Study the Diversity of Marine Picoeukaryotic Assemblages and Comparison of DGGE with Other Molecular Techniques. Appl. Environ. Microbiol. 2001, 67, 2942–2951. [Google Scholar] [CrossRef] [PubMed] [Green Version]
- Duarte, S.; Cássio, F.; Pascoal, C. Denaturing gradient gel electrophoresis (DGGE) in Microbial Ecology—Insights from Freshwaters. In Gel Electrophoresis—Principles and Basics; IntechOpen: London, UK, 2012; pp. 173–196. [Google Scholar]
- Nielsen, K.L.; Godfrey, P.A.; Stegger, M.; Andersen, P.S.; Feldgarden, M.; Frimodt-Møller, N. Selection of unique Escherichia coli clones by random amplified polymorphic DNA (RAPD): Evaluation by whole genome sequencing. J. Microbiol. Methods 2014, 103, 101–103. [Google Scholar] [CrossRef] [PubMed] [Green Version]
- Sjöberg, F.; Nowrouzian, F.; Rangel, I.; Hannoun, C.; Moore, E.; Adlerberth, I.; Wold, A.E. Comparison between terminal-restriction fragment length polymorphism (T-RFLP) and quantitative culture for analysis of infants’ gut microbiota. J. Microbiol. Methods 2013, 94, 37–46. [Google Scholar] [CrossRef] [PubMed]
- Moreno, L.I.; Mills, D.; Fetscher, J.; John-Williams, K.; Meadows-Jantz, L.; Mccord, B. The application of amplicon length heterogeneity PCR (LH-PCR) for monitoring the dynamics of soil microbial communities associated with cadaver decomposition. J. Microbiol. Methods 2011, 84, 388–393. [Google Scholar] [CrossRef] [PubMed]
- Naknim, V.; Kutanan, W.; Lomthaisong, K. Identifying the origin of forensic soil evidence using amplified ribosomal DNA restriction analysis of its bacterial community. Chiang Mai Univ. J. Nat. Sci. 2016, 15, 115–128. [Google Scholar] [CrossRef]
- Ciesielski, S.; Bułkowska, K.; Dabrowska, D.; Kaczmarczyk, D.; Kowal, P.; Możejko-Ciesielska, J. Ribosomal intergenic spacer analysis as a tool for monitoring methanogenic archaea changes in an anaerobic digester. Curr. Microbiol. 2013, 67, 240–248. [Google Scholar] [CrossRef] [Green Version]
- Gao, G.; Yin, D.; Chen, S.; Xia, F.; Yang, J.; Li, Q.; Wang, W. Effect of biocontrol agent Pseudomonas fluorescens 2P24 on soil fungal community in cucumber rhizosphere using T-RFLP and DGGE. PLoS ONE 2012, 7, e31806. [Google Scholar] [CrossRef]
- Zhang, W.; Mo, Y.; Yang, J.; Zhou, J.; Lin, Y.; Isabwe, A.; Zhang, J.; Gao, X.; Yu, Z. Genetic diversity pattern of microeukaryotic communities and its relationship with the environment based on PCR-DGGE and T-RFLP techniques in Dongshan Bay, Southeast China. Cont. Shelf Res. 2018, 164, 1–9. [Google Scholar] [CrossRef]
- Vallaeys, T.; Topp, E.; Muyzer, G.; Macheret, V.; Laguerre, G.; Rigaud, A.; Soulas, G. Evaluation of denaturing gradient gel electrophoresis in the detection of 16S rDNA sequence variation in rhizobia and methanotrophs. FEMS Microbiol. Ecol. 2006, 24, 279–285. [Google Scholar] [CrossRef]
- Muyzer, G.; Smalla, K. Application of denaturing gradient gel electrophoresis (DGGE) and temperature gradient gel electrophoresis (TGGE) in microbial ecology. Antonie van Leeuwenhoek 1998, 73, 127–141. [Google Scholar] [CrossRef]
- Cetecioglu, Z.; Ince, O.; Ince, B. Gel Electrophoresis Based Genetic Fingerprinting Techniques on Environmental Ecology. In Gel Electrophoresis—Advanced Techniques; IntechOpen: London, UK, 2012; pp. 52–66. [Google Scholar]
- Du, H.; Harata, N.; Li, F. Responses of riverbed sediment bacteria to heavy metals: Integrated evaluation based on bacterial density, activity and community structure under well-controlled sequencing batch incubation conditions. Water Res. 2018, 130, 115–126. [Google Scholar] [CrossRef]
- Chonova, T.; Labanowski, J.; Cournoyer, B.; Chardon, C.; Keck, F.; Laurent, É.; Mondamert, L.; Vasselon, V.; Wiest, L.; Bouchez, A. River biofilm community changes related to pharmaceutical loads emitted by a wastewater treatment plant. Environ. Sci. Pollut. Res. 2017, 25, 9254–9264. [Google Scholar] [CrossRef]
- Smalla, K.; Oros-Sichler, M.; Milling, A.; Heuer, H.; Baumgarte, S.; Becker, R.; Neuber, G.; Kropf, S.; Ulrich, A.; Tebbe, C.C. Bacterial diversity of soils assessed by DGGE, T-RFLP and SSCP fingerprints of PCR-amplified 16S rRNA gene fragments: Do the different methods provide similar results? J. Microbiol. Methods 2007, 69, 470–479. [Google Scholar] [CrossRef]
- Van Elsas, J.D.; Boersma, F.G.H. A review of molecular methods to study the microbiota of soil and the mycosphere. Eur. J. Soil Biol. 2011, 47, 77–87. [Google Scholar] [CrossRef]
- Karczewski, K.; Riss, H.W.; Meyer, E.I. Comparison of DNA-fingerprinting (T-RFLP) and high-throughput sequencing (HTS) to assess the diversity and composition of microbial communities in groundwater ecosystems. Limnologica 2017, 67, 45–53. [Google Scholar] [CrossRef]
- Ramette, A.N. Quantitative community fingerprinting methods for estimating the abundance of operational taxonomic units in natural microbial communities. Appl. Environ. Microbiol. 2009, 75, 2495–2505. [Google Scholar] [CrossRef] [PubMed] [Green Version]
- Lindström, S.; Rowe, O.; Timonen, S.; Sundström, L.; Johansson, H. Trends in bacterial and fungal communities in ant nests observed with terminal-restriction fragment length polymorphism (T-RFLP) and Next Generation Sequencing (NGS) techniques—Validity and compatibility in ecological studies. PeerJ 2018, 6, e5289. [Google Scholar] [CrossRef]
- Loman, N.J.; Constantinidou, C.; Chan, J.Z.M.; Halachev, M.R.; Sergeant, M.J.; Penn, C.W.; Robinson, E.R.; Pallen, M.J. High-throughput bacterial genome sequencing: An embarrassment of choice, a world of opportunity. Nat. Rev. Genet. 2012, 10, 599–606. [Google Scholar] [CrossRef]
- Deviram, G.; Charankumar, B.; Ramu, K.; Madeswaran, P.; Murthy, M.V.R. A review on the applications and recent advances in environmental DNA (eDNA) metagenomics. Rev. Environ. Sci. Bio Technol. 2019, 18, 389–411. [Google Scholar] [CrossRef]
- Glenn, T.C. Field guide to next-generation DNA sequencers. Mol. Ecol. Resour. 2011, 11, 759–769. [Google Scholar] [CrossRef]
- Jünemann, S.; Sedlazeck, F.J.; Prior, K.; Albersmeier, A.; John, U.; Kalinowski, J.; Mellmann, A.; Goesmann, A.; Von Haeseler, A.; Stoye, J.; et al. Updating benchtop sequencing performance comparison. Nat. Biotechnol. 2013, 31, 294–296. [Google Scholar] [CrossRef] [PubMed] [Green Version]
- Mardis, E.R. The impact of next-generation sequencing technology on genetics. Trends Genet. 2008, 24, 133–141. [Google Scholar] [CrossRef] [PubMed] [Green Version]
- Mason, O.U.; Scott, N.M.; Gonzalez, A.P.; Robbins-Pianka, A.; Baelum, J.; Kimbrel, J.A.; Bouskill, N.J.; Prestat, E.; Borglin, S.E.; Joyner, D.C.; et al. Metagenomics reveals sediment microbial community response to Deepwater Horizon oil spill. ISME J. 2014, 8, 1464–1475. [Google Scholar] [CrossRef] [Green Version]
- Mohd-Nor, D.; Ramli, N.; Sharuddin, S.S.; Hassan, M.A.; Mustapha, N.A.; Amran, A.; Sakai, K.; Shirai, Y.; Maeda, T. Alcaligenaceae and Chromatiaceae as reliable bioindicators present in palm oil mill effluent final discharge treated by different biotreatment processes. Ecol. Indic. 2018, 95, 468–473. [Google Scholar] [CrossRef]
- Albertsen, M.; Hansen, L.B.S.; Saunders, A.M.; Nielsen, P.H.; Nielsen, K.L. A metagenome of a full-scale microbial community carrying out enhanced biological phosphorus removal. ISME J. 2012, 6, 1094–1106. [Google Scholar] [CrossRef]
- Ju, F.; Guo, F.; Ye, L.; Xia, Y.; Zhang, T. Metagenomic analysis on seasonal microbial variations of activated sludge from a full-scale wastewater treatment plant over 4 years. Environ. Microbiol. Rep. 2014, 6, 80–89. [Google Scholar] [CrossRef]
- Guo, J.; Peng, Y.; Ni, B.-J.; Han, X.; Fan, L.; Yuan, Z. Dissecting microbial community structure and methane-producing pathways of a full-scale anaerobic reactor digesting activated sludge from wastewater treatment by metagenomic sequencing. Microb. Cell Factories 2015, 14, 1–11. [Google Scholar] [CrossRef] [Green Version]
- Gao, Y.; Wang, C.; Zhang, W.; Di, P.; Yi, N.; Chen, C. Vertical and horizontal assemblage patterns of bacterial communities in a eutrophic river receiving domestic wastewater in southeast China. Environ. Pollut. 2017, 230, 469–478. [Google Scholar] [CrossRef]
- Ouyang, L.; Chen, H.; Liu, X.; Wong, M.H.; Xu, F.; Yang, X.; Xu, W.; Zeng, Q.; Wang, W.; Li, S. Characteristics of spatial and seasonal bacterial community structures in a river under anthropogenic disturbances. Environ. Pollut. 2020, 264, 114818. [Google Scholar] [CrossRef]
- Zhang, K.; Zhang, Z.; Hu, Z.; Zeng, F.; Chen, C.; Yang, X.; Li, Y. Bacterial community composition and function succession under aerobic and anaerobic conditions impacts the biodegradation of 17β-estradiol and its environmental risk. Environ. Pollut. 2020, 267, 115155. [Google Scholar] [CrossRef]
- Jin, D.; Kong, X.; Cui, B.; Jin, S.; Xie, Y.; Wang, X.; Deng, Y. Bacterial communities and potential waterborne pathogens within the typical urban surface waters. Sci. Rep. 2018, 8, 13368. [Google Scholar] [CrossRef] [PubMed]
- Davis, M.C.; Messina, M.A.; Nicolosi, G.; Petralia, S.; Baker, M.D.; Mayne, C.K.S.; Dinon, C.M.; Moss, C.J.; Onac, B.P.; Garey, J.R.; et al. Surface runoff alters cave microbial community structure and function. PLoS ONE 2020, 15, e0232742. [Google Scholar] [CrossRef] [PubMed]
- Zolkefli, N.; Ramli, N.; Mohamad-Zainal, N.S.L.; Mustapha, N.A.; Yusoff, M.Z.M.; Hassan, M.A.; Maeda, T. Alcaligenaceae and Chromatiaceae as pollution bacterial bioindicators in palm oil mill effluent (POME) final discharge polluted rivers. Ecol. Indic. 2020, 111, 106048. [Google Scholar] [CrossRef]
- Cordier, T.; Lanzén, A.; Apothéloz-Perret-Gentil, L.; Stoeck, T.; Pawlowski, J. Embracing environmental genomics and machine learning for routine biomonitoring. Trends Microbiol. 2019, 27, 387–397. [Google Scholar] [CrossRef] [PubMed]
- Jaspers, E.; Overmann, J. Ecological significance of microdiversity: Identical 16S rRNA gene sequences can be found in bacteria with highly divergent genomes and ecophysiologies. Appl. Environ. Microbiol. 2004, 70, 4831–4839. [Google Scholar] [CrossRef] [PubMed] [Green Version]
- Basile, L.A.; Erijman, L. Quantitative assessment of phenol hydroxylase diversity in bioreactors using a functional gene analysis. Appl. Microbiol. Biotechnol. 2008, 78, 863–872. [Google Scholar] [CrossRef] [PubMed]
- Xu, T.; Perry, N.; Chuahan, A.; Sayler, G.; Ripp, S. Microbial indicators for monitoring pollution and bioremediation. In Microbial Biodegradation and Bioremediation; Elsevier BV: Amsterdam, The Netherlands, 2014; pp. 115–136. [Google Scholar]
- Hasenbein, M.; Werner, I.; Deanovic, L.A.; Geist, J.; Fritsch, E.B.; Javidmehr, A.; Foe, C.; Fangue, N.A.; Connon, R.E. Transcriptomic profiling permits the identification of pollutant sources and effects in ambient water samples. Sci. Total Environ. 2014, 468, 688–698. [Google Scholar] [CrossRef]
- Rani, B.; Sharma, V. Transcriptome profiling: Methods and applications—A review. Agric. Rev. 2017, 38, 271–281. [Google Scholar] [CrossRef] [Green Version]
- Juskowiak, B. Nucleic acid-based fluorescent probes and their analytical potential. Anal. Bioanal. Chem. 2011, 399, 3157–3176. [Google Scholar] [CrossRef] [Green Version]
- De Boer, P.; Rahaoui, H.; Leer, R.; Montijn, R.; Van Der Vossen, J. Real-time PCR detection of Campylobacter spp.: A comparison to classic culturing and enrichment. Food Microbiol. 2015, 51, 96–100. [Google Scholar] [CrossRef]
- González-Plaza, J.J.; Blau, K.; Milaković, M.; Jurina, T.; Smalla, K.; Udikovic-Kolic, N. Antibiotic-manufacturing sites are hot-spots for the release and spread of antibiotic resistance genes and mobile genetic elements in receiving aquatic environments. Environ. Int. 2019, 130, 104735. [Google Scholar] [CrossRef] [PubMed]
- Tolosi, R.; Apostolakos, I.; Laconi, A.; Carraro, L.; Grilli, G.; Cagnardi, P.; Piccirillo, A. Rapid detection and quantification of plasmid-mediated colistin resistance genes (mcr-1 to mcr-5) by real-time PCR in bacterial and environmental samples. J. Appl. Microbiol. 2020, 129, 1–7. [Google Scholar] [CrossRef] [PubMed]
- Hafeez, F.; Martin-Laurent, F.; Béguet, J.; Bru, D.; Cortet, J.; Schwartz, C.; Morel, J.-L.; Philippot, L. Taxonomic and functional characterization of microbial communities in technosols constructed for remediation of a contaminated industrial wasteland. J. Soils Sediments 2012, 12, 1396–1406. [Google Scholar] [CrossRef]
- Keshri, J.; Yousuf, B.; Mishra, A.; Jha, B. The abundance of functional genes, cbbL, nifH, amoA and apsA, and bacterial community structure of intertidal soil from Arabian Sea. Microbiol. Res. 2015, 175, 57–66. [Google Scholar] [CrossRef]
- Zhao, H.-M.; Hu, R.-W.; Du, H.; Xin, X.-P.; Li, Y.-W.; Li, H.; Cai, Q.-Y.; Mo, C.-H.; Liu, J.-S.; Zhou, D.; et al. Functional genomic analysis of phthalate acid ester (PAE) catabolism genes in the versatile PAE-mineralising bacterium Rhodococcus sp. 2G. Sci. Total Environ. 2018, 640, 646–652. [Google Scholar] [CrossRef]
- Chakraborty, A.; Dasgupta, C.K.; Bhadury, P. Application of molecular techniques for the assessment of microbial communities in contaminated sites. In Microbial Biodegradation and Bioremediation; Elsevier BV: Amsterdam, The Netherlands, 2014; pp. 85–113. [Google Scholar]
- Stefano, G.B.; Mantione, K.; Kream, R.M.; Kuzelova, H.; Ptáček, R.; Raboch, J.; Samuel, J.M. Comparing bioinformatic gene expression profiling methods: Microarray and RNA-Seq. Med. Sci. Monit. Basic Res. 2014, 20, 138–142. [Google Scholar] [CrossRef] [Green Version]
- He, Z.; Deng, Y.; Zhou, J. Development of functional gene microarrays for microbial community analysis. Curr. Opin. Biotechnol. 2012, 23, 49–55. [Google Scholar] [CrossRef]
- Jie, S.; Li, M.; Gan, M.; Zhu, J.; Yin, H.; Liu, X. Microbial functional genes enriched in the Xiangjiang River sediments with heavy metal contamination. BMC Microbiol. 2016, 16, 179. [Google Scholar] [CrossRef] [Green Version]
- Cong, J.; Yang, Y.; Liu, X.; Lu, H.; Liu, X.; Zhou, J.; Li, D.; Yin, H.; Ding, J.; Zhang, Y. Analyses of soil microbial community compositions and functional genes reveal potential consequences of natural forest succession. Sci. Rep. 2015, 5, 10007. [Google Scholar] [CrossRef] [Green Version]
- Short, M.D.; Abell, G.C.; Bodrossy, L.; Akker, B.V.D. Application of a novel functional gene microarray to probe the functional ecology of ammonia oxidation in nitrifying activated sludge. PLoS ONE 2013, 8, e77139. [Google Scholar] [CrossRef] [Green Version]
- Chan, Y.; Van Nostrand, J.D.; Zhou, J.; Pointing, S.B.; Farrell, R.L. Functional ecology of an Antarctic Dry Valley. Proc. Natl. Acad. Sci. USA 2013, 110, 8990–8995. [Google Scholar] [CrossRef] [PubMed] [Green Version]
- Van Nostrand, J.D.; He, Z.; Zhou, J. Use of functional gene arrays for elucidating in situ biodegradation. Front. Microbiol. 2012, 3, 339. [Google Scholar] [CrossRef] [PubMed] [Green Version]
- Tu, Q.; Yu, H.; He, Z.; Deng, Y.; Wu, L.; Van Nostrand, J.D.; Zhou, A.; Voordeckers, J.; Lee, Y.-J.; Qin, Y.; et al. GeoChip 4: A functional gene-array-based high-throughput environmental technology for microbial community analysis. Mol. Ecol. Resour. 2014, 14, 914–928. [Google Scholar] [CrossRef] [PubMed]
- Peimbert, M.; Alcaraz, L.D. A hitchhiker’s guide to metatranscriptomics. In Field Guidelines for Genetic Experimental Designs in High-Throughput Sequencing; Aransay, A., Lavín Trueba, J., Eds.; Springer: Cham, Switzerland, 2016; pp. 313–342. [Google Scholar]
- Croucher, N.J.; Thomson, N.R. Studying bacterial transcriptomes using RNA-seq. Curr. Opin. Microbiol. 2010, 13, 619–624. [Google Scholar] [CrossRef] [PubMed] [Green Version]
- Bashiardes, S.; Zilberman-Schapira, G.; Elinav, E. Use of Metatranscriptomics in microbiome research. Bioinform. Biol. Insights 2016, 10, BBI.S34610-25. [Google Scholar] [CrossRef] [Green Version]
- Crovadore, J.; Soljan, V.; Calmin, G.; Chablais, R.; Cochard, B.; Lefort, F. Metatranscriptomic and metagenomic description of the bacterial nitrogen metabolism in waste water wet oxidation effluents. Heliyon 2017, 3, e00427. [Google Scholar] [CrossRef]
- Desta, A.F.; Nzioki, J.; Maina, S.; Stomeo, F. Molecular biomonitoring of microbial communities in tannery wastewater treatment plant for the removal of retanning chemicals. Biol. Wastewater Treat. Resour. Recovery 2017, 141. [Google Scholar] [CrossRef]
- Johnson, D.R.; Lee, T.K.; Park, J.; Fenner, K.; Helbling, D.E. The functional and taxonomic richness of wastewater treatment plant microbial communities are associated with each other and with ambient nitrogen and carbon availability. Environ. Microbiol. 2014, 17, 4851–4860. [Google Scholar] [CrossRef]
- Ju, F.; Beck, K.; Yin, X.; Maccagnan, A.; McArdell, C.S.; Singer, H.P.; Johnson, D.R.; Zhang, T.; Bürgmann, H. Wastewater treatment plant resistomes are shaped by bacterial composition, genetic exchange, and upregulated expression in the effluent microbiomes. ISME J. 2019, 13, 346–360. [Google Scholar] [CrossRef] [Green Version]
- Liu, Z.; Klümper, U.; Liu, Y.; Yang, Y.; Wei, Q.; Lin, J.-G.; Gu, J.; Li, M. Metagenomic and metatranscriptomic analyses reveal activity and hosts of antibiotic resistance genes in activated sludge. Environ. Int. 2019, 129, 208–220. [Google Scholar] [CrossRef]
- Falk, N.; Reid, T.; Skoyles, A.; Grgicak-Mannion, A.; Drouillard, K.; Weisener, C. Microbial metatranscriptomic investigations across contaminant gradients of the Detroit River. Sci. Total Environ. 2019, 690, 121–131. [Google Scholar] [CrossRef] [PubMed]
- Yu, K.; Zhang, T. Metagenomic and metatranscriptomic analysis of microbial community structure and gene expression of activated sludge. PLoS ONE 2012, 7, e38183. [Google Scholar] [CrossRef] [Green Version]
- Handley, K.M.; Piceno, Y.M.; Hu, P.; Tom, L.M.; Mason, O.U.; Andersen, G.L.; Jansson, J.K.; Gilbert, J.A. Metabolic and spatio-taxonomic response of uncultivated seafloor bacteria following the Deepwater Horizon oil spill. ISME J. 2017, 11, 2569–2583. [Google Scholar] [CrossRef] [PubMed] [Green Version]
- Wu, J.; Gao, W.; Johnson, R.H.; Zhang, W.; Meldrum, D.R. Integrated metagenomic and metatranscriptomic analyses of microbial communities in the meso- and bathypelagic realm of North Pacific Ocean. Mar. Drugs 2013, 11, 3777–3801. [Google Scholar] [CrossRef] [PubMed] [Green Version]
- Satinsky, B.M.; Fortunato, C.S.; Doherty, M.; Smith, C.B.; Sharma, S.; Ward, N.D.; Krusche, A.V.; Yager, P.L.; Richey, J.E.; Moran, M.A.; et al. Metagenomic and metatranscriptomic inventories of the lower Amazon River, May 2011. Microbiome 2015, 3, 39. [Google Scholar] [CrossRef] [PubMed] [Green Version]
- Fortunato, C.S.; Crump, B.C. Microbial gene abundance and expression patterns across a river to ocean salinity gradient. PLoS ONE 2015, 10, e0140578. [Google Scholar] [CrossRef] [PubMed] [Green Version]
- Nakamura, Y.; Yamamoto, N.; Kino, Y.; Yamamoto, N.; Kamei, S.; Mori, H.; Kurokawa, K.; Nakashima, N. Establishment of a multi-species biofilm model and metatranscriptomic analysis of biofilm and planktonic cell communities. Appl. Microbiol. Biotechnol. 2016, 100, 7263–7279. [Google Scholar] [CrossRef]
- Lau, M.C.Y.; Harris, R.L.; Oh, Y.; Yi, M.J.; Behmard, A.; Onstott, T.C. Taxonomic and functional compositions impacted by the quality of metatranscriptomic assemblies. Front. Microbiol. 2018, 9, 1235. [Google Scholar] [CrossRef] [Green Version]
- Etan, B.; Ng, C.M.; Nshimyimana, J.P.; Eloh, L.-L.; Gin, K.Y.-H.; Thompson, J.R. Next-generation sequencing (NGS) for assessment of microbial water quality: Current progress, challenges, and future opportunities. Front. Microbiol. 2015, 6, 1027. [Google Scholar] [CrossRef]
- Aiken, G. Fluorescence and dissolved organic matter: A chemist’s perspective. In Aquatic Organic Matter Fluorescence; Coble, P.G., Lead, J., Baker, A., Reynolds, D.M., Spencer, R.G.M., Eds.; Cambridge University Press: New York, NY, USA, 2014; Chapter 2; pp. 35–74. [Google Scholar]
- Manti, A.; Boi, P.; Falcioni, T.; Canonico, B.; Ventura, A.; Sisti, D.; Pianetti, A.; Balsamo, M.; Papa, S. Bacterial Cell Monitoring in Wastewater Treatment Plants by Flow Cytometry. Water Environ. Res. 2008, 80, 346–354. [Google Scholar] [CrossRef]
- Hammes, F.; Egli, T. Cytometric methods for measuring bacteria in water: Advantages, pitfalls and applications. Anal. Bioanal. Chem. 2010, 397, 1083–1095. [Google Scholar] [CrossRef] [PubMed]
- Lautenschlager, K.; Hwang, C.; Liu, W.-T.; Boon, N.; Köster, O.; Vrouwenvelder, H.; Egli, T.; Hammes, F. A microbiology-based multi-parametric approach towards assessing biological stability in drinking water distribution networks. Water Res. 2013, 47, 3015–3025. [Google Scholar] [CrossRef] [PubMed] [Green Version]
- Gillespie, S.; Lipphaus, P.; Green, J.; Parsons, S.; Weir, P.; Juskowiak, K.; Jefferson, B.; Jarvis, P.; Nocker, A. Assessing microbiological water quality in drinking water distribution systems with disinfectant residual using flow cytometry. Water Res. 2014, 65, 224–234. [Google Scholar] [CrossRef] [PubMed]
- Nescerecka, A.; Juhna, T.; Hammes, F. Identifying the underlying causes of biological instability in a full-scale drinking water supply system. Water Res. 2018, 135, 11–21. [Google Scholar] [CrossRef] [PubMed]
- Liu, J.; Ma, D.; Ma, L.; Song, Y.; Gao, G.; Wang, Y. Geographic distribution pattern of low and high nucleic acid content bacteria on a river-catchment scale. Mar. Freshw. Res. 2017, 68, 1618. [Google Scholar] [CrossRef] [Green Version]
- Sharuddin, S.S.; Ramli, N.; Mohd-Nor, D.; Hassan, M.A.; Maeda, T.; Shirai, Y.; Sakai, K.; Tashiro, Y. Shift of low to high nucleic acid bacteria as a potential bioindicator for the screening of anthropogenic effects in a receiving river due to palm oil mill effluent final discharge. Ecol. Indic. 2018, 85, 79–84. [Google Scholar] [CrossRef]
- Santos, M.; Oliveira, H.; Pereira, J.L.; Pereira, M.J.; Goncalves, F.; Vidal, T. Flow cytometry analysis of low/high DNA content (LNA/HNA) bacteria as bioindicator of water quality evaluation. Ecol. Indic. 2019, 103, 774–781. [Google Scholar] [CrossRef]
- Abzazou, T.; Salvadó, H.; Bruguera-Casamada, C.; Simón, P.; Lardín, C.; Araujo, R.M. Assessment of total bacterial cells in extended aeration activated sludge plants using flow cytometry as a microbial monitoring tool. Environ. Sci. Pollut. Res. 2015, 22, 11446–11455. [Google Scholar] [CrossRef]
- Foladori, P.; Bruni, L.; Tamburini, S.; Ziglio, G. Direct quantification of bacterial biomass in influent, effluent and activated sludge of wastewater treatment plants by using flow cytometry. Water Res. 2010, 44, 3807–3818. [Google Scholar] [CrossRef]
- Kim, J.M.; Lee, H.J.; Kim, S.Y.; Song, J.J.; Park, W.; Jeon, C.O. Analysis of the fine-scale population structure of “Candidatus Accumulibacter phosphatis” in enhanced biological phosphorus removal sludge, using fluorescence in situ hybridization and flow cytometric sorting. Appl. Environ. Microbiol. 2010, 76, 3825–3835. [Google Scholar] [CrossRef] [Green Version]
- Vital, M.; Stucki, D.; Egli, T.; Hammes, F. Evaluating the growth potential of pathogenic bacteria in water. Appl. Environ. Microbiol. 2010, 76, 6477–6484. [Google Scholar] [CrossRef] [PubMed] [Green Version]
Figure 1.
Monitoring approaches for aquatic pollution caused by anthropogenic wastewaters [1,2,3,4,5,6].

Figure 2.
River and wastewater monitoring in the ecosystem including the physicochemical factors, compound characteristics, biological elements and molecular (nucleic acids) analyses are being considered in various monitoring tools.
Figure 2.
River and wastewater monitoring in the ecosystem including the physicochemical factors, compound characteristics, biological elements and molecular (nucleic acids) analyses are being considered in various monitoring tools.

Figure 3.
Biomonitoring aquatic pollution by utilizing either indigenous macroorganisms or microorganisms which are affected by the presence of pollutants.
Figure 3.
Biomonitoring aquatic pollution by utilizing either indigenous macroorganisms or microorganisms which are affected by the presence of pollutants.

Figure 4.
DGGE application in bacterial community study where the fingerprint of each sample is determined by the separation of the amplified partial 16S rDNA of equal length, whereby the different sequences are further resolved based on the gradient of denaturants from low to high concentration. This process might take several repetitions to get the best quality of the selected dominant sequences and overall can be quite laborious.


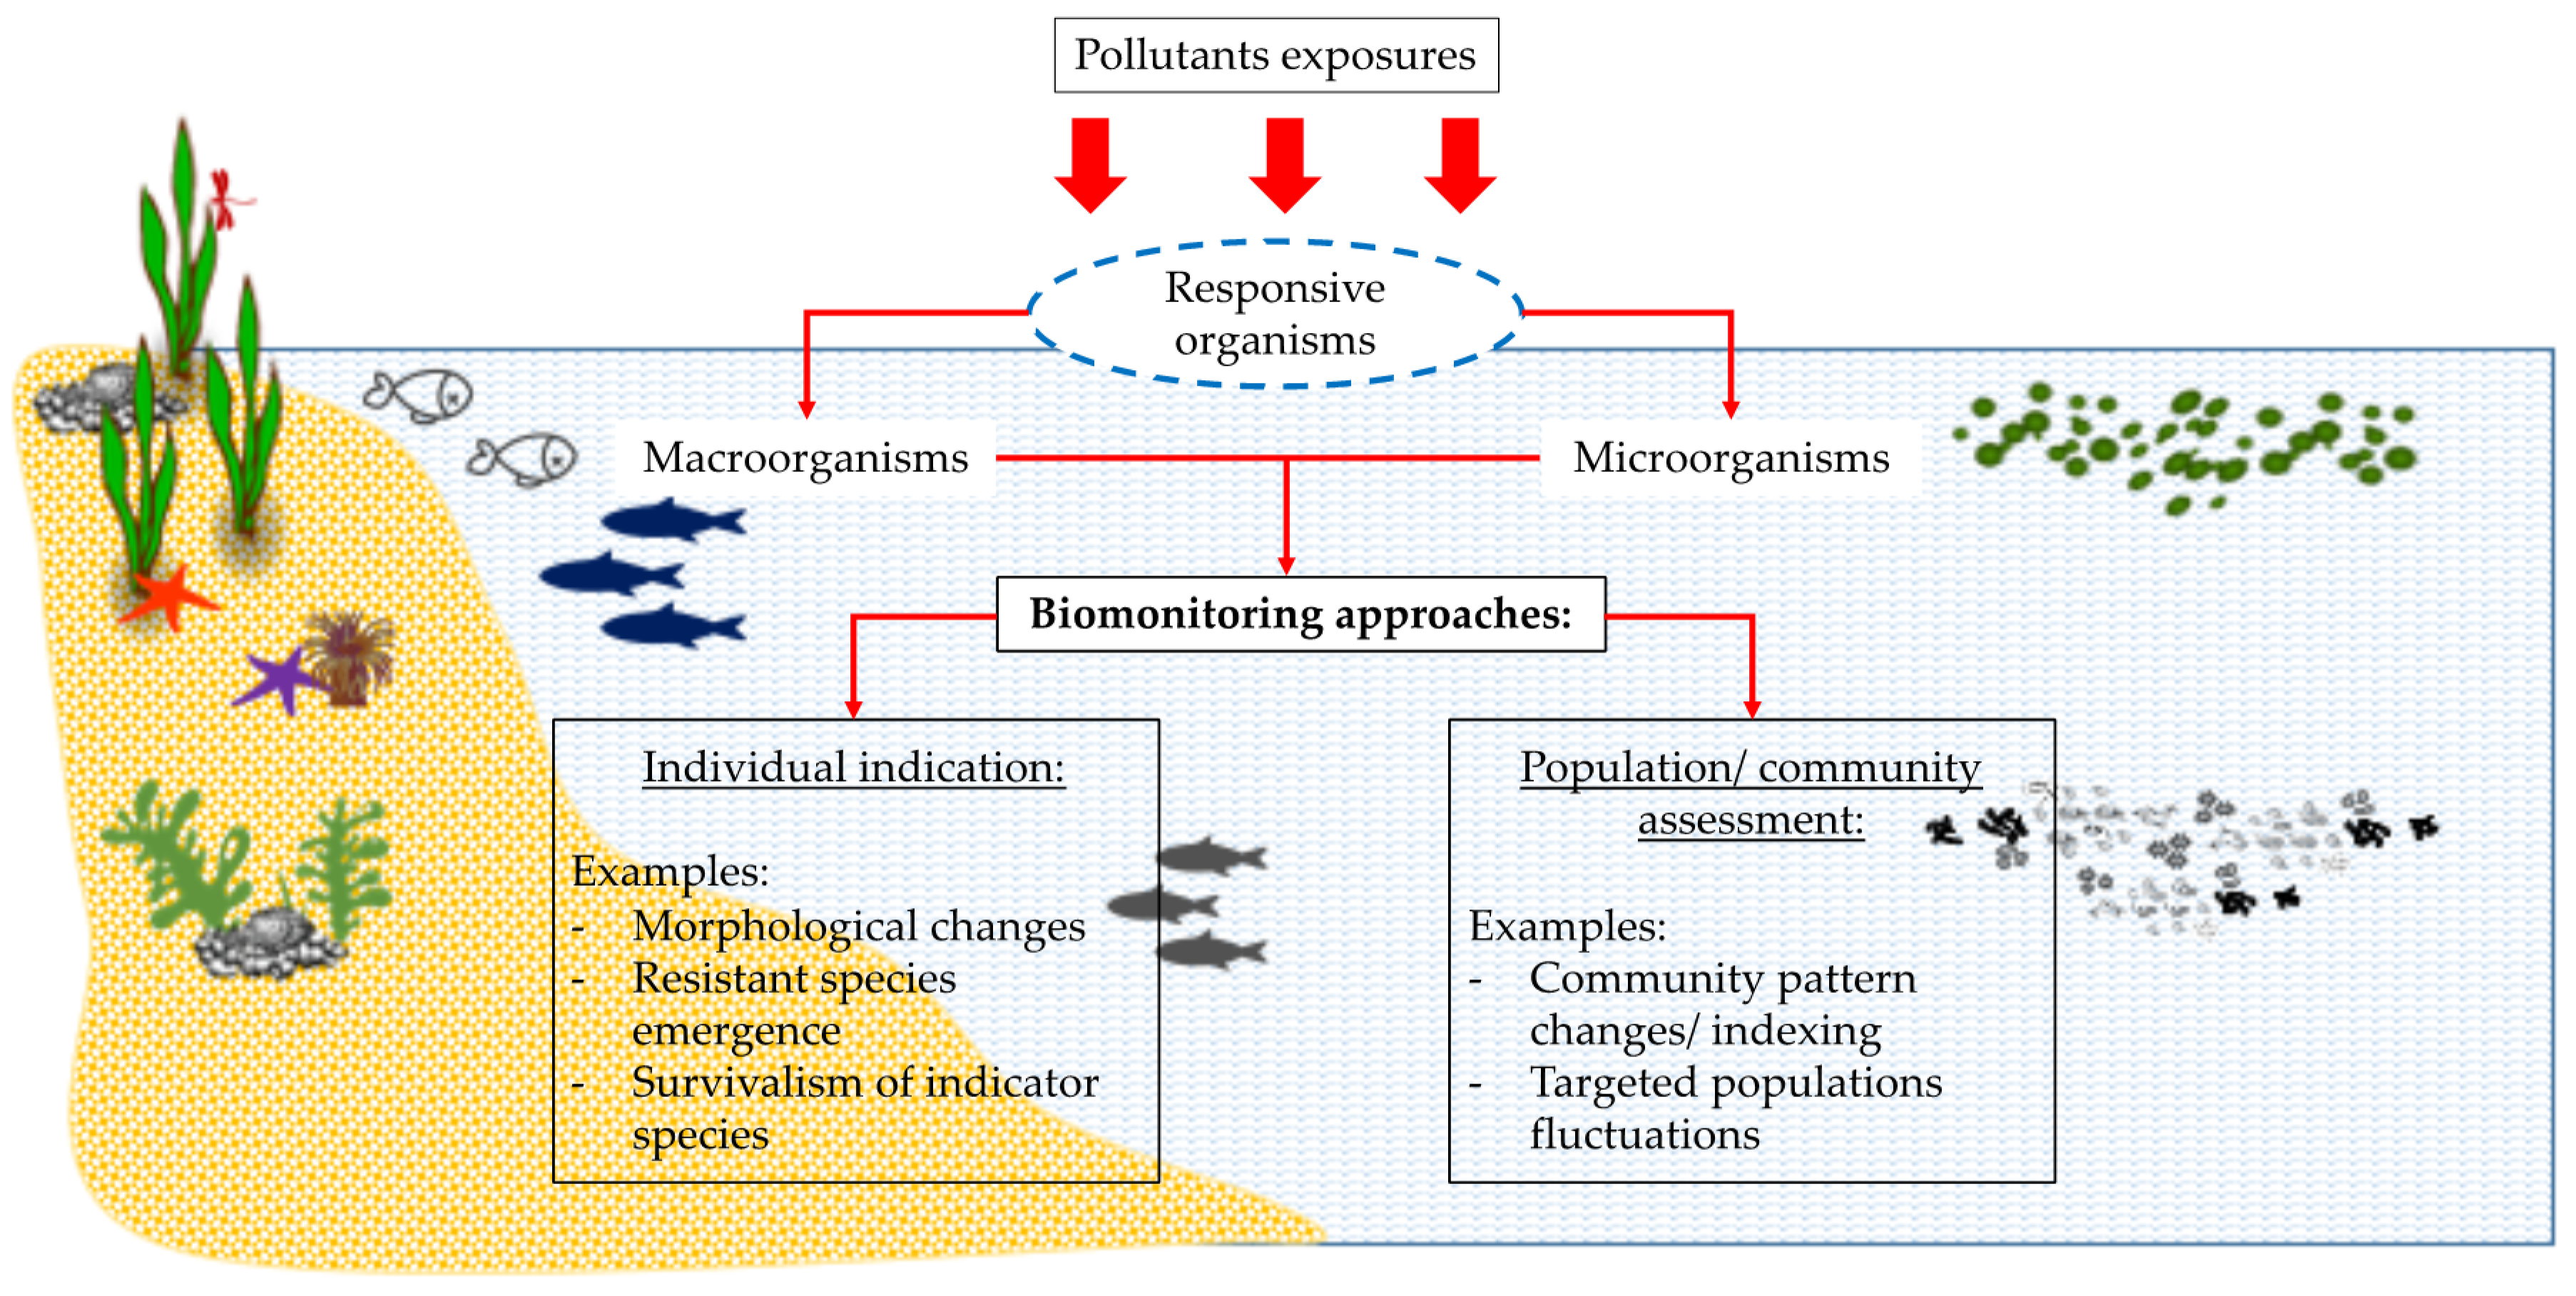
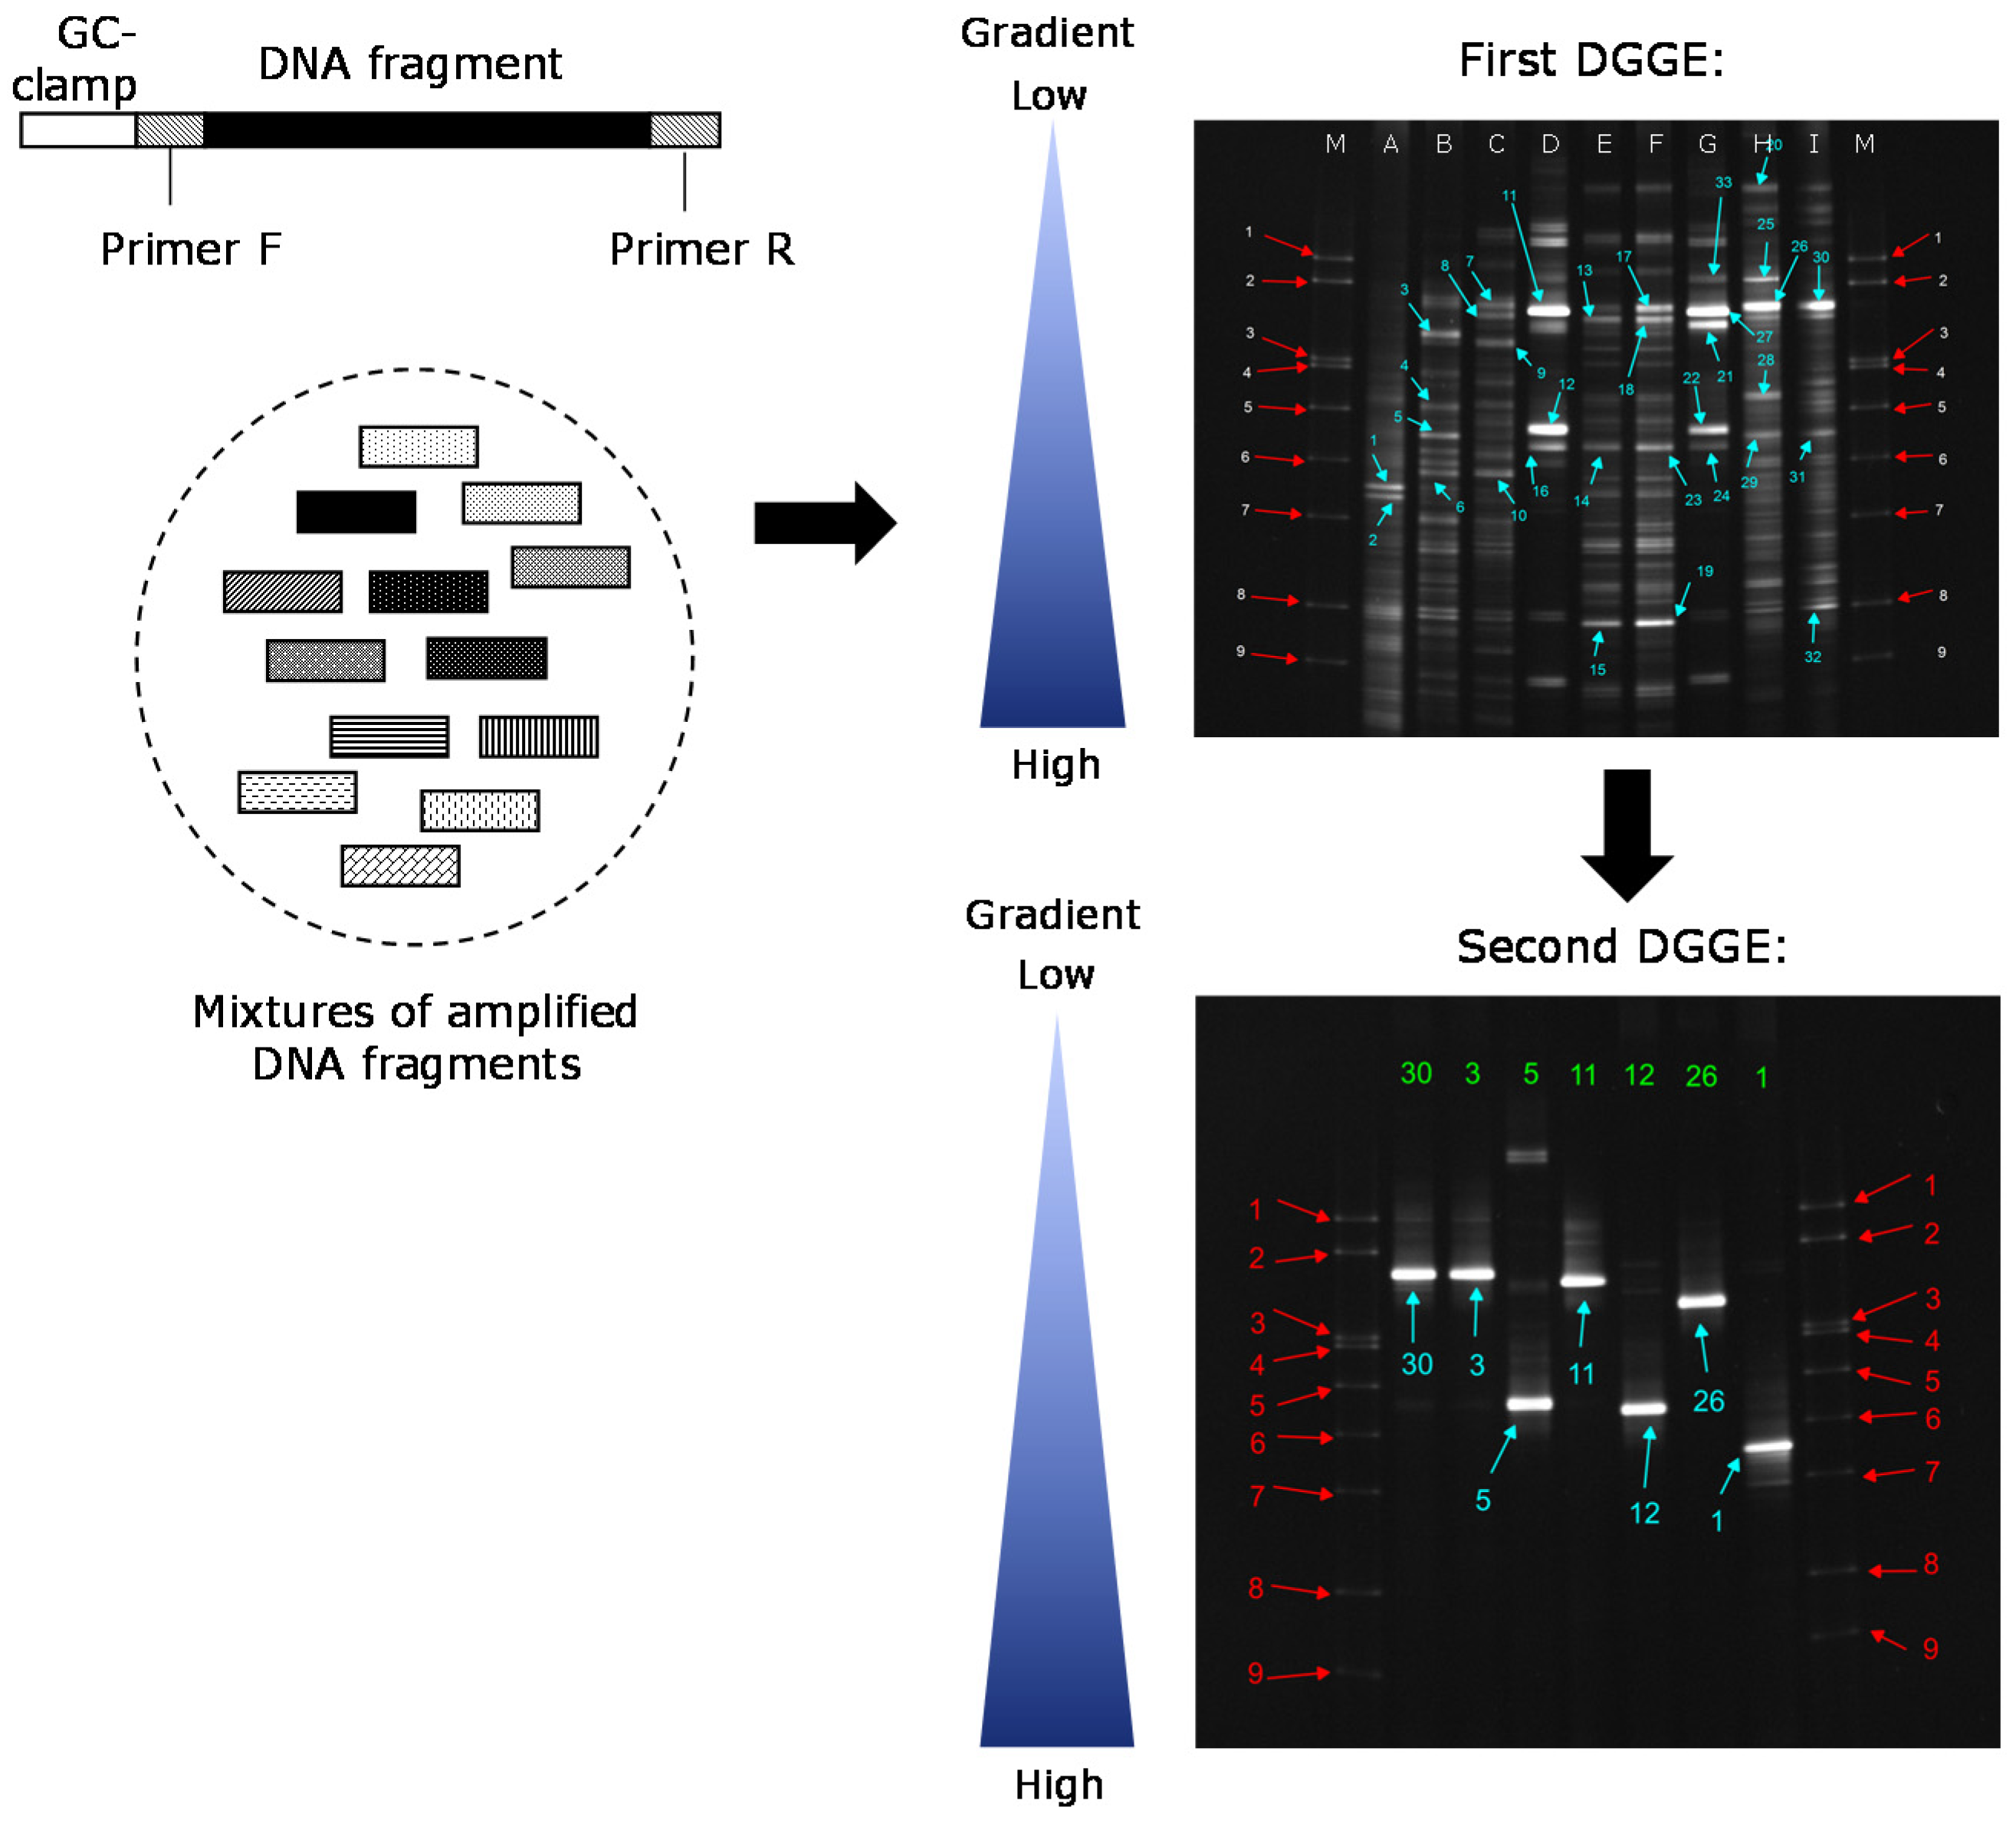
Table 1.
Water quality classification according to different Water Quality Index (WQI) methods.
| NSFWQI [25] | CCME WQI [26] | OWQI [27] | MMWQI [19] | ||||
|---|---|---|---|---|---|---|---|
| 91–100 | Excellent | 95–100 | Excellent | 90–100 | Excellent | 90–100 | Excellent |
| 71–90 | Good | 80–94 | Good | 85–89 | Good | 80–89 | Good |
| 51–70 | Medium | 60–79 | Fair | 80–84 | Fair | 50–79 | Moderate |
| 26–50 | Bad | 45–59 | Marginal | 60–79 | Poor | 0–49 | Poor |
| 0–25 | Very bad | 0–44 | Poor | 0–59 | Very poor | ||
Notes: NSFWQI–National Sanitation Foundation Water Quality Index; CCME WQI–Canadian Council of Ministers of the Environment Water Quality Index; OWQI–Oregon Water Quality Index; MMWQI–Malaysian Marine Water Quality Index; DOE–Department of Environment.
Table 2.
Physicochemical properties of various industrial effluents and polluting wastewaters.
| (a) Industrial Wastewaters | |||||||
| * Parameters | Rubber Effluent [32] | Paper Mill Effluent [33] | Textile Effluent [34] | Raw Palm Oil Mill Effluent; POME [35] | Pharmaceutical Industry Wastewater [36] | ||
| pH | 5.7 ± 0.3 | 5.6–5.8 | 8.3–9.5 | 3.4–5.2 | 9.79 | ||
| BOD | 1340 ± 2.0 | 5279 | 137 | 10,250–43,750 | 586.07 | ||
| COD | 2834 ± 1.9 | 9507 | 278–736 | 15,000–100,000 | 1458.03 | ||
| TSS | 3512 ± 4.8 | 1747 | 85–354 | 5000–54,000 | - | ||
| TS | - | - | - | - | 407.67 | ||
| TFS | - | - | - | - | 162.67 | ||
| TVS | - | - | - | - | 384 | ||
| (b) Domestic Wastewater | |||||||
| * Parameters | Domestic Sewage [36] | Hospital Liquid Effluent [37] | Greywater [38] | ||||
| Dish Washer | Laundry | Kitchen | |||||
| pH | 7.6 | 7.45–8.85 | 10 ± 0.2 | 8.3 ± 0.8 | 6.9 ± 0.4 | ||
| EC (μS/cm) | - | 152–350 | 2199 ± 753 | 653 ± 423 | 449 ± 341 | ||
| BOD | 600 | 255–850 | 184.6 ± 24 | 1363 ± 950 | 831 ± 358 | ||
| COD | 1006.42 | 455–879 | 411 ± 59 | 2072 ± 1401 | 1119 ± 476 | ||
| TSS | - | 420–640 | 11 ± 1.3 | 169 ± 96 | 319 ± 209 | ||
| VSS | - | - | 10 ± 0.5 | 139 ± 90 | 314 ± 205 | ||
| TS | 888 | - | 2535 ± 1053 | 1085 ± 608 | 883 ± 426 | ||
| TFS | 504 | - | - | - | - | ||
| TVS | 245 | - | - | - | - | ||
| NH4 + | - | 7–47.9 | - | - | - | ||
| NH4+-N | - | - | 0.11 ± 0.07 | 1.4 ± 1.1 | 0.20 ± 0.26 | ||
| NO2– | - | 2.1–4.2 | - | - | - | ||
| NO3– | - | 23.9–56.7 | - | - | - | ||
| NO3––N | - | - | 0.44 ± 0.06 | 0.68 ± 0.53 | 1.1 ± 1.2 | ||
| NO2––N (μg/L) | - | - | 0.05 ± 0.01 | 75 ± 56 | 20 ± 17 | ||
| TN | - | - | <0.5 | 6.2 ± 5.3 | 6.5 ± 5.0 | ||
| TP | - | - | 187 ± 51 | 1.2 ± 0.81 | 2.7 ± 3.1 | ||
| PO4–P | - | - | <0.05 | 0.22 ± 0.66 | 1.5 ± 2.8 | ||
| (c) Agricultural Wastewater and Stormwater Runoffs | |||||||
| * Parameters | Agricultural Wastewaters | Stormwater Runoffs [39] | |||||
| Degraded Agricultural Watershed [40] | Swine Wastewater [41] | Catfish Pond Water [42] | Aqua-Culture Wastewater [43] | Rooftop runoff | Road Runoff in Residen-tial Area | Main Traffic Road Run-off | |
| pH | - | 6.5–9 | 6.86 ± 0.06 | - | - | - | - |
| EC (mS/cm) | - | 1.25–5.58 | 2.92 ± 1.1 | - | - | - | - |
| DO | 7.91 ± 0.61 | 4.14–7.64 | 7.50 ± 1.10 | 2.45 ± 0.13 | - | - | - |
| BOD | - | 163–3550 | 1.82 ± 0.12 | - | - | - | - |
| COD | - | 210–9400 | - | 66.6 ± 6.44 | 346.92 ± 241.88 | 561.75 ± 719.30 | 570.70 ± 489.41 |
| TSS | 21.13 ± 28.41 | - | 486.20 ± 11.60 | - | 43.07 ± 31.78 | 286.94 ± 187.96 | 373.77 ± 186.23 |
| TDS | - | 770–648 | 602.60 ± 15. 80 | - | - | - | - |
| NTU | 29.66 ± 24.5 | 0.21–3.65 | 112.5 ± 4.6 | - | - | - | - |
| ISS | 15.14 ± 23.31 | - | - | - | - | - | - |
| NH4+-N | - | - | - | 2.35 ± 0.56 | 23.88 ± 17.24 | 21.44 ± 22.48 | 15.29 ± 10.04 |
| NO3––N | - | - | - | 0.51 ± 0.013 | 19.06 ± 12.49 | 11.41 ± 10.58 | 9.94 ± 6.98 |
| NO2––N | - | - | - | 0.134 ± 0.03 | - | - | - |
| TN | 0.30 ± 0.32 | - | - | 3.60 ± 1.31 | - | - | - |
| TP | 0.09 ± 85.25 | - | - | 0.23 ± 0.047 | 0.11 ± 0.11 | 1.23 ± 1.73 | 0.16 ± 0.20 |
| PO43− | - | 55–1680 | 1.34 ± 0.05 | - | - | - | - |
| NO3 | - | 37–2730 | 2.32 ± 0.09 | - | - | - | - |
| NO2 | - | 50–1427 | - | - | - | - | - |
| Chloride | - | - | 24.75 ± 1.21 | - | - | - | - |
| Alkalinity | - | - | 101.12 ± 2.12 | - | - | - | - |
| Cu | - | - | - | - | 0.05 ± 0.06 | 0.15 ± 0.24 | 0.09 ± 0.10 |
| Fe | - | - | - | - | 0.22 ± 0.36 | 0.09 ± 0.08 | 0.11 ± 0.26 |
| Mn | - | - | - | - | 0.20 ± 0.33 | 0.16 ± 0.17 | 0.14 ± 0.12 |
| Zn | - | - | - | - | 4.40 ± 7.52 | 0.11 ± 0.05 | 0.06 ± 0.05 |
| Pb | - | - | - | - | 0.03 ± 0.03 | 0.01 ± 0.01 | 0.01 ± 0.02 |
* Units are in mg L−1 except pH; EC (μS/cm) and NO2–N (μg/L). Note: BOD: Biological oxygen demand; COD: Chemical oxygen demand; DO: Dissolved oxygen; EC: Conductivity; ISS: Inorganic suspended solids; NTU: Turbidity; TDS: Total dissolved solid; TFS: Total fixed solid; TN: Total nitrogen; TP: Total phosphorus; TS: Total solid; TSS: Total suspended solids; TVS: Total volatile solid; VSS: Volatile suspended solid.
Table 3.
Biomonitoring applications in aquatic environment.
| Bioindicator(s) | Applications | Site of Study | References | |
|---|---|---|---|---|
| Plants (Macrophytes) | Lactuca sativa | Heavy metals in industrial effluent Polycontaminated industrial effluents | Decontamination stations’ outlet of companies in Franche-Comte’, France | [76,77] |
| Oenanthe sp., Juncus sp., Typha sp., Callitriche sp. 1, Callitriche sp. 2 | Cd, Cr, Cu, Ni, Pb, Zn, and As | Storm water runoff in detention pond, northeast of Nantes, France | [78] | |
| Seagrasses: Zostera muelleri, Zostera nigricaulis, Ruppia megacarpa | As, Cd, Cu, Pb, Se, and Zn | Derwent estuary in Tasmania, Australia | [79] | |
| Typha latifolia (broadleaf cattail) | Trace metals (Cd, Cu, Fe, Mn, Ni, Pb, and Zn) from various types of pollutions | Different types of surface water resources in Greater Poland, upper and lower Silesia, Poland, Europe | [80] | |
| Macroalgae | Red: Gracillaria sp., Pyropia columbina, Porphyra lucassi, Grateloupia turuturu Brown: Scytopsiphon lomentaria, Ecklonia radiata, Undaria pinnatifida Green: Ulva australis, Ulva compressa | As, Cd, Cu, Pb, Se, and Zn | Derwent estuary in Tasmania, Australia | [79] |
| Vertebrate | Pomatoschistus microps larvae | Nitrogen contamination in estuarine ecosystem | Minho and Lima estuaries in Portugal | [81] |
| Oreochromis niloticus | Metals (Cu, Zn, Mn, Cd, Pb, and Fe) | River Nile, Egypt | [82] | |
| Transgenic zebrafish | Hazardous metal pollution in fresh water (Lab scale experiment) | National Taiwan University, Taipei, Taiwan | [83] | |
| Invertebrate | Lamellidens marginalis | Heavy metals: Cr, Mn, Co, Ni, Cu, Zn, Se, As, Sr, Cd, Sn, Sb, Hg, and Pb | Dhimbe reservoir, Maharashtra, India | [84] |
| Adult Odonata (dragonfly) | Monitoring urbanization impact on aquatic environment | Urban streams of Manaus, Amazonas, Brazil | [85] | |
| Mytilus spp. | Microplastic pollution monitoring | Along Norwegian coast, Europe | [86] | |
| Porifera Hymeniacidon perlevis sponge | Cu, Zn, and the hydrocarbon fluoranthene | Along Normandy coast, France | [87] | |
| Nematodes community index | River water polluted by industrial, agricultural and sewage effluents | Beigang River, Taiwan | [88] | |
| Plankton | Marine diatom: (Thalassiosira weissflogii) Estuarine copepod: (Acartia tonsa, Acartia tonsa nauplii) | Cu in pesticide- monitoring in aquatic system | Mondego valley, Figueira da Foz, Portugal | [89] |
| Zooplanktons Chironomus, Oligochaete | Monitoring anthropogenic nitrogen impact on aquatic ecosystem | Lake Nanhu in Wuhan, Hubei Province, China | [90] | |
| Daphnia longispina | S-metolachlor of pesticide- monitoring in aquatic system (lab scale experiment) | Aveiro, Portugal | [91] | |
| Virus | Pepper mild mottle virus (PMMoV), human picobirna-viruses (hPBV), Torque teno virus (TTV) | Human fecal pollution in river | Along Ruhr and Rhine rivers in the North Rhine Westphalia region, Germany | [92] |
| Bacteria | Fecal indicator bacteria (Enterococcus) | Sewage-contaminated groundwater | Avalon Beach, California, USA | [93] |
| Bacteroidales-based biomarkers | Human and livestock wastes | Karst regions in Illinois, Wisconsin, Kentucky, Missouri, USA | [94] | |
| Chromatiaceae, Alcaligenaceae | Palm oil mill effluent (POME) final discharge | River water (approximately 3 km from palm oil mill), Malaysia | [95] | |
| Clostridia, Epsilonproteobacteria | Paper mill effluent | Daling River, Northeast China | [73] | |
| Cupriavidusgilardii, Ralstoniapickettii | Heavy metals (Cu, Zn, Fe and Ni) | Cataño, Puerto Rico | [96] | |
| Bifidobacterium spp. | Point source pollution monitoring such as from agricultural, recreation and water supply | Nanshih River, Taiwan | [44] |
Table 4.
Metagenomics application of Illumina platform for microbial community assessment in wastewaters and polluted rivers.
Table 4.
Metagenomics application of Illumina platform for microbial community assessment in wastewaters and polluted rivers.
| Illumina Platform/Sequencer | Applications | References |
|---|---|---|
| Illumina HiSeq 2000 | Metagenomic analyses of microbial community pattern in an anaerobic digestion sludge of a full-scale municipal wastewater treatment plant (WWTP). | [147] |
| Illumina HiSeq | Profiling of bacterial community changes in downstream as compared to upstream sections of a river receiving untreated domestic wastewater discharge. | [148] |
| Illumina HiSeq 2500 | Characterization of bacterial community patterns due to seasonal changes in anthropogenically disturbed rivers. | [149] |
| Illumina HiSeq 2500 | Analysis of structures and functions of river water and sediment microbial community during aerobic and anaerobic conditions of endocrine disruptor (17β-estradiol) biodegradation. | [150] |
| Illumina MiSeq | Determination of potential bioindicator from bacterial community obtained from a palm oil mill effluent (POME) treatment system and the receiving waterway. | [95] |
| Illumina MiSeq | Determination of pathogenic bacteria within the bacterial community utilizable for risk assessment of urban surface water. | [151] |
| Illumina MiSeq | A study on the impact of surface water introduction on the microbial community diversity and function within a spring pool in a cave influenced by seasonal changes factor. | [152] |
| Illumina MiSeq | Assessment of the unique presence of targeted bacterial indicator (Alcaligenaceae and Chromatiaceae) within the microbial community in POME final discharge polluted rivers as compared to other non-POME polluted streams. | [153] |
Table 5.
The applications of metatranscriptomic sequencing on microbial communities in wastewater and water ecosystem.
Table 5.
The applications of metatranscriptomic sequencing on microbial communities in wastewater and water ecosystem.
| Sample | Site | Platform | Reference |
|---|---|---|---|
| Activated sludge | Wastewater Treatment Plant (WWTP), Hong Kong | Illumina Hi-Seq2000 | [185] |
| Wastewater wet oxidation effluents | Rovereto, Italy | Illumina Hi-Seq2000 | [179] |
| Deep seafloor sediment | Gulf of Mexico | Illumina Hi-Seq2500 | [186] |
| Deep seawater | Northeast Pacific Ocean | Roche GS FLX Titanium chemistry pyrosequencing | [187] |
| River water | Amazon River, South America | Illumina Hi-Seq2500 | [188] |
| River and seawater | Columbia River, estuary and plume | Illumina Hi-Seq1000 | [189] |
| Biofilm | Tamagawa River, Japan | Illumina MiSeq | [190] |
Publisher’s Note: MDPI stays neutral with regard to jurisdictional claims in published maps and institutional affiliations. |
© 2020 by the authors. Licensee MDPI, Basel, Switzerland. This article is an open access article distributed under the terms and conditions of the Creative Commons Attribution (CC BY) license (http://creativecommons.org/licenses/by/4.0/).
Share and Cite
MDPI and ACS Style
Zolkefli, N.; Sharuddin, S.S.; Yusoff, M.Z.M.; Hassan, M.A.; Maeda, T.; Ramli, N. A Review of Current and Emerging Approaches for Water Pollution Monitoring. Water 2020, 12, 3417. https://0-doi-org.brum.beds.ac.uk/10.3390/w12123417
AMA Style
Zolkefli N, Sharuddin SS, Yusoff MZM, Hassan MA, Maeda T, Ramli N. A Review of Current and Emerging Approaches for Water Pollution Monitoring. Water. 2020; 12(12):3417. https://0-doi-org.brum.beds.ac.uk/10.3390/w12123417
Chicago/Turabian StyleZolkefli, Nurhasliza, Siti Suhailah Sharuddin, Mohd Zulkhairi Mohd Yusoff, Mohd Ali Hassan, Toshinari Maeda, and Norhayati Ramli. 2020. "A Review of Current and Emerging Approaches for Water Pollution Monitoring" Water 12, no. 12: 3417. https://0-doi-org.brum.beds.ac.uk/10.3390/w12123417
Note that from the first issue of 2016, this journal uses article numbers instead of page numbers. See further details here.