Article

Accounting for Uncertainty and Reconstruction of Flooding Patterns Based on Multi-Satellite Imagery and Support Vector Machine Technique: A Case Study of Can Tho City, Vietnam

1
Department of Geography, National University of Singapore, Singapore 119228, Singapore
2
Institute of Water and Environmental Research, Thuyloi University, Ho Chi Minh City 70000, Vietnam
3
Geoinformatics & Remote Sensing Cell, West Bengal State Council of Science and Technology, Kolkata 700064, India
*
Author to whom correspondence should be addressed.
Submission received: 31 March 2020 / Revised: 20 May 2020 / Accepted: 25 May 2020 / Published: 28 May 2020
(This article belongs to the Special Issue Recent Advances in the Assessment of Flood Risk in Urban Areas)

Abstract

:
One of the most frequent natural perils affecting the world today is flooding, and over the years, flooding has caused a large loss of life and damage to property. Remote sensing technology and satellite imagery derived data are useful in mapping the inundated area, which is useful for flood risk management. In the current paper, commonly used satellite imagery from the public domain for flood inundated extent capturing are studied considering Can Tho City as a study area. The differences in the flood inundated areas from different satellite sensors and the possible reasons are explored. An effective and relatively advanced method to address the uncertainties—inundated area capture from different remote sensing sensors—was implemented while establishing the inundated area pattern between the years 2000 and 2018. This solution involves the usage of a machine learning technique, Support Vector Machine Regression (SVR) which further helps in filling the gaps whenever there is lack of data from a single satellite data source. This useful method could be extended to establish the inundated area patterns over the years in data-sparse regions and in areas where access is difficult. Furthermore, the method is economical, as freely available data are used for the purpose.

1. Introduction

Floods are one of the most frequent natural hazards affecting the world. Over the years, they have caused a large loss of life and damage to property [1,2]. Due to changing climates, it is observed that the magnitude and frequency of the floods are on the rise. In recent times, some of the events were severe enough to be termed as catastrophic [3]. Such events underlined the importance of estimating the flood risk and its management.
An important prerequisite for flood risk management is precise information on the real extent of inundation. There has been limited experience and recorded evidence available about the spatial extent of extreme floods. Traditional ground survey techniques have certain challenges, like a limited network of monitoring stations in some developing nations, inaccessibility of the area during floods, time consuming and laborious processes. [4,5]. In order to address these challenges of conventional surveys, remote sensing has emerged as an effective and efficient alternative technique. The ability of remote sensing data to provide a synoptic view of a large area has been found useful for identifying flood inundated areas [6]. It has become critical to use data derived from remote sensing technology along with hydrological models to better manage flooding risk [7].
With the increasing availability of satellite imagery data in the public domain, government agencies may use the remote sensing data for designing flood mitigation measures [8,9]. In the absence of reliable historical records, flood risk modelling helps us to look at possible extreme scenarios, while incorporating the changes in the flood risk profile with the help of remote sensing data [10,11,12,13,14]. Multilateral agencies such as the World Bank and the Asian Development Bank have used the results from flood risk assessments from time to time to explore various disaster risk transfer mechanisms [15,16].
The precise detection of dynamic changes in water levels and land cover change information to use for flood risk assessment depends on the spatial resolution of the image captured [17]. Various remote sensing products offer options in capturing the water boundaries over a large area at a certain point of time. Among them, high resolution satellite imagery data, such as Quickbird and WorldView images are available, but many of these data are not freely available [18]. Freely available optical imagery, such as Landsat Thematic Mapper (TM) and Enhanced Thematic Mapper (ETM+) can provide satellite imagery data at 30 m spatial resolution and an interval of 16 days. Archival records of satellite imagery data for more than three decades are available [19,20,21]. The longer-archived data and continual capture over the same areas makes the data very handy for mapping water bodies at a large regional scale for a variety of hydrological conditions. Band 7 data from Landsat is useful for distinguishing water bodies from surrounding land mass, with an error rate around 5%. There is another remote sensing satellite platform called Moderate Resolution Imaging Spectroradiometer (MODIS) (NASA, Washington, DC, USA) which includes two key instruments, Terra and Aqua satellites. Terra MODIS captures the imagery over the earth’s surface every one to two days, and acquires the data in 36 spectral bands [8,9,15]. While Landsat data have relatively higher spatial resolution compared to data from MODIS, the revisit time of the Landsat sensor is longer than the MODIS. Remotely sensed images captured from the Sentinel-2 A and B optical sensors, launched by the European Space Agency in 2014, were also used in the current study. The revisit time of the Sentinel-2 sensor is about 10 days and the spatial resolution is between 10 to 60 m [10,16].
The Support Vector Machine (SVM) has been earlier used for applications such as land cover classification [22] in Can Tho City. The Google Earth Engine (GEE) became available later, which provides access to data from multiple satellite sensors via a single platform and also facilitates image processing functions which were earlier carried out in specialized remote sensing software (such as ERDAS/ENVI). The potential of GEE for analyzing flooded areas from the study area (Can Tho City) has not been studied much and this paper sheds light onto this important area. It is critical that such methods are explored in data scarce regions in SE Asia. Furthermore, some of these urban regions (such as Can Tho City) have experienced high economic growth in the recent years due to infrastructure development and migration from neighboring rural areas. There has been a scarcity of historical flood information, such as inundated area from ground surveys. In addition to establishing a procedure to retrieve the available historical information from GEE platform, our paper also proposes the use of SVM Regression, a relevant machine learning technique to address the spatial and temporal uncertainties in such regions. We believe that our paper proposes an important and economical solution which can be extended to establish historical flooding patterns for many SE Asian regions where such information is lacking.
Flooded water can be delineated using image processing techniques [11,12] on different satellite images, in the midst of increasing cloud cover. In order to gain the maximum benefit from satellite images, it is important to combine information from different kinds of sources, so that problems with one method can be overcome by employing the other methods [13,14]. However, advances in machine learning allow us to combine data from different satellites, thus providing an important option to minimize uncertainties in data resulting from different spatial and temporal resolutions. Here, we hypothesize that the use of an advanced machine learning technique of Support Vector Machine Regression (SVR) can help identify the water-inundation areas over time when using satellite imagery with different spatio-temporal resolutions [23,24,25]. SVR also helps when incomplete data are available, thus enabling a more complete set of readings to be included into any further modelling. SVR can predict non-linear relationships and therefore used in the current context. The objective of this study is to minimize the uncertainties related to different spatial resolutions from different satellite platforms, by using SVR to reconstruct the flooding extents.
In this study, we used imagery from Landsat, MODIS and Sentinel-2 satellite sensors. These satellite platforms were chosen because of several reasons: 1) availability of data for long periods 2) data being available free of cost and 3) often two to three datasets would be available within the period from September to October (flooding season in Can Tho City) each year.

2. Materials and Methods
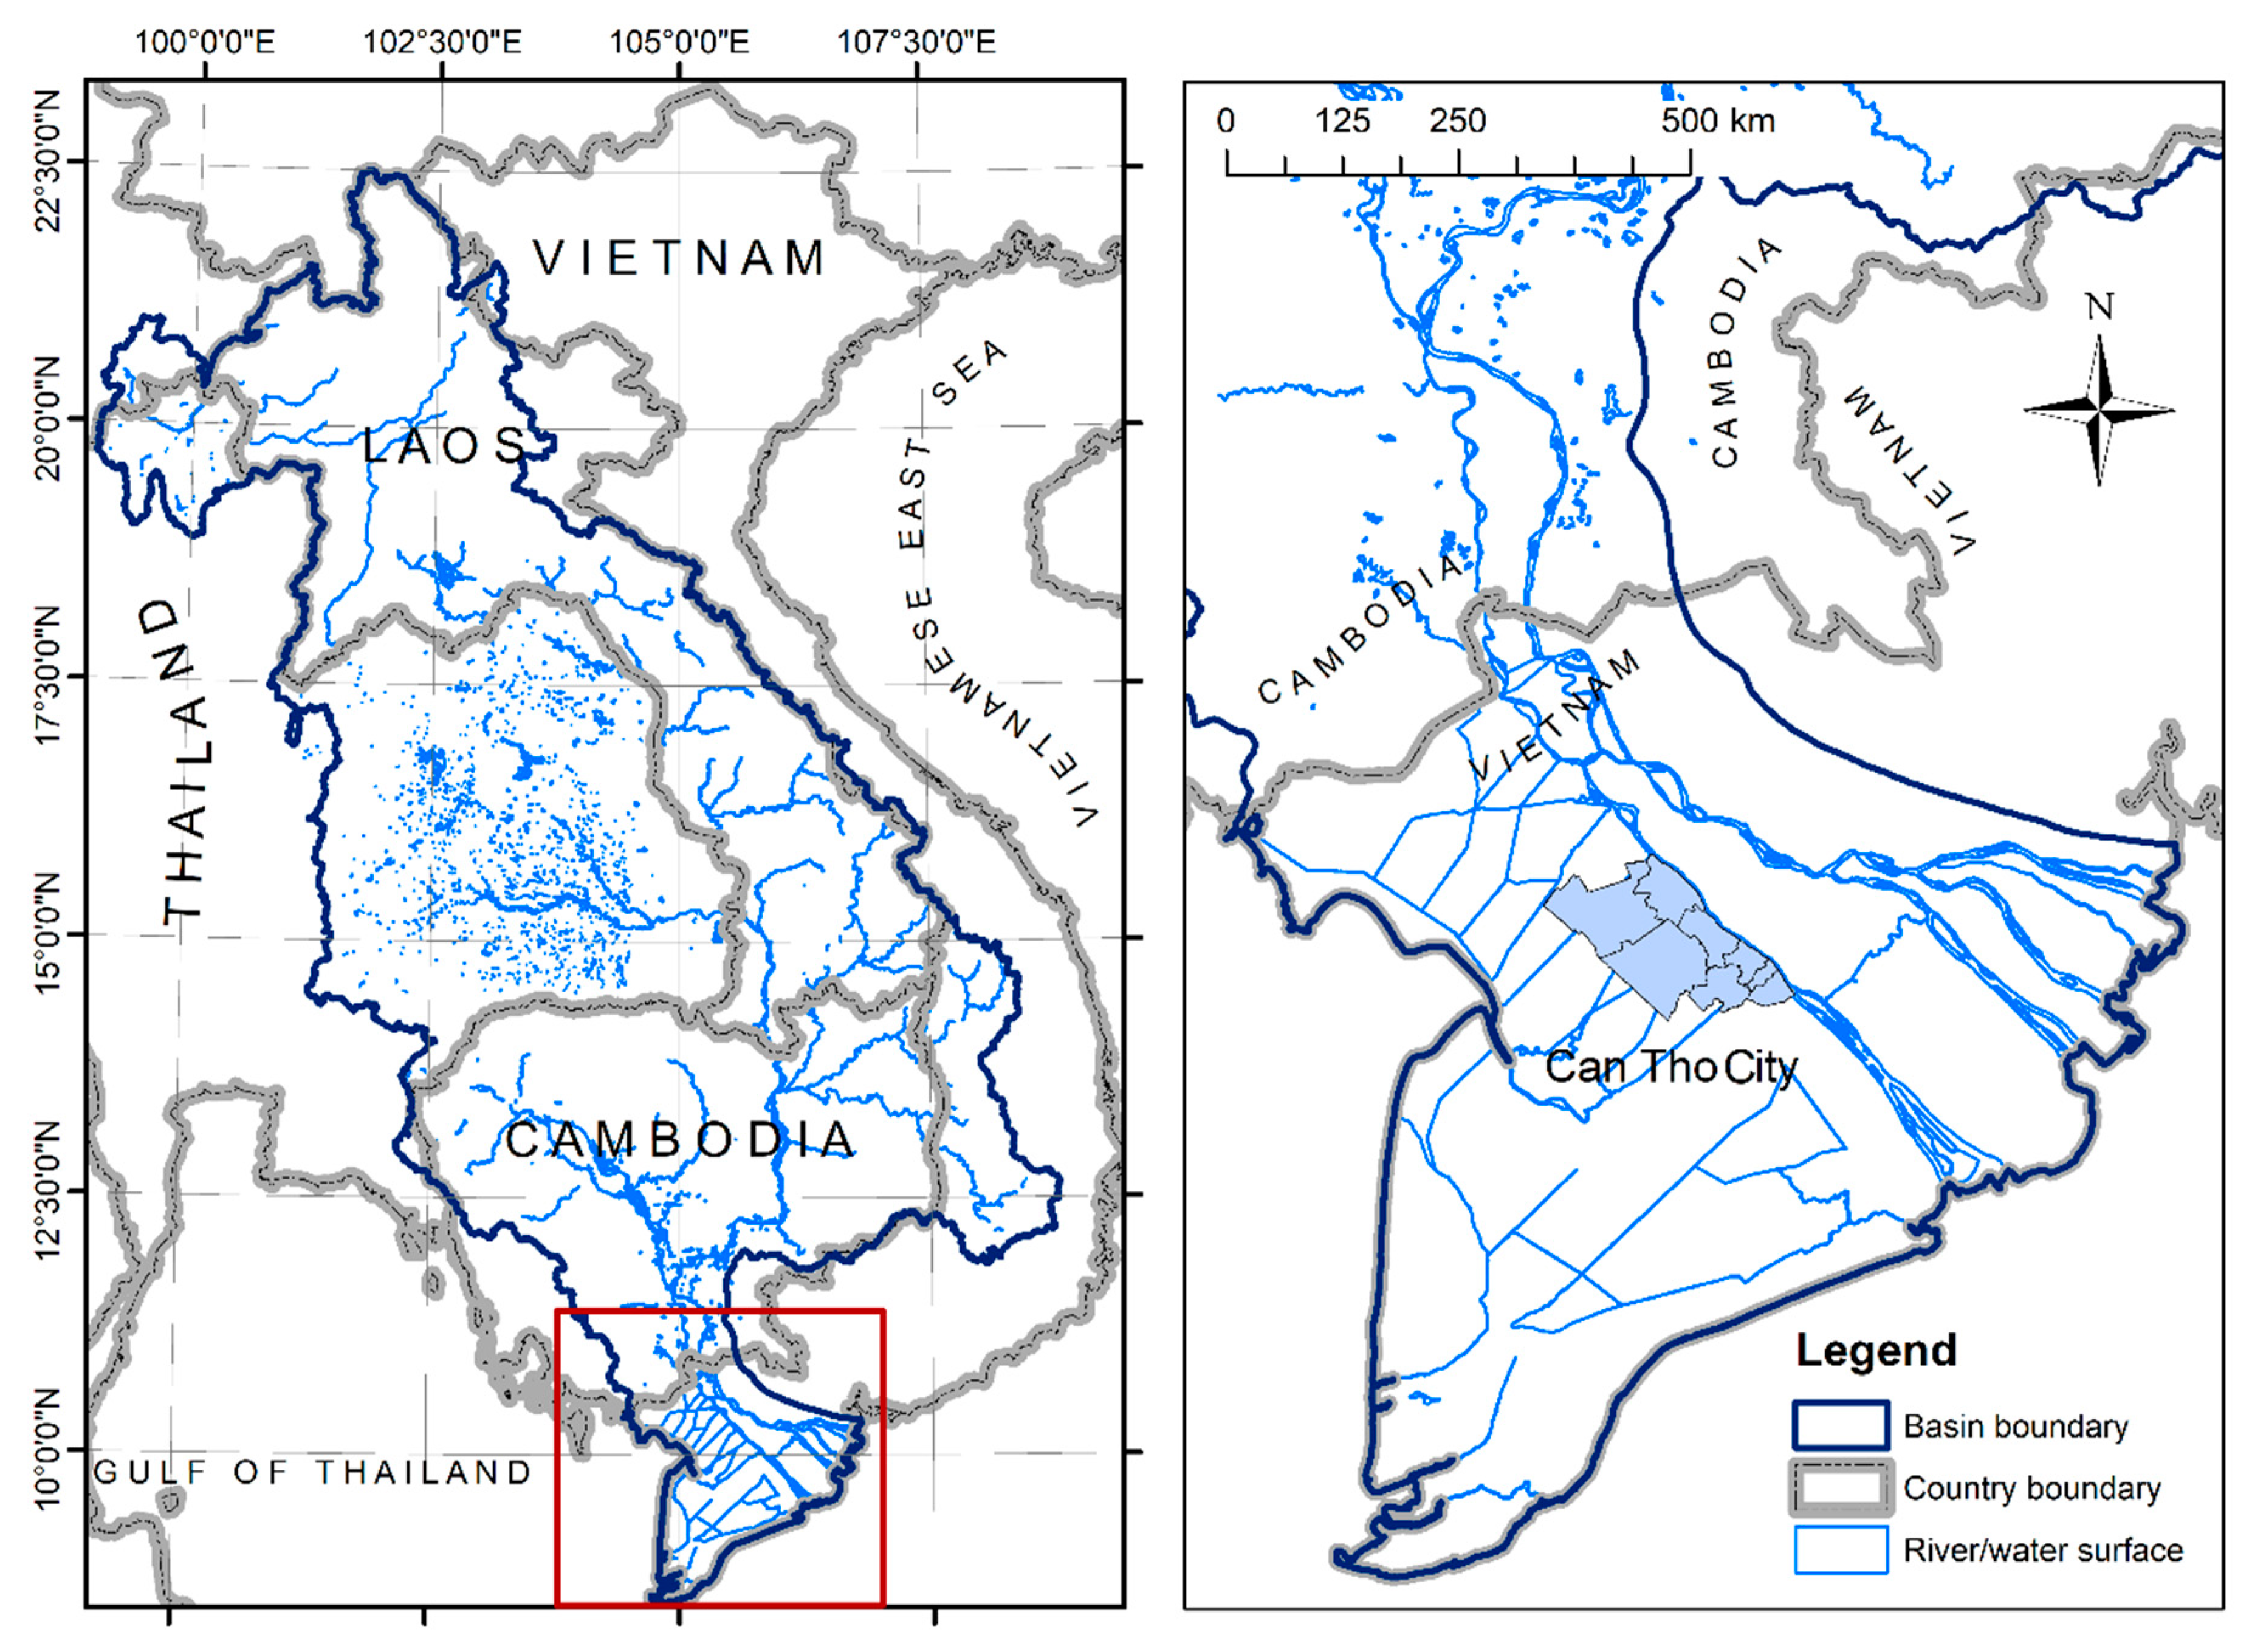
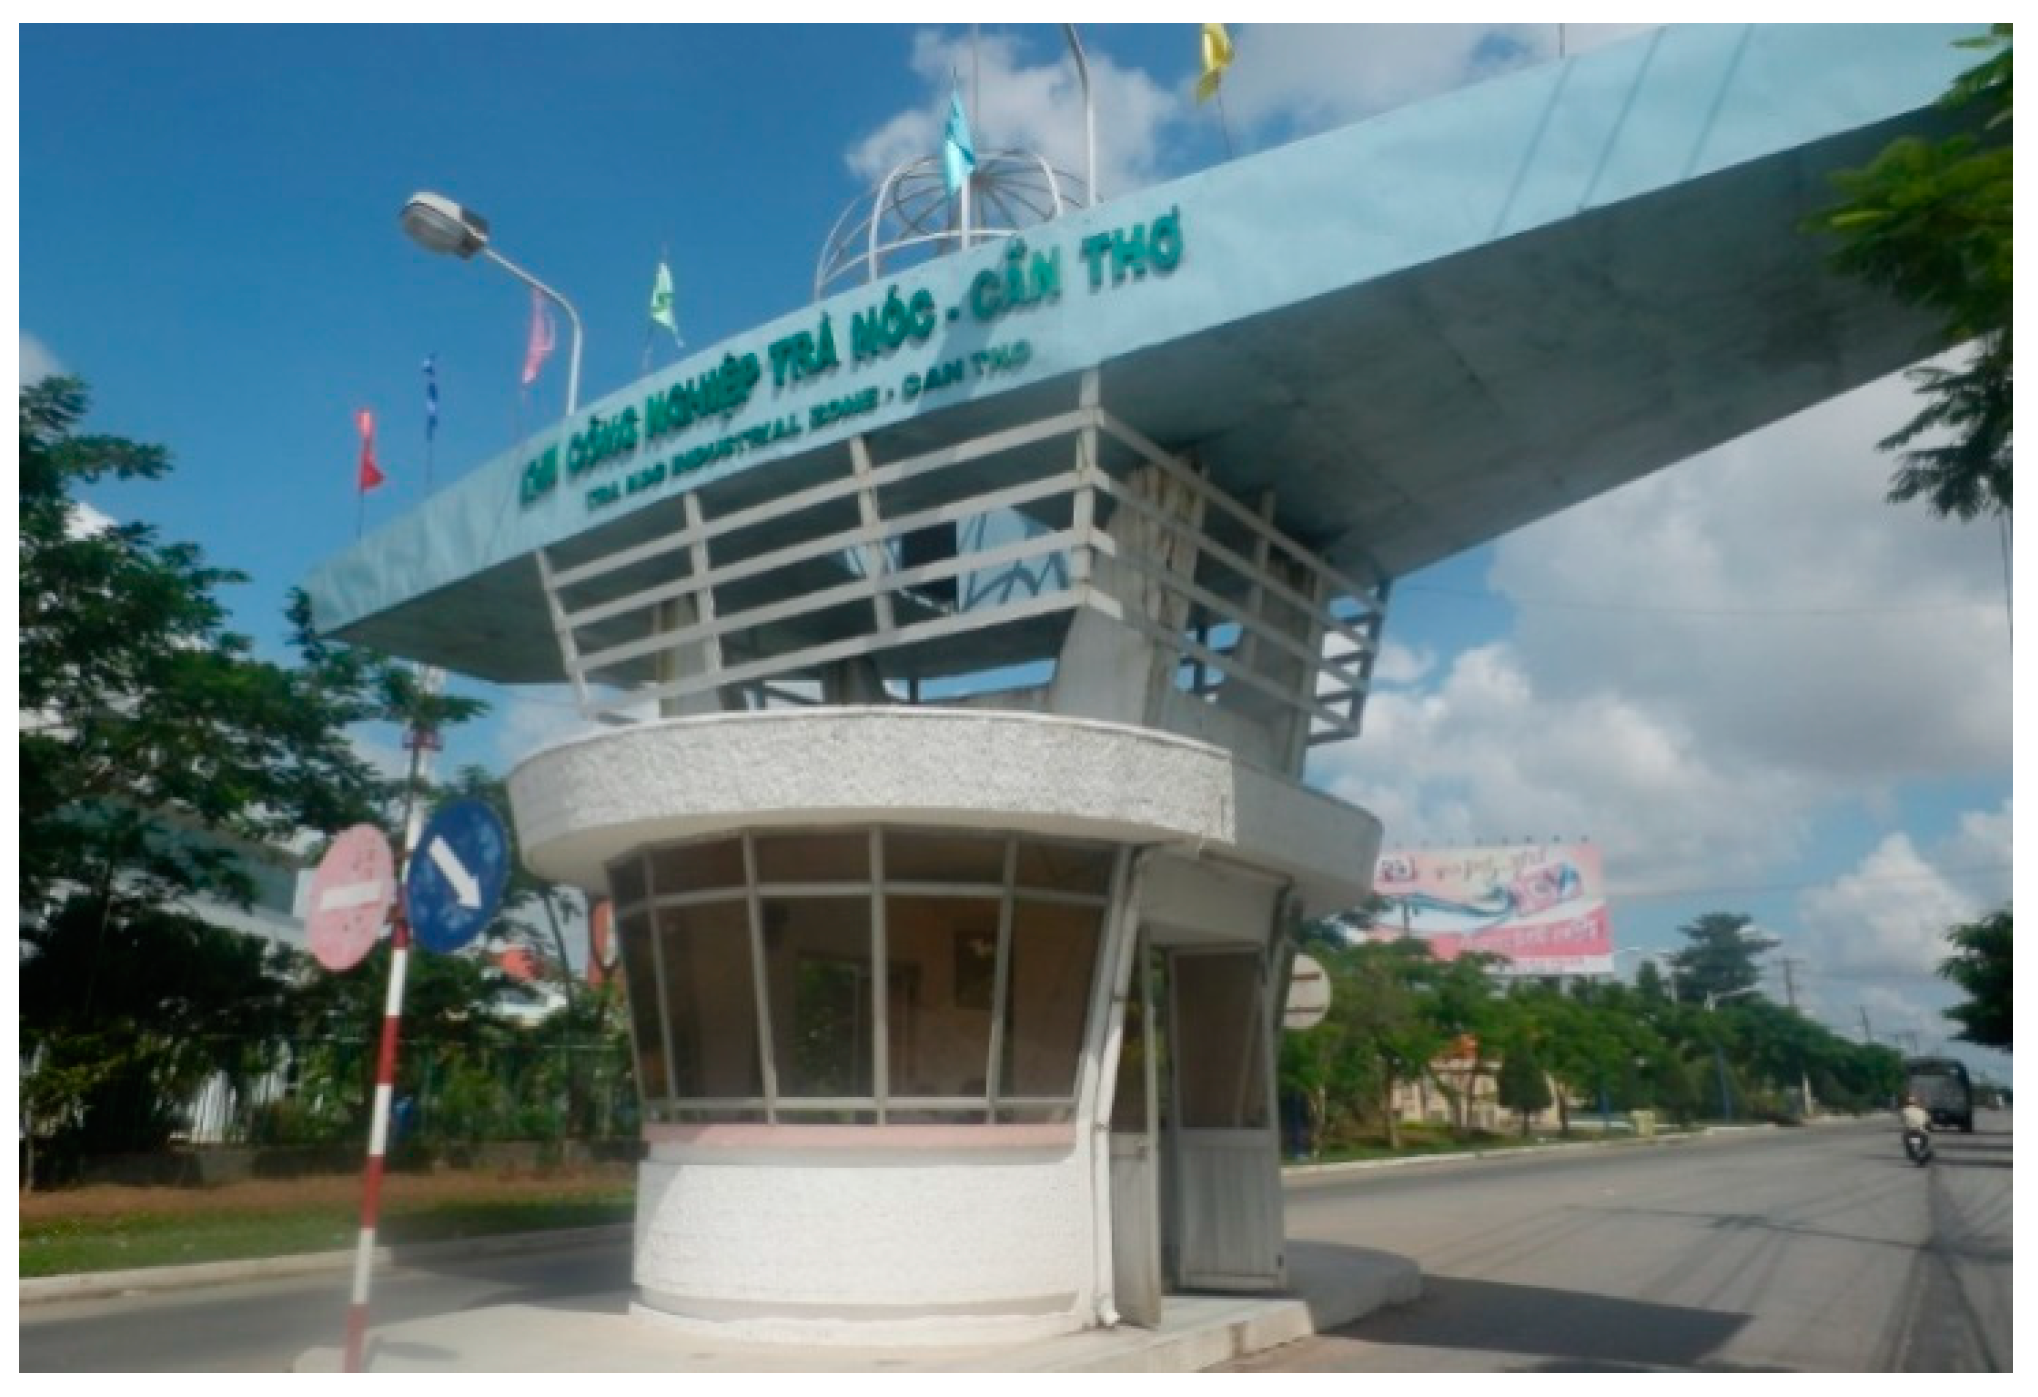
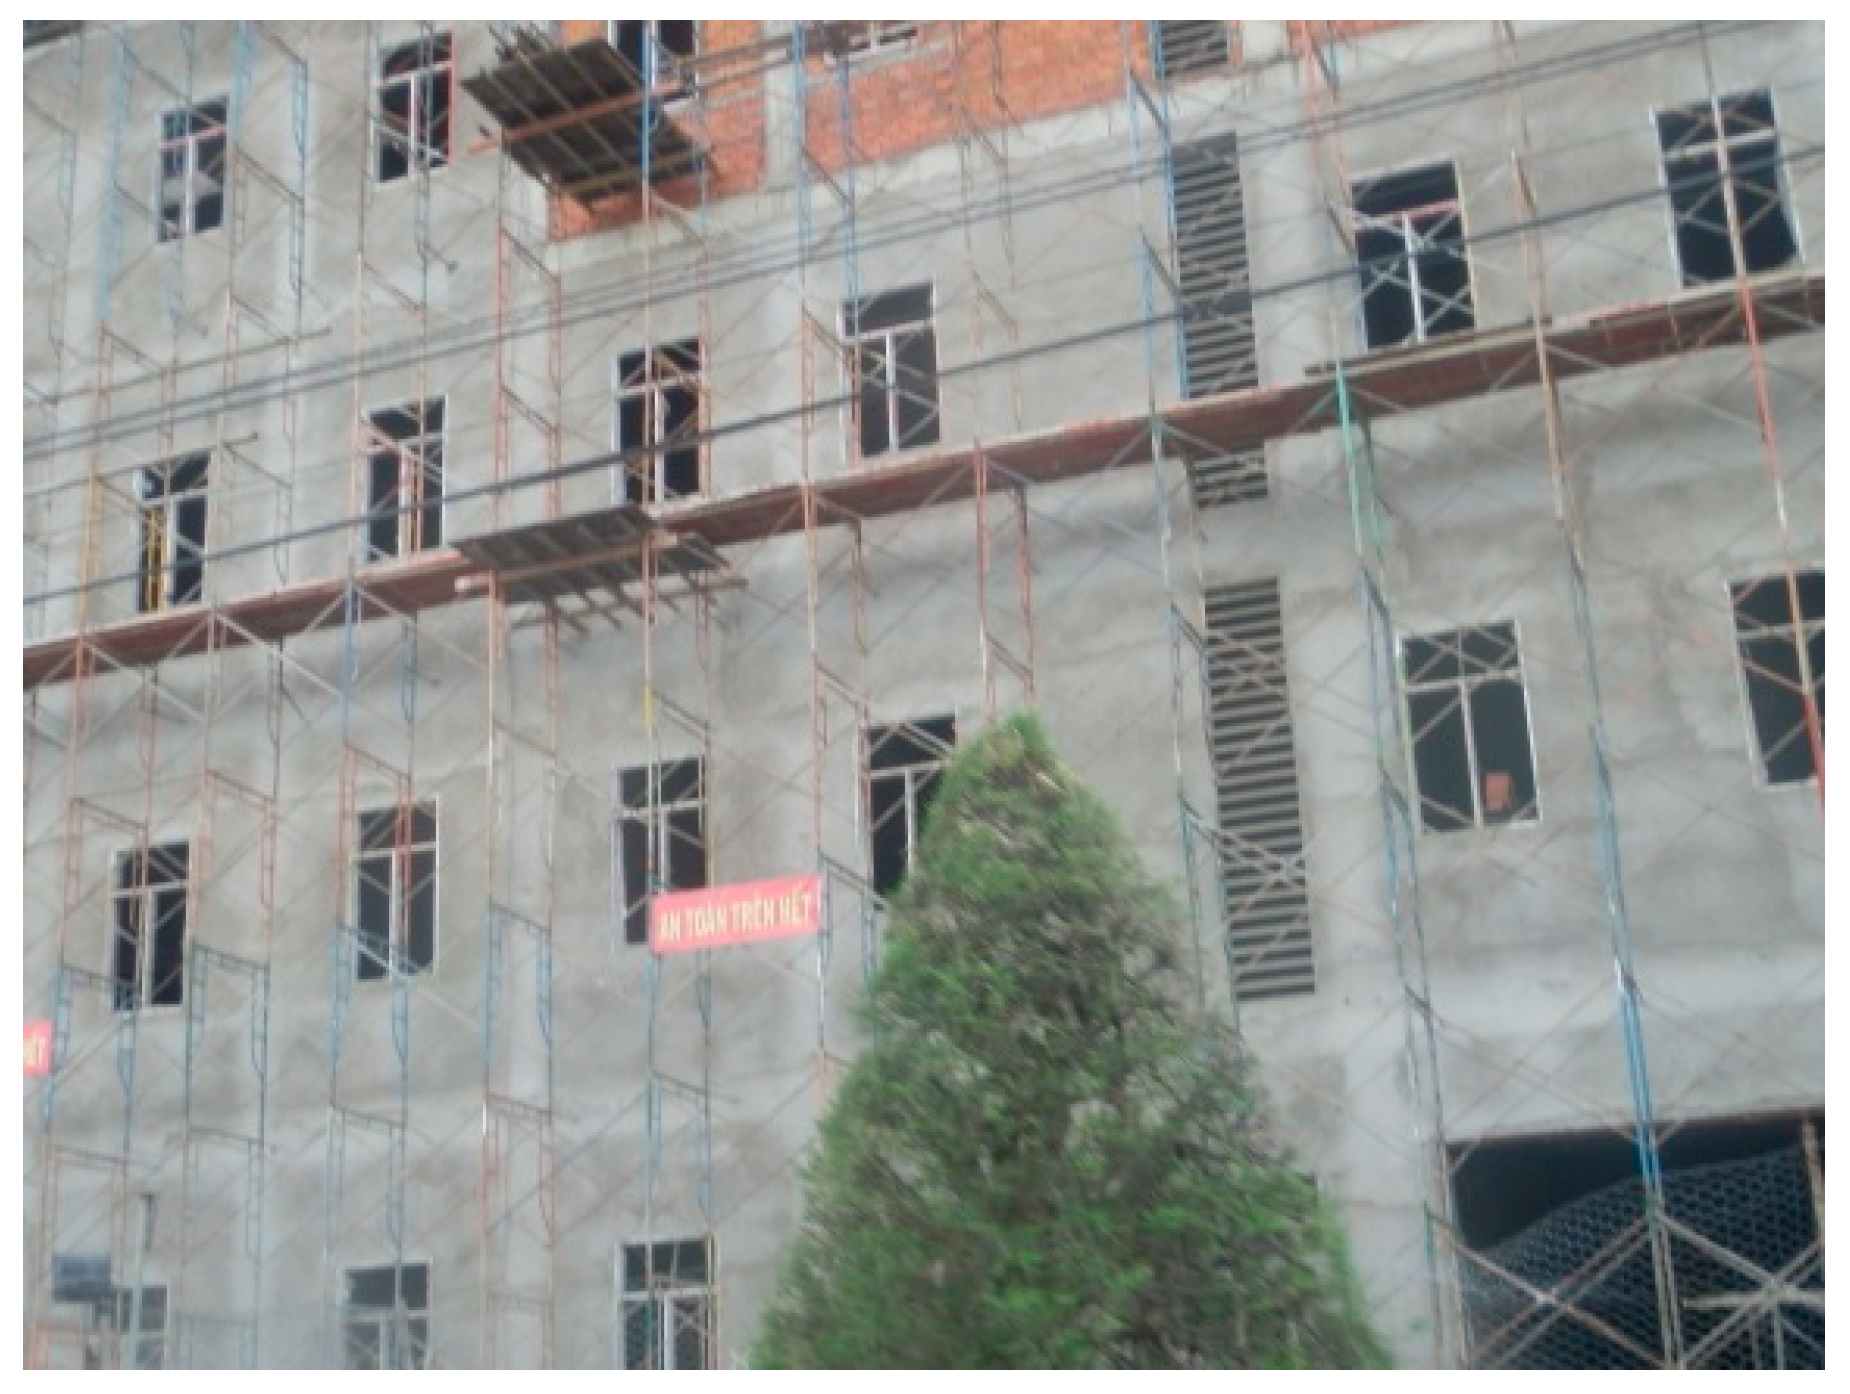
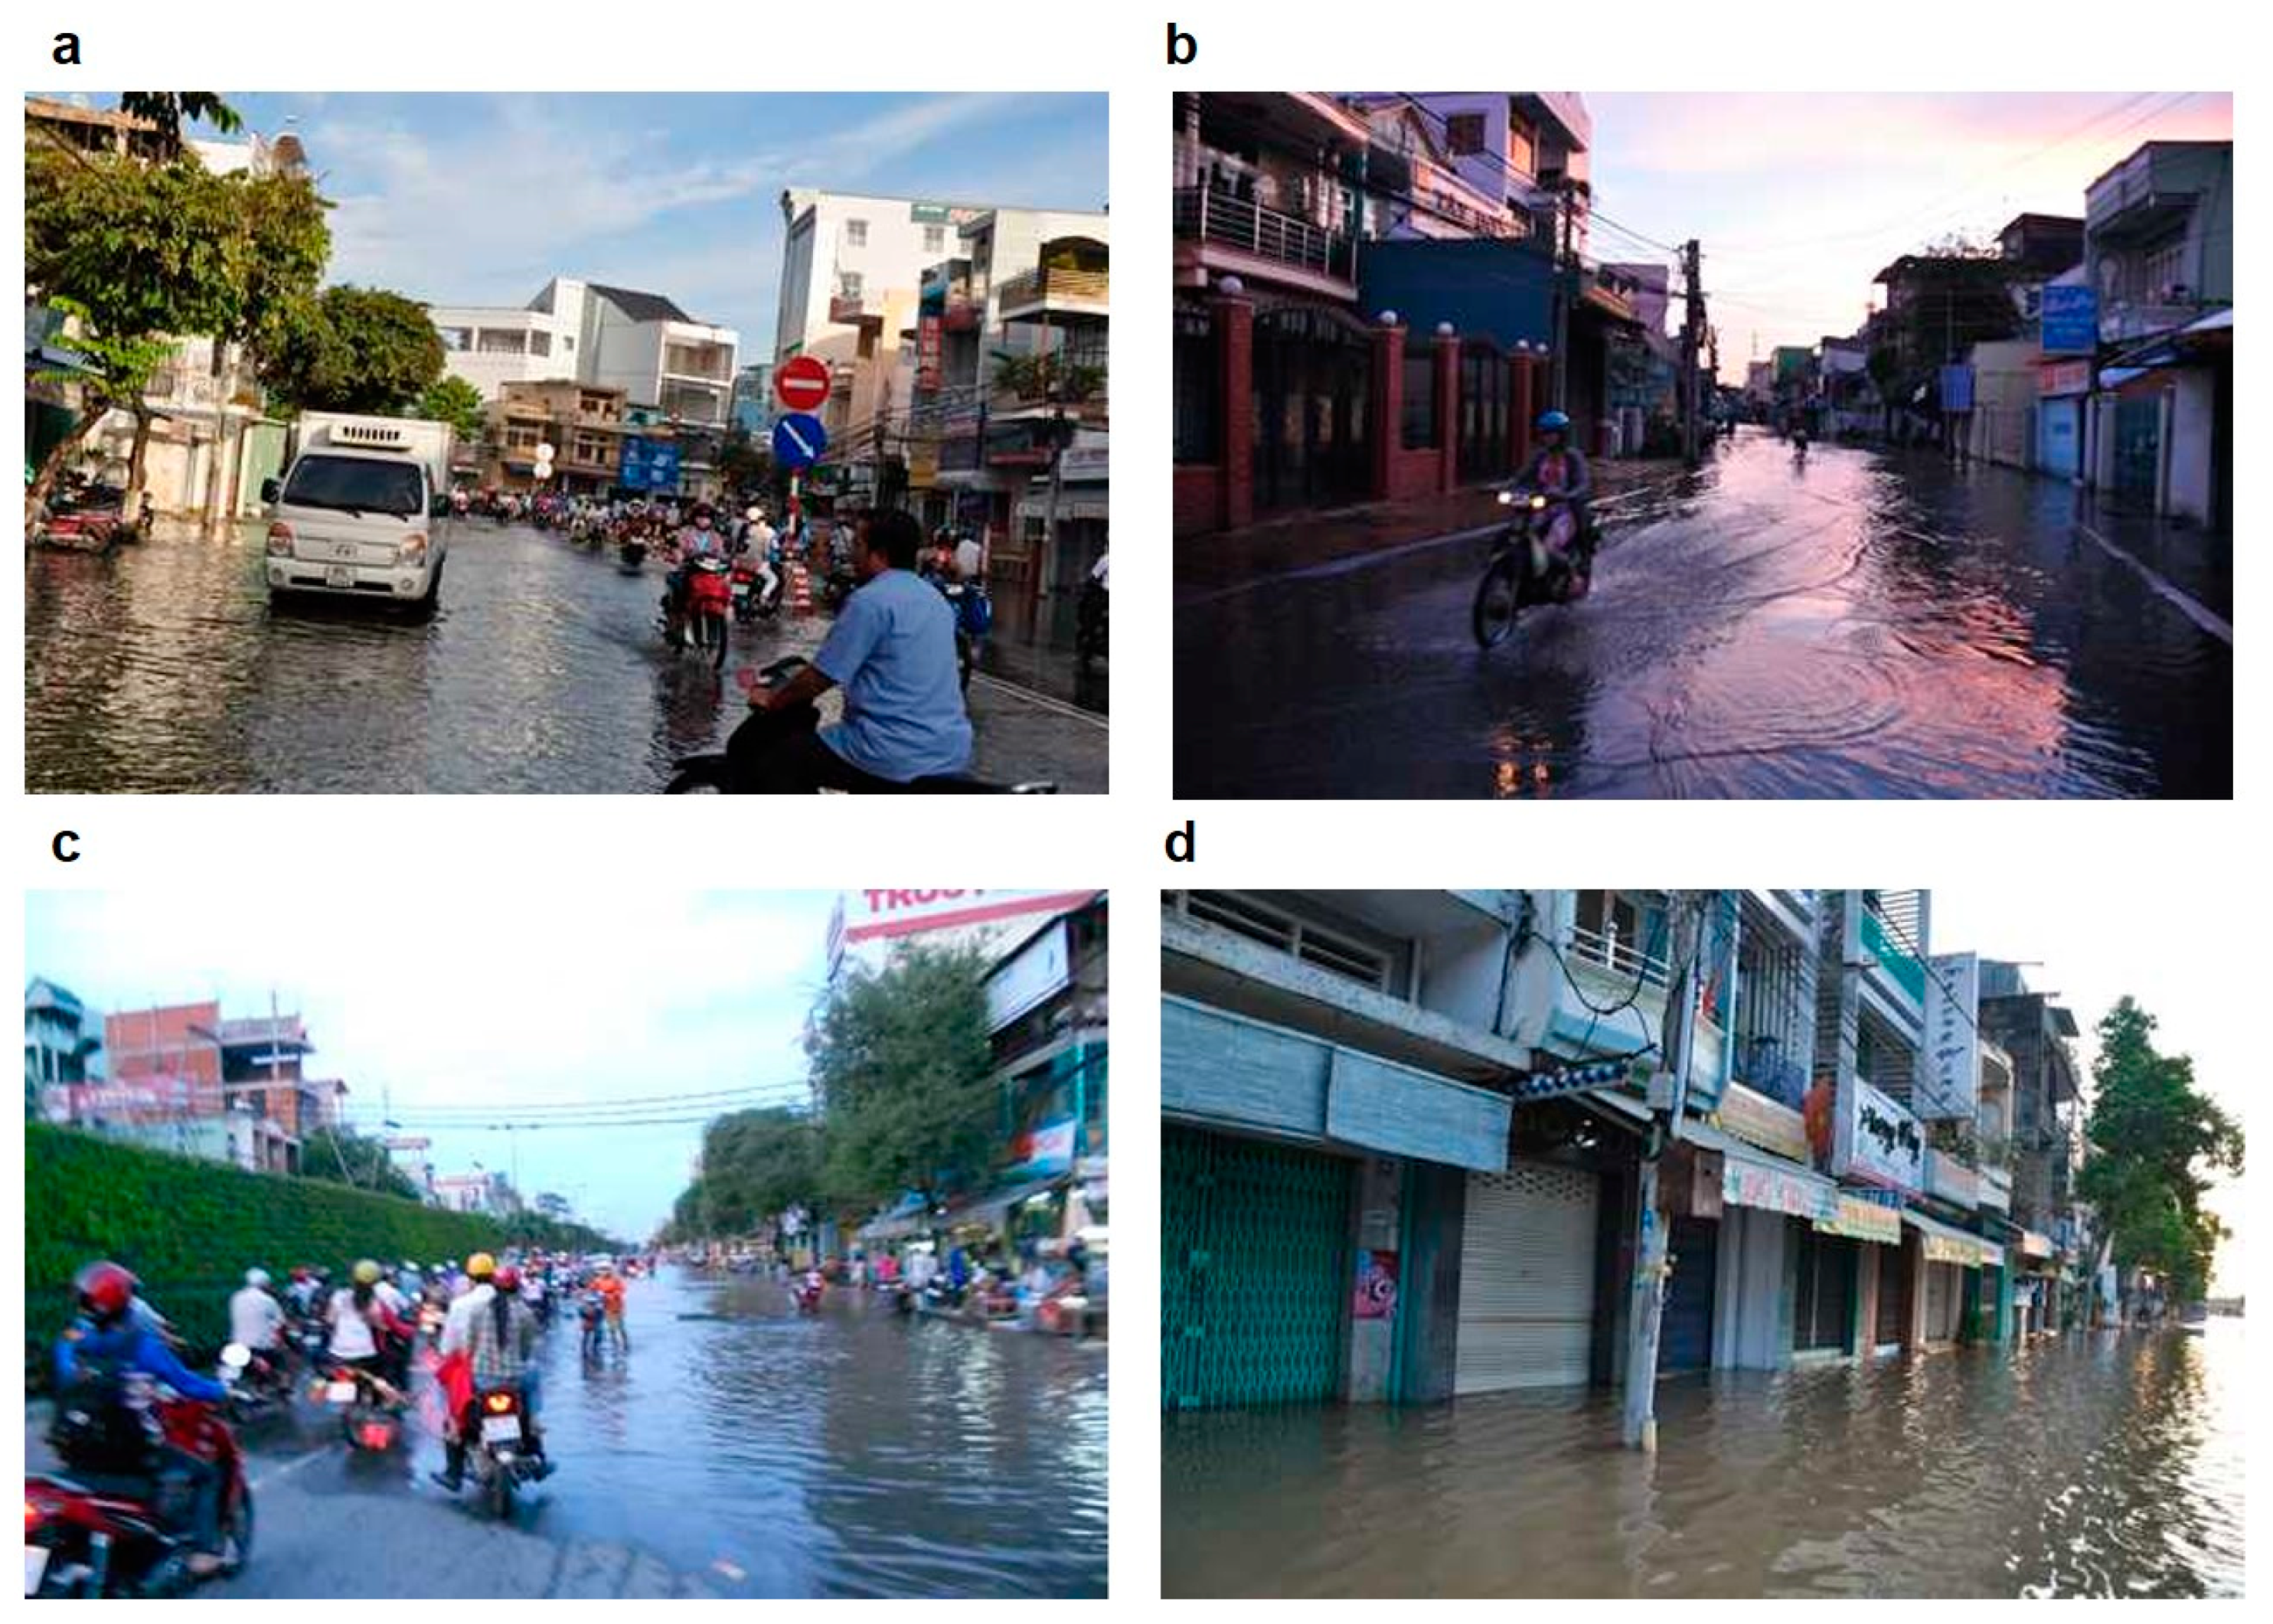
2.1. Study Area

The study area is Can Tho City, which is in the center of the Vietnamese Mekong Delta. Regions of the Vietnamese Mekong Delta are prone to high to extreme risk from floods [26,27,28,29]. The city is 75 km far from the Vietnamese East Sea (Figure 1). Can Tho City is one of the five cities centrally administered in Vietnam. It is the largest city in the Vietnamese Mekong Delta and an important base of increasing commerce, industry and transportation network [30,31]. As of April 2019, the city has a population of 1,235,171 [32] with a natural land area (in 2017) of about 1439 square km [33].
The socioeconomic development goals for 2020 and 2030 of the Vietnamese Mekong Delta see the increasingly significant role of Can Tho City in achieving the growth objectives [29] Can Tho City is set to be the regional centre for many upcoming and developing industries, primarily based on the vast arable land and water bodies. These industries include aquaculture, fishing and food processing. Figure 2 below shows the entrance to Tra Noc industrial zone in Can Tho City which houses several industrial firms. The increasing outputs from these industries in Can Tho City make the city a key contributor to the food security in the Mekong Delta region. Apart from these industries, Can Tho City plays an important role in the transportation connectivity via its many waterways, road network and the international airport. Due to the development of infrastructure as well as the industries, Can Tho City has attracted a lot of migrants in search of jobs and favorable economic engagement. As a growing city, it has witnessed a lot of construction activities in the recent times which resulted in changes in land use patterns. Figure 3 shows the ongoing construction activity of an industrial establishment. However, some of these economic growth related activities are hampered by the frequent natural disasters such as floods [34,35].
Analysis of flood risk in Can Tho City can be adapted to larger sections of South and South-East Asia since several of the geographical features with relation to proximity to major rivers and ocean as well as the weather patterns are noted in several developing cities in South and South-East Asia. Can Tho City faces threats from the three kinds of flooding: fluvial, pluvial, and tidal [36].
Upstream hydropower development along the Mekong may also cause hydrological alterations [37], but the impact on the delta is limited, with the change in flooding extents being slow to develop once they reach the lower parts of the delta. Importantly, the circumstances of the city are constantly changing and this brings about challenges and uncertainties in flood risk analysis and management.
Given the importance of Can Tho City to the economy, indeed to several aspects of the Vietnamese Mekong Delta, it is a good place to understand the development and maintenance of flood mitigation and management strategies in place. Can Tho City faces multiple challenges such as the increase in sea level and river runoff due to climate change, urban runoff caused by imperviousness and potential intensification of extreme rainfall due to microclimatic shifts [38]. Floods in Can Tho City cause losses to the city’s infrastructure and result in an adverse impact to the livelihoods of citizens. Some of the reasons for the flooding in Can Tho City include the lack of robust flood-prevention system and rapid urbanization [39].
Can Tho City is also an ideal place to study the effect of uncertainties in current flood risk assessment, which can eventually lead to strategies for tackling these uncertainties. In time, strategies developed in an accessible—but developing—city, can be adapted to larger sections of South and South East Asia.
Figure 4a–d below capture some of the scenes observed in the streets of Can Tho City during the floods in the year 2014. Due to the varied processes via which flooding can occur in the Mekong Delta, the Vietnamese government is attempting to provide plans to mitigate damage from flooding [29]. One way to do this would be to assess inundation patterns from the past. There is a paucity of on-the-ground data regarding flood extents in these areas. This has led to greater reliance on data gathered from remote sensed data. Remotely sensed images from satellites are used to reconstruct historical flood extent maps in several nations [40,41]. With the different kinds of satellites in use for accessing these data, reliability and usability of such data should be studied. One of the ways would be via examining the potential of freely available satellite imagery for the study area. Here, we used the capacity of the Google Earth Engine (GEE), a web-based platform, to analyze the flooded areas from three different satellite imagery (Landsat, MODIS and Sentinel-2). Each of these three satellite image sensors has their own advantages and disadvantages (e.g., different spatial and temporal resolutions). A range of potential flooded areas are provided by each of these sensors, and SVM was used to reconstruct the flooding patterns.

2.2. Methodology

The below steps were followed to conduct the study. Further description about the data and techniques are provided in Section 2.2.1, Section 2.2.2, Section 2.2.3, Section 2.3 and Section 2.4.
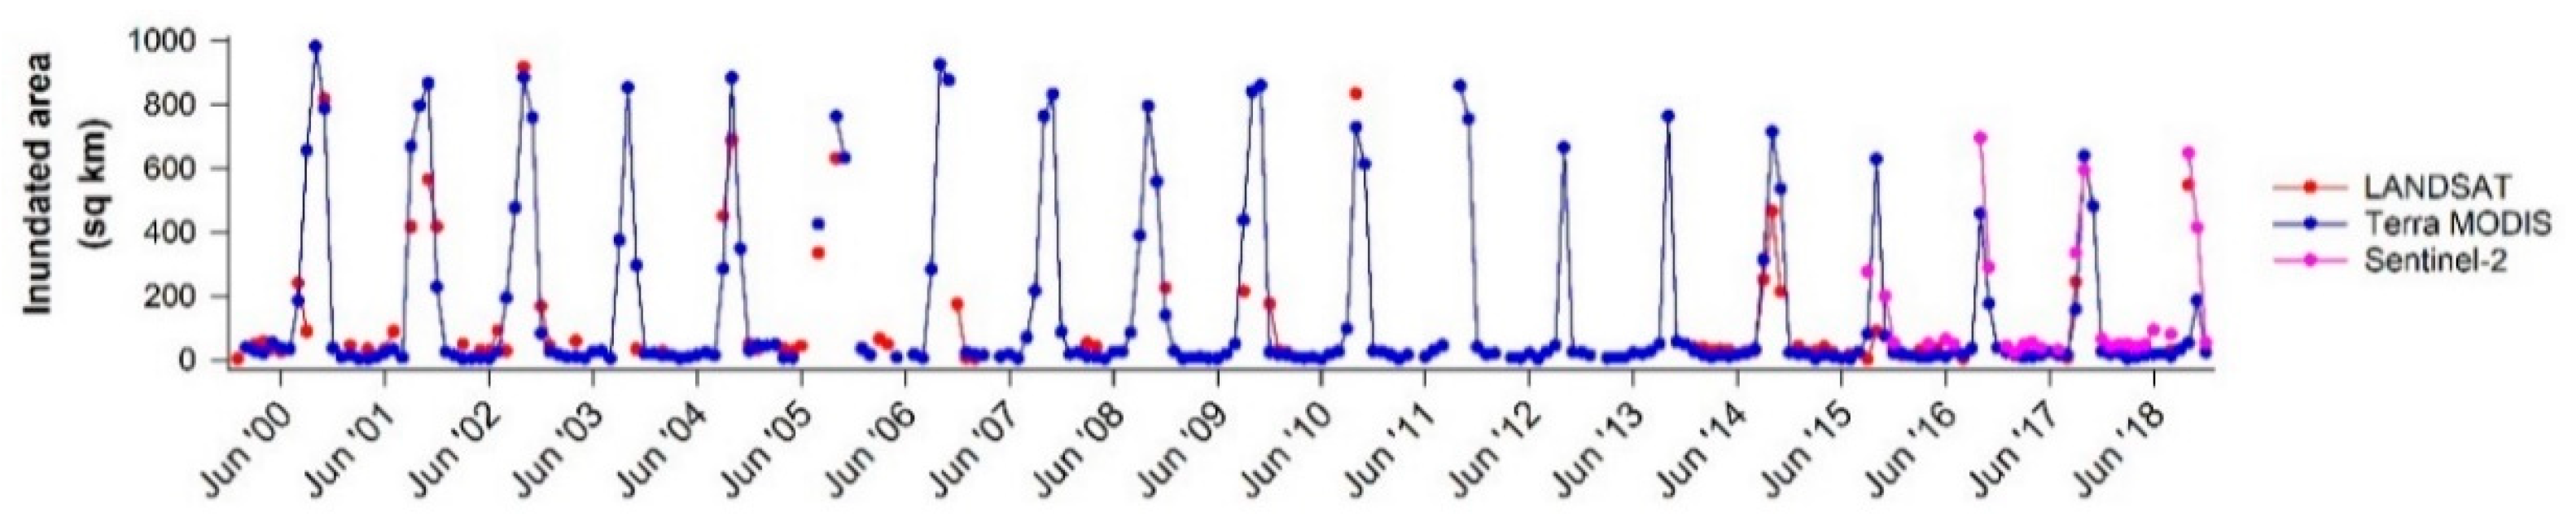
  • Available satellite imagery from Landsat and Terra MODIS sensors covering the study area between the years 2000 and 2018 were accessed via the GEE platform. Available imagery from Sentinel-2 sensor is accessed from the year 2015 onwards.
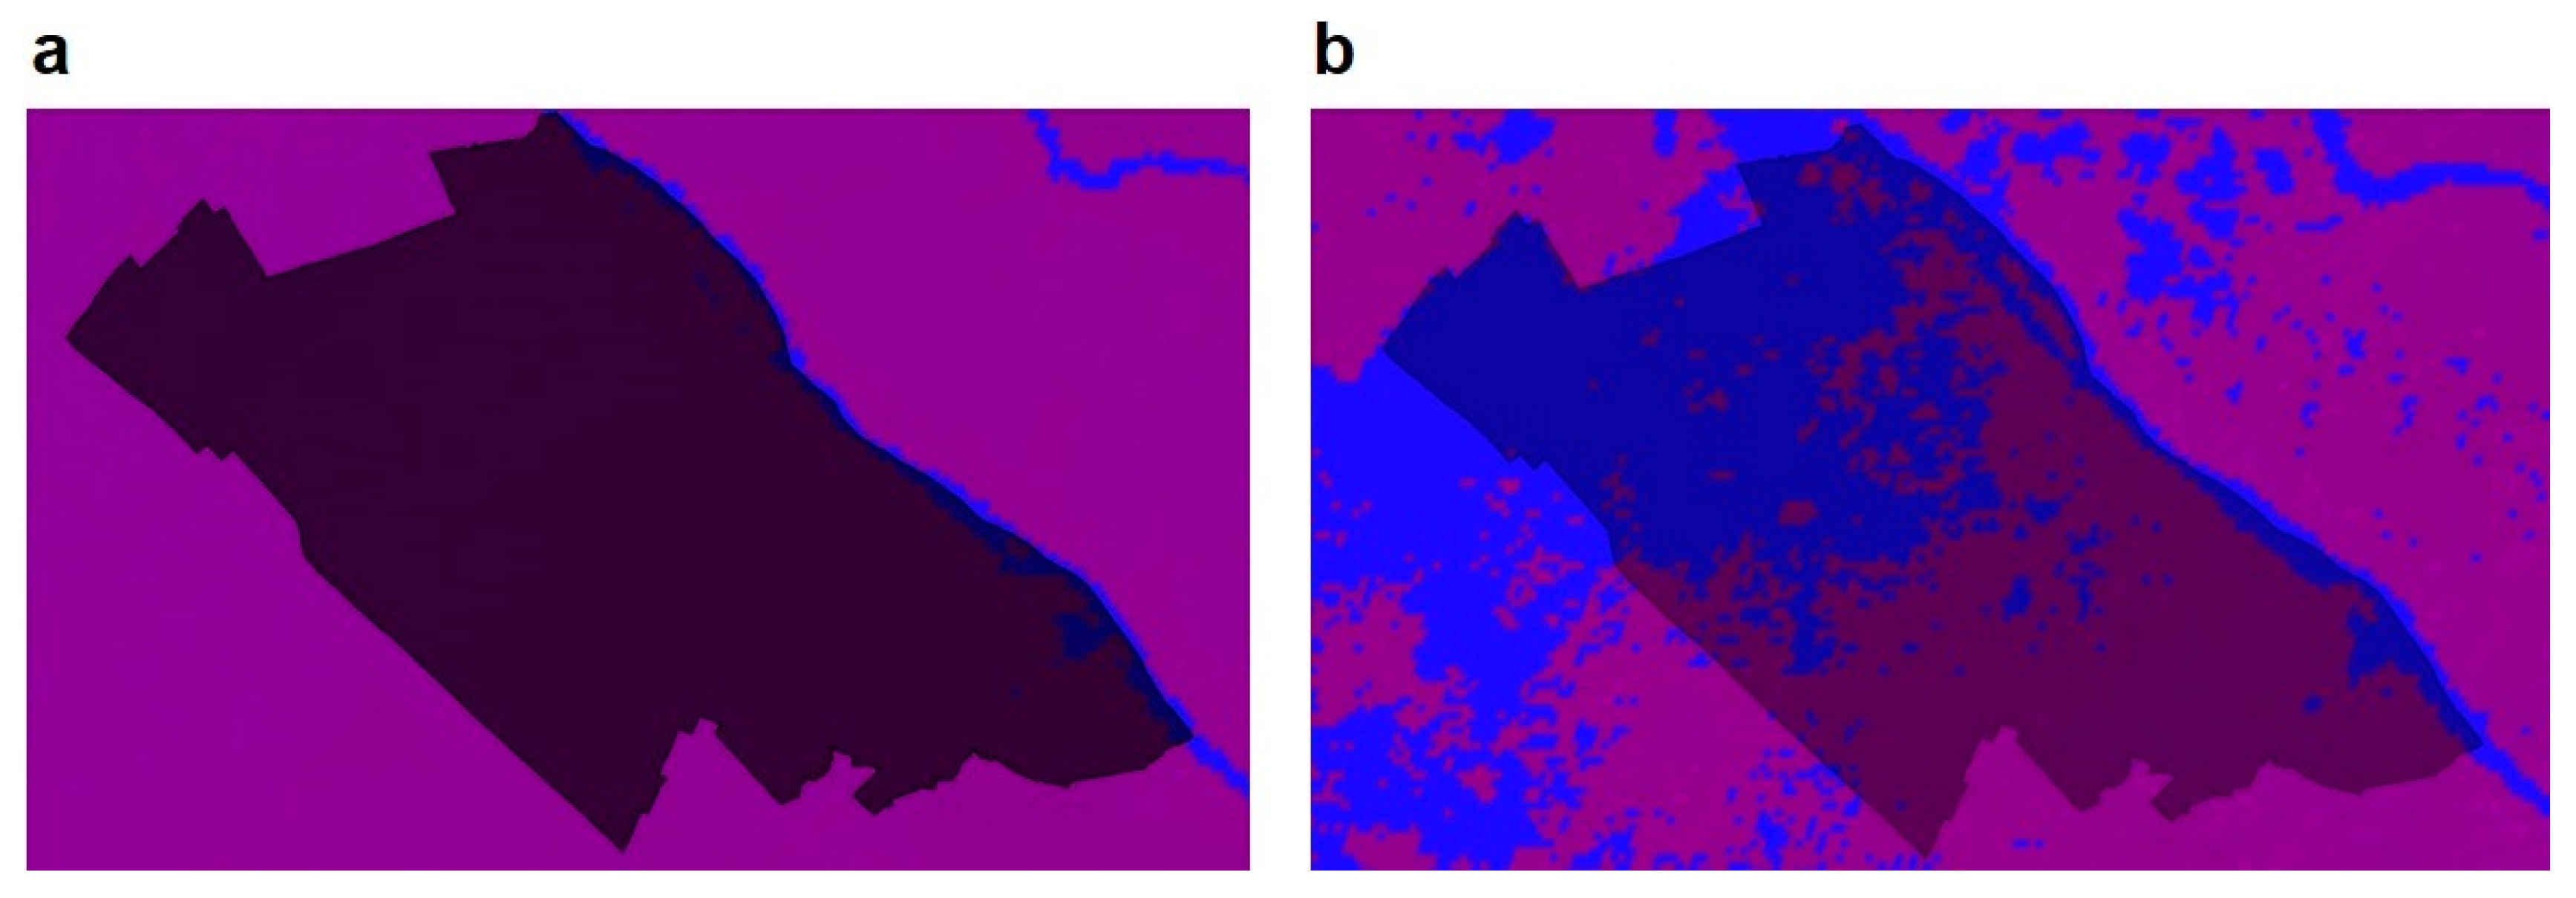
  • Extent of water bodies from respective satellite imagery are calculated using Normalized Difference Water Index (NDWI). Details are outlined in Section 2.2.2.
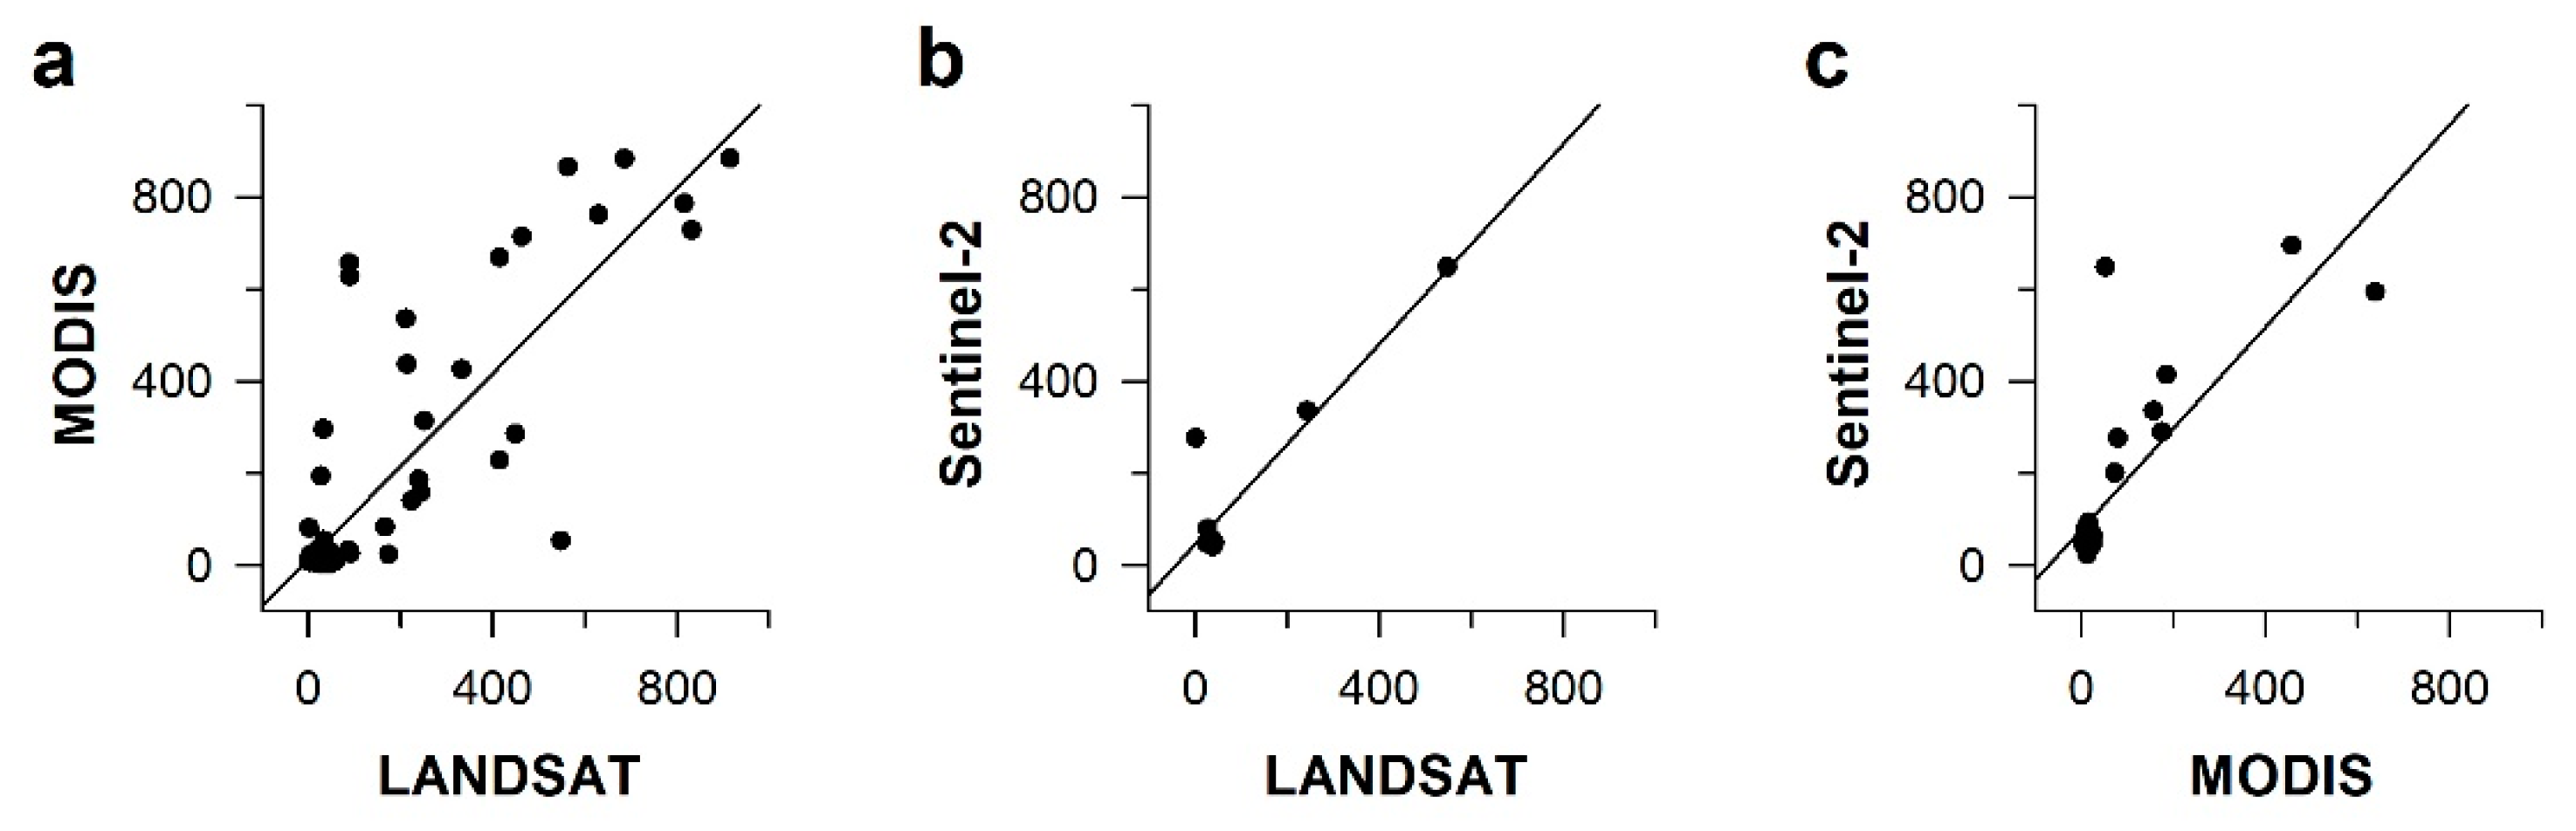
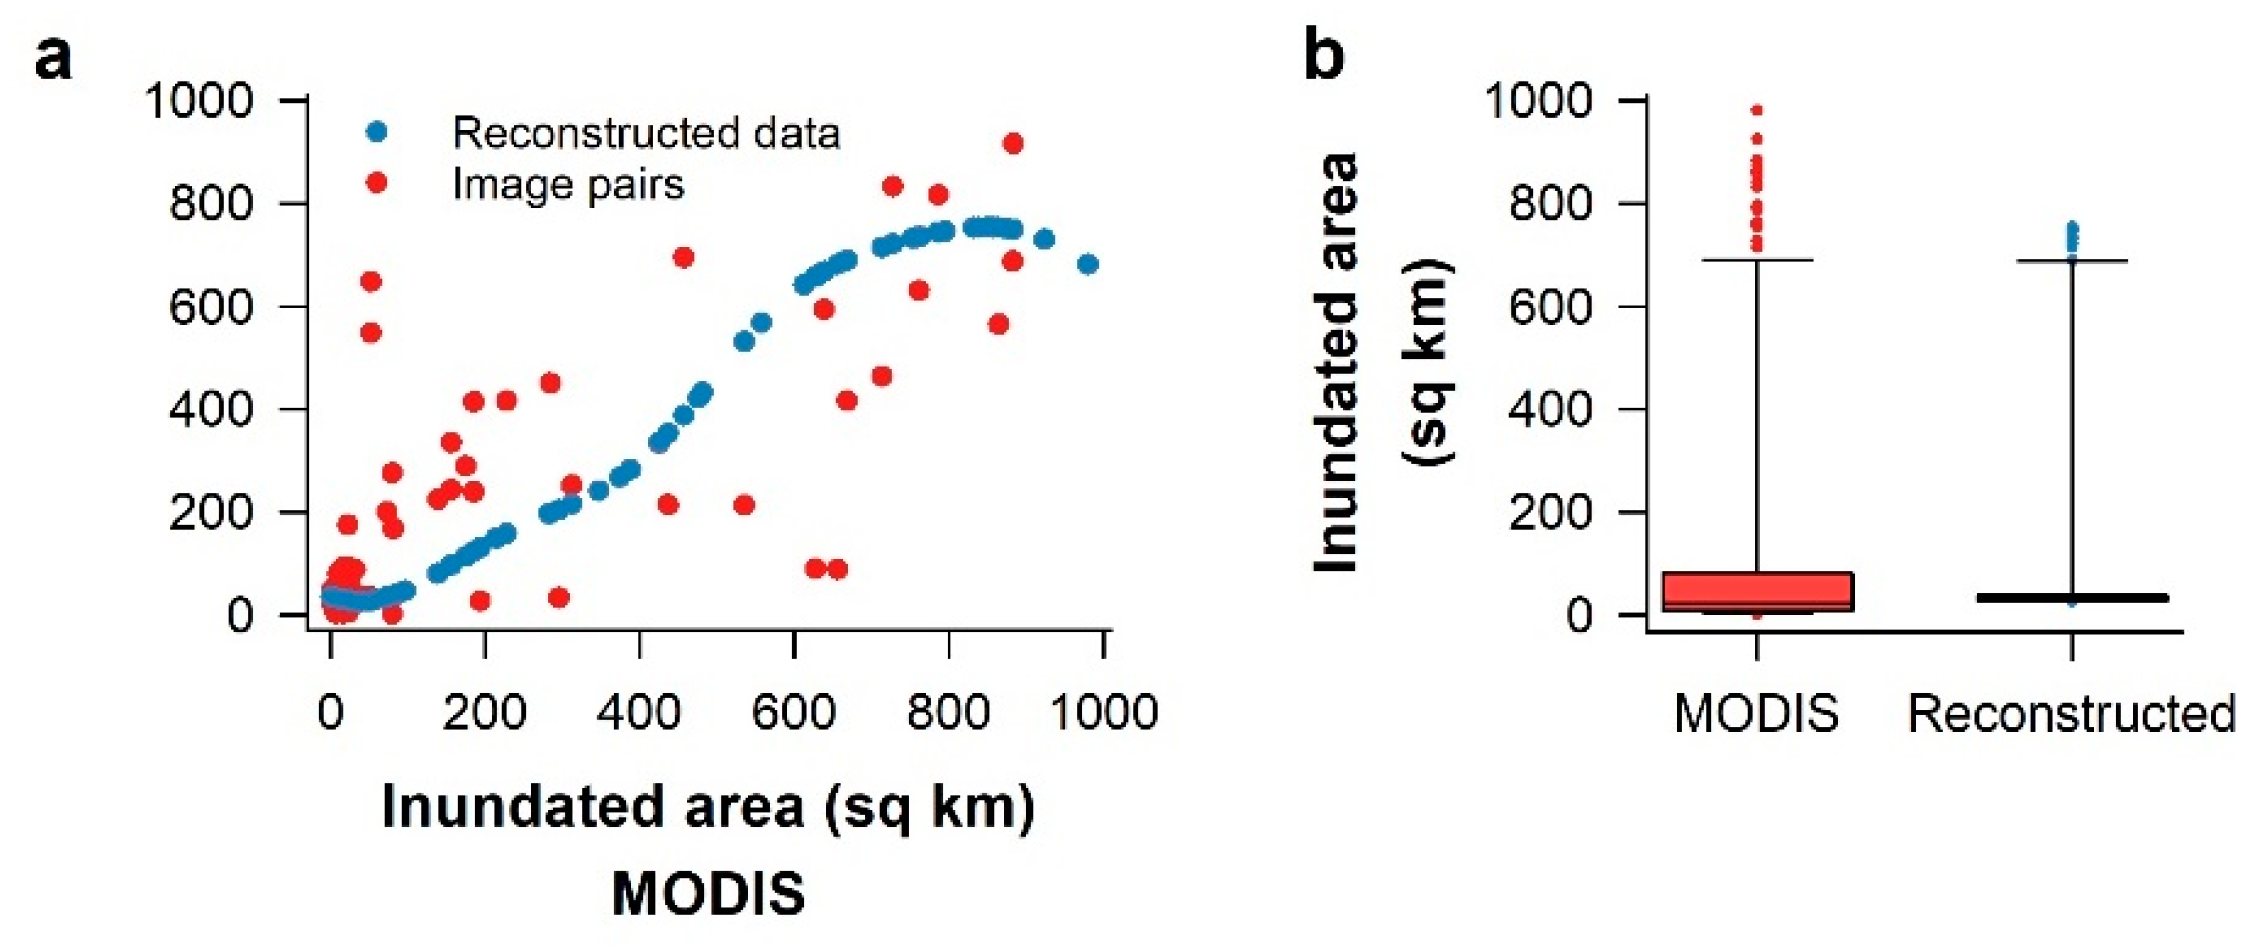
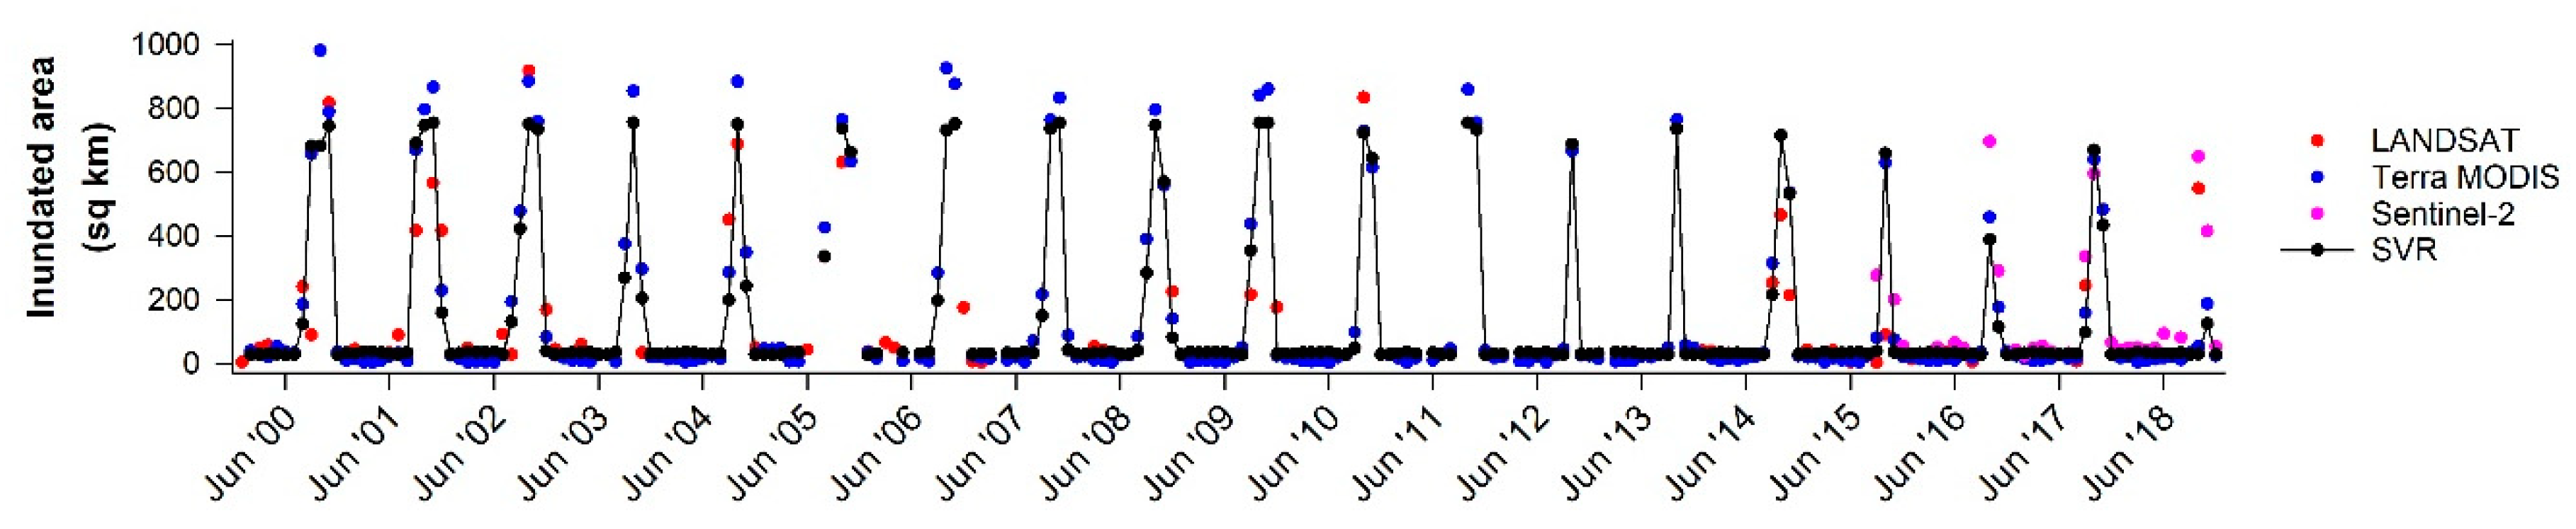
  • The calculated inundated area figures (i.e., extent of water bodies) from different satellite sensors provide different values. This is due to the spatial and temporal differences of the three different satellite sensors which were considered. To account for this uncertainty, Support Vector Machine Regression (SVR) technique has been used to reconstruct the inundated area values for different months as an integrated value from three sensors.

2.2.1. Google Earth Engine

Google Earth Engine (GEE) is a web-based cloud computing platform capable of storing multi-layer catalog of satellite images and geospatial datasets within GEE’s Public Data Catalog [42,43,44]. In addition to archival, within the GEE script-environment these large datasets can be analyzed for identifying the changes, mapping variations, and variances on the surface of the earth. Since GEE is a cloud-based service, there is no necessity to download and analyze imagery in the traditional manner and thus this saves time.
Phongsapan and colleagues studied the potential of GEE platform in deriving an operational flood risk index covering Myanmar [45]. Uddin et al. outlined the utility of GEE in using multi-temporal Sentinel-1 Synthetic Aperture Radar (SAR) satellite imagery in capturing the flood inundated areas in Bangladesh [46]. Sidhu and team and Celik and team also used GEE for identifying the land cover changes in urban areas in Singapore [47] and Ankara [48], respectively.
Nguyen and colleagues analyzed several Landsat satellite imageries to examine the changes in built-up area in Can Tho City between the years 1998 and 2018. However, GEE was not used to retrieve and analyze the Landsat imagery in this case [49]. Goldblatt et al. earlier demonstrated the application of GEE for identification of boundaries of urban regions (i.e., built-up areas) in India [50]. Review of studies such as the above illustrate that there is a gap in research and utilization of GEE for research work in Can Tho City (study area), more so in the important area of flooding risk. The important idea of utilization of historical satellite imagery via GEE, an efficient archival and computational platform in Can Tho City was introduced in our paper.
Researchers wishing to use the service neither need to be familiar with nor need to use specialized remote sensing software such as Environment for Visualizing Images (ENVI) and Earth Resources Data Analysis System (ERDAS) Imagine for regular image processing functions. As with other open source software, several algorithms are provided by other users, thus providing a greater expertise in analyzing different datasets than would be possible for a single person or team working together. Bulk downloads and memory use can be avoided since work can be performed online. In this study, datasets related to Can Tho City from three publicly available platforms, Landsat (5, 7 and 8), Sentinel-2 and MODIS were obtained and analyzed using the Google Earth Engine.

2.2.2. Extraction of Water Body Extent

The Normalized Difference Water Index (NDWI) [42,51,52] is an index derived from the satellite imagery using the Near-Infrared (NIR) and Green wavelengths. NDWI can capture the water body presence from remote sensing imagery via separating non-water related features. Reflected near-infrared radiation and green light are used in the calculation since this helps in excluding vegetation and land, while improving water detection [52]. NDWI is calculated with the formula as shown below:
NDWI = Green NIR Green + NIR
where the Green is the band which captures reflected green light and the NIR represents the near-infrared radiation.
By using green wavelengths, the typical reflectance of water features is maximized, the low reflectance of NIR by water bodies is minimized and the high reflectance of NIR by vegetation and soil features from the land is maximized. The outcomes from the above index are that water bodies have positive values while using multispectral imagery which has a reflected green band and an NIR band. Soil and vegetation features have zero or negative values due to the typical high reflectance of NIR than the green light [52].
During the processing of satellite imagery, an appropriate threshold was applied based on the presence and extent of cloud cover in the imagery. For example, a threshold value of 0.1 was applied for imagery with high cloud coverage whereas a threshold value of 0.3 was applied for the satellite imagery with relatively less cloud coverage [53]. This helps in capturing even very low values of NDWI which may result from high cloud coverage or the absence of water bearing pixels. When the water bodies are clearly visible, the increase in threshold value beyond 0.3 does not have much effect; hence a threshold value of 0.3 is good enough for imagery with clear water body presence and less cloud cover.

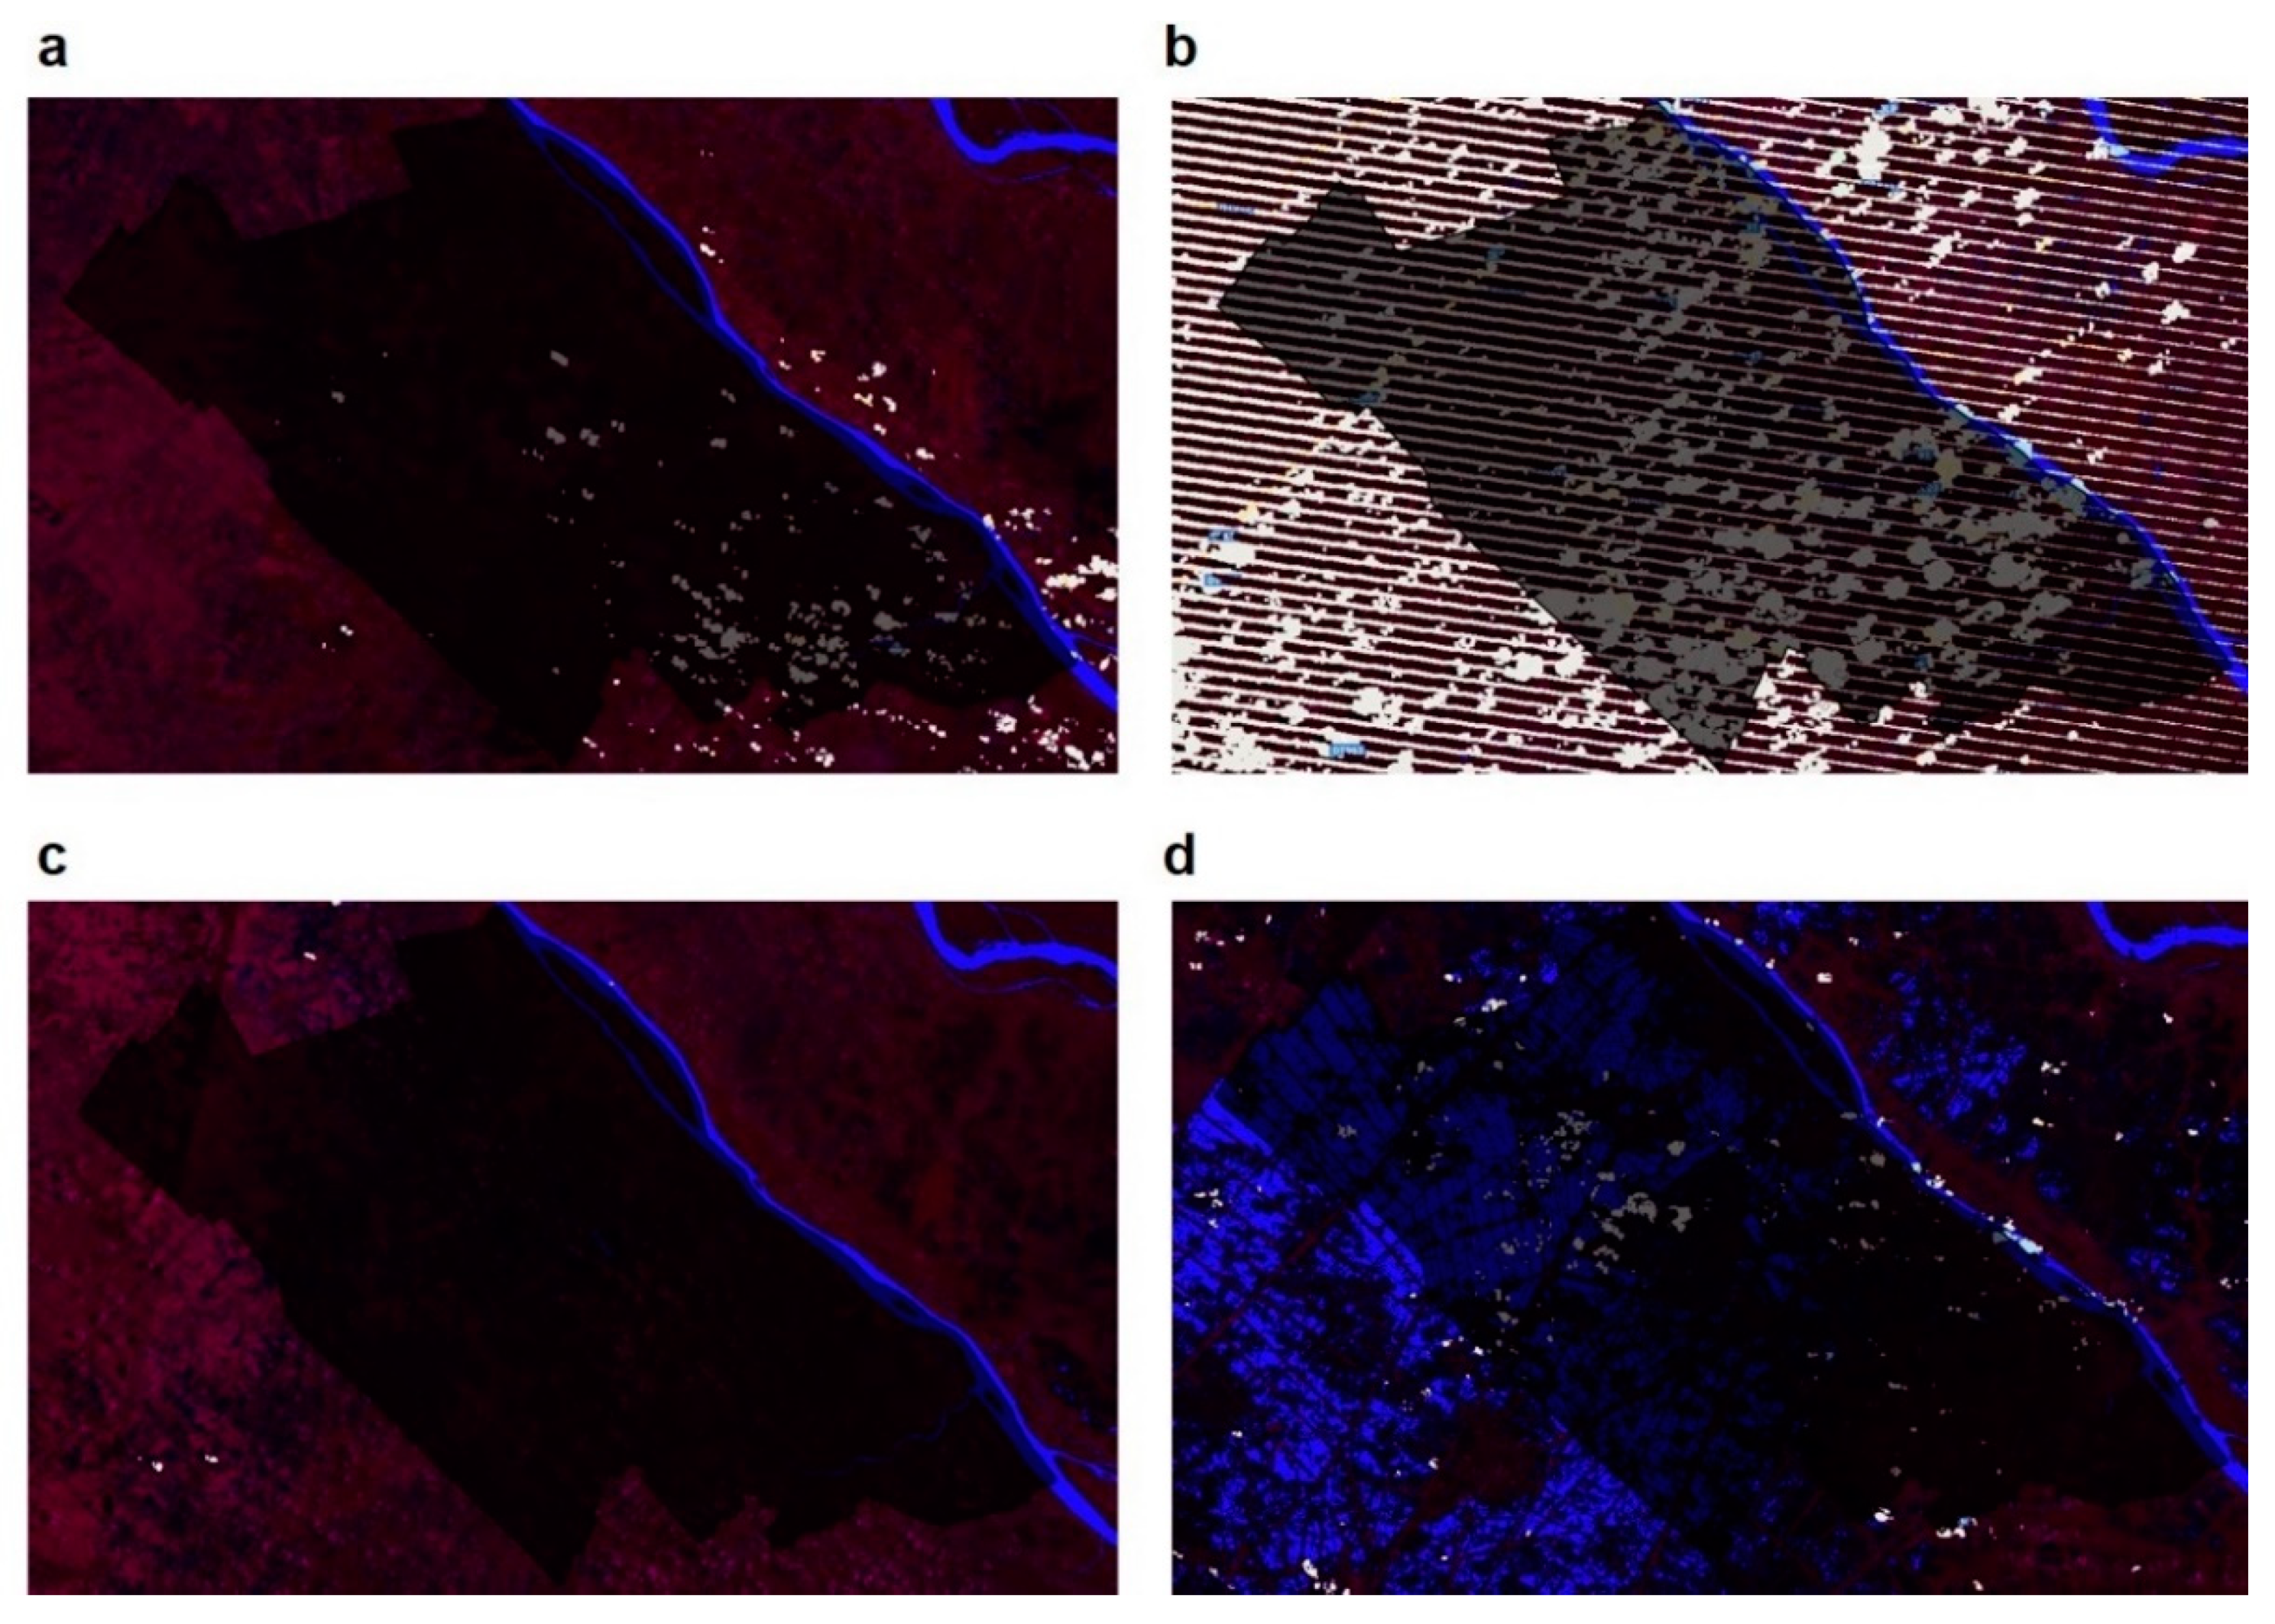
2.2.3. Data (Landsat 5,7,8, Terra MODIS and Sentinel-2)

Landsat

The Landsat programme is a joint venture of United States Geological Survey (USGS), National Aeronautics and Space Administration (NASA) and National Oceanic and Atmospheric Administration (NOAA), and has been in use since 1972 [20,21]. For most Landsat imagery, the temporal resolution (sensor revisit time) of Landsat is 16 days. For Landsat imagery that includes multi-spectral and thermal data, spatial resolution is mostly about 30 m. Landsat data are available in the GEE in its raw form, surface reflection, Top Of Atmosphere (TOA)-corrected reflection, and other ready-made products, such as NDWI, NDVI and EVI indices. Landsat sensor, however, cannot capture the data when there is a cloud cover. From Figure 5a below, it can be noted that parts of the study area, covered with clouds are captured as white patches. This posed issue with derivation of accurate inundated area during certain periods. Scanline collector failure of the Landsat 7 Enhanced Thematic Mapper in 2003 led to data gaps with 22 percent of the coverable area missing. Figure 5b below illustrates this issue. Images acquired in these two cases (with cloud cover and scan line cover) introduce some uncertainty in the inundation area captured. Figure 5c,d below show the false color Landsat images acquired during dry and flood season respectively.

MODIS

The Moderate Resolution Imaging Spectroradiometer (MODIS) was built by Santa Barbara Remote Sensing facility and was launched into the orbit by NASA during the year 1999 on board the Terra (EOS AM) Satellite, and in 2002 on board the Aqua (EOS PM) satellite [15,54]. These instruments are capable of imaging the surface of the Earth every 1 to 2 days, at 250 m, 500 m and 1 km resolutions. Data are captured in more than 35 spectral bands, ranging from <1 µm to nearly 15 µm. Changes and processes occurring in the oceans and on land can be captured by MODIS. Figure 6a,b show the False color Terra MODIS images acquired during dry and flood seasons respectively.

Sentinel-2

Sentinel is a group of satellites managed by the European Space Agency (ESA, Paris, France) under the Copernicus program in 2014 [10,16,55]. Here, we used high-resolution optical images from Sentinel-2A and 2B, which together have a temporal resolution of about 5 days and a spatial resolution of 30 to 60 m. Figure 7a,b show the false color Sentinel images showing the study area captured during dry and flood season respectively.

2.3. Data Time-Period

In this study, data from the years 2000 to 2018 were collected for the study area from Landsat (5,7,8) and Terra MODIS. We attempted to collect one data point from the data from each month in this time period (total of 228 possible months). Certain prerequisites needed to be maintained when remotely sensed images were collected for analyses of flooding extent, like less than 20% cloud coverage (0% if possible, since floods occur during the rainy season) of the images. Landsat provided spotty images between 2003 and 2014, due to the partial failure (scan line collector failure) of the Landsat 7 satellite [56,57]. Additionally, the Sentinel-2 satellite was launched recently, and data are only available from the year 2015 onwards.
Here, we used the classification of pixels in the remote sensing image into those containing water and those not containing water by using the NDWI. This was undertaken for all the available and usable images from Landsat, MODIS and Sentinel-2 sensors. Of the possible 228 data points from each type of sensor, data from 82 months is available from Landsat and data from 214 months is available from MODIS. For Sentinel, data are only available from September 2015, and of the possible data from 40 months, we obtained data available from 27 months.
While analyzing data from different platforms, discrepancies are noted in the inundated areas obtained from each platform. We therefore used support vector regression (SVR), a non-linear regression technique, to reconstruct flooding patterns.

2.4. Support Vector Machine Regression (SVR)

SVM has earlier been used mainly as a supervised classification technique while analyzing satellite imagery [58]. It is a supervised, non-parametric classification algorithm, used for linear binary classification of data points [23,59]. Support vector refers to data points that fall along the border of the margin of separation. As with any supervised classification algorithm, SVM requires a training data set. However, with SVM, a small training set is enough and can provide good classification accuracy. For every data point, a decision is made whether it is far from the support vector. The distance from the support vector determines the margin of classification. It classifies each new datapoint from the testing set without making assumptions as to the classification, i.e., data classification is not dependent on assumption of Gaussian distribution and not based on nearest neighbors. SVMs also provide a balance between data overfitting and underfitting, even when limited training samples are used. This method is often used to for images obtained from multi-spectral satellite sensor images.
The potential of Support Vector Machine (SVM) as a supervised machine learning classifier in deriving the flooded area from Landsat imagery has been studied by Ireland and colleagues [60]. Syifa et al. utilized SVM and Artificial Neural Network (ANN) classification techniques to derive the map showing the flooded area after the collapse of Brumadinho dam wall in Brazil during January 2019 [61]. However, the SVM technique can be applied for both classification and regression. In the current study, we applied the principles of SVM for regression, called Support Vector Machine Regression or simply Support Vector Regression (SVR). Gizaw and Gan applied SVR technique for the estimation of regional flood frequency covering two study areas in Canada [62]. Chen and Yu adopted SVR to develop a model to provide a deterministic flooding stage forecasting for Lang-Yang river in Taiwan [63]. SVM and SVR have become effective machine learning substitutes to Artificial Neural Networks (ANNs), finding more applications in flood prediction [64]. These methods have been applied in several flood prediction studies with better performance results compared to ANN and Multiple Linear Regression (MLR) techniques. These methods were applied involving data such as flood time series, extreme rainfall and streamflow [64,65].
For the training set, data from homogenous areas in the collected images were utilized. Here, SVR was used to adjust for the missing data from several months. When data from at least one sensor are available, SVR can generate a composite value for the inundated area. The major reason for using SVR is the different spatial and temporal resolutions for the three satellite imagery we analyzed here. While Landsat and Sentinel-2 imagery provide relatively high spatial resolution, they have lower temporal resolution. In addition, SVR can better predict non-linear predictor/predictand data as used here, and which cannot be well predicted via linear regression methods.
In total, we analyzed 83 Landsat images, 214 MODIS images and 27 Sentinel images. Where available, for each Landsat or Sentinel image, we found a corresponding MODIS image and there were 105 image pairs. We bootstrapped these pairs with the training and the testing ratio of 7:3, 100 times. The average value of coefficient of determination (R2) for 100 rounds of this was 0.85 for training, and 0.72 for prediction. By using this method, we were able to reconstruct integrated flood extent values from MODIS data using the SVR model constructed from the image pairs. Packages e1071 and boot were used for these analyses, performed on R [66,67,68,69].

3. Results

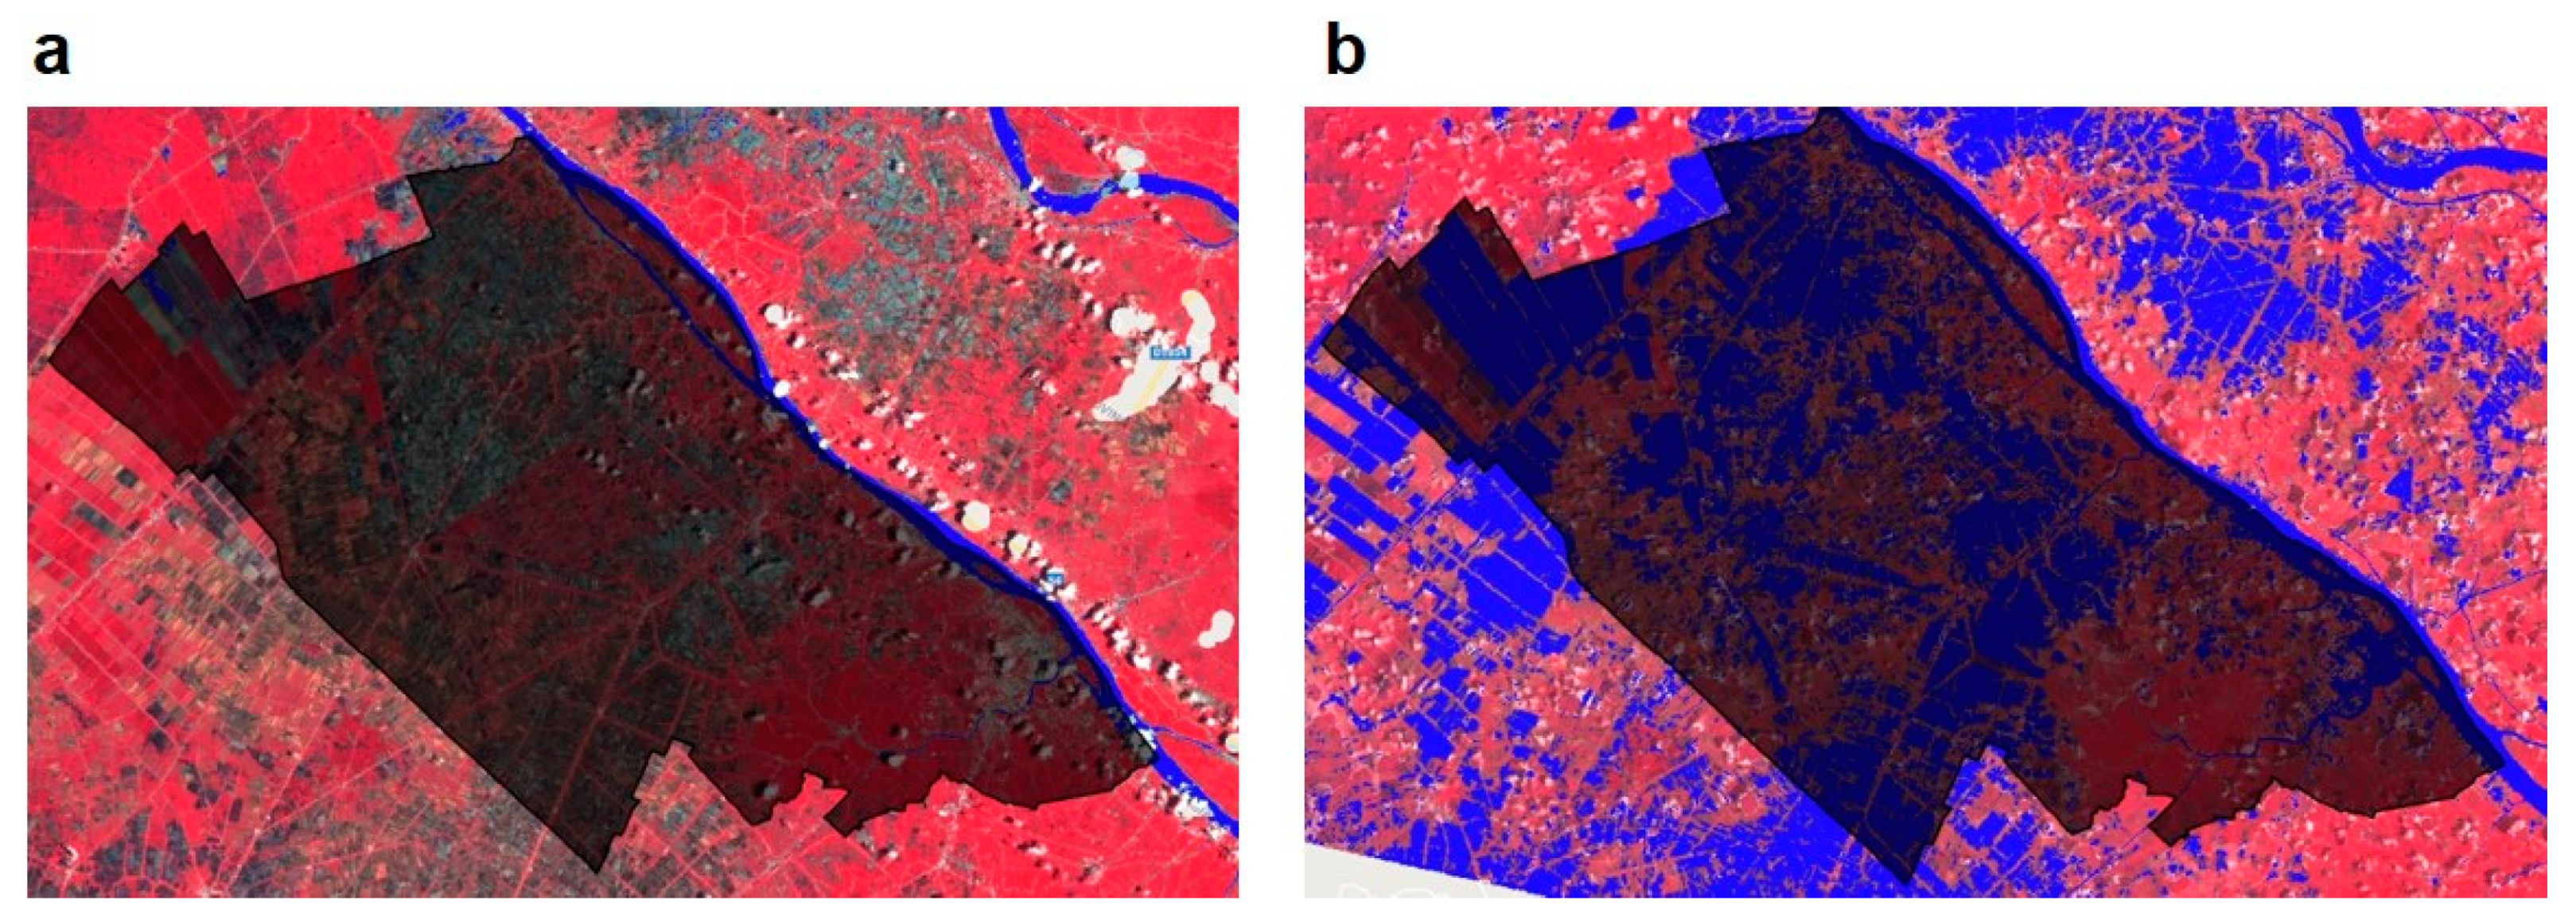
3.1. Capturing Inundated Areas Using GEE

In this study, “ground-truth” information from the field survey was not available for the study area under consideration. This issue is not uncommon for flooding risk and this often results in scarcity of quantitative validation [70]. To address this challenge, we collected 200 random high-resolution Google Earth images (100 water and 100 non-water images). The Kappa Coefficient of Landsat, MODIS and Sentinel-2 accessed from GEE were 0.87, 0.75 and 0.89 respectively. These Kappa index values demonstrate strong (Kappa value > 0.8) to moderate (Kappa value > 0.7) correlation between inundated areas as determined by satellite imagery from GEE and an external source, thus allowing for the use of satellite images and the corresponding thresholds in classifying the inundated areas/water bodies. The lower K value of MODIS compared to the two others may be caused by its lower spatial resolution.

3.2. Correlation and Differences Between Data from Different Satellite Sources

In this study, data from different satellites were utilized to derive the extent of water inundation in Can Tho City. As an initial step, it is necessary to assess the degree of agreement between the flood extents derived from the different satellite images. As such, we performed Pearson’s correlation between data from Landsat and MODIS images. The data are highly correlated, with a Pearson’s r of 0.84 (Figure 8a). We also performed Pearson’s correlation between Landsat and MODIS data separately for the low inundation period (from the months of February to July) and the high inundation period (August to January). For this process, we collated the Landsat data from the months of February to July throughout the study period and correlated it with the MODIS data collected from February to July during the study period. A similar correlation was performed on data collected from August to January. The results showed that the Pearson’s correlation coefficient was low during the low inundation period (r = 0.15, low inundation period). However, the correlation was high during the high inundation period (r = 0.79, high inundation).
Similarly, Pearson’s correlation analysis was performed between data from Landsat and Sentinel-2 images (Figure 8b) and MODIS and Sentinel-2 images (Figure 8c). These data are also highly correlated, with a Pearson’s r of 0.91 and 0.80, respectively. Limited data are available from Sentinel-2, since it was launched more recently than the others. Its correlation with the Landsat data is very high, given the similarly high spatial resolutions of both these data.
A major reason for the differences between the data collected from the three sensors is the differences in spatial resolution of the data collected. Additionally, cloud coverage, especially during the times of high inundation, is another important factor. High inundation happens during the rainy season, and therefore completely avoiding cloud cover would be nearly impossible. Nevertheless, the great degree of correlation informs us that over a long period of time, data from different sensors can similarly inform us about the water-inundated area over several years.
Unfortunately, the “ground-truth” information from the field survey is not available for the study area under consideration. This issue is not uncommon for flooding risk and this often results in scarcity of quantitative validation [70].

3.3. Seasonal Variations in Water Levels Observed by Different Sensors

As stated in the previous section, the correlation between Landsat and MODIS data was lower during the months of low inundation. To assess the agreeability between the different sensor data, we also plotted the time course of the Landsat, MODIS and Sentinel-2 data over the full time period of analysis, from 2000 to 2018. We observed that the data collected from the different sensors show some differences. However, the results from all the sensors demonstrate increase in the inundation area during the months of increase in rainfall and decrease in months when there is decrease in rainfall (Figure 9).

3.4. Use of Support Vector Machine Regression (SVR) for Reconstructing Inundation Areas

The correspondence of inundation areas derived from Landsat and Sentinel-2 imagery is observed to be high (Figure 8b), as can be expected based on the high correlation (Pearson’s r = 0.91). Hence, we used the Landsat and Sentinel-2 data to train the MODIS data using the SVR approach.
Reconstructed values were obtained for inundation during all the months when images from MODIS were available. Inundated area values obtained from the sensors and reconstructed data are plotted in Figure 10 below. The MODIS data from the 105 image pairs are trained from the corresponding Landsat/Sentinel-2 data (Figure 10a, red dots) via SVM regression and the reconstructed data derived (Figure 10a, blue dots). There is a reduction in the variation in the reconstructed values compared to those from MODIS data (Figure 10b).
When the reconstructed data are plotted against time, the pattern of the data shows increases in the water-inundated area during the wet months and decreases during the dry months, when water flows only in the waterways, as is seen with the original data (Figure 11). This training approach ensures that data from more than one sensor can be used to generate a composite model of the inundation areas during all the months when data from at least one sensor is available.

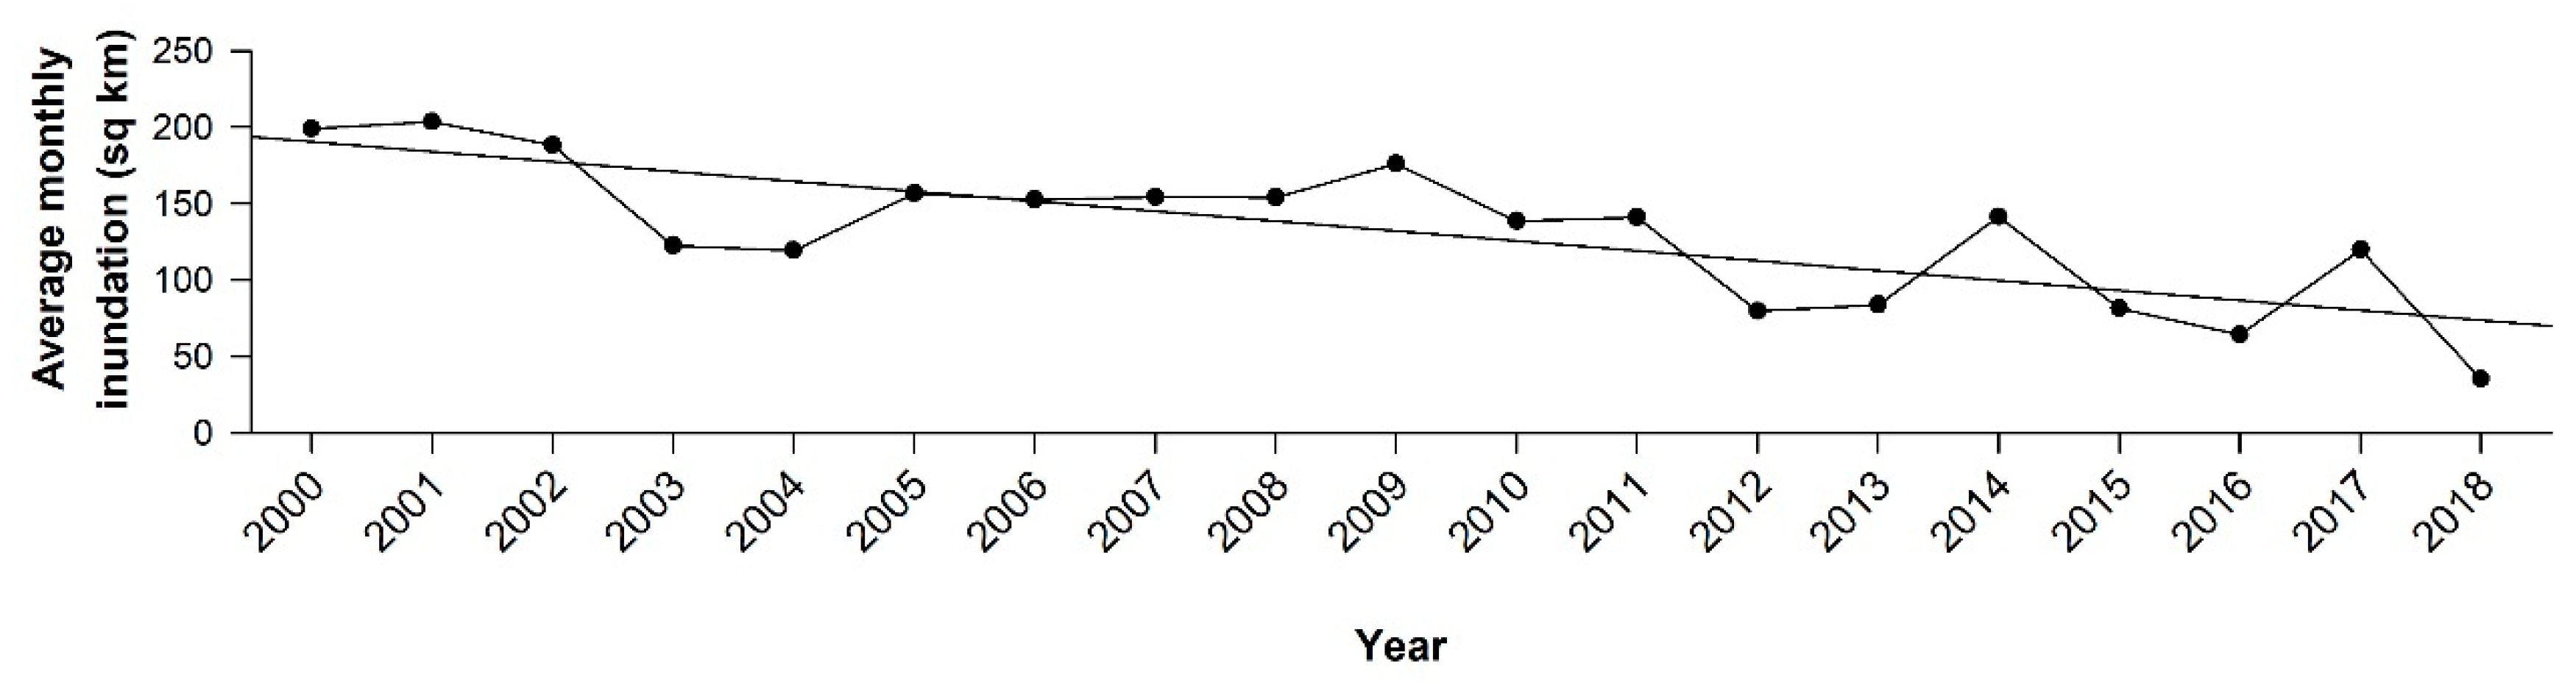
3.5. Trend of Inundation Areas in Can Tho City

During the years of the study, it was noted that the total inundation area has steadily decreased in Can Tho City. To better observe this, we obtained the average monthly inundation every year using the reconstructed SVR data (Figure 10). In the graph shown below (Figure 12), the average monthly inundated area (in square kilometers) reconstructed using Support Vector Machine technique is plotted on the y-axis against the respective years from 2000 to 2018 on the X-axis. The seasonal Mann-Kendall test was used to test this. The Mann-Kendall Tau was −0.1003, with a p value of 0.03. This indicates that the inundation decreased overall during the time period of the study. After the year 2000, the Vietnamese government invested more in the dyke system to increase agricultural production (rice) in Vietnamese Mekong Delta (VMD). This resulted in a general decrease in flooding area over the years. A similar pattern has been reported in studies conducted in the other parts of VMD, such as the Long Xuyen Quadrangle (LXQ), the Plains of Reeds (POR) and An Giang province of the Vietnamese Mekong delta [34]. Though it is not a direct validation, the similarity in the trends with the other regions provides the consistency in the effects after the investment in dyke systems from the year 2000.

4. Discussion

In this study, we analyzed images of Can Tho city from three different satellites (Landsat, MODIS and Sentinel-2) with varying temporal and spatial resolutions, and used a non-linear regression method—Support Vector Machine Regression—to integrate all the data an derive one single value. Here, we show that the correlation between data from different satellites is high, allowing for the training of the SVM to obtain inundation data for the period of 19 years, from 2000 to 2018. We also observe that the inundation area has been steadily decreasing over the years. Our results provide a proof-of-concept that machine learning algorithms like SVM can be successfully applied to combine data from different satellites to obtain one seamless inundation result that can be used for flood risk management. The results show that this can be completed with the use of freely available data and cloud computing platforms, thus allowing economically viable solutions for rapidly developing regions in South East Asia, such as those exemplified by Can Tho City.
Several studies have been carried out on flood risk assessment, via the use of satellite imagery. However, use of satellite data leads to the introduction of uncertainties. This is because of the different spatial and temporal resolutions of the satellite data. In addition, the failure of Landsat scan line corrector from May 2003 adds another layer of uncertainty, leading to lack of data for a certain period. These uncertainties are the epistemic uncertainties seen in flood risk assessment, that are introduced due to a lack of sufficient data and knowledge [71]. These uncertainties can be reduced by combining data from different satellites as we did in this study, and by using the power of machine learning to resolve these issues, which is a step in the right direction. While it is tempting to compare the data from our current study to historical flood extent data, this was not carried out, because the historical flood extent data are obtained from Landsat data, and thus cannot be compared here.
Here, we also showed that GEE can be used successfully to capture the inundated areas. The cloud computing capacity of GEE can be used to analyze massive amounts of data in a relatively short period of time. One other advantage is that the GEE platform provides data from different satellites under one platform. While GEE has mostly been used to detect changes in land cover, here, we used the engine to analyze data related to inundated regions. From the reconstructed average monthly inundation between the years 2000 and 2018, it is noted that there is a general decreasing trend. The possible reasons for this decreasing trend include urban expansion (i.e., urban built up area) and increase in the local flood protection systems [22,72]. Furthermore, more water is transferred to the middle of the Vietnamese Mekong Delta due to the upstream flood prevention systems and sea level rise. [27,73,74]. There is some uncertainty in the inundated area capture due to the cloud cover in some satellite imagery and the operation of sluice gates. However, the effect of this uncertainty on the long-term inundation pattern is minimized by using the data from three different satellites (Landsat, MODIS and Sentinel-2) and SVM regression approach.
The temporal resolution of MODIS satellite sensor is around two days, whereas the satellite revisit periods of Landsat and Sentinel-2 are 16 and five days respectively. Furthermore, Sentinel-2 data only became available from September 2015. Landsat sensor provided spotty images between 2003 and 2014. Data from Terra MODIS are therefore more frequently available than the other two sensors, although its spatial resolution is relatively low. Hence, the data were available for certain months from the three different sensors, but there are cases where the inundated area data are available only from MODIS. We used the SVM technique to integrate the three techniques to output a single inundation value, a reconstructed inundated area figure when two or three different figures are available.
Satellite remote sensing imagery derived data have been increasingly recognized as a critical source for identifying land features and changes in the land cover from time to time. There are several freely available satellite data sources and the user community, particularly engaged in flood risk management, could benefit from this open source data. Whilst there are differences in the temporal and spatial resolutions from different data sources, appropriate techniques could be applied to derive optimal advantage from this disparate sets of data. For example, advanced data science techniques like machine learning could be employed to “fill-in” the data gaps while using the available records from multiple sources. This information is quite useful in the sense that it helps provide an indicative reference information based on scientific methods. During floods, it is not uncommon that a robust mechanism is not always available or possible to capture the “ground-truth” or actual flood extent map [75]. This issue is prevalent in many Asian territories, including Vietnam. The reasons for this include the difficulties in logistics of field surveying, and issues with reaching inaccessible areas during or immediately after a flooding event [5].
In the absence of ground-truthing data, alternative methods such as the usage of crowdsourcing data (photographs), development and deployment of mobile applications for automatic inundated area detections and analyzing the information shared via social media platforms (e.g., geotagged images) can be considered [76]. The role of people living in the flooded areas is crucial for information dissemination about the flood event. They can help in verifying the data collected and contribute to the reports when flood detection sensors are not available.
The contribution from citizens and development of integrated platforms to collect and analyse the data can help in improving the granularity of the data, such as both the temporal and spatial resolutions, and can be an effective form of the validation of data from other sources like remote sensing satellites. Some good examples of such initiatives include WeSenseIt, Ground Truth 2.0, and FloodCitiSense projects funded by European Union [77]. The accretion of crowdsourcing data for understanding flooding events is vital, even more so when the events occur in urban regions. The limitations in the temporal resolution from remote sensing sensors can be overcome as the crowdsourcing information can be made immediately accessible. Furthermore, flood depth information can also be collected at various places of interest at regular intervals to augment the data from other sources [78].
The recent improvements in remote sensing and geographical information systems (GIS) technologies have paved the way for further innovations in natural disaster risk management, particularly in flood risk assessment, damage assessment and planning [79]. There could be newer machine learning methods or improvisations to potentially enhance the SVR going forward. Further studies in this direction are important.

5. Conclusions

Flooding in Can Tho City can cause huge economic losses and impact many lives. In this study, a cost-effective solution for the study of flood risk via the usage of freely available satellite imagery (Landsat, MODIS and Sentinel-2) was proposed. Google Earth Engine, a powerful satellite imagery data archival and computing platform, was used to derive the areal extents of the inundated area for every month over a period between the years 2000 and 2018. Support Vector Regression (SVR), a supervised machine learning algorithm has been used to reconstruct the water-inundated areas. This reconstruction allowed for the filling of the data gaps while considering the data uncertainties from different satellite sensors with various temporal and spatial resolutions. This also helped establish a relationship for identifying the flooding pattern over the years. The inundated area pattern allows the users to examine the trends in flooding and assess the flood risk. This is a useful technique which could be extended to several other SE Asian cities and provinces which are prone to flooding.
Remote sensing can provide spatially continuous data, unlike point measurements, from gauging stations, and this is especially useful in the case of long duration floods [80]. Satellite revisit time allows for flood monitoring at regular intervals without a physical presence at the location of flooding, especially when access is difficult. In addition, the remote sensing data are easy to access, and are rapidly processed. However, these data carry some limitations; the quality and applicability is subject to the spatial resolution and satellite repeat visit time. There is also scope for errors in identifying the flooded area based on the image processing algorithm used. If the revisit time of the satellite is longer, then the monitoring is not possible at short intervals of time [14]. Nevertheless, the advantages of these data far outweigh the disadvantages and with improved techniques and sensors, these disadvantages can be overcome.
In this study, we provided a proof-of-concept, showing that using machine learning algorithms can help integrate data from three different satellite sensors to derive one single integrated value, providing economically more feasible methods in regions of the world undergoing rapid growth. A small number of data pairs can be sufficient to do so, especially when techniques such as bootstrapping are utilized along with support vectors, as was carried out here. Since a greater number of MODIS images are available due to its relatively higher temporal resolution, we propose that Landsat and/or Sentinel-2 data can be used to train MODIS to derive the composite inundation values. In this way, the advantages of data from greater temporal and spatial resolution may be integrated by the researchers and other practitioners. Here, all the data and analytical tools we used are freely available. We hope that others can use similar methods to access data in places where field data are not easily available, but where the assessment of flood risk is critical for planning and development purposes.

Author Contributions

Conceptualization, S.D.; Data curation, S.D.; Formal analysis, S.D. and T.D.; Investigation, S.D.; Methodology, S.D. and T.D.; Project administration, S.D.; Resources, S.D.; Software, S.D. and T.D.; Supervision, X.X.L.; Validation, S.D.; Visualization, S.D., T.D. and K.P.; Writing—original draft, S.D.; Writing—review & editing, S.D., T. D. and K.P. All authors have read and agreed to the published version of the manuscript.

Funding

This research received no external funding.

Acknowledgments

We acknowledge the support from Van Pham Dang Tri, Can Tho University and Pham Thi Mai Thy, Vietnam National Space Centre for their support in connecting with the relevant research personnel and sharing the local knowledge. Thanks to Dunja Krause, United Nations Research Institute for Social Development (UNRISD) for allowing to use her pictures. We appreciate the support from Nguyen Hanh Quyen and her team at Asian Disaster Preparedness Centre, Thailand for sharing useful inputs related to Google Earth Engine. We finally thank the Google Earth Engine development team and community for their support through their forum.

Conflicts of Interest

The authors declare no conflict of interest.

References

  1. Alfieri, L.; Burek, P.; Feyen, L.; Forzieri, G. Global warming increases the frequency of river floods in Europe. Hydrol. Earth Syst. Sci. 2015, 19, 2247–2260. [Google Scholar] [CrossRef] [Green Version]
  2. Schiermeier, Q. Increased flood risk linked to global warming. Nature 2011, 470, 316. [Google Scholar] [CrossRef] [PubMed] [Green Version]
  3. Akstinas, V.; Meilutytė-Lukauskienė, D.; Kriaučiūnienė, J.; Šarauskienė, D. Features and causes of catastrophic floods in the Nemunas River basin. Hydrol. Res. 2019, 51, 308–321. [Google Scholar] [CrossRef]
  4. Sanyal, J.; Lu, X.X. Application of Remote Sensing in Flood Management with Special Reference to Monsoon Asia: A Review. Nat. Hazards 2004, 33, 19. [Google Scholar] [CrossRef]
  5. Rahman, M.R.; Thakur, P.K. Detecting, mapping and analysing of flood water propagation using synthetic aperture radar (SAR) satellite data and GIS: A case study from the Kendrapara District of Orissa State of India. Egypt. J. Remote Sens. Space Sci. 2018, 21, S37–S41. [Google Scholar] [CrossRef]
  6. Refice, A.; D’Addabbo, A.; Lovergine, F.P.; Tijani, K.; Morea, A.; Nutricato, R.; Bovenga, F.; Nitti, D.O. Monitoring Flood Extent and Area Through Multisensor, Multi-temporal Remote Sensing: The Strymonas (Greece) River Flood. In Flood Monitoring through Remote Sensing; Refice, A., D’Addabbo, A., Capolongo, D., Eds.; Springer: Berlin/Heidelberg, Germany, 2018. [Google Scholar] [CrossRef]
  7. Wang, X.; Xie, H. A Review on Applications of Remote Sensing and Geographic Information Systems (GIS) in Water Resources and Flood Risk Management. Water 2018, 10, 608. [Google Scholar] [CrossRef] [Green Version]
  8. Revilla-Romero, B.; Hirpa, F.; Pozo, J.; Salamon, P.; Brakenridge, R.; Pappenberger, F.; De Groeve, T. On the Use of Global Flood Forecasts and Satellite-Derived Inundation Maps for Flood Monitoring in Data-Sparse Regions. Remote Sens. 2015, 7, 15702–15728. [Google Scholar] [CrossRef] [Green Version]
  9. Arvind, C.S.; Vanjare, A.; Omkar, S.N.; Senthilnath, J.; Mani, V.; Diwakar, P.G. Flood Assessment using Multi-temporal Modis Satellite Images. Procedia Comput. Sci. 2016, 89, 575–586. [Google Scholar] [CrossRef] [Green Version]
  10. Rapinel, S.; Mony, C.; Lecoq, L.; Clément, B.; Thomas, A.; Hubert-Moy, L. Evaluation of Sentinel-2 time-series for mapping floodplain grassland plant communities. Remote Sens. Environ. 2019, 223, 115–129. [Google Scholar] [CrossRef]
  11. Mohd, M.I.S.; Mansor, M.A. Application of Remote Sensing and Hydrological Modelling in Flood Prediction Studies. Malays. J. Remote Sens. GIS 2000, 1, 91–98. [Google Scholar]
  12. Samarasinghe, S.M.J.S.; Nandalal, H.; Weliwitiya, D.P.; Fowze, J.S.; Hazarika, M.; Samarakoon, L. Application of Remote Sensing and GIS for flood risk analysis: A case study at Kalu-Ganga River, Sri Lanka. Int. Arch. Photogramm. Remote Sens. Spatial Inf. Sci. 2010, 38, 110–115. [Google Scholar]
  13. Giustarini, L.; Chini, M.; Hostache, R.; Pappenberger, F.; Matgen, P. Flood Hazard Mapping Combining Hydrodynamic Modeling and Multi Annual Remote Sensing data. Remote Sens. 2015, 7, 14200–14226. [Google Scholar] [CrossRef] [Green Version]
  14. Lin, L.; Di, L.; Yu, E.G.; Kang, L.; Shrestha, R.; Rahman, M.S.; Tang, J.; Deng, M.; Sun, Z.; Zhang, C.; et al. A review of remote sensing in flood assessment. In Proceedings of the 2016 5th International Conference on Agro-Geoinformatics, Agro-Geoinformatics 2016, Tianjin, China, 18–20 July 2016. [Google Scholar]
  15. Ticehurst, C.; Guerschman, J.; Chen, Y. The Strengths and Limitations in Using the Daily MODIS Open Water Likelihood Algorithm for Identifying Flood Events. Remote Sens. 2014, 6, 11791–11809. [Google Scholar] [CrossRef] [Green Version]
  16. Yang, X.; Qin, Q.; Grussenmeyer, P.; Koehl, M. Urban surface water body detection with suppressed built-up noise based on water indices from Sentinel-2 MSI imagery. Remote Sen. Environ. 2018, 219, 259–270. [Google Scholar] [CrossRef]
  17. Notti, D.; Giordan, D.; Caló, F.; Pepe, A.; Zucca, F.; Galve, J. Potential and Limitations of Open Satellite Data for Flood Mapping. Remote Sens. 2018, 10, 1673. [Google Scholar] [CrossRef] [Green Version]
  18. Maglione, P. Very High Resolution Optical Satellites: An Overview of the Most Commonly used. Am. J. Appl. Sci. 2016, 13, 91–99. [Google Scholar] [CrossRef] [Green Version]
  19. Yamazaki, D.; Trigg, M.A.; Ikeshima, D. Development of a global ~90m water body map using multi-temporal Landsat images. Remote Sens. Environ. 2015, 171, 337–351. [Google Scholar] [CrossRef]
  20. Mueller, N.; Lewis, A.; Roberts, D.; Ring, S.; Melrose, R.; Sixsmith, J.; Lymburner, L.; McIntyre, A.; Tan, P.; Curnow, S.; et al. Water observations from space: Mapping surface water from 25 years of Landsat imagery across Australia. Remote Sens. Environ. 2016, 174, 341–352. [Google Scholar] [CrossRef] [Green Version]
  21. Tulbure, M.G.; Broich, M. Spatiotemporal dynamic of surface water bodies using Landsat time-series data from 1999 to 2011. ISPRS J. Photogramm. Remote Sens. 2013, 79, 44–52. [Google Scholar] [CrossRef]
  22. Thy, P.T.M.; Raghavan, V.; Pawar, N.J. Urban expansion of Can Tho City, Vietnam: A study based on multi-temporal satellite images. Geoinformatics 2010, 21, 13. [Google Scholar]
  23. Mountrakis, G.; Im, J.; Ogole, C. Support vector machines in remote sensing: A review. ISPRS J. Photogramm. Remote Sens. 2011, 66, 247–259. [Google Scholar] [CrossRef]
  24. Nandi, I.; Srivastava, P.K.; Shah, K. Floodplain Mapping through Support Vector Machine and Optical/Infrared Images from Landsat 8 OLI/TIRS Sensors: Case Study from Varanasi. Water Resour. Manag. 2017, 31, 1157–1171. [Google Scholar] [CrossRef]
  25. Roli, F.; Fumera, G. Support Vector Machines for Remote-Sensing Image Classification. In Proceedings of the Europto Remote Sensing, Barcelona, Spain, 25–27 September 2001; pp. 160–166. [Google Scholar]
  26. Hoang, L.P.; Biesbroek, R.; Tri, V.P.D.; Kummu, M.; van Vliet, M.T.H.; Leemans, R.; Kabat, P.; Ludwig, F. Managing flood risks in the Mekong Delta: How to address emerging challenges under climate change and socioeconomic developments. Ambio 2018, 47, 635–649. [Google Scholar] [CrossRef] [PubMed] [Green Version]
  27. Balica, S.; Dinh, Q.; Popescu, I.; Vo, T.Q.; Pham, D.Q. Flood impact in the Mekong Delta, Vietnam. J. Maps 2013, 10, 257–268. [Google Scholar] [CrossRef]
  28. Ninh, N.H.; Trung, V.K.; Niem, N.X. Flooding in Mekong River Delta, Vietnam. Hum. Dev. Rep. 2007, 2008, 23. [Google Scholar]
  29. OCHA-ROAP; UNEP/GRID-Europe. Flooding Risk in Asia-Pacific. Available online: https://www.preventionweb.net/files/23470_ocharoapfloodsv6110501.pdf (accessed on 8 July 2019).
  30. Neumann, L.; Nguyen, M.; Moglia, M.; Cook, S.; Lipkin, F. Urban Water Systems in Can Tho, Vietnam: Understanding the Current Context for Climate Change Adaption Climate Adaptation through Sustainable Urban Development; CSIRO Land & Water: Highett, Australia, 2011. [Google Scholar]
  31. Moglia, M.; Neumann, L.E.; Alexander, K.S.; Nguyen, M.N.; Sharma, A.K.; Cook, S.; Trung, N.H.; Tuan, D.D.A. Application of the Water Needs Index: Can Tho City, Mekong Delta, Vietnam. J. Hydrol. 2012, 468–469, 203–212. [Google Scholar] [CrossRef] [Green Version]
  32. Central Population and Housing Census Steering Committee VietNam. Selected Key Indicators The Vietnam Population and Housing Census, 00:00 Hours on 1st April 2019; Central Population and Housing Census Steering Committee VietNam: Ha Noi, VietNam, 2019. [Google Scholar]
  33. Office of the People’s Committee of Can Tho City. Can Tho Portal. Available online: https://www.cantho.gov.vn/wps/portal/home/en/Tourism/!ut/p/z1/04_Sj9CPykssy0xPLMnMz0vMAfIjo8ziLQy8XQ29TIx8DCwcDQwCLcLcPD0c3Y0MXIz0C7IdFQGsFvtY/ (accessed on 24 April 2020).
  34. Dang, T.D.; Cochrane, T.A.; Arias, M.E.; Van, P.D.T.; de Vries, T.T. Hydrological alterations from water infrastructure development in the Mekong floodplains. Hydrol. Process. 2016, 30, 3824–3838. [Google Scholar] [CrossRef]
  35. Ling, F.H.; Tamura, M.; Yasuhara, K.; Ajima, K.; Trinh, C.V. Reducing flood risks in rural households: Survey of perception and adaptation in the Mekong delta. Clim. Chang. 2015, 132, 209–222. [Google Scholar] [CrossRef]
  36. Triet, N.V.K.; Dung, N.V.; Fujii, H.; Kummu, M.; Merz, B.; Apel, H. Has dyke development in the Vietnamese Mekong Delta shifted flood hazard downstream? Hydrol. Earth Syst. Sci. 2017, 21, 3991–4010. [Google Scholar] [CrossRef] [Green Version]
  37. Hecht, J.S.; Lacombe, G.; Arias, M.E.; Dang, T.D.; Piman, T. Hydropower dams of the Mekong River basin: A review of their hydrological impacts. J. Hydrol. 2019, 568, 285–300. [Google Scholar] [CrossRef]
  38. Huong, H.T.L.; Pathirana, A. Urbanization and climate change impacts on future urban flooding in Can Tho city, Vietnam. Hydrol. Earth Syst. Sci. 2013, 17, 379–394. [Google Scholar] [CrossRef] [Green Version]
  39. Danh, V. Household Economic Losses of Urban Flooding: Case of Can Tho City, Vietnam; Southeast Asia Review of Economics and Business: London, UK, 2014; p. 40. [Google Scholar]
  40. Zhang, F.; Zhu, X.; Liu, D. Blending MODIS and Landsat images for urban flood mapping. Int. J. Remote. Sens. 2014, 35, 3237–3253. [Google Scholar] [CrossRef]
  41. Qi, S.; Brown, D.G.; Tian, Q.; Jiang, L.; Zhao, T.; Bergen, K.M. Inundation Extent and Flood Frequency Mapping Using LANDSAT Imagery and Digital Elevation Models. GIScience Remote Sens. 2013, 46, 101–127. [Google Scholar] [CrossRef]
  42. Nguyen, U.N.T.; Pham, L.T.H.; Dang, T.D. An automatic water detection approach using Landsat 8 OLI and Google Earth Engine cloud computing to map lakes and reservoirs in New Zealand. Environ. Monit. Assess. 2019, 191, 235. [Google Scholar] [CrossRef]
  43. Kumar, L.; Mutanga, O. Google Earth Engine Applications Since Inception: Usage, Trends, and Potential. Remote Sens. 2018, 10, 1509. [Google Scholar] [CrossRef] [Green Version]
  44. Gorelick, N.; Hancher, M.; Dixon, M.; Ilyushchenko, S.; Thau, D.; Moore, R. Google Earth Engine: Planetary-scale geospatial analysis for everyone. Remote Sens. Environ. 2017, 202, 18–27. [Google Scholar] [CrossRef]
  45. Phongsapan, K.; Chishtie, F.; Poortinga, A.; Bhandari, B.; Meechaiya, C.; Kunlamai, T.; Aung, K.S.; Saah, D.; Anderson, E.; Markert, K.; et al. Operational Flood Risk Index Mapping for Disaster Risk Reduction Using Earth Observations and Cloud Computing Technologies: A Case Study on Myanmar. Front. Environ. Sci. 2019, 7. [Google Scholar] [CrossRef] [Green Version]
  46. Uddin; Matin; Meyer. Operational Flood Mapping Using Multi-Temporal Sentinel-1 SAR Images: A Case Study from Bangladesh. Remote Sens. 2019, 11, 1581. [Google Scholar] [CrossRef] [Green Version]
  47. Sidhu, N.; Pebesma, E.; Câmara, G. Using Google Earth Engine to detect land cover change: Singapore as a use case. Eur. J. Remote. Sens. 2018, 51, 486–500. [Google Scholar] [CrossRef]
  48. Celik, N. Change Detection of Urban Areas in Ankara through Google Earth Engine. In Proceedings of the 41st International Conference on Telecommunications and Signal Processing (TSP), Athens, Greece, 4–6 July 2018; pp. 1–5. [Google Scholar]
  49. Nguyen, N.; Nguyen, M.; Trung, N. Application of GIS and Remote Sensing for assessing changes of built-up areas in Can Tho City from 1988 to 2018. In Proceedings of the ESRI International Conference 2019, Ho Chi Minh City, Vietnam, 15 November 2019. [Google Scholar]
  50. Goldblatt, R.; You, W.; Hanson, G.; Khandelwal, A. Detecting the Boundaries of Urban Areas in India: A Dataset for Pixel-Based Image Classification in Google Earth Engine. Remote Sens. 2016, 8, 634. [Google Scholar] [CrossRef] [Green Version]
  51. Gao, B.-C. NDWI—A normalized difference water index for remote sensing of vegetation liquid water from space. Remote Sens. Environ. 1996, 58, 257–266. [Google Scholar] [CrossRef]
  52. McFeeters, S.K. The use of the Normalized Difference Water Index (NDWI) in the delineation of open water features. Int. J. Remote. Sens. 1996, 17, 1425–1432. [Google Scholar] [CrossRef]
  53. Acharya, T.D.; Subedi, A.; Lee, D.H. Evaluation of Water Indices for Surface Water Extraction in a Landsat 8 Scene of Nepal. Sensors 2018, 18. [Google Scholar] [CrossRef] [PubMed] [Green Version]
  54. Ahamed, A.; Bolten, J.D. A MODIS-based automated flood monitoring system for southeast asia. Int. J. Appl. Earth Obs. Geoinf. 2017, 61, 104–117. [Google Scholar] [CrossRef] [Green Version]
  55. Claverie, M.; Ju, J.; Masek, J.G.; Dungan, J.L.; Vermote, E.F.; Roger, J.-C.; Skakun, S.V.; Justice, C. The Harmonized Landsat and Sentinel-2 surface reflectance data set. Remote Sens. Environ. 2018, 219, 145–161. [Google Scholar] [CrossRef]
  56. Hossain, M.S.; Bujang, J.S.; Zakaria, M.H.; Hashim, M. Assessment of Landsat 7 Scan Line Corrector-off data gap-filling methods for seagrass distribution mapping. Int. J. Remote. Sens. 2015, 36, 1188–1215. [Google Scholar] [CrossRef]
  57. Chen, F.; Zhao, X.; Ye, H. Making Use of the Landsat 7 SLC-off ETM+ Image Through Different Recovering Approaches. Data Acquis. Appl. 2012. [Google Scholar] [CrossRef] [Green Version]
  58. Dhanotia, R.; Singh, S. A Survey of Image Classification Techniques for Flood Monitoring System. In Proceedings of the International Conference on Emerging Trends in Computer and Image Processing (ICETCIP’2014), Pattaya, Thailand, 15–16 December 2014. [Google Scholar]
  59. Suykens, J.A.K.; Vandewalle, J. Least Squares Support Vector Machine Classifiers. Neural Process. Lett. 1999, 9, 293–300. [Google Scholar] [CrossRef]
  60. Ireland, G.; Volpi, M.; Petropoulos, G. Examining the Capability of Supervised Machine Learning Classifiers in Extracting Flooded Areas from Landsat TM Imagery: A Case Study from a Mediterranean Flood. Remote Sens. 2015, 7, 3372–3399. [Google Scholar] [CrossRef] [Green Version]
  61. Syifa, M.; Park, S.J.; Achmad, A.R.; Lee, C.-W.; Eom, J. Flood Mapping Using Remote Sensing Imagery and Artificial Intelligence Techniques: A Case Study in Brumadinho, Brazil. J. Coast. Res. 2019, 90, 197–204. [Google Scholar] [CrossRef]
  62. Gizaw, M.S.; Gan, T.Y. Regional Flood Frequency Analysis using Support Vector Regression under historical and future climate. J. Hydrol. 2016, 538, 387–398. [Google Scholar] [CrossRef]
  63. Chen, S.-T.; Yu, P.-S. Real-time probabilistic forecasting of flood stages. J. Hydrol. 2007, 340, 63–77. [Google Scholar] [CrossRef]
  64. Mosavi, A.; Ozturk, P.; Chau, K.-w. Flood Prediction Using Machine Learning Models: Literature Review. Water 2018, 10, 1536. [Google Scholar] [CrossRef] [Green Version]
  65. Granata, F.; Gargano, R.; Marinis, G.d. Support Vector Regression for Rainfall-Runoff Modeling in Urban Drainage: A Comparison with the EPA’s Storm Water Management Model. Water 2016, 8, 69. [Google Scholar]
  66. Davison, A.C.; Hinkley, D.V. Bootstrap Methods and their Application; Cambridge University Press: Cambridge, UK, 1997. [Google Scholar] [CrossRef]
  67. Meyer, D.; Dimitriadou, E.; Hornik, K.; Weingessel, A.; Leisch, F. e1071: Misc Functions of the Department of Statistics, Probability Theory Group (Formerly: E1071); TU Wien: Vienna, Austria, 2019. [Google Scholar]
  68. R Core Team. R: A Language and Environment for Statistical Computing; R Foundation for Statistical Computing: Vienna, Austria, 2019. [Google Scholar]
  69. Boot: Bootstrap R (S-Plus) Functions. R package version 1.3-25. Available online: https://cran.r-project.org/web/packages/boot/boot.pdf (accessed on 28 May 2020).
  70. Coltin, B.; McMichael, S.; Smith, T.; Fong, T. Automatic boosted flood mapping from satellite data. Int. J. Remote. Sens. 2016, 37, 993–1015. [Google Scholar] [CrossRef] [Green Version]
  71. Apel, H.; Merz, B.; Thieken, A.H. Quantification of uncertainties in flood risk assessments. Int. Int. J. River Basin Manag. 2008, 6, 149–162. [Google Scholar] [CrossRef] [Green Version]
  72. Thy, P.T.M.; Raghavan, V. Monitoring the effect of land cover change on urban inundation by remote sensing and GIS technique in Can Tho City, Vietnam. In Proceedings of the 34th Asian Conference on Remote Sensing (ACRS 2013), Bali, Indonesia, 20–24 October 2013; Asian Association of Remote Sensing: Tokyo, Japan, 2013; pp. 1806–1815. [Google Scholar]
  73. Apel, H.; Trepat, O.M.; Hung, N.N.; Chinh, D.T.; Merz, B.; Dung, N.V. Combined fluvial and pluvial urban flood hazard analysis: Method development and application to Can Tho City, Mekong Delta, Vietnam. Nat. Hazards Earth Syst. Sci. Discuss. 2015, 3, 4967–5013. [Google Scholar] [CrossRef]
  74. Dang, T.D.; Cochrane, T.A.; Arias, M.E.; Tri, V.P.D. Future hydrological alterations in the Mekong Delta under the impact of water resources development, land subsidence and sea level rise. J. Hydrol. Reg. Stud. 2018, 15, 119–133. [Google Scholar] [CrossRef]
  75. Eilander, D.; Trambauer, P.; Wagemaker, J.; van Loenen, A. Harvesting Social Media for Generation of Near Real-time Flood Maps. Procedia Eng. 2016, 154, 176–183. [Google Scholar] [CrossRef] [Green Version]
  76. See, L. A Review of Citizen Science and Crowdsourcing in Applications of Pluvial Flooding. Frontiers in Earth Science 2019, 7. [Google Scholar] [CrossRef] [Green Version]
  77. McCrory, G.; Veeckman, C. D1.1 FloodCitiSense Conceptual and Methodological Framework; Vrije Universiteit Brussel: Brussels, Belgium, 2017. [Google Scholar] [CrossRef]
  78. Hultquist, C.; Cervone, G. Integration of Crowdsourced Images, USGS Networks, Remote Sensing, and a Model to Assess Flood Depth during Hurricane Florence; MDPI AG: Basel, Switzerland, 2020; Volume 12, p. 834. [Google Scholar]
  79. Tehrany, M.S.; Pradhan, B.; Jebur, M.N. Spatial prediction of flood susceptible areas using rule based decision tree (DT) and a novel ensemble bivariate and multivariate statistical models in GIS. J. Hydrol. 2013, 504, 69–79. [Google Scholar] [CrossRef]
  80. Liew, S.C.; Gupta, A.; Chia, A.S.; Ang, W.C. The flood of 2011 in the lower Chao Phraya valley, Thailand: Study of a long-duration flood through satellite images. Geomorphology 2016, 262, 112–122. [Google Scholar] [CrossRef]
Figure 1. Lower Mekong Basin (left figure) in South-East Asia; Study Area Can Tho City (highlighted in the right figure).
Water 12 01543 g001
Figure 2. Tra Noc Industrial Zone in Can Tho City. The zone is home to industrial firms producing electronic, food processing, automotive, construction materials and pharmaceutical products.
Water 12 01543 g002
Figure 3. An industrial building under construction in Can Tho City.
Water 12 01543 g003
Figure 4. (ad) Photographs showing the different inundated areas in Can Tho City during the floods in the year 2014 (Courtesy: Dr Dunja Krause, United Nations Research Institute for Social Development (UNRISD, Geneva, Switzerland).
Water 12 01543 g004
Figure 5. False color Landsat imagery showing the study area during (a) cloud cover (b) scan line collector failure (c) dry season (d) flood season.
Water 12 01543 g005
Figure 6. False color Terra Moderate Resolution Imaging Spectroradiometer (MODIS) image showing the study area during (a) dry season and (b) flood season.
Water 12 01543 g006
Figure 7. False color Sentinel-2 image showing the study area during (a) dry season and (b) flood season.
Water 12 01543 g007
Figure 8. Correlation of inundation data between different sensors. Monthly inundated area captured from one sensor is plotted on the x-axis and the other is plotted along the y-axis. (a) Left picture: Landsat and MODIS Sensors; (b) Middle picture: Landsat and Sentinel-2 Sensors and (c) Right picture: MODIS and Sentinel-2 Sensors.
Water 12 01543 g008
Figure 9. Seasonal variations in water levels observed by different sensors Landsat (red), Terra MODIS (blue) and Sentinel-2 (pink).
Water 12 01543 g009
Figure 10. Reconstructed data from Support Vector Machine Regression (SVR) analysis (a). Comparison of image pairs used for Support Vector Machine (SVM) regression analysis and reconstructed data. The 105 image pairs used to train the SVM regression model are plotted in red and the SVR results are plotted in blue. The x-axis indicates original inundated area in sq km derived from Terra MODIS and y-axis indicates inundated area data in sq km from Landsat/Sentinel-2 (for the red dots) and from reconstructed data (for the blue dots); (b). Box plots showing the inundated area in square kilometers from Terra MODIS sensor (left) and the reconstructed value (right). The y-axis shows inundated area (MODIS data and reconstructed values) in sq km.
Water 12 01543 g010
Figure 11. Reconstructed area of flood inundation using support vector machine regression (black).
Water 12 01543 g011
Figure 12. The reconstructed average monthly inundation area in Can Tho City from 2000 to 2018. Inundation is decreasing over time similar to that observed in other parts of the Vietnamese Mekong Delta [34].
Water 12 01543 g012

