A Systems Approach to Municipal Water Portfolio Security: A Case Study of the Phoenix Metropolitan Area

1
School of Informatics, Computing, and Cyber Systems, Northern Arizona University, Flagstaff, AZ 86011, USA
2
ICF, 9300 Lee Highway, Fairfax, VA 22031, USA
*
Author to whom correspondence should be addressed.
Water 2020, 12(6), 1663; https://0-doi-org.brum.beds.ac.uk/10.3390/w12061663
Submission received: 23 April 2020
/
Revised: 23 May 2020
/
Accepted: 29 May 2020
/
Published: 10 June 2020
(This article belongs to the Special Issue Application of the Systems Approach to the Management of Complex Water Systems)
Abstract
:We present a rigorous quantitative, systems-based model to measure a municipality’s water portfolio security using four objectives: Sustainability, Resilience, Vulnerability, and Cost (SRVC). Water engineers and planners can operationalize this simple model using readily available data to capture dimensions of water security that go far beyond typical reliability and cost analysis. We implement this model for the Phoenix Metropolitan Area under several scenarios to assess multi-objective water security outcomes at the municipal-level and metropolitan area-level to water shocks and drought. We find the benefits of adaptive water security policies are dependent on a municipality’s predominant water source, calling for a variegated approach to water security planning across a tightly interrelated metropolitan area. Additionally, we find little correlation between sustainability, resilience, and vulnerability versus cost. Therefore, municipalities can enhance water security along cost-neutral, adaptive policy pathways. Residential water conservation and upstream flow augmentation are cost-effective policies to improve water security that also improve sustainability, resilience, and vulnerability and are adequate adaptations to a short-term Colorado River shortage. The Phoenix Metropolitan Area’s resilience to drought is higher than that of any of its constituent municipalities, underscoring the benefits of coordinated water planning at the metropolitan area-level.
1. Introduction
Facing growing urban water demand and nonstationary water availability due to climate change, a key challenge for municipal water planning is the development of theoretically and empirically robust frameworks that are actionable for decision-making [1]. Metropolitan areas (MAs) complicate water security planning for multiple reasons. Municipalities within a MA may differ in history, political and economic power or structure, or demographics or have distinct locational advantages within the conurbation. Consequently, these municipal characteristics may influence water rights seniority, the ability to finance or build new infrastructure, acquire new water rights, or receptivity toward water resource cooperation. These conditions create the potential for zero-sum water decisions amongst municipalities within a MA. Further, water provision may occur through a mixture of private, public, and quasi-public water utilities that may not align with municipal boundaries [2], adding complexity to water portfolio planning. Therefore, water portfolio security is a systems-level characteristic manifest at multiple adaptive decision scales from the municipal scale to the MA scale.
Traditionally, cost has been the dominant criterion for assessing water portfolios—subject to minimum water quality and reliability criteria. This standard approach, while broadly successful, struggles in the presence of confounding factors. First, decision pathway externalities—i.e., one agent’s choice changes the landscape of available choices for other agents or create irreversible, non-resilient, locked-in infrastructure pathways [3,4]. Second, discounting future economic and social costs using time-value-of-money accounting fails to account for sustainability considerations fully. Third, non-market benefits are difficult to monetize or undervalued—e.g., natural climate and nature-based solutions [5,6], ecosystem services, green infrastructure solutions with multiple benefits, and the risk to human life from critical water infrastructure failure. Fourth, Knightian risks arising from a nonstationary shifting climate, inaccurate actuarial data, or the occurrence of unforeseeable Black Swan disasters belie traditional cost and reliability metrics [7]. Finally, standard methods break down when there are multiple independent planning timescales and decision boundaries. When we neglect these confounding factors, we develop water portfolios biased toward cost efficiency and presume rational technocratic decision-making at the expense of increased vulnerability, along with decreased sustainability and resilience [8,9,10].
Generality, transferability, simplicity, and communicability have limited the impact of water portfolio options modeling [11]. Previous work evaluating water portfolios options have developed precise plans for efficient long-term capital infrastructure investments but rely on elaborate modeling and require highly-detailed past, current, and forecasted financial and engineering data [3,11,12,13,14]. Others have evaluated the reliability, resilience, and vulnerability of water systems [15]. By contrast, other water portfolio options models de-emphasize long-term prediction and instead emphasize flexible, short-term adaptation [16], which has the practical benefit of (1) having lightweight requirements for data and inputs that are already available in most municipalities and (2) no requirement for accurate prediction of the long-term future.
For robust water portfolio security planning, precise systems-level metrics of sustainability, resilience, and vulnerability must complement and contextualize traditional financial costs and engineering reliabilities. Toward this end, we propose augmenting the standard cost-based (C) approach with sustainability (S), resilience (R), and vulnerability (V) metrics: This is the SRVC model for quantitative, systems-based water portfolio options analysis. We quantify sustainability as the length of time a water portfolio can provide water before a stress event transitions to a water shock or triggers adaptation. We use an ecologically based approach of source diversity to measure water resources portfolio resilience [17] that we define as the ability of a water system to function while enduring internal or external change [18]. Our short-term, event driven approach is in contrast to water portfolio planning studies that have focused on long-term optimization to meet reliability goals [19] and planning under uncertainty [20]. We measure vulnerability as a municipality-specific demand-to-availability metric [21] that measures demand to total available municipal water allocation—i.e., pressure on a municipality’s legal water allocation. We calculate costs as the net of benefits and costs to acquire and convey new water sources and ecosystem services. Finally, as our framework only measures the outcome of water portfolio configurations, we assume municipalities comply with standards and regulations in all scenarios.
We have developed the SRVC model to provide a short-term, event-driven, policy-based complement to long-term predictive water portfolio planning. Using the SRVC model, we assess water security in the Phoenix metropolitan area (PMA) across SRVC metrics in response to multiple short-term water shock scenarios. Since the SRVC model is inherently a multiscale, systems-based approach, we assess water security at two scales: the municipal scale for 12 PMA municipalities and at the MA scale. We developed ten scenarios to evaluate different Phoenix SRVC configurations and answer the following research questions: (1) How long can a municipality or the MA sustain day-to-day water supply in response to a supply shock? (2) What is the diversity and resilience of available water options to municipalities and the MA? (3) How does vulnerability to a shock differ among individual municipalities and the MA as a whole? (4) How might municipalities develop cost-neutral/affordable policy options that are more sustainable, resilient, and less vulnerable?
2. Materials and Methods
2.1. Water SRVC Model Data Requirements
Information for decision-making has a cost. Collecting data and building decision support models are expensive, and fully dynamic, detailed systems modeling is potentially cost prohibitive for typical municipal water decision-makers. Moreover, there are disadvantages to dynamic complex systems modeling: in the presence of feedback and imprecise input data, errors can propagate and prevent robust predictions [22]. As a result, lower-dimensional models have significant advantages in terms of cost and robustness for complex systems. The SRVC model is not a dynamic systems model, but it is a systems model that captures the basic system geometry and decision/adaptive pathway constraints. Table 1 presents decision agent (municipality) data requirements for the SRVC model.
2.2. Measuring Shock, Stress, Sustainability, Vulnerability, and Adaptation
Water SRVC model results rely explicitly on the system decision and an adaptation period, Δt. A system’s Δt is the time constraint for adaptive policy decision making; it is a discrete interval related to the duration of extreme events and disturbances, the velocity of adaptive policy and infrastructure decisions to cope with the stress, system storage capacity at customary usage rates, and the sustainability of alternative system states or adaptive options. Available adaptive options within the decision timeframe, such as switching to groundwater storage credits to deal with short term drought, are endogenized in the calculation of system resilience and vulnerability. Adaptive options unavailable within the decision timeframe, such as building a new desalination plant to respond to a one-year drought, are exogenized and considered alongside other exogenous drivers in long-term planning scenario development. Stress becomes shock if demand exceeds total online capacity, after adaptive options are exercised.
The Δt therefore determines the set of viable adaptive options we consider. For the Water SRVC model, Δt is 1 year, which excludes adaptive options that are unsustainable beyond that timeframe (Sustainability S < Δt is unsustainable), such as reliance on a three-day reservoir to adapt to a one-year drought. A one-year Δt focuses water stress events to unplanned failure of a major water supply infrastructure—e.g., canal or dam failure, or policy decision, or forest fire, or an extreme drought lasting between one and several years that triggers a mandated water curtailment. The 1-year timeframe also matches the reporting period for municipal water data and storage capacity of surface water reservoirs, and annual groundwater usage is insignificant compared to aquifer storage at this . A decadal or centurial would change these considerations significantly as groundwater storage exhaustion is relevant water shock, and major infrastructural reworking is an adaptive option. Additionally, at that surface, water drought may be relevant, depending on drought duration. In this SRVC model case study, adaptive options that have a year are viable such as purchasing new permanent water rights or developing new physical water supply infrastructure. These adaptive options take much longer than Δt to implement because acquiring and utilizing long-term water rights has capital costs and/or legal and construction time delays, which make responding to a one-year water emergency infeasible. Similarly, a seasonal or daily Δt yields a different adaptive option portfolio and changes water security considerations by emphasizing operational measures, engineering reliability standards, and emergency management. Naturally, municipalities must develop adaptive options for all Δt, which is why the SRVC model explicitly considers timescale.
We now present a simple visual derivation to illustrate how to determine Δt and related quantities (Figure 1). This time plot begins with an initial time t0 when the system departs from a prior equilibrium state and te is the time (t) elapsed since t0: Both capacity and demand “ramp” at average rates (or slopes) and . When Demand (D) approaches Capacity () from below, the system becomes increasingly stressed and increasingly vulnerable to disruptions in capacity. When the Magnitude (M) of D exceeds C, a deficit (F) exists (, for positive ), a functionally damaging shock () ensues that reduces function by some percentage (i.e., corresponds to 50% damage to function). The shock point in time () and magnitude () exists where the capacity and demand curves are equal. A shock point can occur for multiple reasons—canal or dam failure, or policy decision, or forest fire, as mentioned previously—and could cause a supply shock, demand shock, or both. After the shock begins, real demand drops to meet capacity, at the cost of degraded function. Degradation persists until time tx, when function returns to normal after a shock creating a deficit ; the duration of this shock is tr: tr = tx − tk, for positive tr. The Vulnerability () of the system to shock is indexed as the ratio of demand to capacity (DTC = D/C), and the ratio for a shock of severity is .
The sustainability (S) of this system state may be estimated as the length of time (t) before a shock ensues (, where at ). By convention we choose the initial to define the system’s sustainability. Over the long term as becomes large, capacity must adapt (or ramp) at least as fast as demand () or demand must decrease to adapt to new capacity constraints () to support sustainable system function without shocks (Equation (1)). Over the short term, a Buffer (), (, for positive ), allows demand to increase faster than capacity until the buffer is exhausted at . Buffers and capacity include excess capacity and reservoirs (see Section 2.3 below).
This geometry yields notable findings that we now discuss. Buffers are the key to absorbing unexpected increases in DTC, but they can also breed complacency in adaptive decision making because stress can become shock when and . If we do not sense that we are consuming a buffer, shocks appear by surprise after demand overshoots the carrying capacity; this is the essence of classic sustainability models [23]. If we fail at t0 to take adaptive action to ramp up capacity and/or ramp down demand, this delay increases DTC, decreases buffer, and eliminates some of our adaptive options because we have less time. In this way, the SRVC model definition of sustainability comports with the classic Brundtland Report sustainability definition [24]. Sustainability of a water resource or water portfolio decreases when , which can occur if outstrips to exhaust , if becomes negative relative to a constant to exhaust , or adaptation occurs too late, and becomes greater than . By definition, if any these conditions occur, system function would degrade for current and future generations.
2.3. The Components of Municipal Water Portfolio Adaptive Capacity
A municipality’s capacity is the lesser of demand or the capacity of the system’s hydrologic, legal, infrastructural, financial, and economic components. There are five qualitatively different measures of water capacity available to a municipality from each independent water source () during a . First, Total Online Capacity () is available without significant capital cost or delay, including both the utilized and unutilized (or available) capacities, with capital cost judged relative to marginal operating cost, and delay relative to Δt. Second, Online Capacity () is the utilized portion of capacity from the source and is available without capital cost or delay. Third, Available Capacity () is the unutilized capacity from a source and is available without significant capital cost or time delay relative to the time constant; reservoirs are usually of this type. Fourth, Potential Capacity () is capacity from an existing or new source available with a delay shorter than the adaptation period but with significant, non-negligible cost. Fifth, Adaptive Capacity () for a water source is and is all water supply available during the adaptation period, which may or may not have a time delay and/or capital costs. These five water capacity metrics are interrelated for each municipality and for each scenario. We only consider a single adaptation period in this paper, but for serial adaptations , each adaptation depends on previous adaptations. At this point, the SRVC model begins to resemble the pathway mathematics [4,14]. Equation (2) and Figure 2 show the relationship between municipal water capacity metrics.
For scenario (), the subscript zero () represents the baseline or equilibrium water supply portfolio at the start of the decision timeframe (BASE scenario), and subscript one () represents the post-adaptation water supply portfolio at the end of Δt. The Supplemental Information contains , , and scenario data for the Phoenix Metropolitan Area (Tables S1–S7 in supplementary materials).
For a metropolitan area, the total online capacity across all cities for the metropolitan area is,
If Total Online Capacity exceeds Demand at current water prices (C ≥ D) after a scenario’s curtailments or supply shortages, we assume no development of potential capacity, P, because a municipality, in order to meet a short-term demand shock, would not expend capital to bring online potential sources meant for meeting long-term demand growth. However, if C < D, then a structural water deficit (positive F = D − C) exists, such that a municipality must bring P online, beginning with the lowest cost P. Within the SRVC model, municipalities share P proportionally to structural water deficit magnitude. If F is positive, the lowest cost adaptation may be the conversion of pre-adaptation available sources A0 into post-adaptation sources UA1, which shrinks post-adaptation available sources A1 such that A1 = A0 − UA1. If A1 > F0, the utilized portion of the potential supply after adaptation, , is set equal to the deficit, such that , and . If , the post-adaptation Shock Deficit . After adaptation, the municipality’s utilization is , its capacity is , and its options are . Bringing P online strands capital cost with exception for leasing water rights.
Measuring Municipal Water Portfolio Adaptive Resilience
We need to adopt a diversification-based approach to resilience based on keeping as many independent options as possible open [25]. Premature commitment or investment in a backup water source may backfire if that source becomes compromised, stranding valuable capital, and damaging our financial capacity to adapt further [4,11]. Reversibility that avoids long-term commitment, and retains a diversity of independent options, creates resilience. This definition of resilience mirrors existing definitions of ecological resilience that implement a normalized Shannon diversity index (R) to measure structural diversity [17]. Using this definition, municipal water portfolio resilience to a water stress event depends on the number of independent water sources that are online and accessible during an event and on the relative abundance of those sources (Figure 3) and thus maintain function while enduring external shocks [18]. A municipality with only one water source and no potential options for new sources during an unexpected water stress event has no resilience to that event, regardless of how sustainable, abundant, and cost effective that source may be. In this model, resilience is therefore a measure of the ability to maintain flexible decision options during current and future events.
In Phoenix, the SRP and CAP water wholesalers deliver water from the same physical source at a continental scale: Western U.S. surface water flows originating from mountain snowmelt within the Colorado River Basin. However, SRP and CAP independently operate separate storage and delivery infrastructures that have multiple, distinct types of water rights. Within both systems, the distinct types of water rights have their own discrete bundle of use restrictions, seniority, and vulnerabilities. Therefore, owing to the governance the SRP and CAP systems, there is a great deal of independence and decorrelation between the two water systems.
Resilience is computed over a municipality’s adaptive water supply options, , using a normalized Shannon Index () for each municipality, , and normalized between 0 and 1 using the number () of water sources () in its portfolio (Figure 3). is the fractional proportion of the municipality’s adaptive water supply options that lie with each independent source.
Since we normalize using the maximum theoretical number of water sources available to a municipality, the method enumerating those sources represents an important assumption. There are two choices for the definition of the set of potential sources, : “local” and “global” [26,27]. The local set includes only the sources that are accessible to a specific municipal decision agent c. The global set includes all sources that are accessible to any municipality within the metropolitan area. The correct choice for an “apples to apples” comparison between the resilience of municipalities within a population is the global set, because this choice reduces the resilience of municipalities with access to a small number of independent sources relative to municipalities with access to more independent sources. If the local set is used, the normalization for each municipality’s differs, rendering each municipality’s incomparable.
We could calculate resilience based on only available options . Calculating using provides an indicator of resilience that considers only online backup water sources that do not incur significant capital costs or time delays. This is a conservative resilience calculation that neglects many of our adaptive options and is analogous to engineering or emergency response resilience calculation rather than an adaptive resilience. Calculating using is less conservative because it includes expensive adaptive options that involve capital investment, but this resilience will usually be higher because it includes all viable short-term options. It is clear that, based on this logic, resilience not only implies a “to” but also implies a “cost”—i.e., resilience to water supply deficits at a cost.
2.4. DTC, an Index of Municipal Water Portfolio Vulnerability
We calculate municipal water portfolio Vulnerability () as the ratio of demand-to-capacity (), which is mathematically identical to the consumption-to-availability ratio (). However, these two metrics are subtly different: is an index of stress while is a measure of vulnerability. In theory should not exceed a value of unity; however, in practice, is common. This is because of the way “availability” is defined in the typical metric; availability is normally calculated at an arbitrary timescale that is unrelated to the adaptation time constant of the system and may not include reservoirs, potential capacity, , or available capacity, . This version of the Water SRVC model employs . With respect to a water shock, pre-adaptation demand can exceed capacity but not post-adaptation; post-adaptation demand would decrease to meet capacity. In other words, the adaptation of last resort is a reduction in demand through rationing or pricing. Because cannot exceed a value of unity without incurring functional damage, is a vulnerability index—that is, vulnerability to damaging shock—rather than a stress index like . indexes water stress, not vulnerability, because vulnerability implies the risk of real social, environmental, or economic damage or impact following an event [28].
Local Reserve Margin () in power systems engineering provides a sound analog to the Water SRVC model’s -based vulnerability index. For example, less than 15% (i.e., ) significantly increases the likelihood of system demand failure during power stress events, leading to brownouts or blackouts (i.e., shocks). Notwithstanding the vastly different adaptation timeframes, the analogy between vulnerability, , and holds. Therefore, we believe that this -based index is robust across a broad class of supply portfolio analysis contexts, not only in municipal water supply. Curtailing demand to meet supply during a shock creates functional damage, both in the power grid and in water supply.
For each municipality () and scenario (), we can specify for each water source, , yielding multiple water resource vulnerabilities for each municipality. Therefore, , which is also a municipality’s Vulnerability to a water shock (), is the volumetric weighted average of (Equation (5)). Further, this calculation is scalable to the metropolitan area, which yields the metropolitan area’s vulnerability to the same.
2.5. Water Supply Portfolio Cost
Cost in the Water SRVC model is the cost of bringing water supplies online for adaptation and to cover . These adaptive water supply costs include capital costs (or water prices), legal costs, operational costs, and infrastructure construction. Therefore, adaptive cost is the delta between existing costs and the levelized costs of adaptive options at an annual timeframe (Equation (6)). To calculate the cost of adaptation, we compute volumetrically weighted average costs of all water sources used by the municipality under the scenario. We assumed that each municipality would purchase the least expensive available water source per unit volume until exhaustion and then purchase the next least expensive water source, and so forth. The baseline cost of each municipality’s water portfolio is based on SRP surface water, CAP surface water, and groundwater cost data. Baseline per unit water costs varied drastically due to unique contractual conditions for each municipality’s water resources portfolio. Adaptive cost data to cover structural water deficits is based on Phoenix Active Management Area (AMA) water market data [29].
In the SRVC model, the cost metric is used as information to support and weigh decisions S, R, V outcomes and is not intended to be used a sole or overriding criterion for water portfolio decision-making due to the potential constraints and instability to water utility financing [30]
3. Case Study: The Phoenix Metropolitan Area Water Portfolio
Water decision-making and governance in the Phoenix metropolitan area (PMA) occurs at multiple scales ranging from the municipality to regional water authorities and to federal agencies. This study focuses on the PMA municipalities of Avondale, Chandler, Gilbert, Glendale, Goodyear, Mesa, Peoria, Phoenix, Scottsdale, Tempe, and Tolleson, which comprise 85% of PMA population in Maricopa County, Arizona [31]. PMA municipalities access shared, rivalrous water sources that have varying degrees of excludability depending on law and infrastructure. Water sources include the Central Arizona Project (CAP) (40%), which conveys Colorado River water; the Salt River Project (SRP) (36%), which stores and delivers water from the Salt-Verde watershed; groundwater (7%), which is a significant gross water supply with smaller net consumption because of aquifer recharge with treated effluent and groundwater banking through long-term storage credits (LTSCs); and treated effluent (17%), which is used primarily for parks and golf courses, or utilized by non-municipal power generators. As described in the subsequent sections, all water sources have legal and infrastructural constraints on their use (Table 2). Only Goodyear and Tolleson do not have access to all water sources; Goodyear does not have access to SRP water and Tolleson does not currently have access to CAP water. An advantage of studying a metropolitan area with municipalities that have uneven access to regional water sources is that it allows for better understanding of how and to what extent SRVC metrics are interrelated.
CAP and SRP delivery curtailment decisions occur each year after measurements of spring snowmelt and projections of next year’s spring snowmelt. Each August, the U.S. Bureau of Reclamation uses Lake Mead elevation projections to decide for or against a shortage declaration, which would curtail CAP deliveries the following calendar year [32]. During the previous SRP curtailment, the SRP governing board decided to curtail deliveries in the fall for reductions the following calendar year [33]. Given these decision-making and response timeframes, municipalities may have less than a year to successfully adapt to water curtailments before they become a water shock. The Water SRVC model utilizes these decision-making criteria as triggers for water curtailment scenarios. To successfully adapt within CAP and SRP decision-making timeframes, PMA municipalities must exercise options for available water rights or free up water from “soft” elastic demand through conservation measures. New, non-traditional water options may result from increasing upstream flows in the Salt-Verde watershed through forest thinning, agricultural efficiency upgrades, and farm fallowing. Given these factors, the PMA water supply portfolio has multiple decision boundaries and planning timescales [34,35].
PMA municipalities have several annual-timescale adaptive water policy and supply options. Supply-side options include redeeming LTSCs; short-term or long-term CAP water leases with Indian and non-Indian agricultural; long-term contracts to purchase Colorado River water from mainstem agricultural users; lease or purchase existing non-irrigation groundwater rights (called Type 2 groundwater rights) within the PMA; and theoretically, interbasin groundwater transfers by retiring agricultural groundwater surrounding the PMA. Additionally, flow augmentation projects that leave agricultural flows in rivers and aquifers upstream of the PMA—fallowing, crop switching, and irrigation efficiency—can increase Verde River flows [36]. These additional flows have potential to act as backup water supplies during drought. Demand-side policy options to offset lost supply include outdoor water use restrictions, incentivizing mesic-to-xeric landscape conversions, and infrastructure upgrades to reduce lost and unaccounted-for water. In addition to traditional supply-side and demand-side options, nature-based options include expanding forest thinning in the Salt-Verde River watershed, specifically the Four Forest Regional Initiative (4FRI) region. Forest thinning could increase upstream runoff by up to 20% and increase reservoir water storage levels along the Salt-Verde system in a cost-competitive fashion [37]. Mechanical forest thinning offers a limited benefit compared to direct flow augmentation because runoff increases may last only for 6-years without continuous forest thinning [37,38]. However, forest thinning has additional social and economic benefits such as supporting rural economic development [39]. Notably, one drawback to upstream nature-based options is that they do not benefit municipalities unless additional flows are guaranteed, which requires legal assurances and certainty regarding flow increases from nature-based projects.
Regional climate models for the Colorado River basin project decreased flows due to increased evaporation (over 75%) at the headwaters [40,41]. Within Arizona, downscaled global climate models (GCMs) indicate the potential for increased temperatures and decreased runoff in the Salt-Verde watershed. Specifically, these models indicate increased mean annual temperature by 2.4 to 5.6 °C and decreased winter precipitation, potentially reducing mean annual runoff in the Salt-Verde watershed to 77.4% ± 24.0% of normal [42]. Longer, hotter, dry periods will increase fire likelihood in overgrown ponderosa pine forests in the Salt-Verde watershed [43]. Forest fires in the Salt-Verde watershed have the potential to acutely affect SRP water supply volume and quality [44]. Given these projections, future configurations of the PMA water resources portfolio include severe and unexpected water stress.
3.1. Surface Water Supply Options
Surface water delivered to PMA municipalities—either SRP or CAP—represent a bundle of “paper water” types that are physically comingled but legally distinct.
SRP conjunctively manages a surface water reservoir system and groundwater to deliver water to Avondale, Chandler, Gilbert, Glendale, Mesa, Peoria, Phoenix, Scottsdale, Tempe, and Tolleson. SRP provides surface water to municipalities as either: (1) Normal Flow water or (2) Stored and Developed water. Normal Flow water is the most senior water right among SRP water types and the river flow to each SRP municipality under natural river conditions (prior to the SRP reservoir system). Stored and Developed water is a junior SRP water right and a combination of surface water, pumped groundwater, and LTSCs. SRP allocates Stored and Developed water to municipalities based on the area “on-project” lands, which is the area of municipality land within the original SRP service area, using a multiplier of 3 acre-feet per acre of on-project land (9.144 ML ha−1). SRP can reduce the Stored and Developed water supply multiplier in response to severe water shortage. In 2003 and 2004, the SRP governing board voted to reduce deliveries by 33% in response to ongoing regional drought [33,45]. Previously, the SRP governing board decided to curtail deliveries when reservoirs, which are along the Salt and Verde rivers, were at 27% capacity. At the beginning of 2016, SRP reservoir capacity was at 57%. For SRP, annual deliveries average 945,195 ML year−1 while the 30-year median runoff into SRP reservoirs is 659,093 ML year−1 [46]. At the current drawdown rate of 254,709 ML year−1, the SRP reservoir capacity will dip below the 27% capacity benchmark for water delivery curtailment by 2020.
In the PMA, CAP water has most exposure to water stress due to its junior status on Colorado River [47,48]. CAP water right types are Municipal and Industrial (M&I) Subcontracts, water leased directly to municipalities by the Central Arizona Water Conservation District; M&I Priority, which is CAP water obtained by municipalities for the purposes of M&I use as a result of a lease from the Gila River Indian Community; CAP Agricultural Priority, which is water originally decreed for agricultural purposes on Native American reservations in Central and Southern Arizona but later obtained by municipalities by lease or exchange; CAP Non-Indian Agriculture, which is water originally decreed for agricultural purposes Central and Southern Arizona but later obtained by municipalities by lease or exchange; and CAP Priority water (P3), which is water obtained by municipalities via an exchange with the Wellton-Mohawk Irrigation District located in Yuma County for main stem Colorado River water, thus giving these water rights priority over other types of CAP water [49]. Among CAP water rights types, P3 & M&I water rights have the highest priority, followed by Agricultural and NIA water rights [50,51]. In the SRVC model, surface water delivered to PMA municipalities is considered in C0 and A0 (see Tables S1–S8 in supplementary materials).
3.2. Groundwater Supply and Storage Options
The Groundwater Management Act of 1980 (GMA) established the Phoenix Active Management Area (AMA), among other AMAs, and capped groundwater pumping to eventually achieve a safe-yield condition, where natural groundwater recharge exceeds groundwater withdrawals. In essence, the GMA codified a groundwater sustainability goal for the Phoenix AMA. ADWR regulates municipal groundwater pumping within the Phoenix AMA [52]. PMA municipalities can bank excess water as LTSCs via managed aquifer recharge. LTSCs are convertible from storage credits to real water to lessen the impact of Colorado River shortages [53] as the 100-year average of the total groundwater banked [54,55,56,57,58,59,60,61,62,63]. Therefore, if a municipality has 123,348 kL banked as LTSCs, that municipality can convert up to 1233.48 kL year−1 of LTSCs to real water. In the SRVC model, groundwater delivered to PMA municipalities is considered in C0 and A0 (see Tables S1–S8 in supplementary materials).
3.3. Effluent Water Supply Options
PMA municipalities utilize treated effluent for turf irrigation and aquifer recharge in the PMA [52]. A notable exception is the City of Phoenix that has contracted its effluent for cooling the Palo Verde Nuclear Generating Station [64]. ADWR calculates municipal effluent generation as 40% of potable demand, although ADWR may revise this number to accommodate instream recharge and direct potable reuse. The Arizona Department of Environmental Quality (ADEQ) enforces greywater and wastewater reuse rules to facilitate fit-for-purpose reuse, which assigns varying stipulations for reuse of different water classes. In the SRVC model, effluent water supply is considered in C0 and A0 (see Tables S1–S8 in supplementary materials).
3.4. Conservation and Nature-Based Water Supply Options
Water conservation, ecosystem management, improving upstream irrigation efficiency, and upstream fallowing farms are potential new sources of water. For example, since landscape irrigation comprises 40% of water use in the City of Phoenix [52], residential landscape water conservation represents a large volume of convertible soft, elastic water demand. Nature-based water sources developed by non-governmental organizations, such as The Nature Conservancy, through irrigation efficiency projects, farm fallowing, crop switching, or mechanical forest thinning leave water in the Verde River for riparian ecosystems and downstream users. Mechanical thinning of ponderosa pine forests in the Salt-Verde watershed reduces the probability of forest fires and increases watershed runoff. TNC provided a rough estimate of localized flow increases (but not systemic downstream increases) based on preliminary modeling and field work conducted by The Nature Conservancy in Arizona’s staff and subcontractors farm-based projects; these preliminary findings show an additional 54,110 ML year−1 of in-stream flow in the Verde River [65]. Mechanical forest thinning has the potential to increase Salt-Verde watershed runoff by 26% [37]. In the SRVC model, water added to the Salt-Verde river system through nature-based solutions is considered an adaptive option.
3.5. Water SRVC Model Assumptions
The Water SRVC model utilizes legally assured, secured water rights to structure model logic, water rights access, water rights allocation, water rights utilization, and water curtailment adaptation. Fundamental to the Water SRVC model is that municipalities access shared water sources that are rivalrous, with varying degrees of excludability [66]. The Water SRVC models consider only the PMA municipal and metropolitan boundaries because water sharing occurs at this scale. Owing to the excludability of the region’s water sources and the multiple decision boundaries, each Water SRVC model outcome yields a different policy pathway.
With these assumptions and constraints, we developed the Water SRVC model with 2016 serving as the base year. We obtained CAP delivery data to municipalities by water type from CAP delivery reports [49]. Municipal and Industrial CAP deliveries are senior and protected among CAP water types and minimally affected by the Water SRVC scenarios [51]. We obtained SRP delivery data by water type from annual reports on water withdrawal and use data within the service district [46]. Additionally, we obtained reservoir capacity and runoff data from SRP [67]. We obtained groundwater, groundwater storage, and effluent data from ADWR [54,55,56,57,58,59,60,61,62,63]. Water supply costs were obtained from a confidential market analysis produced for The Nature Conservancy by WestWater Research [29]. The market analysis collected and summarized observed water rights prices by asset class in the Phoenix AMA and other regional water markets in Arizona, in order to estimate the value of agricultural and urban water in the Verde River Basin. Due to the confidentiality of this data, we cannot directly publish the findings from this market analysis; however, we can publish the ranges of observed water-rights prices and the conclusions derived from the confidential data. That said, historically, Colorado River water tends to be more expensive than local sources, such as groundwater, stored groundwater, and Salt River Project water (Table 3).
When a modeled curtailment created a structural water deficit, municipalities exercise water portfolio options according to cost—starting with underutilized existing online water sources and then the lowest cost, single-use potential source. While exact cost estimates are not shown as they are confidential, Colorado River water tends to be more expensive than local sources. Further, due to a lack of available data, we assume that operations, maintenance and repair costs (OM&R) remain unchanged pre- and post-adaptation.
3.6. Water SRVC Model Scenarios
We evaluated one baseline scenario, two Colorado River shortage declaration scenarios, two SRP shortage scenarios, two nature-based flow augmentation scenarios, one municipal conservation, one scenario with simultaneous Colorado River and SRP shortage declarations, and one scenario with municipal conservation in response to simultaneous Colorado River and SRP shortage declarations. For simplicity, the municipal decision scenarios assume that municipalities take identical actions with respect to conservation policies, namely municipalities reduce consumption by reducing soft, elastic demand such as landscape irrigation. This initial SRVC model limits scenarios to a single stage of adaptive decision-making over one year (Table 4). Considering long-term cascades of multiple decisions over multiple years and under changing conditions remains future work.
4. Results
4.1. Structural Water Deficits
The PMA has a diverse water supply portfolio with variegated water sources and rights. Therefore, there ought to be an uneven response to structural water deficits across municipalities under the various curtailment scenarios. Indeed, structural water deficits vary dramatically depending on the scenario and the municipality, ranging from a surplus or no deficit to 27% water supply deficits for a single municipality (Tolleson) and across several orders of magnitude across the PMA for a single scenario. Notably, Avondale, Goodyear, and Peoria experience no deficits under any scenario due to their large excess capacity relative to current demand.
Of the ten scenarios developed, seven focused on municipal-level impacts while the remaining three focused on the impacts of flow augmentation programs in the Salt-Verde watershed. The municipal-focused scenarios were the Baseline Scenario (BASE), CAP Shortage Default (CRB-D), CAP Shortage Draft Plan (CRB-C), SRP Shortage (SRD), Municipal Conservation (PMA-RC), CAP Default + SRP Shortage (SRD-CRB-D) and CAP Default + SRP Shortage + Conservation (SRD-CRB-RC). Five of the seven municipal-level scenarios implemented water curtailments on either the SRP or CAP (CRB-D, CRB-C, SRD, SRD-CRB-D, and SRD-CRB-RC) and four of the seven scenarios created structural water budget deficits in municipality water budgets (CRB-C, SRD, SRD-CRB-D, and SRD-CRB-RC).
The CRB-D and CRB-C scenarios compare the outcomes of Colorado River shortage declaration under the current shortage plan and the draft contingency shortage plan. Due to how the different shortage plans impact the different CAP water types, initial cuts to CAP under current shortage guidelines did not induce structural water deficits in municipal water portfolios. However, the draft contingency plan creates a 31,018 ML year−1 deficit at the PMA scale with Phoenix (22,453 ML year−1) most affected by an order of magnitude, followed by Mesa (3344 ML year−1), Chandler (2363 ML year−1), and Scottsdale (2292 ML year−1). LTSCs and Type 2 groundwater leases are adaptive water options to cover a structural water deficit created by the CRB-D and CRB-C scenarios.
Despite being the less visible, regional water shortage scenario, a curtailment of Salt River supplies would have more impact on the PMA. The SRD scenario creates a 77,257 ML year−1 metropolitan area scale structural water deficit. In terms of water volume, the SRD scenario most affects Phoenix (62,193 ML year−1) followed by Gilbert (11,194 ML year−1), Tempe (2245 ML year−1), and Tolleson (1624 ML year−1); however, Tolleson is most affected in relative terms (27%). Due to the larger structural water deficits, the Arizona Water Banking Authority becomes a strategic short-term consideration for PMA municipalities.
Achieving a 10% water conservation goal across the PMA—whether through voluntary or mandatory programs—created a surplus of 68,561 ML year−1. Specifically, for Phoenix, Gilbert, Tempe, and Tolleson, municipalities with the largest absolute and relative structural water deficits in CRB-D, CRB-C, and SRD, municipal water conservation can prevent or significantly reduce modeled structural water deficits.
For PMA municipalities, groundwater provides a strategic buffer against structural water deficits and induced water curtailments. This buffer is primarily due to existing LTSCs and the short-term leasing of Type 2 groundwater rights. Therefore, purchasing banked groundwater from, for example, the Arizona Water Banking Authority, is a strategic short-term consideration for PMA municipalities to guard against hydrologically- or legally-induced shortfalls in their water portfolios.
4.2. Sustainability
Given the high inter-annual variability in precipitation in the Salt-Verde watershed [38], our adaptive water policy decisions today could provide a vital and necessary buffer between wet winters by doubling the SRP system’s sustainability. Without a wet winter to recharge SRP reservoirs, the best-case sustainability scenario along the SRP system is a six-year delay before delivery curtailments. At the current runoff levels in the Salt-Verde, which is approximately 246,696 ML year−1 less than 30-year median runoff, the SRP reservoir system will hit 27% capacity, which triggered the previous curtailment, within a 4-year period. However, a combination of municipal conservation in the PMA and flow augmentation in the Salt-Verde watershed (VR-NBF, VR-FT, PMA-RC) can postpone when SRP reservoir capacity reaches historical curtailment levels. The consumption avoided through municipal conservation programs is 1.4× to 3.4× larger than the expected structural water deficits modeled in Scenarios CRB-C, SRD, SRD-CRB-D, and SRD-CRB-C. Additionally, the potential increase in annual runoff resulting from flow augmentation in the Salt-Verde watershed is approximately 0.8× to 2.1× larger than the expected structural water deficits modeled. The sustainability of the SRP system has six years of sustainability, corroborating [72]. A SRP shortage would affect the water portfolios of Phoenix, Gilbert, Tolleson, and Tempe the most. Consequently, the municipalities would benefit most from SRP system sustainability.
The sustainability scenarios evaluated the impact of drought on SRP reservoir capacity and how far into the future SRP could postpone SRP water delivery curtailments before a shock ensues that requires damaging water rationing (Table 5).
4.3. Resilience
There is a stark difference in resilience outcomes between scenarios, policy choices, and municipalities. The resilience outcomes of CAP-dominated water portfolios were most impacted by scenarios CRB-D, CRB-C, SRD-CRB-D, and SRD-CRB-RC. Conversely, the resilience outcomes of SRP-dominated water portfolios were most impacted by SRP drought scenarios. (Figure 4). Municipal water conservation and flow augmentation are potential options to increase water portfolio resilience. This increase in resilience results from the creation of new water types (augmented flow) and increased surface water and groundwater water availability as a strategic buffer. Reductions to water portfolio options created large decreases in municipal water portfolio resilience; especially, if a shock reduced the number of available water options from many options to one or two options.
Notably, a Colorado River shortage reduces resilience at both the individual municipality level and the overall metropolitan area. Without the creation of new water sources, conservation, or policy adaptations, groundwater storage credits are the last choice to cover structural water deficits. For example, the Lower Colorado River draft drought contingency plan can increase the municipality’s resilience by forcing the creation of new options that were not available or not considered viable options, before a shortage declaration. The Supplemental Information contains the full table of resilience results (Table S8).
4.4. Vulnerability
Phoenix SRVC model results show modest vulnerability differences between cities and between scenarios (Figure 5). Some scenarios yield minor changes in vulnerability (CRB-D, CRB-C), some scenarios yield increased vulnerability for all municipalities (SRD, SRD-CRB-D), one scenario decreases vulnerability for all municipalities (PMA-RC), and one scenario produces strong increases and strong decreases in vulnerability for different municipalities (SRD-CRB-RC). On a scale from zero to one, a change in vulnerability of +/− 0.10 is large in absolute terms and represents a water buffer of approximately 123,348 ML year−1. These differences are smaller in relative terms than the differences in sustainability and resilience shown in earlier sections. Municipalities with CAP-dominant water portfolios were most affected by scenarios CRB-D, CRB-C, SRD-CRB-D, and SRD-CRB-RC. Conversely, SRP-dominant water portfolios were most affected by scenarios SRD, and SRD-CRB-D, and SRD-CRB-RC. Importantly, municipal conservation as a response to mandated water curtailments, for most municipalities, soften the impact of water curtailments and reduced vulnerability to water stress. The Supplemental Information contains a full table of vulnerability results (Table S8).
4.5. Water Supply Costs
Cost changes to a municipal water portfolio pre- and post-adaptation varied based on the difference in cost between existing water contracts and new water contracts (Figure 6). For some municipalities, conveying existing LTSCs were cheaper than CAP supplies in CRB-D, CRB-C, SRD-CRB-D, and SRD-CRB-RC. Municipalities with a heavy reliance on SRP supplies—such as Phoenix, Gilbert, Tempe, and Tolleson—faced the sharpest per unit water cost increases due to switching from a low-cost source (SRP) to sources with higher relative cost. Phoenix and Tempe show modest changes in cost depending on their policy decisions, and other municipalities have little to no change in cost as a function of their policy decisions. In general, cost did not vary much across scenarios and water supply options. We expected this because we excluded from the scope of analysis the adaptive water supply options with dramatically higher costs than the current supplies (e.g., desalination). Upstream flow augmentation and residential conservation solutions are preferentially chosen by the model based on cost because they are adequate to cover structural water deficits at lower per-gallon costs to other adaptive water supply options. As explained in Table 3, the market cost data is not released in the study due to its sensitive nature, so we are only able to present these aggregated results and not the raw numbers used to calculate the results. These aggregated costs are calculated using the methods explained in Section 2.5.
A municipality’s cost to bring potential sources online during drought is proportionate to the volume of water required. Some municipalities would face much larger relative deficits and much larger cost escalations than others, depending on the scenario considered. The escalation of cost is predictable at a significant R2 of 0.94 using the equation Cost1/Cost0 = 2.785 F/C0 (Figure 7).
4.6. Tradeoffs between S, R, V, and C
In the PMA, water portfolio vulnerability and resilience (V/R) have a weak significant relationship (R2~0.1) where increasing resilience decreases vulnerability (Figure 8). Just as many municipalities and scenarios fall outside the confidence bounds of this relationship, as fit within the bounds. There is even less of a relationship between S/R or S/V.
More importantly, there is little relationship between cost and the other three dimensions of sustainability, resilience, and vulnerability (Figure 9). These four water security dimensions are mostly independent. This means it is possible for a municipality to find win-win options (and lose-lose options). A municipality can gain sustainability or reduce vulnerability at little to no cost. An exception is that resilience does appear to come at an increased cost on average but only weakly and with many exceptions (Figure 9, center).
The exceptions matter, because there is no “average” municipality in the Phoenix metro. If we isolate each of the twelve municipalities’ adaptive scenarios and regress C against S, V, and R for each municipality, only eight out of thirty-six relationships have an R2-value greater than 0.25 and for most relationships the slope is at or around 0 (Table 6). This means every municipality needs to independently contemplate its adaptation decisions and water portfolio positioning and reach its own conclusions; following other municipalities may lead to poor decisions.
5. Discussion
This paper develops and implements a systems-based Sustainability, Resilience, Vulnerability, and Cost (SRVC) model for water portfolio security assessment that adds systems-level S, R, and V dimensions to the traditional cost-and-reliability-based models. The SRVC model adds to a rich literature on systems-based analysis of multi-stakeholder systems including the management of municipal solid waste [73], streamflow analysis [74], wastewater management [75], and stormwater quality and management [76]. The results are promising and have implications for municipal water portfolio planning and preparation for unpredictable annual-timescale disruptions. In the PMA, we find that the S, R, and V dimensions are independent of each other and from cost. Therefore, municipalities should be able to develop cost-neutral policy options that are more sustainable and resilient and less vulnerable. For Phoenix metropolitan area municipalities, potential water portfolio reconfigurations in response to an annual-timescale shock are differentiated along resilience and sustainability metrics, rather than vulnerability or cost metrics. However, this finding does not hold evenly across all Phoenix metropolitan area municipalities. The details matter, and adaptive options must complement each municipality’s unique water portfolio. Municipal water portfolios dominated by Salt River Project deliveries have different responses to unforeseeable infrastructure failures, regional drought, or forest fires than portfolios relying primarily on Central Arizona Project water. The SRVC model adds the information necessary for a municipality to identify cost-neutral adaptive water portfolio configurations that are more sustainable, more resilient, and/or less vulnerable.
After a Colorado River shortage declaration, which would curtail Central Arizona Project deliveries to the Phoenix metropolitan area, we find that resilience decreases as groundwater, in the form of long-term storage credits, is the only remaining unused supply option. Future updates to this study will also have to include modeled and/or observed increases to baseline OM&R costs as a result of a shortage declaration. After stored groundwater, a combination of residential conservation and nature-based flow augmentation programs can compensate for Colorado River drought and restore water portfolio resilience without building new infrastructure to supply greywater. These options only become more cost effective as OM&R costs along the CAP system increase after a water shortage declaration.
The most cost-effective adaptive options to improve S, R, and V—and mitigate the effects of climate change, drought, and water curtailment on water security—are water conservation and flow augmentation programs in the Salt-Verde watershed. Residential water conservation programs are impactful win-win adaptive policy options in cities with comparatively high per-capita consumption. Relying on conservation programs to enhance S, R, and V presents several challenges. For example, an upstream conservation program to enhance streamflow will depend on willing farmers, and willingness to participate may present challenges. Further, monitoring the contributions of conservation to river flow augmentation is difficult given a number of factors contributing to flow levels; however, headgates help in accounting for flow returned to the river. For municipalities, monitoring changes in household-level water consumption is potentially easier through metering but may harden demand over time, reducing the effectiveness of future conservation programs. Previous research in the Los Angeles metropolitan area found that mandatory water restrictions and price increases reduced water consumption more effectively than voluntary reductions [77]. Additionally, conservation provides a smaller marginal benefit for municipalities with hardened residential demand. Municipalities must retain the benefits of conservation rather than fall prey to efficiency paradoxes (i.e., growth offsetting conservation gains) to successfully realize S, R, and V gains [78].
Flow augmentation in the Salt-Verde watersheds is a promising adaptive option. However, the potential for flow increases remains uncertain, especially for forest thinning programs. Nonetheless, increased runoff and in-stream flows can create co-benefits that include creating socio-ecological public value from recreational activities and forest thinning jobs while reducing the probability of forest fire and leaving more water for riparian ecosystems.
The role that the Central Arizona Project has played in facilitating water transfers (by trading on the conveyance of Colorado River water) between Phoenix metropolitan area cities can serve as an example for how the Salt River Project might help the cities adapt to drought. However, instead of shifting demand around Arizona by allowing cities to consume water already slated for agricultural use, the Salt River Project could play a role in conveying to cities the water that is made available through conservation, flow restoration, and the provision of flow supporting instream ecosystem services. However, no market for flow augmentation projects currently exists. Phoenix, Gilbert, and Tempe are among the largest users of Salt River Project water in the metropolitan area, so they would be key participants in a market that would allow municipalities to purchase additional flows by funding upstream watershed restoration and nature-based flow augmentation. Municipalities that do not currently use the Salt River Project system have no initial incentive to participate in such a market but might choose to participate if the market resulted in access to new backup water supplies or water sharing agreements in partnership with the Salt River Project. Given that Phoenix municipalities are already willing to pay for mainstream Colorado River water, nature-based projects should be a cost-competitive option even with a small Salt River Project conveyance and management fee. Third parties, such as NGOs, have potential roles in this system as intermediaries between PMA municipalities and individual farmers, irrigation districts, and forest thinning operations by administering programs. Such mechanisms could provide municipalities with a market or program to invest in upstream environmental flows, improve rural economies, and mitigate ecosystem damage while cost-competitively boosting urban water security, leveraging the water supply system to create system-wide environmental and water security benefits [79].
Future research can consider a wider range of adaptive options and future scenarios such as green infrastructure growth policies, a wider range of population and economic growth scenarios, and longer-term shocks beyond the approximately annual event timescale. Future work could consider cascading SRVC impacts from chained adaptive decisions (t2 and subsequent) and multiple decision timeframes. Future work should introduce multiple-objective optimization to identify the best adaptive pathways for each municipality. Future work may distinguish between recoverable and irrecoverable or stranded capital costs to bring potential sources online because this distinction is relevant for decision pathways involving multiple adaptive steps and for the financial feasibility of adaptation. This paper does not consider the decision maker’s ability to pay, which is not a factor for PMA municipalities because all options on the table are affordable at current prices given healthy budgetary and bonding status. However, future versions of this method will address this by adding the ability to pay into the methodology. Future work could apply this model to critical infrastructure planning problems beyond the scope of water policy and address power systems, transportation systems, and food systems [80].
6. Conclusions
The resilience of the entire PMA is greater than its constituent municipalities. Given this, cooperation during long-term planning and also on emergency response to water shortages and droughts is an important win-win adaptive strategy for these municipalities, corroborating [14]. Diversification of supply is also an important means of enhancing water security through resilience, although diversification could come at a cost to some municipalities. Municipalities with water surpluses generated by conservation could potentially enter short-term water leases with other PMA municipalities with structural water deficits, providing a municipality a revenue stream and economic incentive to reach demand management goals. Historically, municipalities have paid higher prices than other government entities (Federal and state) in water rights markets [81]. This should provide motivation to overcome the financial and legal disincentives against municipal utility water conservation [82]. Intra-metropolitan and intra-watershed fragmentation of water delivery and water decision systems demonstrably damages resilience in a context of shared water sources; fragmentation hurts small municipalities with narrow portfolios (e.g., Goodyear) more than the largest municipalities that have diverse portfolios (e.g., Phoenix).
Supplementary Materials
The following are available online at https://0-www-mdpi-com.brum.beds.ac.uk/2073-4441/12/6/1663/s1. Table S1: Total Online Capacity, Utilized Online Capacity, Available Capacity, and Structural Water Deficit of Phoenix Metropolitan Area Municipalities–Baseline (ML). Table S2: Total Online Capacity, Utilized Online Capacity, Available Capacity, and Structural Water Deficit of Phoenix Metropolitan Area Municipalities–CRB-D (ML). Table S3: Total Online Capacity, Utilized Online Capacity, Available Capacity, and Structural Water Deficit of Phoenix Metropolitan Area Municipalities–CRB-C (ML). Table S4: Total Online Capacity, Utilized Online Capacity, Available Capacity, and Structural Water Deficit of Phoenix Metropolitan Area Municipalities–SRD (ML). Table S5: Total Online Capacity, Utilized Online Capacity, Available Capacity, and Structural Water Deficit of Phoenix Metropolitan Area Municipalities–PMA-RC (ML). Table S6: Total Online Capacity, Utilized Online Capacity, Available Capacity, and Structural Water Deficit of Phoenix Metropolitan Area Municipalities–SRD-CRB-D (ML). Table S7: Total Online Capacity, Utilized Online Capacity, Available Capacity, and Structural Water Deficit of Phoenix Metropolitan Area Municipalities–SRD-CRB-RC (ML). Table S8: The system statistics for each scenario.
Author Contributions
Conceptualization, R.R.R. and B.L.R.; methodology, R.R.R. and B.L.R.; software, R.R.R.; validation, R.R.R. and B.L.R.; formal analysis, R.R.R.; investigation, R.R.R.; data curation, R.R.R.; writing—original draft preparation, R.R.R.; writing—review and editing, R.R.R., M.M., B.L.R.; visualization, R.R.R.; supervision, B.L.R.; project administration, B.L.R.; funding acquisition, B.L.R. All authors have read and agreed to the published version of the manuscript.
Funding
The authors acknowledge funding from The Nature Conservancy in Arizona and the Northern Arizona University TRIF. The Nature Conservancy in Arizona commissioned a study of the effects of flow restoration on downstream urban water users’ water security and owns original data products upon which the study was partially based. This material is based upon work supported by the National Science Foundation under Grant No. ACI-1639529 and USDA Grant No. 2017-08812. The findings and opinions of this paper are those of the authors and not necessarily of the funding agencies.
Acknowledgments
The authors would like to thank the funding agencies the gracious input from the peer reviewers.
Conflicts of Interest
The authors declare no conflict of interest. The funders had no role in the design of the study; in the collection, analyses, or interpretation of data; or in the decision to publish the results; however, M.M. was employed by the funder (The Nature Conservancy) during the writing of the manuscript.
References
- Hering, J.G.; Waite, T.D.; Luthy, R.G.; Drewes, J.E.; Sedlak, D.L. A Changing Framework for Urban Water Systems. Environ. Sci. Technol. 2013, 47, 10721–10726. [Google Scholar] [CrossRef]
- Pincetl, S.; Porse, E.; Cheng, D. Fragmented Flows: Water Supply in Los Angeles County. Environ. Manag. 2016, 58, 208–222. [Google Scholar] [CrossRef] [PubMed]
- Herman, J.D.; Reed, P.M.; Zeff, H.B.; Characklis, G.W. How Should Robustness Be Defined for Water Systems Planning under Change? J. Water Resour. Plan. Manag. 2015, 141, 04015012. [Google Scholar] [CrossRef]
- Zeff, H.; Kasprzyk, J.; Herman, J.D.; Reed, P.M.; Characklis, G.W. Navigating financial and supply reliability tradeoffs in regional drought management portfolios. Water Resour. Res. 2014, 50, 4906–4923. [Google Scholar] [CrossRef]
- Griscom, B.; Adams, J.; Ellis, P.W.; Houghton, R.A.; Lomax, G.; Miteva, D.A.; Schlesinger, W.H.; Shoch, D.; Siikamäki, J.V.; Smith, P.; et al. Natural climate solutions. Proc. Natl. Acad. Sci. USA 2017, 114, 11645–11650. [Google Scholar] [CrossRef] [Green Version]
- Kabisch, N.; Frantzeskaki, N.; Pauleit, S.; Naumann, S.; Davis, M.; Artmann, M.; Haase, D.; Knapp, S.; Korn, H.; Stadler, J.; et al. Nature-based solutions to climate change mitigation and adaptation in urban areas: Perspectives on indicators, knowledge gaps, barriers, and opportunities for action. Ecol. Soc. 2016, 21. [Google Scholar] [CrossRef] [Green Version]
- Taleb, N.N. The Black Swan: The Impact of the Highly Improbable; Random House Trade Paperbacks: New York, NY, USA, 2010; Available online: https://books.google.com/books?id=GSBcQVd3MqYC (accessed on 28 June 2017).
- Brede, M.; De Vries, B.J. Networks that optimize a trade-off between efficiency and dynamical resilience. Phys. Lett. A 2009, 373, 3910–3914. [Google Scholar] [CrossRef]
- Holling, C.S. Engineering Resilience versus Ecological Resilience. In Engineering within Ecological Constraints; Peter, S., Ed.; National Academies Press: Washington, DC, USA, 1996. [Google Scholar]
- Ulanowicz, R.E.; Goerner, S.J.; Lietaer, B.; Gomez, M.D.R. Quantifying sustainability: Resilience, efficiency and the return of information theory. Ecol. Complex. 2009, 6, 27–36. [Google Scholar] [CrossRef]
- Brown, C.M.; Lund, J.R.; Cai, X.; Reed, P.M.; Zagona, E.; Ostfeld, A.; Hall, J.; Characklis, G.W.; Yu, W.; Brekke, L. The future of water resources systems analysis: Toward a scientific framework for sustainable water management. Water Resour. Res. 2015, 51, 6110–6124. [Google Scholar] [CrossRef]
- Matrosov, E.S.; Huskova, I.; Kasprzyk, J.; Harou, J.; Lambert, C.; Reed, P.M. Many-objective optimization and visual analytics reveal key trade-offs for London’s water supply. J. Hydrol. 2015, 531, 1040–1053. [Google Scholar] [CrossRef]
- Reed, P.M.; Brooks, R.P.; Davis, K.J.; Dewalle, D.R.; Dressler, K.A.; Duffy, C.J.; Lin, H.; Miller, D.A.; Najjar, R.G.; Salvage, K.M.; et al. Bridging river basin scales and processes to assess human-climate impacts and the terrestrial hydrologic system. Water Resour. Res. 2006, 42. [Google Scholar] [CrossRef]
- Zeff, H.; Herman, J.D.; Reed, P.M.; Characklis, G.W. Cooperative drought adaptation: Integrating infrastructure development, conservation, and water transfers into adaptive policy pathways. Water Resour. Res. 2016, 52, 7327–7346. [Google Scholar] [CrossRef]
- Hashimoto, T.; Stedinger, J.R.; Loucks, D.P. Reliability, resiliency, and vulnerability criteria for water resource system performance evaluation. Water Resour. Res. 1982, 18, 14–20. [Google Scholar] [CrossRef] [Green Version]
- Rosenberg, D.E.; Tarawneh, T.; Lund, J.R.; Abdel-Khaleq, R. Modeling integrated water user decisions in intermittent supply systems. Water Resour. Res. 2007, 43. [Google Scholar] [CrossRef]
- Walker, B.; Kinzig, A.; Langridge, J. Original Articles: Plant Attribute Diversity, Resilience, and Ecosystem Function: The Nature and Significance of Dominant and Minor Species. Ecosystems 1999, 2, 95–113. [Google Scholar] [CrossRef]
- Allenby, B.; Fink, J. Social and ecological resilience: Toward inherently secure and resilient societies. Science 2000, 24, 347–364. [Google Scholar]
- Kirsch, B.; Characklis, G.W.; Dillard, K.E.M.; Kelley, C. More efficient optimization of long-term water supply portfolios. Water Resour. Res. 2009, 45. [Google Scholar] [CrossRef] [Green Version]
- Kasprzyk, J.; Reed, P.M.; Kirsch, B.R.; Characklis, G.W. Managing population and drought risks using many-objective water portfolio planning under uncertainty. Water Resour. Res. 2009, 45, 12401. [Google Scholar] [CrossRef]
- Boulay, A.-M.; Bare, J.; De Camillis, C.; Döll, P.; Gassert, F.; Gerten, D.; Humbert, S.; Inaba, A.; Itsubo, N.; Lemoine, Y.; et al. Consensus building on the development of a stress-based indicator for LCA-based impact assessment of water consumption: Outcome of the expert workshops. Int. J. Life Cycle Assess. 2015, 20, 577–583. [Google Scholar] [CrossRef]
- Nicklow, J.W.; Reed, P.M.; Savic, D.; Dessalegne, T.; Harrell, L.; Chan-Hilton, A.; Karamouz, M.; Minsker, B.; Ostfeld, A.; Singh, A.; et al. State of the Art for Genetic Algorithms and Beyond in Water Resources Planning and Management. J. Water Resour. Plan. Manag. 2010, 136, 412–432. [Google Scholar] [CrossRef]
- Meadows, D.; Randers, J.; Meadows, D. Limits to Growth: The 30-Year Update; Chelsea Green Publishing: Hartford, VT, USA, 2004. [Google Scholar]
- World Commission on Environment and Development. Our Common Future; Oxford University Press: Oxford, UK, 1987. [Google Scholar]
- Paté-Cornell, E. On “Black Swans” and “Perfect Storms”: Risk Analysis and Management When Statistics Are Not Enough. Risk Anal. 2012, 32, 1823–1833. [Google Scholar] [CrossRef] [PubMed]
- Ruddell, B.L.; Kumar, P. Ecohydrologic process networks: 1. Identification. Water Resour. Res. 2009, 45. [Google Scholar] [CrossRef]
- Ruddell, B.L.; Kumar, P. Ecohydrologic process networks: 2. Analysis and characterization. Water Resour. Res. 2009, 45. [Google Scholar] [CrossRef]
- Boulay, A.-M.; Bare, J.; Benini, L.; Berger, M.; Lathuillière, M.J.; Manzardo, A.; Margni, M.; Masaharu, M.; Núñez, M.; Pastor, A.V.; et al. The WULCA consensus characterization model for water scarcity footprints: Assessing impacts of water consumption based on available water remaining (AWARE). Int. J. Life Cycle Assess. 2017, 23, 368–378. [Google Scholar] [CrossRef] [Green Version]
- Messerschmidt, M.; The Nature Conservancy of Arizona, Tucson, AZ, USA. Personal Communication—Verde River Water Market Analysis. 2016. [Google Scholar]
- Smith, R.; Kasprzyk, J.; Basdekas, L. Experimenting with Water Supply Planning Objectives Using the Eldorado Utility Planning Model Multireservoir Testbed. J. Water Resour. Plan. Manag. 2018, 144, 04018046. [Google Scholar] [CrossRef]
- US Census Bureau. Annual Estimates of the Resident Population: April 1, 2010 to July 1, 2016. Available online: https://factfinder.census.gov/faces/tableservices/jsf/pages/productview.xhtml?pid=PEP_2016_PEPANNRES&src=pt (accessed on 3 May 2017).
- Brean, H. Lake Mead Likely to Skirt Shortage Line for Another Year. Las Vegas Review-Journal, August 16. Available online: https://www.reviewjournal.com/local/local-nevada/lake-mead-likely-to-skirt-shortage-line-for-another-year/ (accessed on 3 May 2017).
- McKinnon, S. SRP Will Extend Water Ration. The Arizona Republic, 9 September 2003. [Google Scholar]
- Ruddell, B.L.; Adams, E.A.; Rushforth, R.; Tidwell, V.C. Embedded resource accounting for coupled natural-human systems: An application to water resource impacts of the western U.S. electrical energy trade. Water Resour. Res. 2014, 50, 7957–7972. [Google Scholar] [CrossRef]
- Rushforth, R.; Adams, E.A.; Ruddell, B.L. Generalizing ecological, water and carbon footprint methods and their worldview assumptions using Embedded Resource Accounting. Water Resour. Ind. 2013, 1, 77–90. [Google Scholar] [CrossRef] [Green Version]
- Brochure from the Nature Conservancy. Subject: Summary of River Projects Proposed Verde Valley 2017. Personal Communication with M. Messerschmidt, 2018. 2016. [Google Scholar]
- Robles, M.D.; Marshall, R.M.; O’Donnell, F.C.; Smith, E.B.; Haney, J.A.; Gori, D.F. Effects of Climate Variability and Accelerated Forest Thinning on Watershed-Scale Runoff in Southwestern USA Ponderosa Pine Forests. PLoS ONE 2014, 9, e111092. [Google Scholar] [CrossRef] [Green Version]
- Baker, M.B. Effects of Ponderosa Pine Treatments on Water Yield in Arizona. Water Resour. Res. 1986, 22, 67–73. [Google Scholar] [CrossRef]
- Moreno, H.A.; Gupta, H.V.; White, D.; Sampson, D.A. Modeling the distributed effects of forest thinning on the long-term water balance and streamflow extremes for a semi-arid basin in the southwestern US. Hydrol. Earth Syst. Sci. 2016, 20, 1241–1267. [Google Scholar] [CrossRef] [Green Version]
- Seager, R.; Ting, M.; Held, I.; Kushnir, Y.; Lu, J.; Vecchi, G.A.; Huang, H.-P.; Harnik, N.; Leetmaa, A.; Lau, N.-C.; et al. Model Projections of an Imminent Transition to a More Arid Climate in Southwestern North America. Science 2007, 316, 1181–1184. [Google Scholar] [CrossRef] [PubMed]
- Seager, R.; Ting, M.; Li, C.; Naik, N.; Cook, B.; Nakamura, J.; Liu, H. Projections of declining surface-water availability for the southwestern United States. Nat. Clim. Chang. 2012, 3, 482–486. [Google Scholar] [CrossRef]
- Ellis, A.; Hawkins, T.; Bailing, R.; Gober, P. Estimating future runoff levels for a semi-arid fluvial system in central Arizona, USA. Clim. Res. 2008, 35, 227–239. [Google Scholar] [CrossRef]
- Westerling, A.L.; Hidalgo, H.G.; Cayan, D.R.; Swetnam, T.W. Warming and Earlier Spring Increase Western U.S. Forest Wildfire Activity. Science 2006, 313, 940–943. [Google Scholar] [CrossRef] [PubMed] [Green Version]
- Gober, P.; Kirkwood, C.W. Vulnerability assessment of climate-induced water shortage in Phoenix. Proc. Natl. Acad. Sci. USA 2010, 107, 21295–21299. [Google Scholar] [CrossRef] [PubMed] [Green Version]
- Janofsky, M. Arizona Awakens to Drought as Lakes Shrink and Harm Spreads. The New York Times. 27 January 2003. Available online: http://www.nytimes.com/2003/01/27/us/arizona-awakens-to-drought-as-lakes-shrink-and-harm-spreads.html (accessed on 28 June 2017).
- Salt River Project. 2016 Annual Report: Annual Water Withdrawal and Use Irrigation District; Arizona Department of Water Resources: Phoenix, AZ, USA, 2017. [Google Scholar]
- Gleick, P.H. The Effects of Future Climatic Changes on International Water Resources: The Colorado River, the United States, and Mexico. Policy Sci. 1988, 21, 23–39. [Google Scholar] [CrossRef]
- MacDonnell, L.J.; Getches, D.H.; Hugenberg, W.C. The Law of the Colorado River: Coping with Severe Sustained Drought. J. Am. Water Resour. Assoc. 1995, 31, 825–836. [Google Scholar] [CrossRef] [Green Version]
- Central Arizona Project. Water Deliveries—Calendar Year 2017. 2017. Available online: https://www.cap-az.com/departments/water-operations/deliveries (accessed on 3 May 2017).
- Webinar by Danial Bunk. Management of Colorado River Reservoirs and Current State of the System. 18 May 2016. Available online: http://www.cap-az.com/documents/shortage/Introduction-Colorado-River-Briefing.pdf (accessed on 3 May 2017).
- Webinar by Ted Cooke, General Manager, Central Arizona Project May 18 2016. Colorado River Shortage Briefing: Arizona’s Plans in Action. Available online: http://www.cap-az.com/documents/shortage/Introduction-Colorado-River-Briefing.pdf (accessed on 3 May 2017).
- Jacobs, K.L.; Holway, J.M. Managing for sustainability in an arid climate: Lessons learned from 20 years of groundwater management in Arizona, USA. Hydrogeol. J. 2004, 12, 52–65. [Google Scholar] [CrossRef]
- Megdal, S.B.; Dillon, P.J.; Seasholes, K. Water Banks: Using Managed Aquifer Recharge to Meet Water Policy Objectives. Water 2014, 6, 1500–1514. [Google Scholar] [CrossRef] [Green Version]
- Arizona Department of Water Resources. Decision and Order No. 86-002003.0001 (City of Avondale Designation as Having and Assured Water Supply): Attachment A. 2010. Available online: https://infoshare.azwater.gov/docushare/dsweb/HomePage (accessed on 3 May 2017).
- Arizona Department of Water Resources. Decision and Order No. 86-002009.0001 (City of Chandler Designation as Having and Assured Water Supply): Attachment A. 2010. Available online: https://infoshare.azwater.gov/docushare/dsweb/HomePage (accessed on 3 May 2017).
- Arizona Department of Water Resources. Decision and Order No. 86-002019.0001 (City of Goodyear Designation as Having and Assured Water Supply): Attachment A. 2010. Available online: https://infoshare.azwater.gov/docushare/dsweb/HomePage (accessed on 3 May 2017).
- Arizona Department of Water Resources. Decision and Order No. 86-002023.0001 (City of Mesa Designation as Having and Assured Water Supply): Attachment A. 2010. Available online: https://infoshare.azwater.gov/docushare/dsweb/HomePage (accessed on 3 May 2017).
- Arizona Department of Water Resources. Decision and Order No. 86-002030.0001 (City of Phoenix Designation as Having and Assured Water Supply): Attachment A. 2010. Available online: https://infoshare.azwater.gov/docushare/dsweb/HomePage (accessed on 3 May 2017).
- Arizona Department of Water Resources. Decision and Order No. 86-002043.0001 (City of Tempe Designation as Having and Assured Water Supply): Attachment A. 2010. Available online: https://infoshare.azwater.gov/docushare/dsweb/HomePage (accessed on 3 May 2017).
- Arizona Department of Water Resources. Decision and Order No. 86-400619.0001 (City of Scottsdale Designation as Having and Assured Water Supply): Attachment A. 2010. Available online: https://infoshare.azwater.gov/docushare/dsweb/HomePage (accessed on 3 May 2017).
- Arizona Department of Water Resources. Decision and Order No. 86-400679.0001 (City of Peoria Designation as Having and Assured Water Supply): Attachment A. 2010. Available online: https://infoshare.azwater.gov/docushare/dsweb/HomePage (accessed on 3 May 2017).
- Arizona Department of Water Resources. Decision and Order No. 86-402208.0001 (Town of Gilbert Designation as Having and Assured Water Supply): Attachment A. 2010. Available online: https://infoshare.azwater.gov/docushare/dsweb/HomePage (accessed on 3 May 2017).
- Arizona Department of Water Resources. Decision and Order No. 860002018.001 (City of Glendale Designation as Having an Assured Water Supply): Attachment A. 2010. Available online: https://infoshare.azwater.gov/docushare/dsweb/HomePage (accessed on 3 May 2017).
- Lauver, L.; A Baker, L. Mass balance for wastewater nitrogen in the Central Arizona–Phoenix ecosystem. Water Res. 2000, 34, 2754–2760. [Google Scholar] [CrossRef]
- Messerschmidt, M.; The Nature Conservancy of Arizona, Tucson, AZ, USA. Personal Communication—Preliminary Flow Data. 2016. [Google Scholar]
- Gardner, R.; Ostrom, E.; Walker, J.M. The Nature of Common-Pool Resource Problems. Ration. Soc. 1990, 2, 335–358. [Google Scholar] [CrossRef]
- Salt River Project. 2016 Runoff Season Falls Short of Promise. 2016. Available online: http://www.srpnet.com/newsroom/releases/080316.aspx (accessed on 3 May 2017).
- Webinar by Clint Chandler, Assistant Director of Water Planning and Permitting, Central Arizona Project. Colorado River Shortage Briefing—Introduction. 18 May 2016. Available online: http://www.cap-az.com/documents/shortage/Introduction-Colorado-River-Briefing.pdf (accessed on 3 May 2017).
- Arizona Department of Water Resources. Data Center. 2017. Available online: https://infoshare.azwater.gov/docushare/dsweb/HomePage (accessed on 3 May 2017).
- Arizona Department of Water Resources. Long-Term Storage Account Summary. 2017. Available online: http://www.azwater.gov/azdwr/WaterManagement/Recharge/documents/2016LTSASummary05-31-17mro.pdf (accessed on 3 May 2017).
- Arizona Department of Water Resources. Preliminary DRAFT 4MP Total GPCD Program. 2012. Available online: http://www.azwater.gov/AzDWR/WaterManagement/AMAs/documents/GUAC_4MP_GPCD_PROGRAM_PHXAMA.pdf (accessed on 3 May 2017).
- Simonit, S.; Connors, J.P.; Yoo, J.; Kinzig, A.; Perrings, C. The Impact of Forest Thinning on the Reliability of Water Supply in Central Arizona. PLoS ONE 2015, 10, e0121596. [Google Scholar] [CrossRef] [PubMed] [Green Version]
- Li, Y.P.; Huang, G.H.; Cui, L.; Liu, J. Mathematical Modeling for Identifying Cost-Effective Policy of Municipal Solid Waste Management under Uncertainty. J. Environ. Inform. 2019, 34, 55–67. [Google Scholar] [CrossRef] [Green Version]
- Malagó, A.; Vigiak, O.; Bouraoui, F.; Pagliero, L.; Franchini, M. The hillslope length impact on SWAT streamflow prediction in large basins. J. Environ. Inform. 2018, 32, 82–97. [Google Scholar] [CrossRef] [Green Version]
- Zhou, P.; Li, Z.; Snowling, S.; Goel, R.; Zhang, Q.; Solutions, I.H.E.S. Short-Term Wastewater Influent Prediction Based on Random Forests and Multi-Layer Perceptron. J. Environ. Inform. Lett. 2019, 1, 87–93. [Google Scholar] [CrossRef] [Green Version]
- Wu, Q.; Xia, X. Response of Surface Water Quality in Urban and Non-urban Areas to Heavy Rainfall: Implications for the Impacts of Climate Change. J. Environ. Inform. Lett. 2019, 1, 27–36. [Google Scholar] [CrossRef] [Green Version]
- Hogue, T.S.; Pincetl, S. Are you watering your lawn? Science 2015, 348, 1319–1320. [Google Scholar] [CrossRef]
- Campbell, H.E.; Johnson, R.M.; Larson, E.H. Prices, Devices, People, or Rules: The Relative Effectiveness of Policy Instruments in Water Conservation1. Rev. Policy Res. 2004, 21, 637–662. [Google Scholar] [CrossRef]
- McManamay, R.A.; Nair, S.S.; DeRolph, C.R.; Ruddell, B.L.; Morton, A.M.; Stewart, R.N.; Troia, M.J.; Tran, L.; Kim, H.; Bhaduri, B.L. US cities can manage national hydrology and biodiversity using local infrastructure policy. Proc. Natl. Acad. Sci. USA 2017, 114, 9581–9586. [Google Scholar] [CrossRef] [Green Version]
- Scanlon, B.R.; Ruddell, B.L.; Reed, P.M.; Hook, R.I.; Zheng, C.; Tidwell, V.C.; Siebert, S. The food-energy-water nexus: Transforming science for society. Water Resour. Res. 2017, 53, 3550–3556. [Google Scholar] [CrossRef]
- Brookshire, D.S.; Colby, B.; Ewers, M.; Ganderton, P.T. Market prices for water in the semiarid West of the United States. Water Resour. Res. 2004, 40. [Google Scholar] [CrossRef] [Green Version]
- Kenney, D.S. Understanding Utility Disincentives to Water Conservation as a Means of Adapting to Climate Change Pressures. J. Am. Water Works Assoc. 2014, 106, 36–46. [Google Scholar] [CrossRef] [Green Version]
Figure 1.
Illustration of the geometry of a shock, including the role of buffers and deficits, the transition from stress to shock (and recovery) at some future point in time, and ramp rates of demand and of capacity. Note that excess demand is curtailed to equal capacity during a shock, creating damage and that deficits can therefore only exist as a hypothetical or planning concept. Linear ramping is illustrated, but this is usually a valid assumption only in the short term. This figure has decreasing capacity and constant demand, but it is conceptually similar to the figure as drawn.

Figure 2.
Graphical explanation of water source capacity and utilization before (0) and after (1) adaptation. (A) A municipality uses some portion of its legal, hydrological, and infrastructural capacity from a water source. (B) Multiple municipalities share a water source, and each uses and reserves some portion of the water source. (C) If there is a mandatory water curtailment, post-curtailment total capacity may be less than pre-curtailment utilization, creating a structural water deficit made whole by securing a “potential” source of water to fill the deficit (the potential source could be a conservation offset). (D) In a metropolitan area, a water curtailment scenario may affect each municipality differently, such that some municipalities still have available water from baseline sources, but other municipalities face structural water deficits.

Figure 3.
A hypothetical example showing change in resilience of a water resources portfolio, as measured by a normalized Shannon Diversity Index. As one water source (CAP M&I in this case) begins to dominate the portfolio of supply options, (left to right), R approaches zero, and a municipality loses the ability to adapt to an unexpected shortage if that shortage severely impacts the primary supply.

Figure 4.
The resilience ( and change from baseline resilience () of a municipality’s water portfolio. Overall, is large based on each municipality’s portfolio choices.
Figure 4.
The resilience ( and change from baseline resilience () of a municipality’s water portfolio. Overall, is large based on each municipality’s portfolio choices.

Figure 5.
The vulnerability of a municipality’s water supply () and change from the baseline scenario (). Overall, is small based on each municipality’s portfolio choices.
Figure 5.
The vulnerability of a municipality’s water supply () and change from the baseline scenario (). Overall, is small based on each municipality’s portfolio choices.

Figure 6.
Aggregated cost data: the volume weighted cost ($ ML−1) to obtain new water to fill the structural water deficits and change from baseline cost, for each modeled scenario, using methods explained in Section 2.5. Data shown in Table S2. Only cities that must switch their water sources to totally new sources (like Tolleson) at market prices during the event incur large cost increases.

Figure 7.
As water budget deficits grow, so does the cost to access available water sources and to bring online potential water sources to fill the water deficit (Data in Table S8).
Figure 7.
As water budget deficits grow, so does the cost to access available water sources and to bring online potential water sources to fill the water deficit (Data in Table S8).

Figure 8.
plotted against for all scenarios. As vulnerability to water stress increases, the resilience of available water sources decreases—but with important exceptions. Points in the upper left quadrant indicate win-win scenario outcomes where municipal water portfolio vulnerability decreases and municipal water portfolio resilience increases. Points in the lower right quadrant indicate lose-lose scenario outcomes where municipal water portfolio vulnerability increases and municipal water portfolio resilience decreases. Points plotted in the upper right and lower left quadrant indicate win-lose scenarios where municipal vulnerability increases while municipal resilience increases or vice versa. See Table S8 for data.

Figure 9.
compared with , , and , with each municipality and scenario representing a mark on the scatter plot. Relationships between portfolio cost and the other dimensions of water security are weak or absent. See Table S8 for data.
Figure 9.
compared with , , and , with each municipality and scenario representing a mark on the scatter plot. Relationships between portfolio cost and the other dimensions of water security are weak or absent. See Table S8 for data.


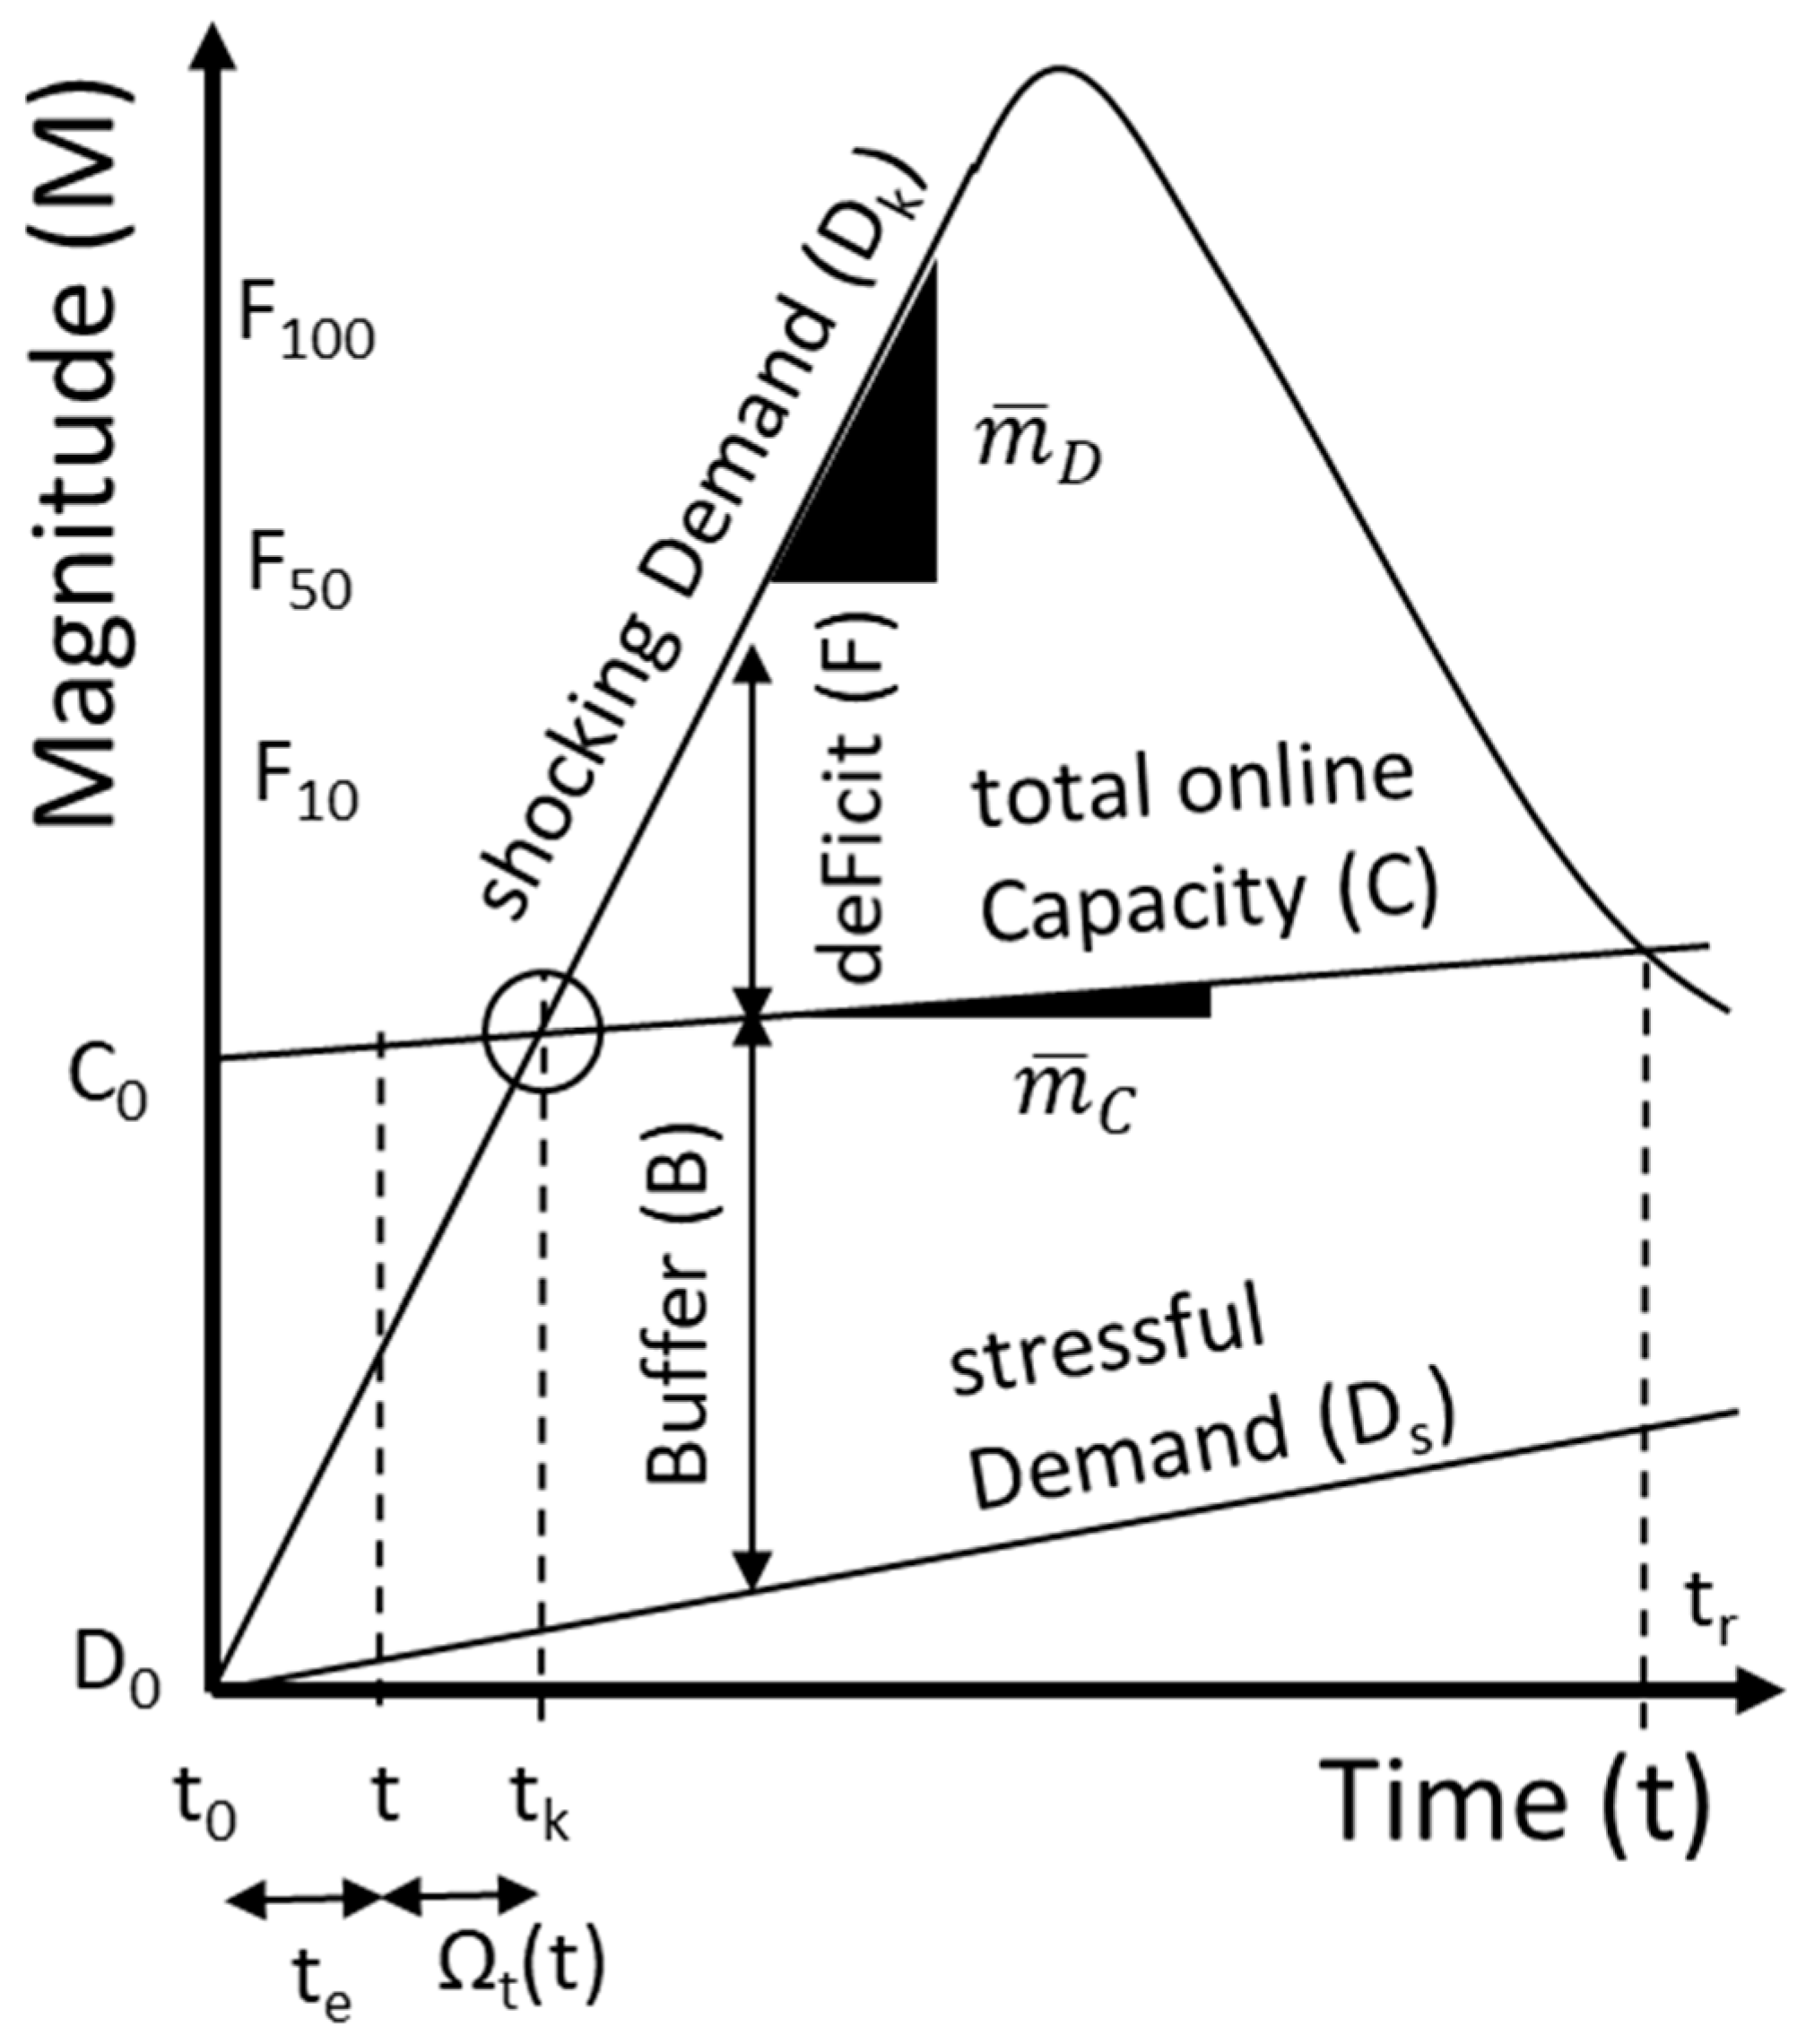
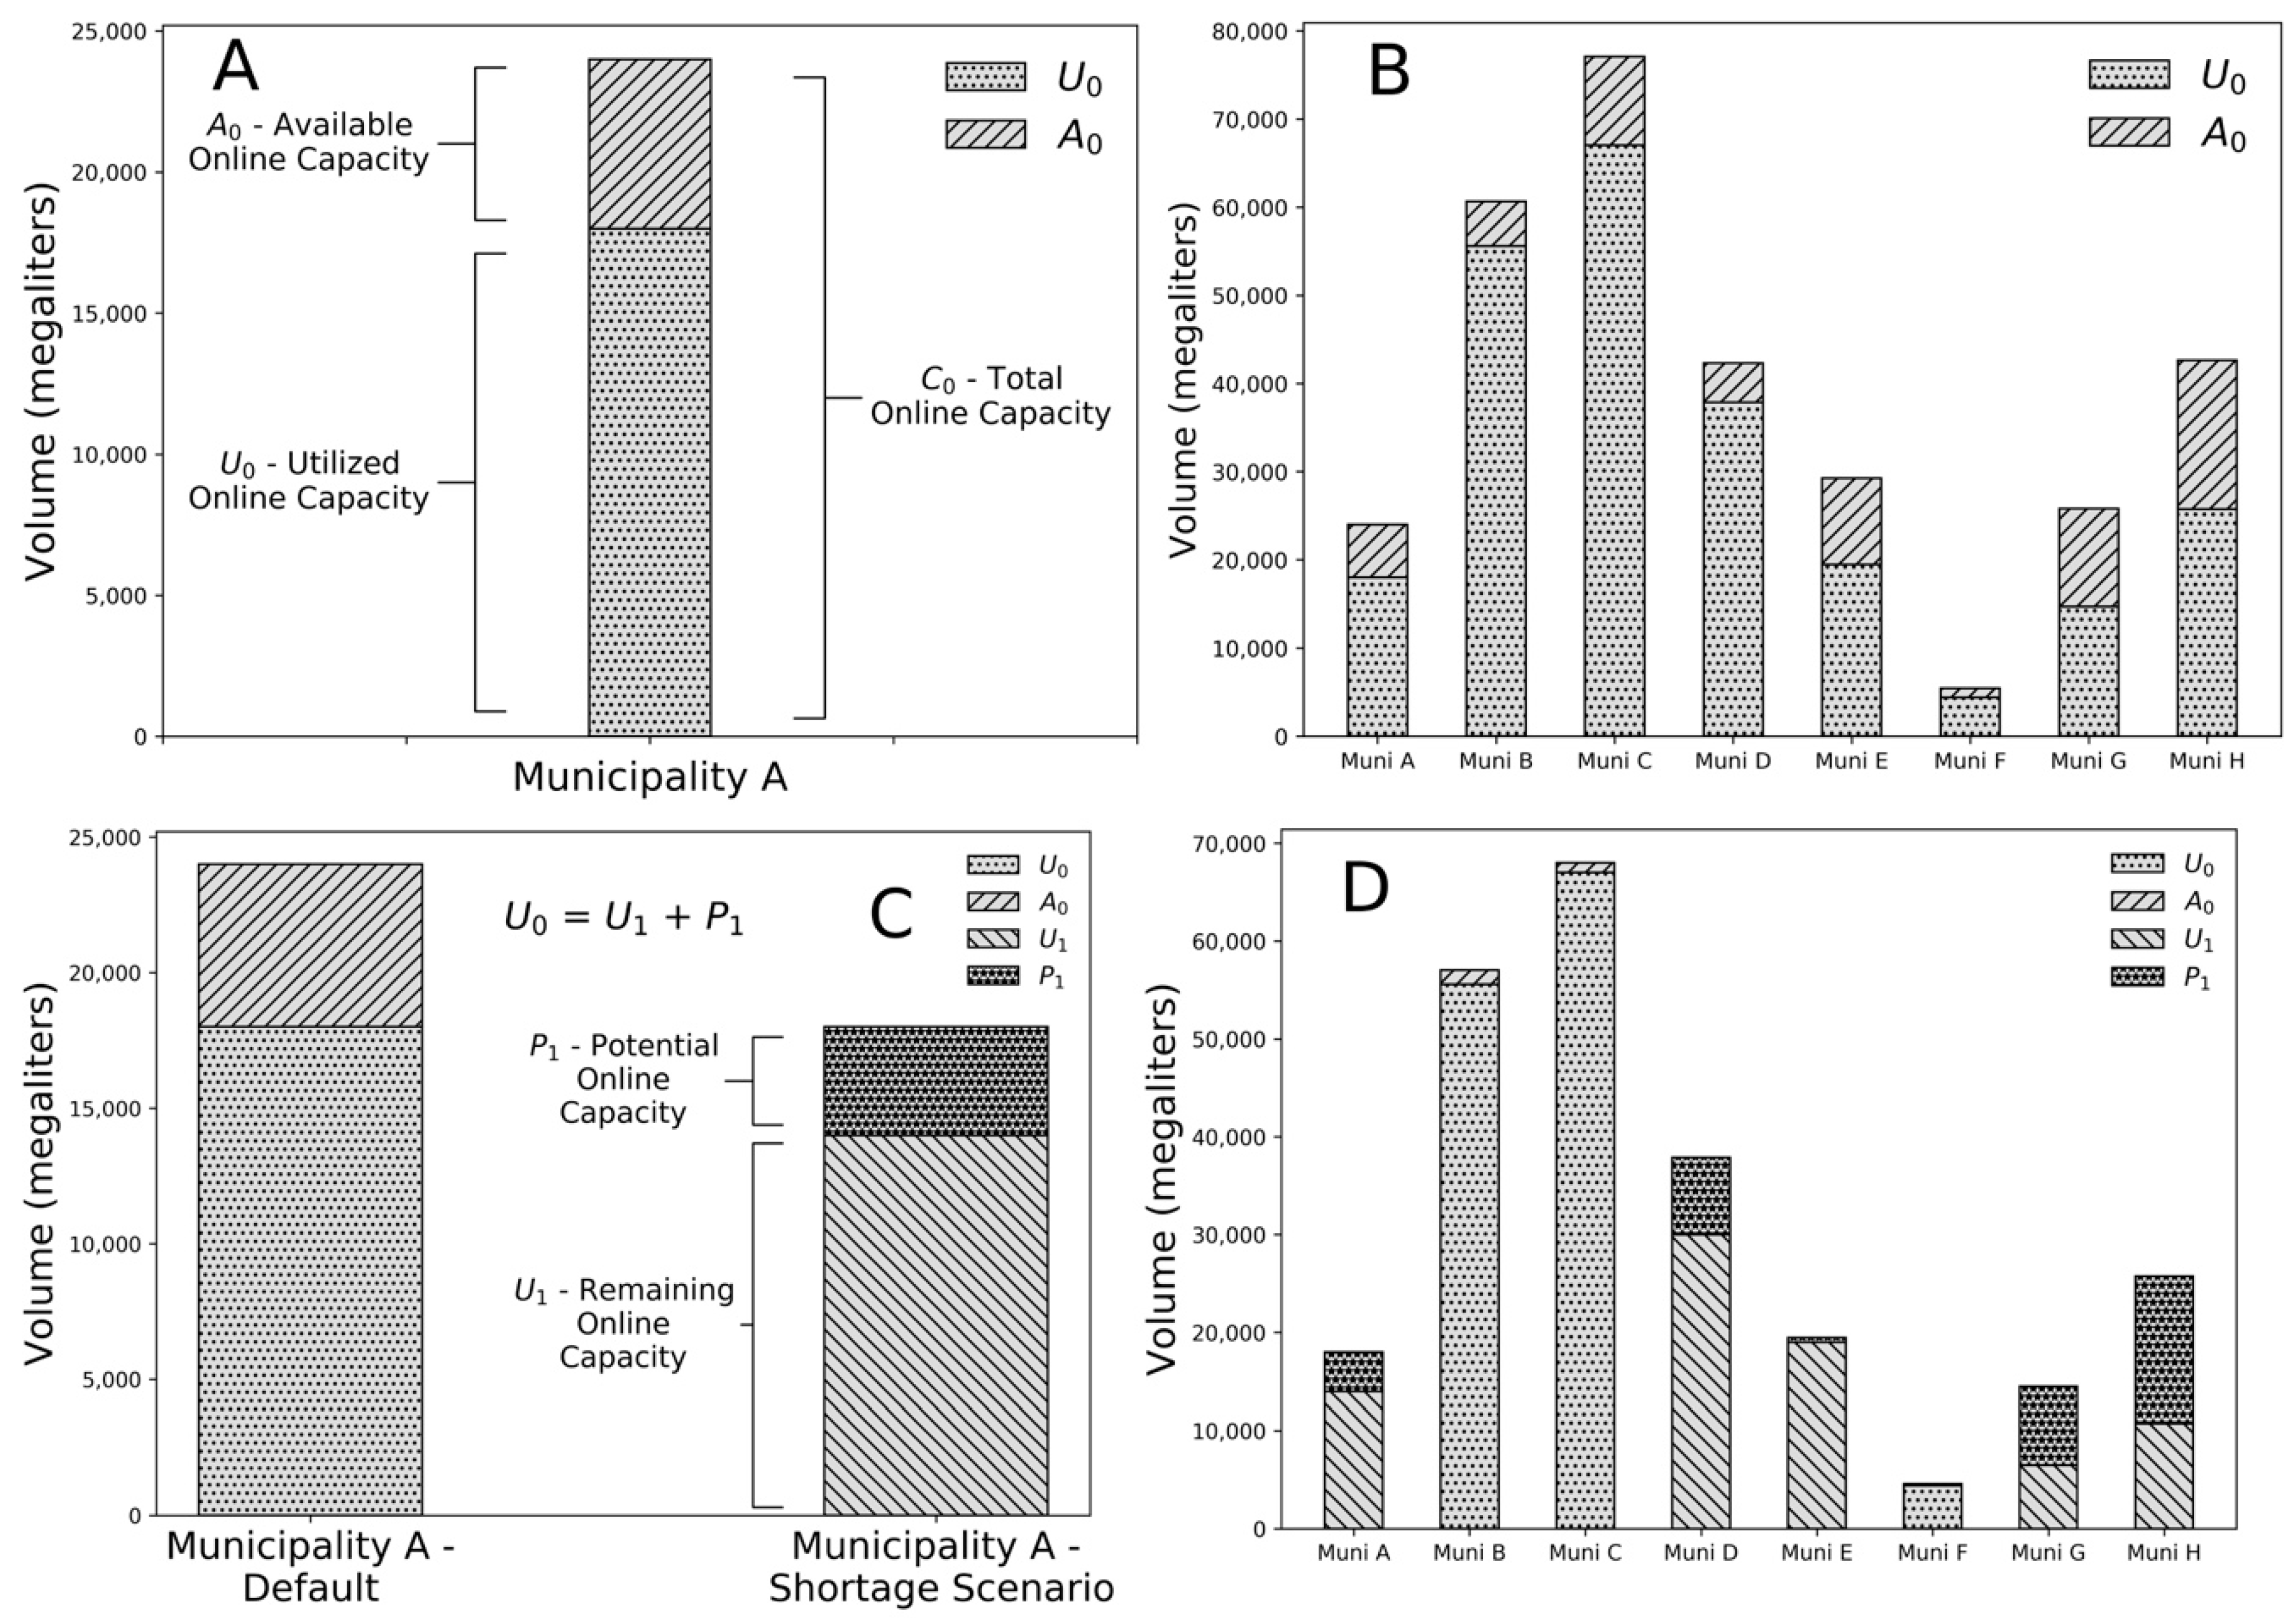
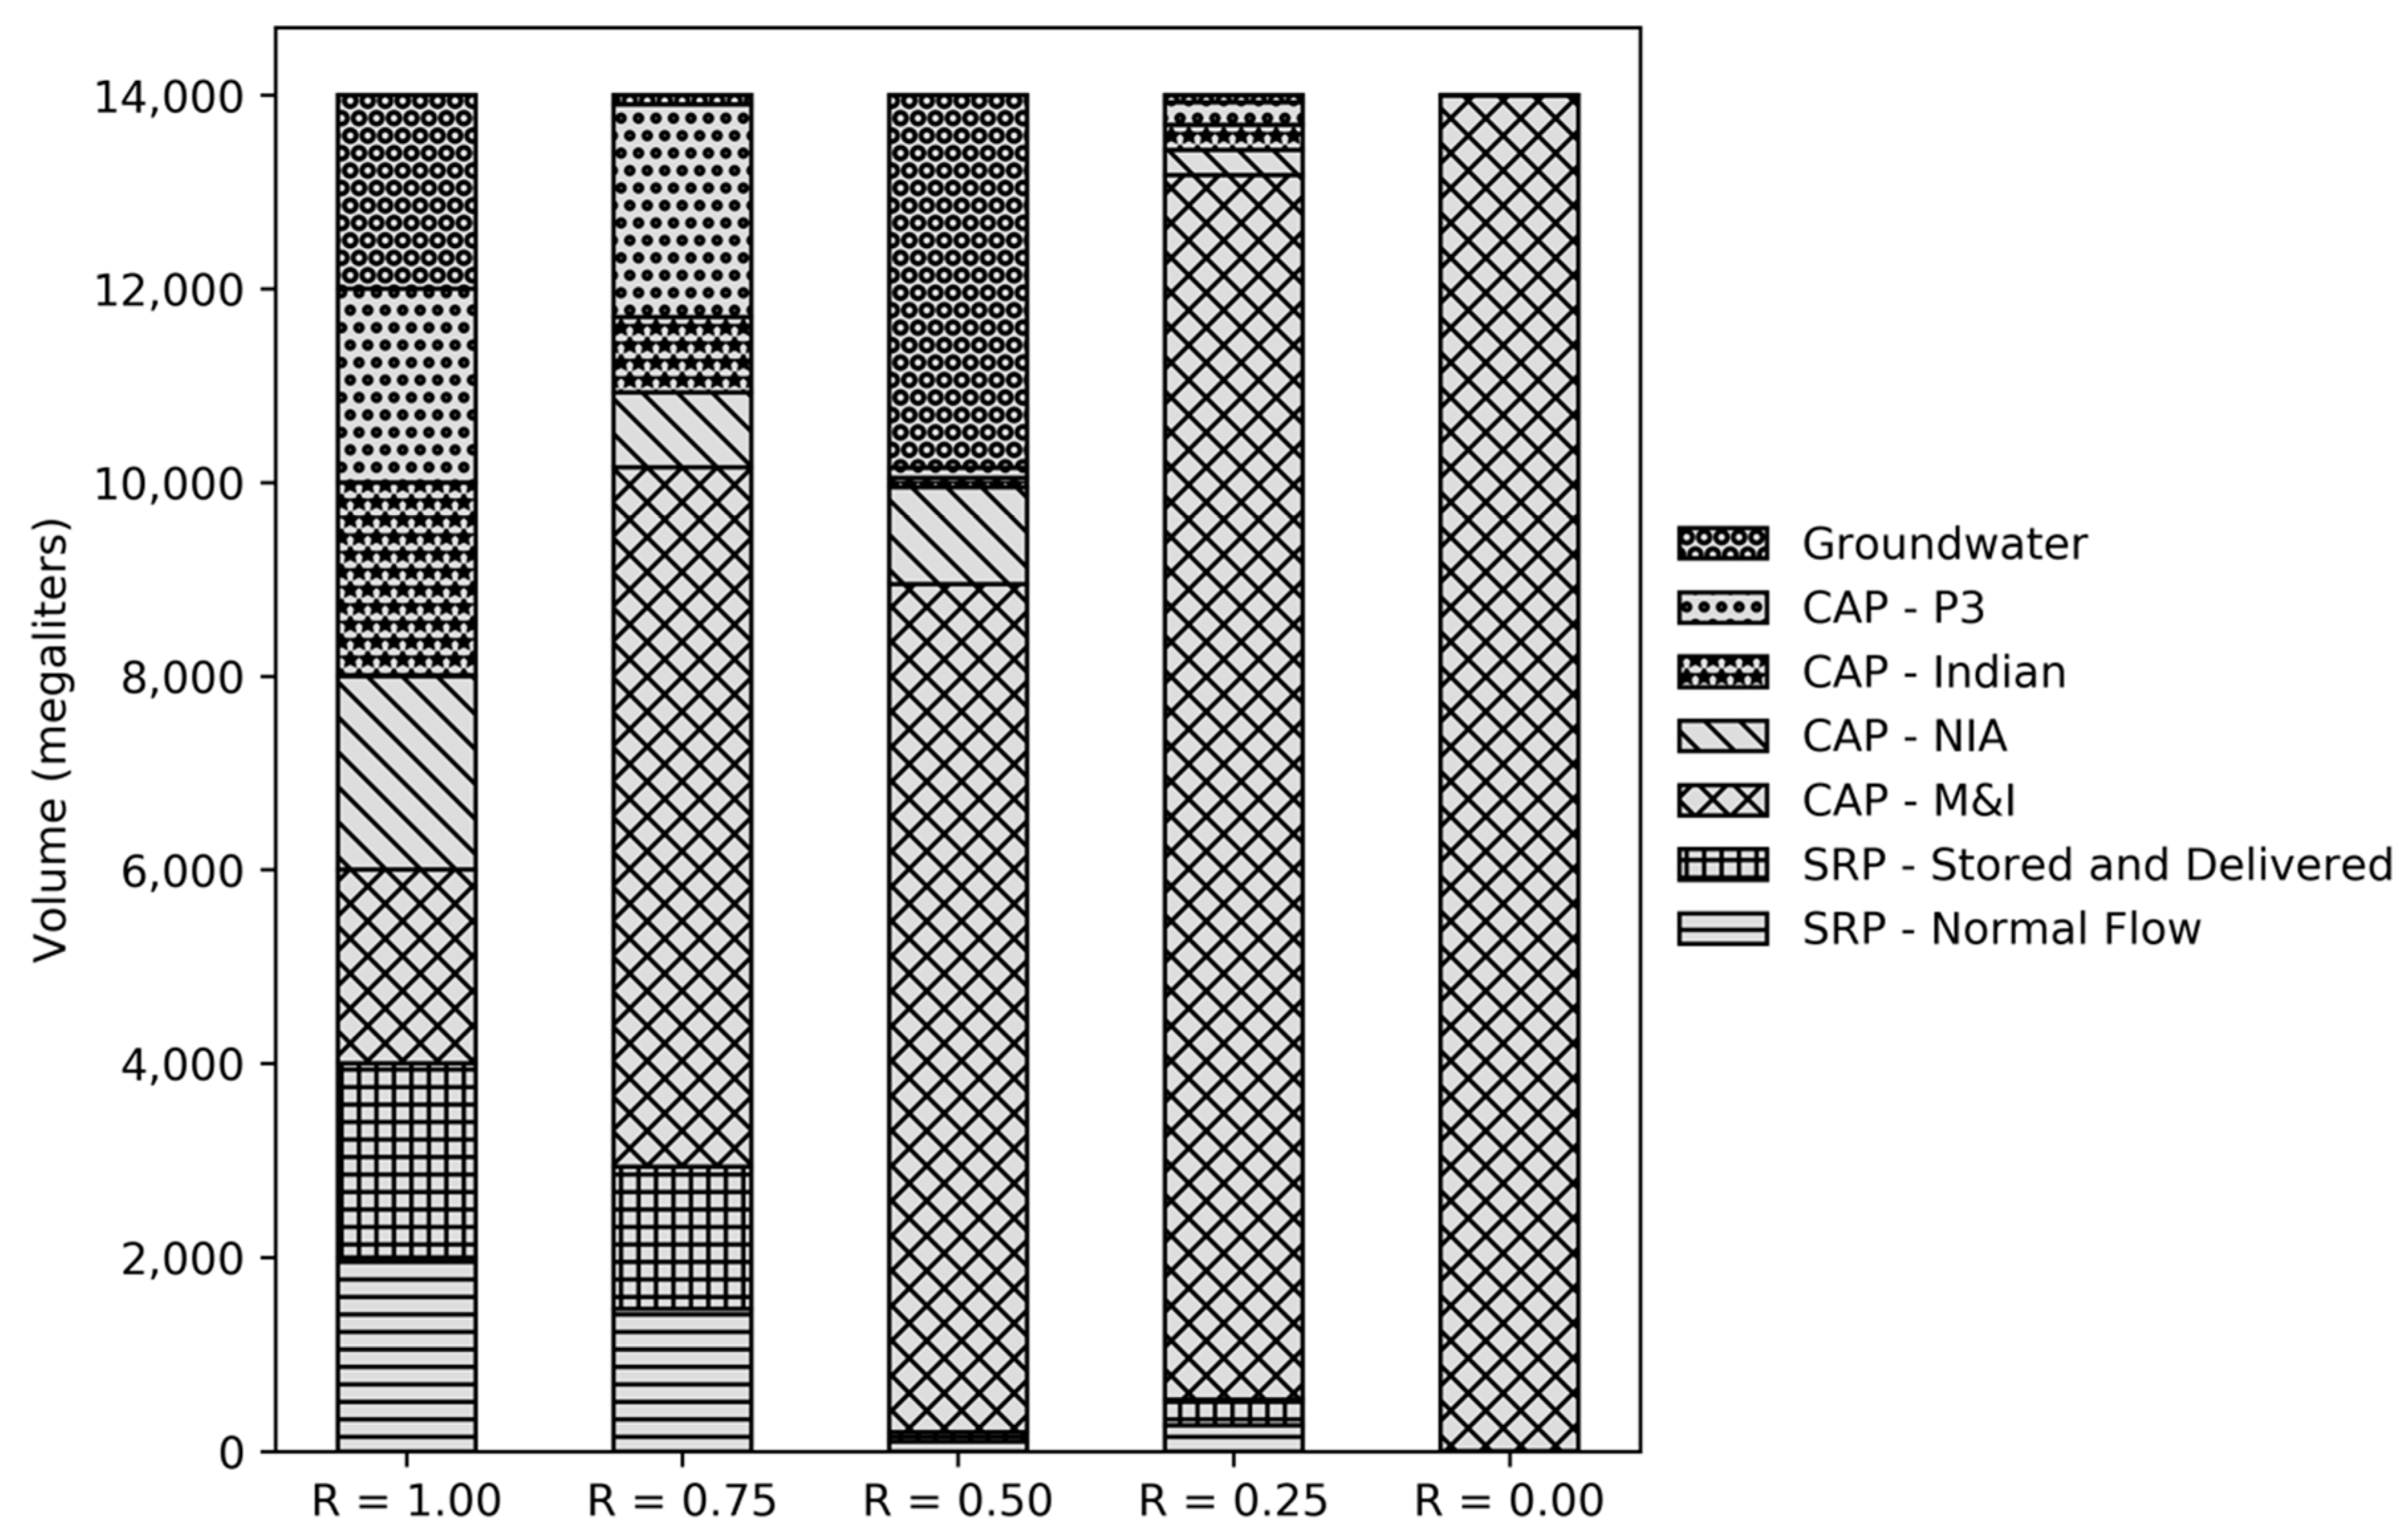
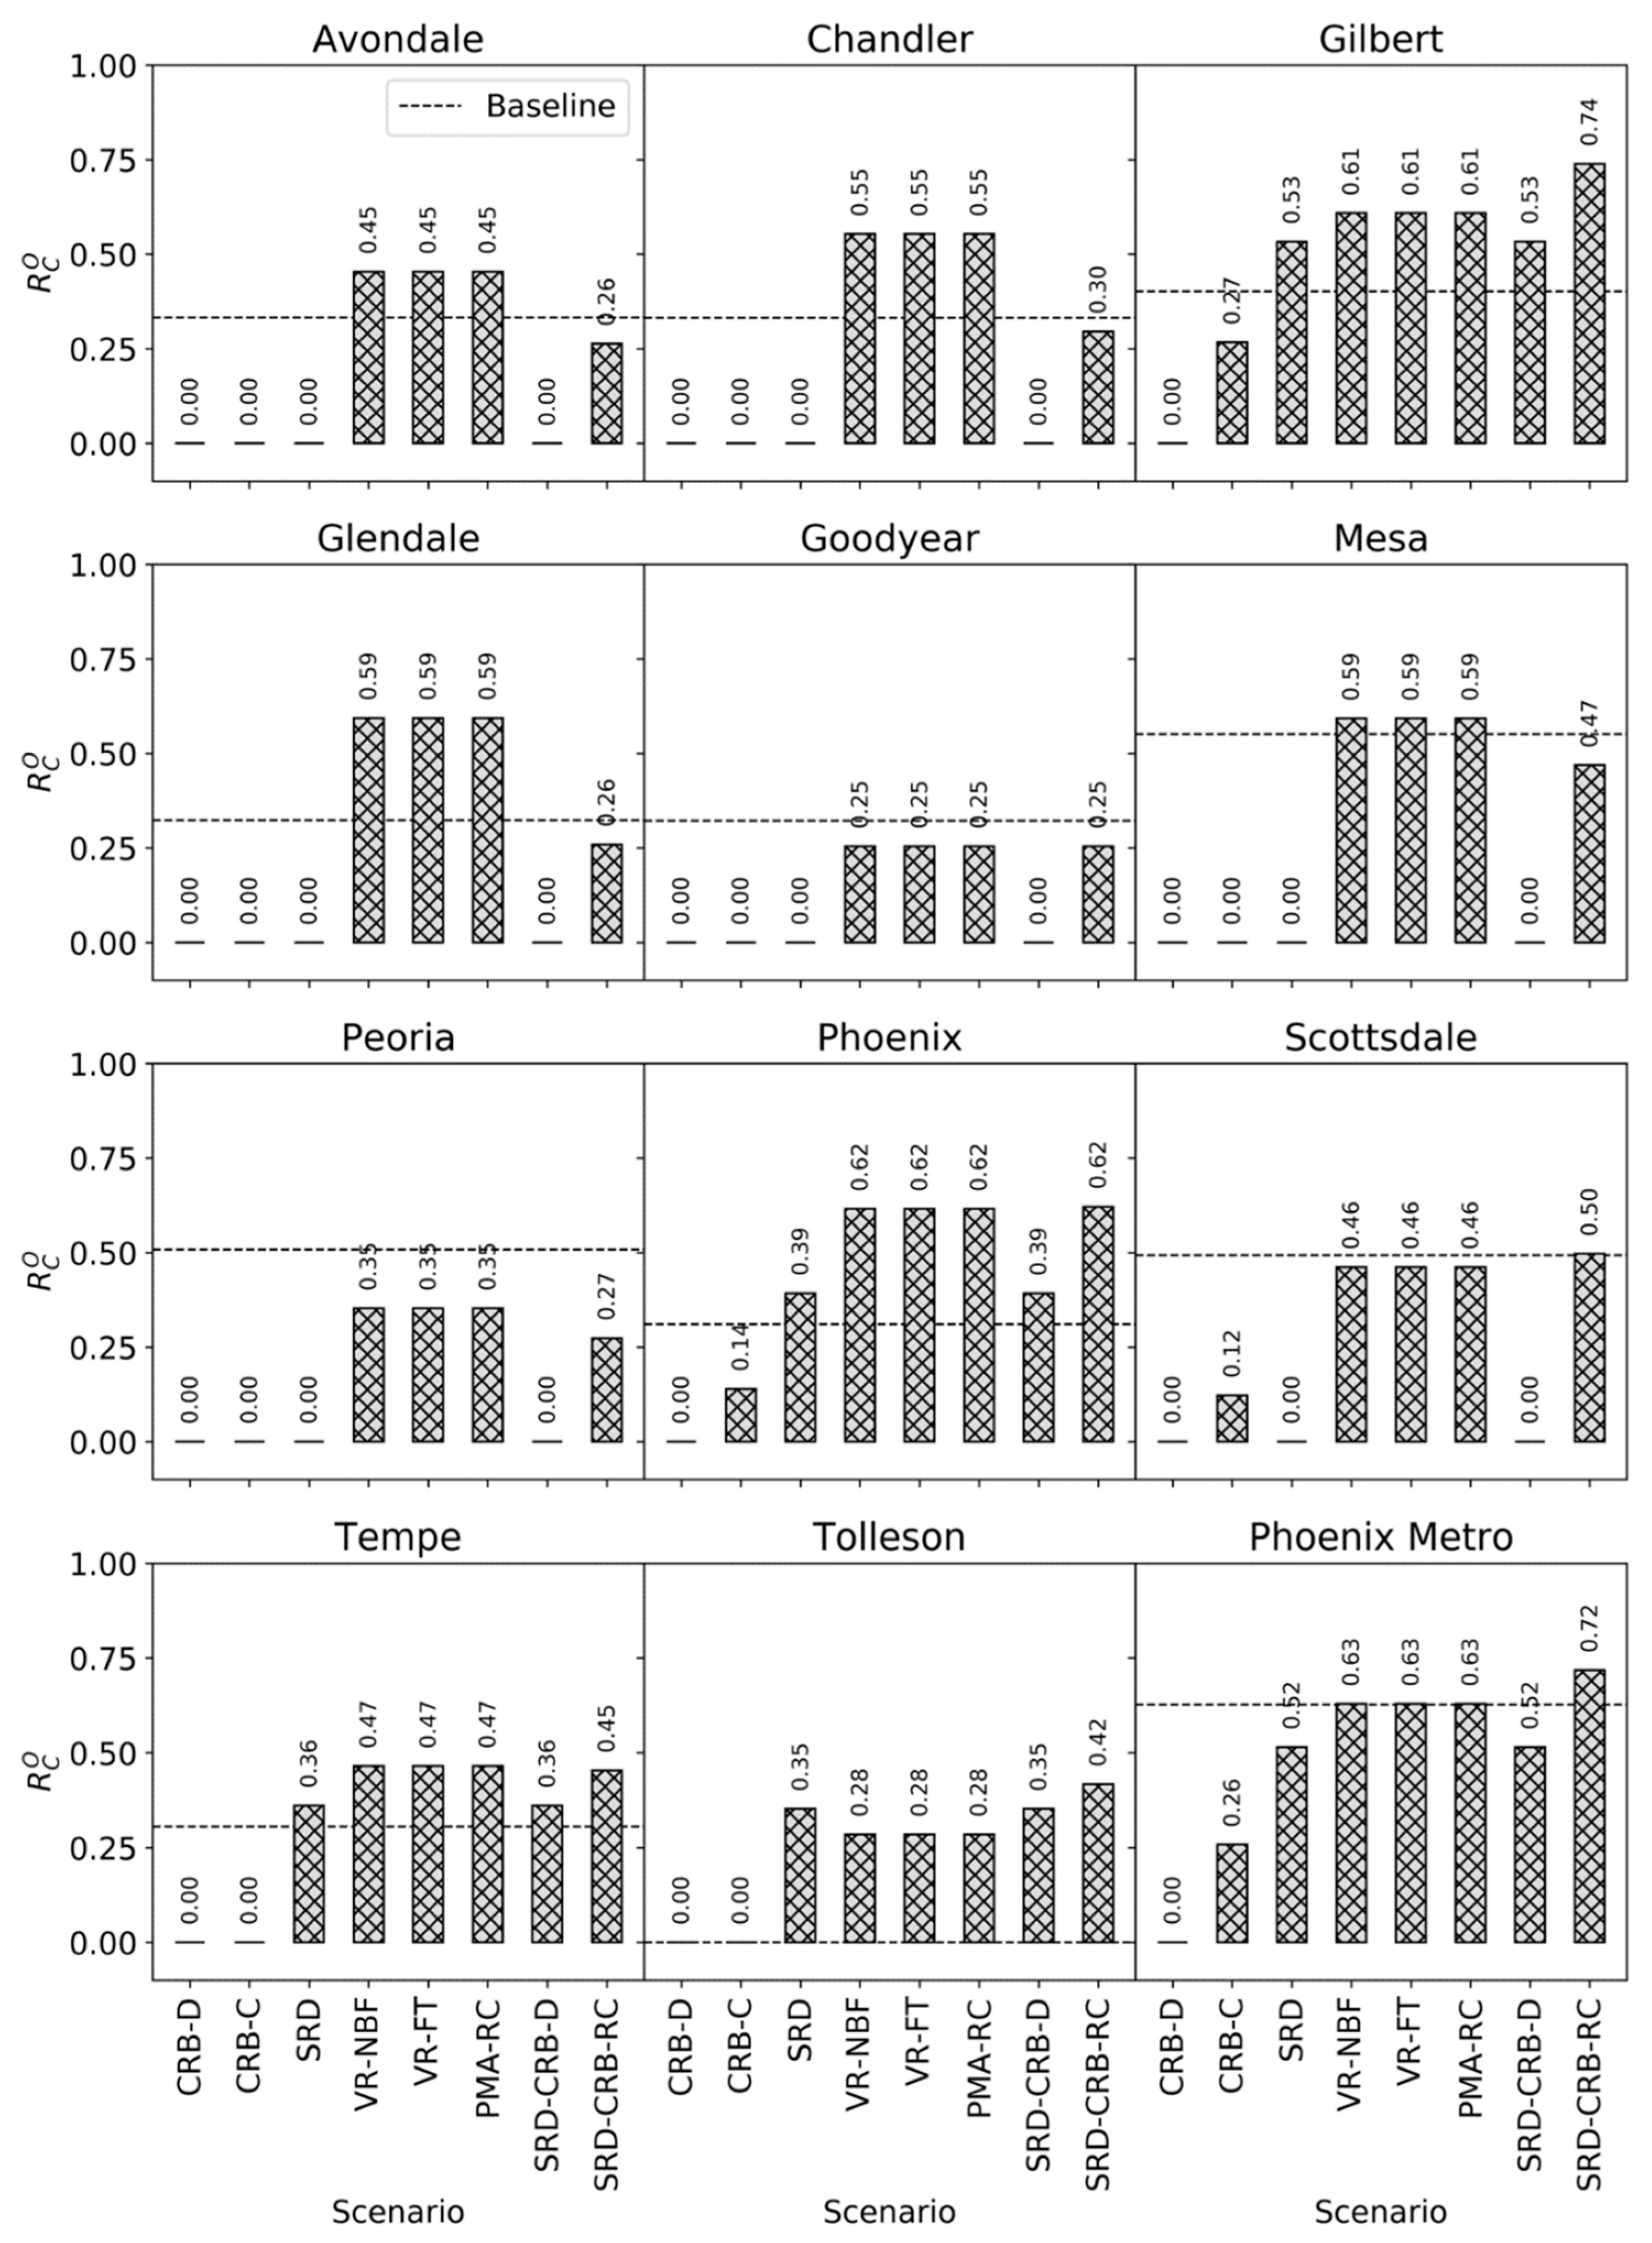
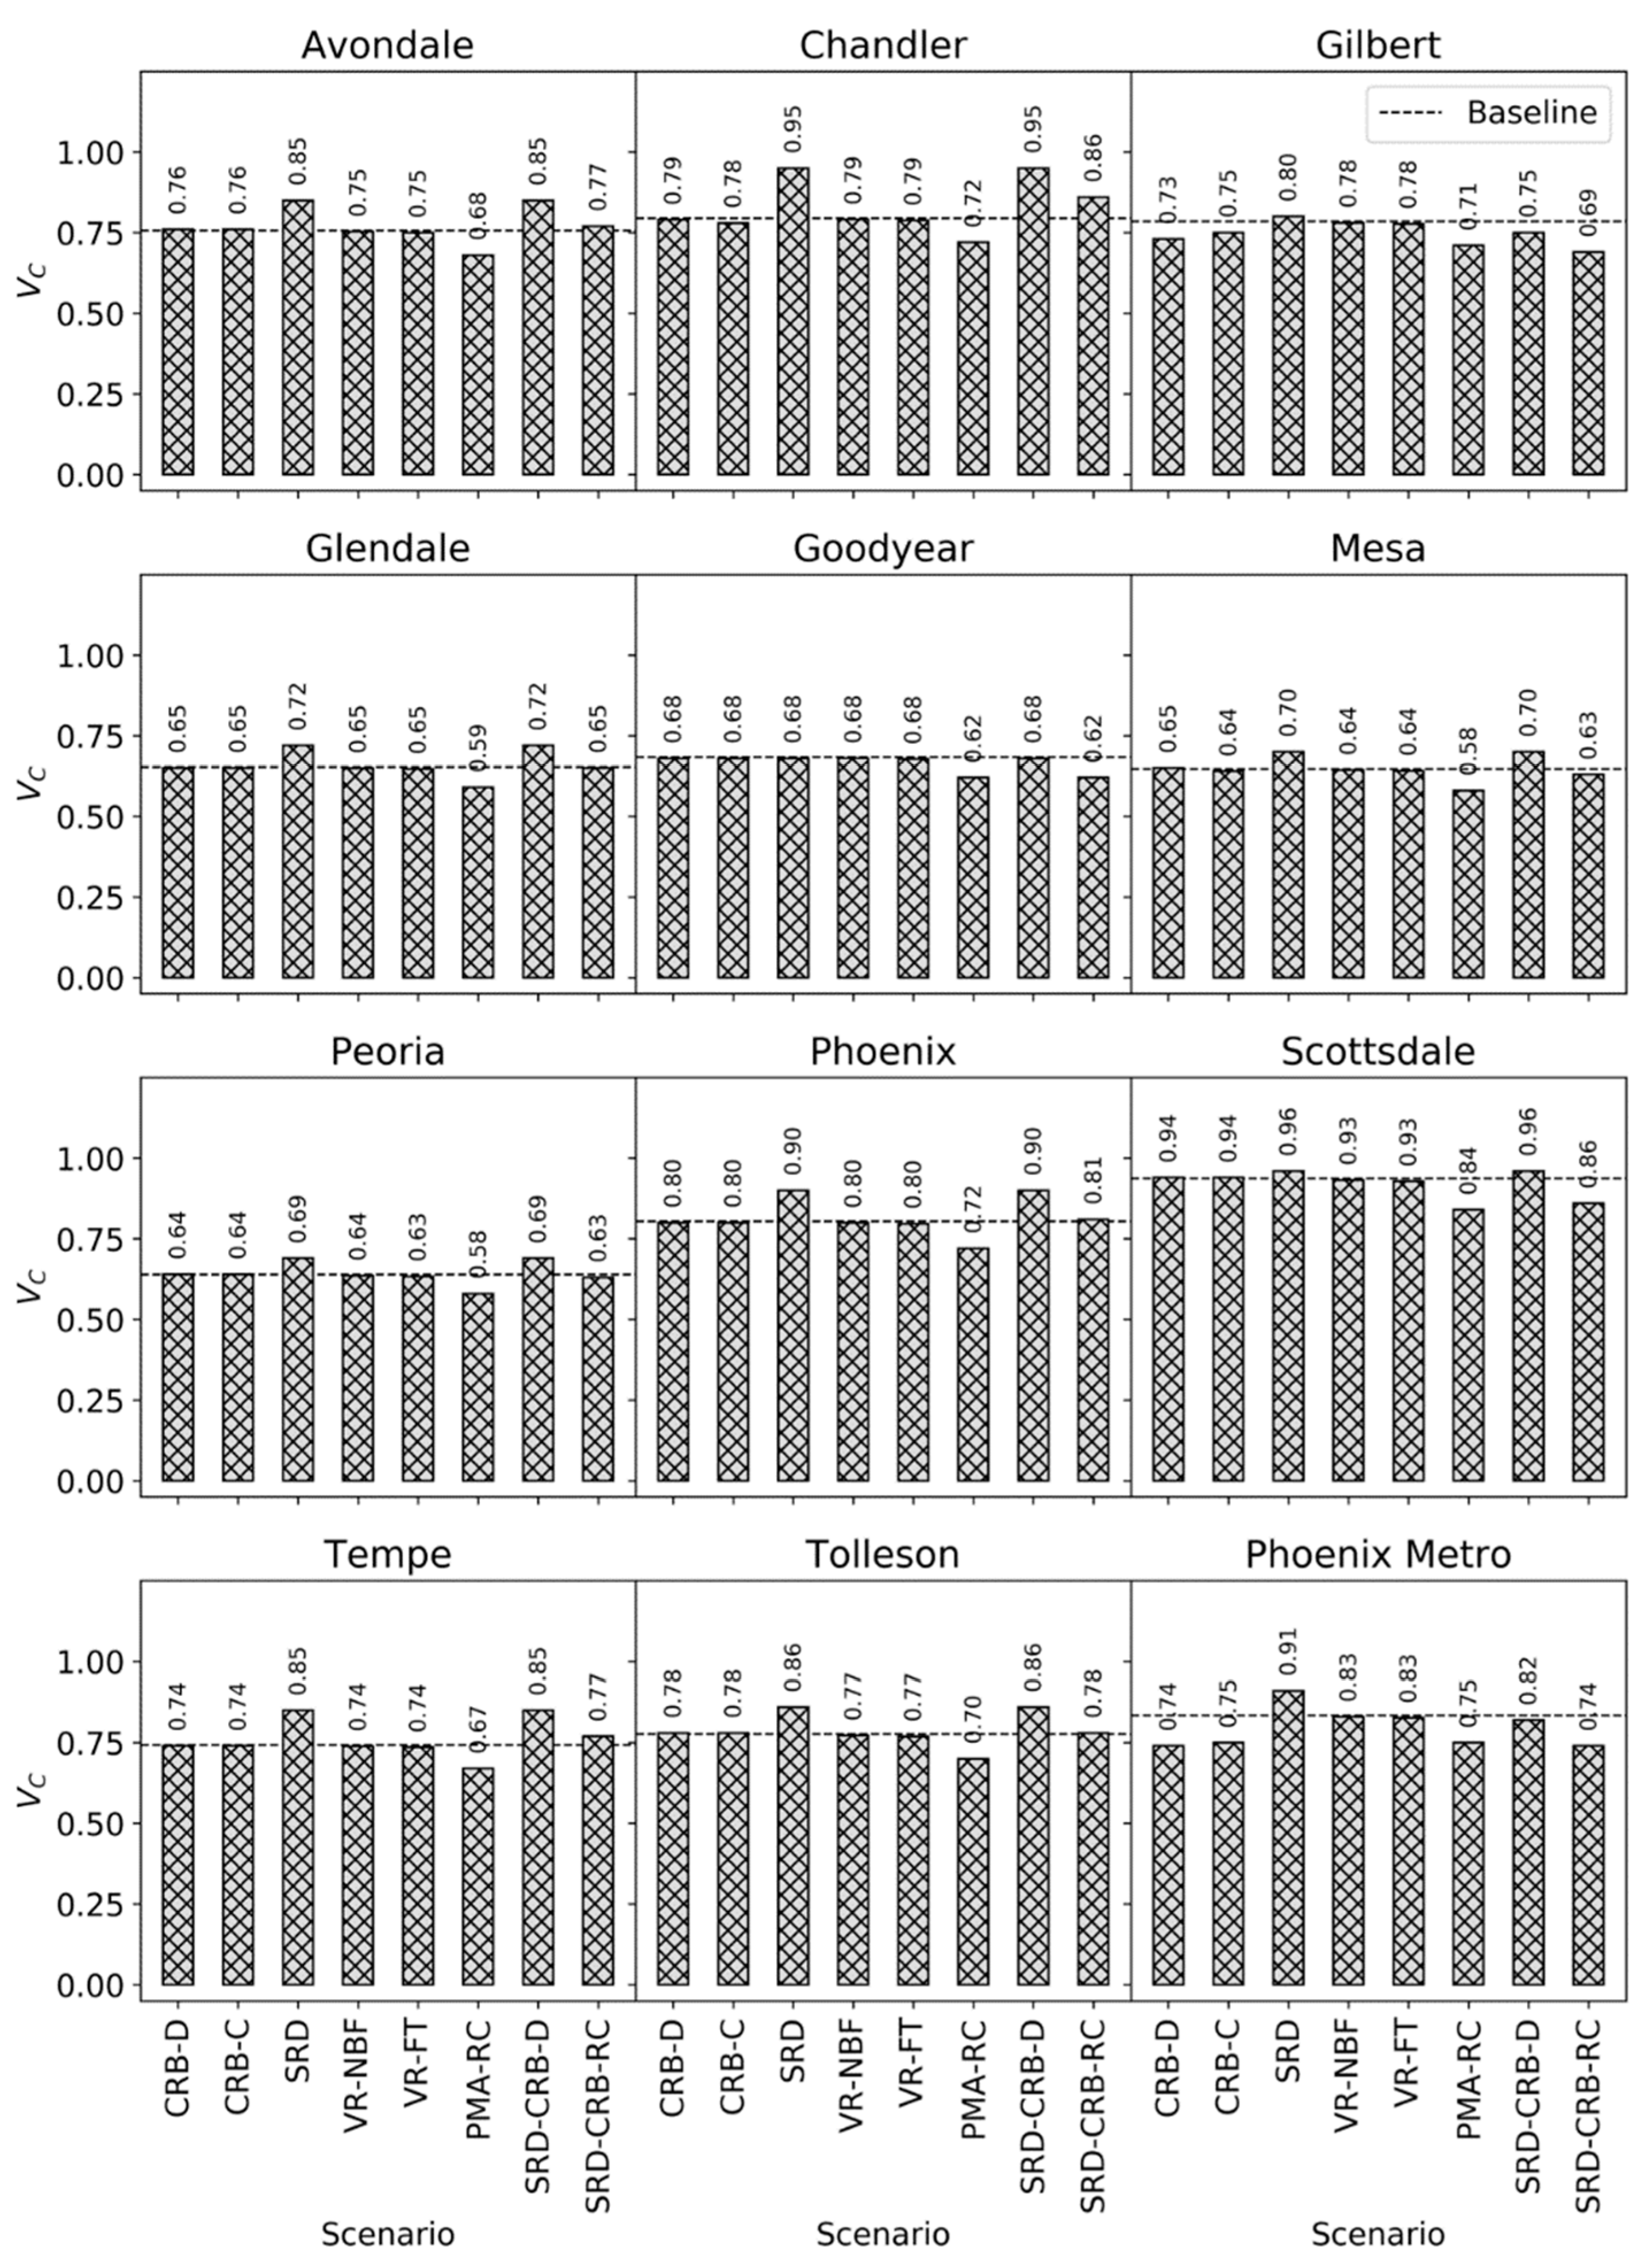
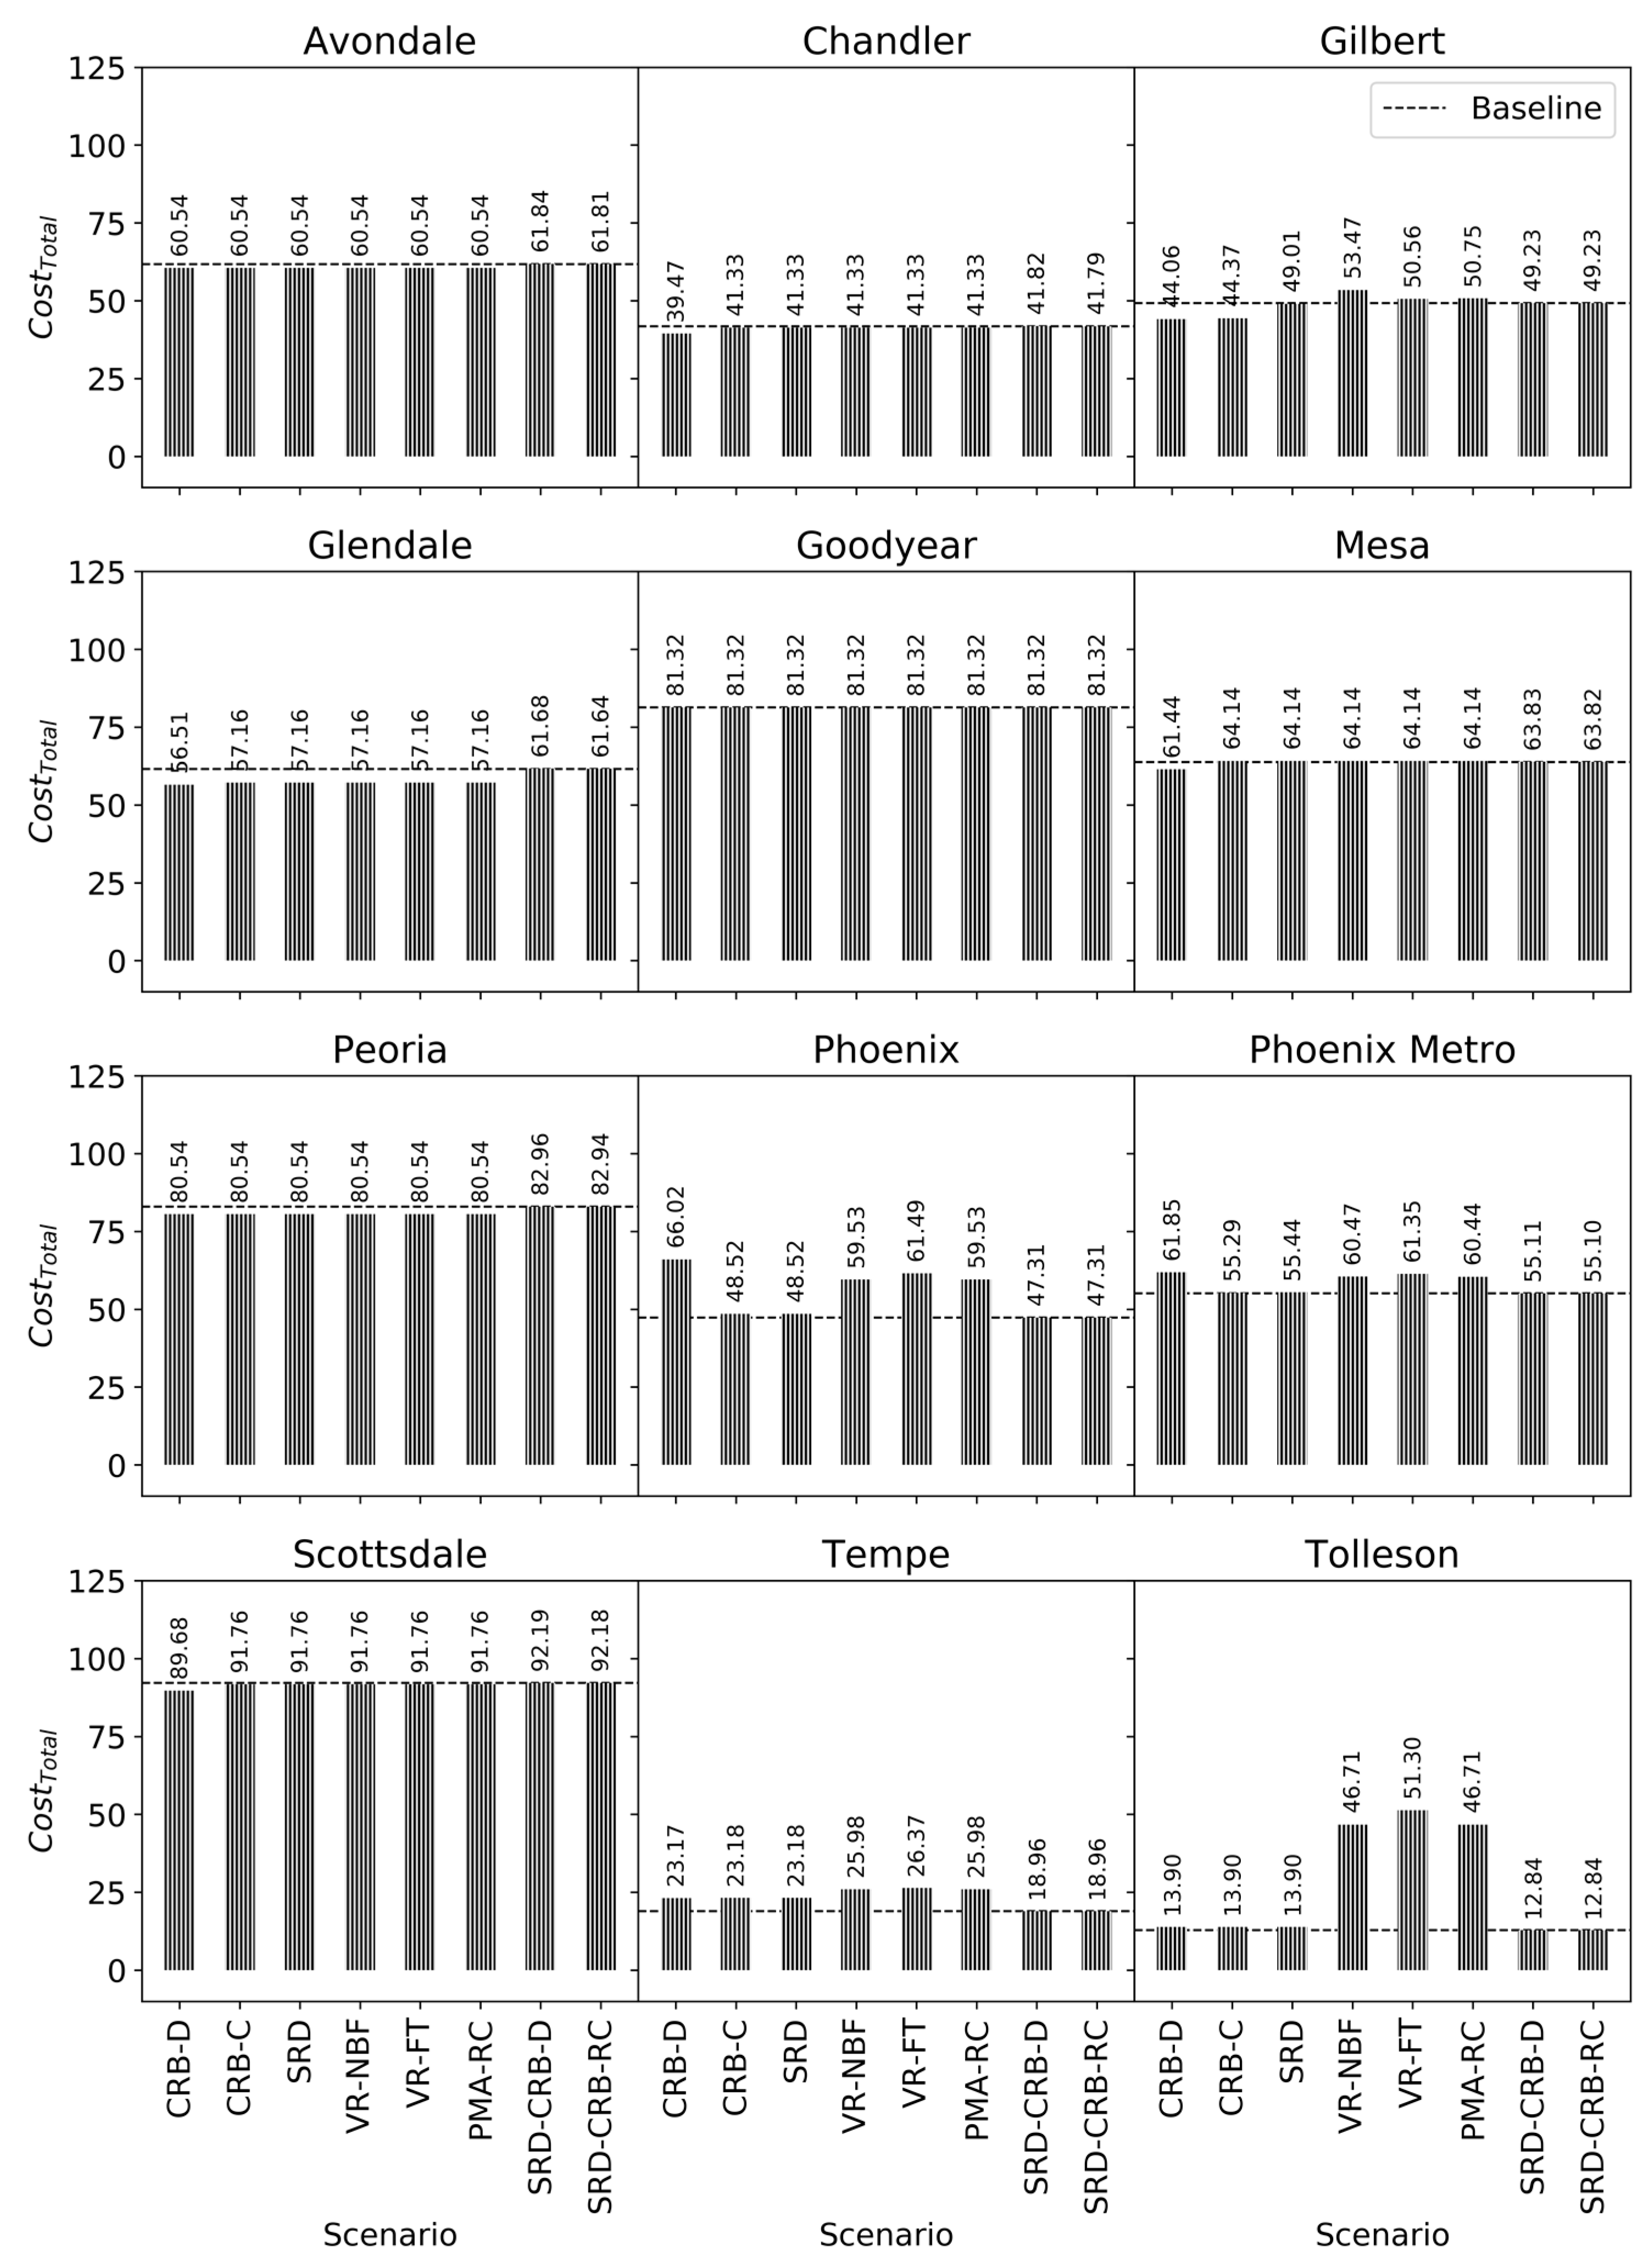
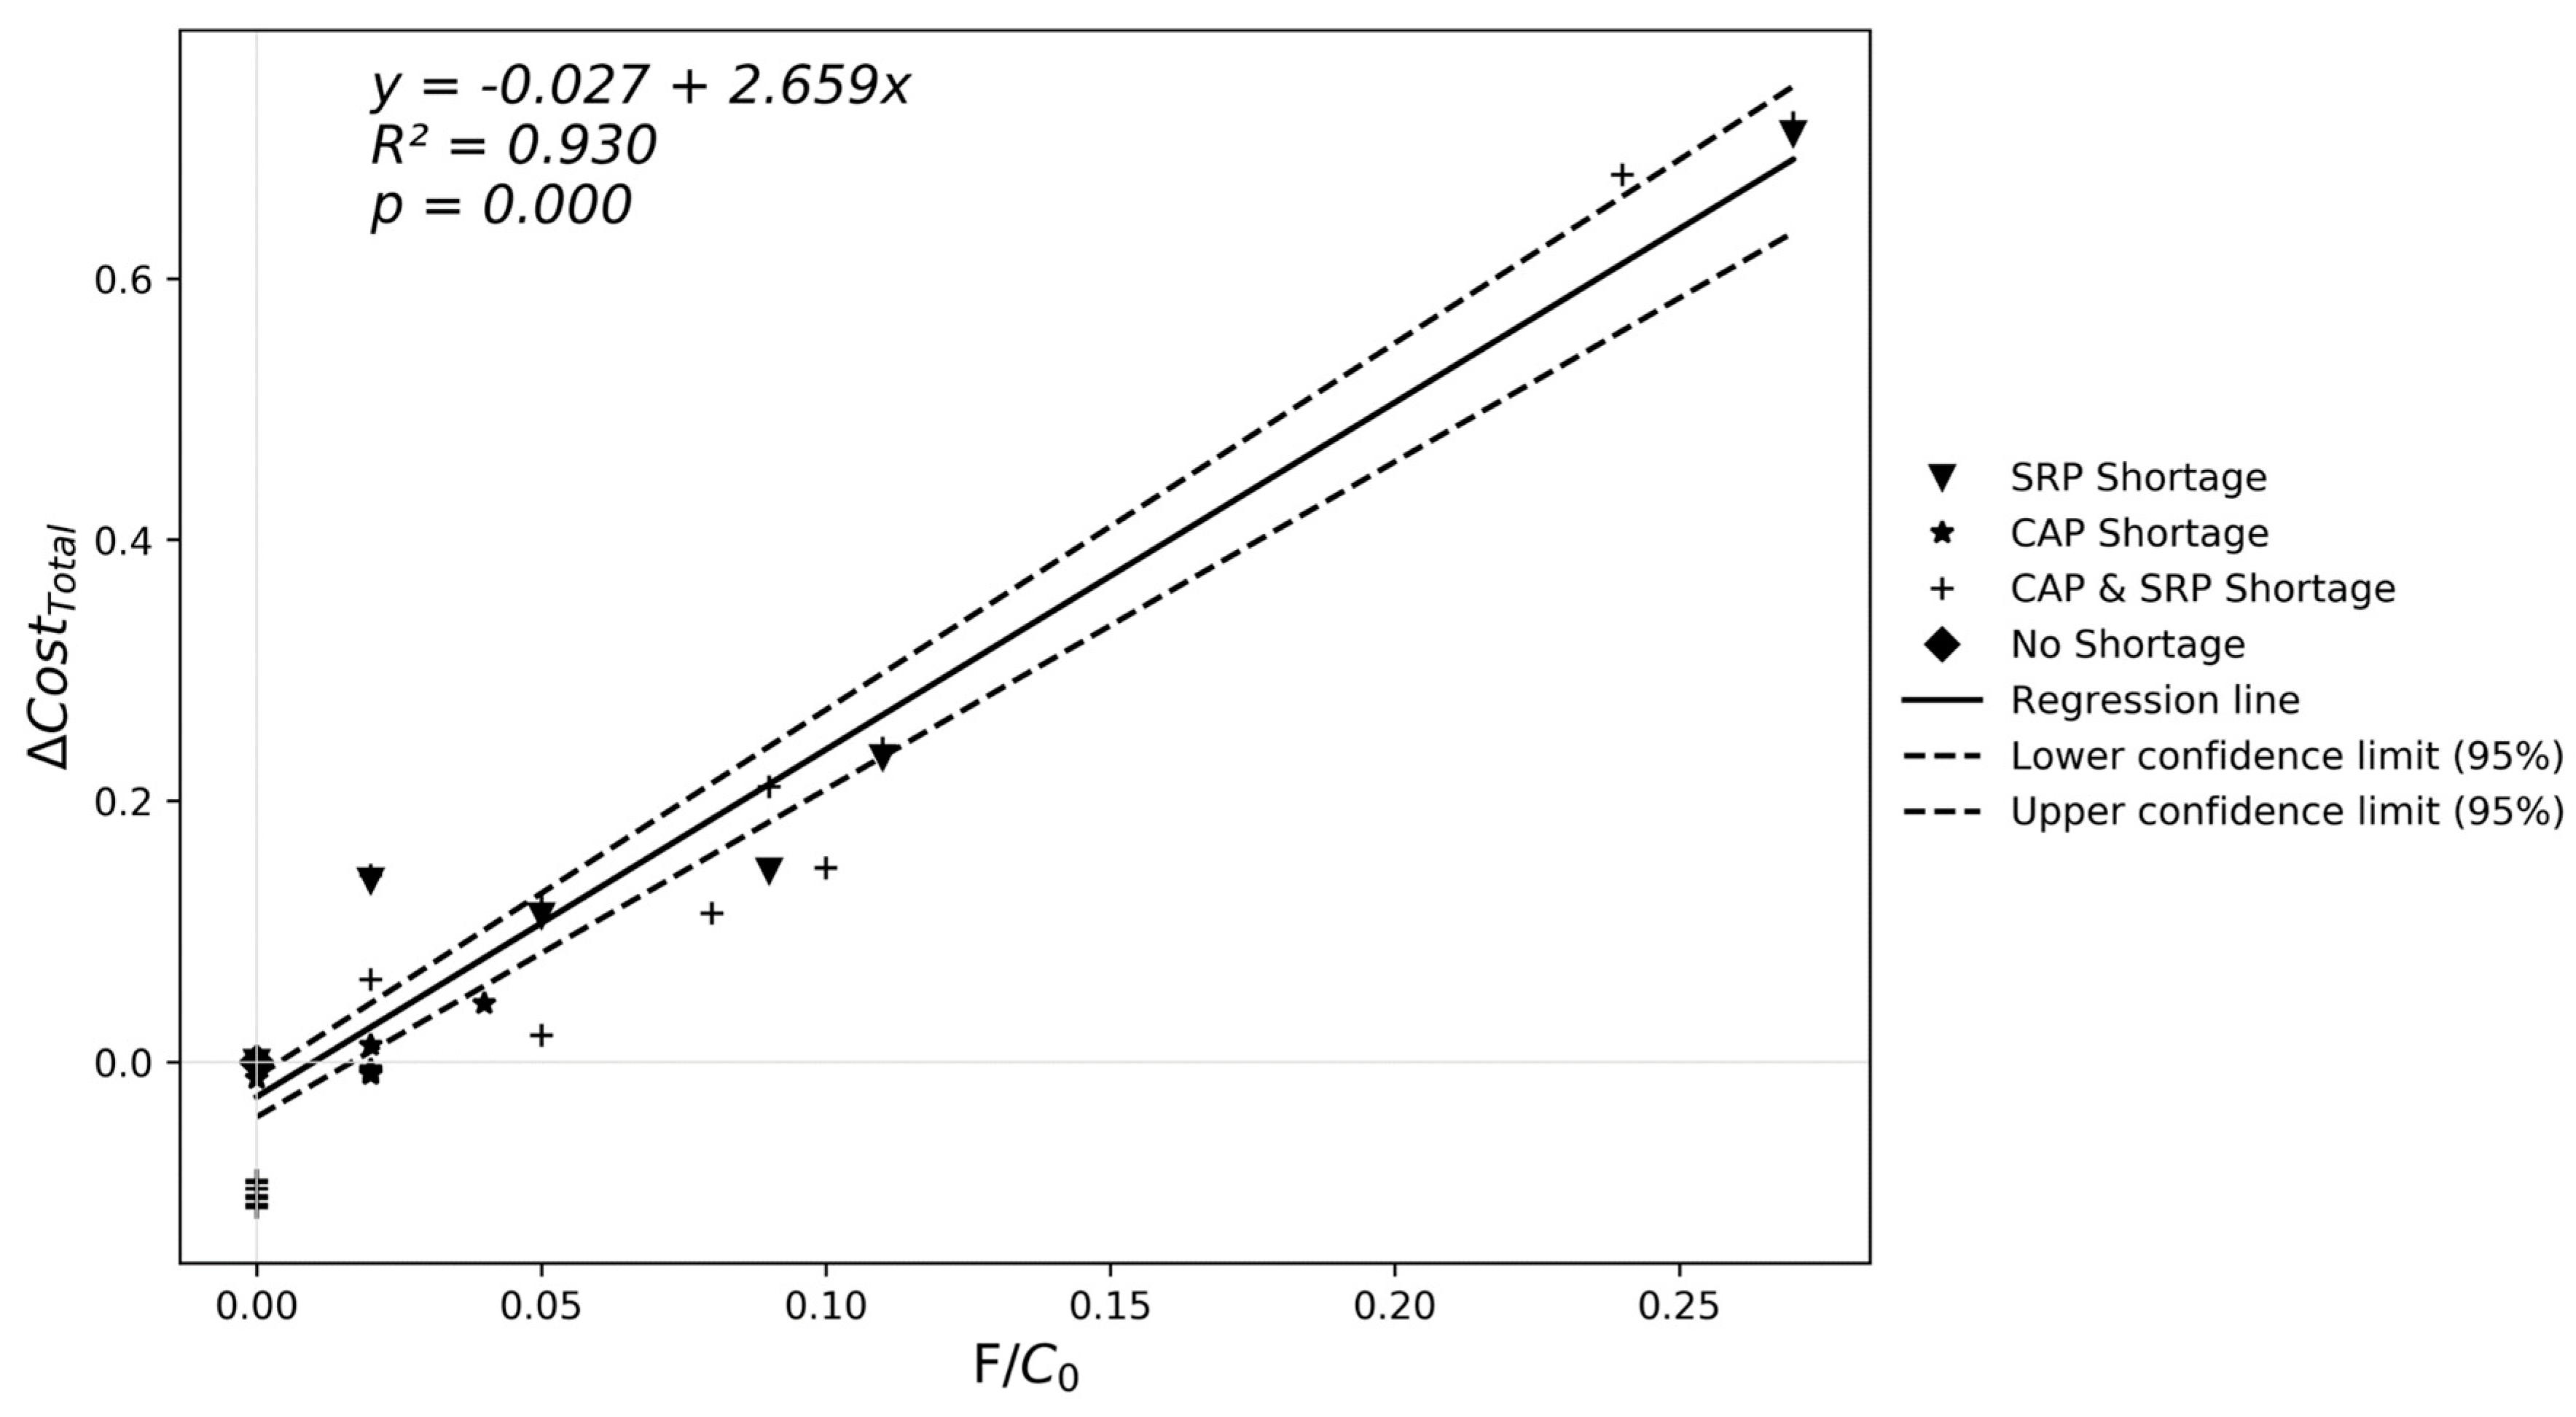
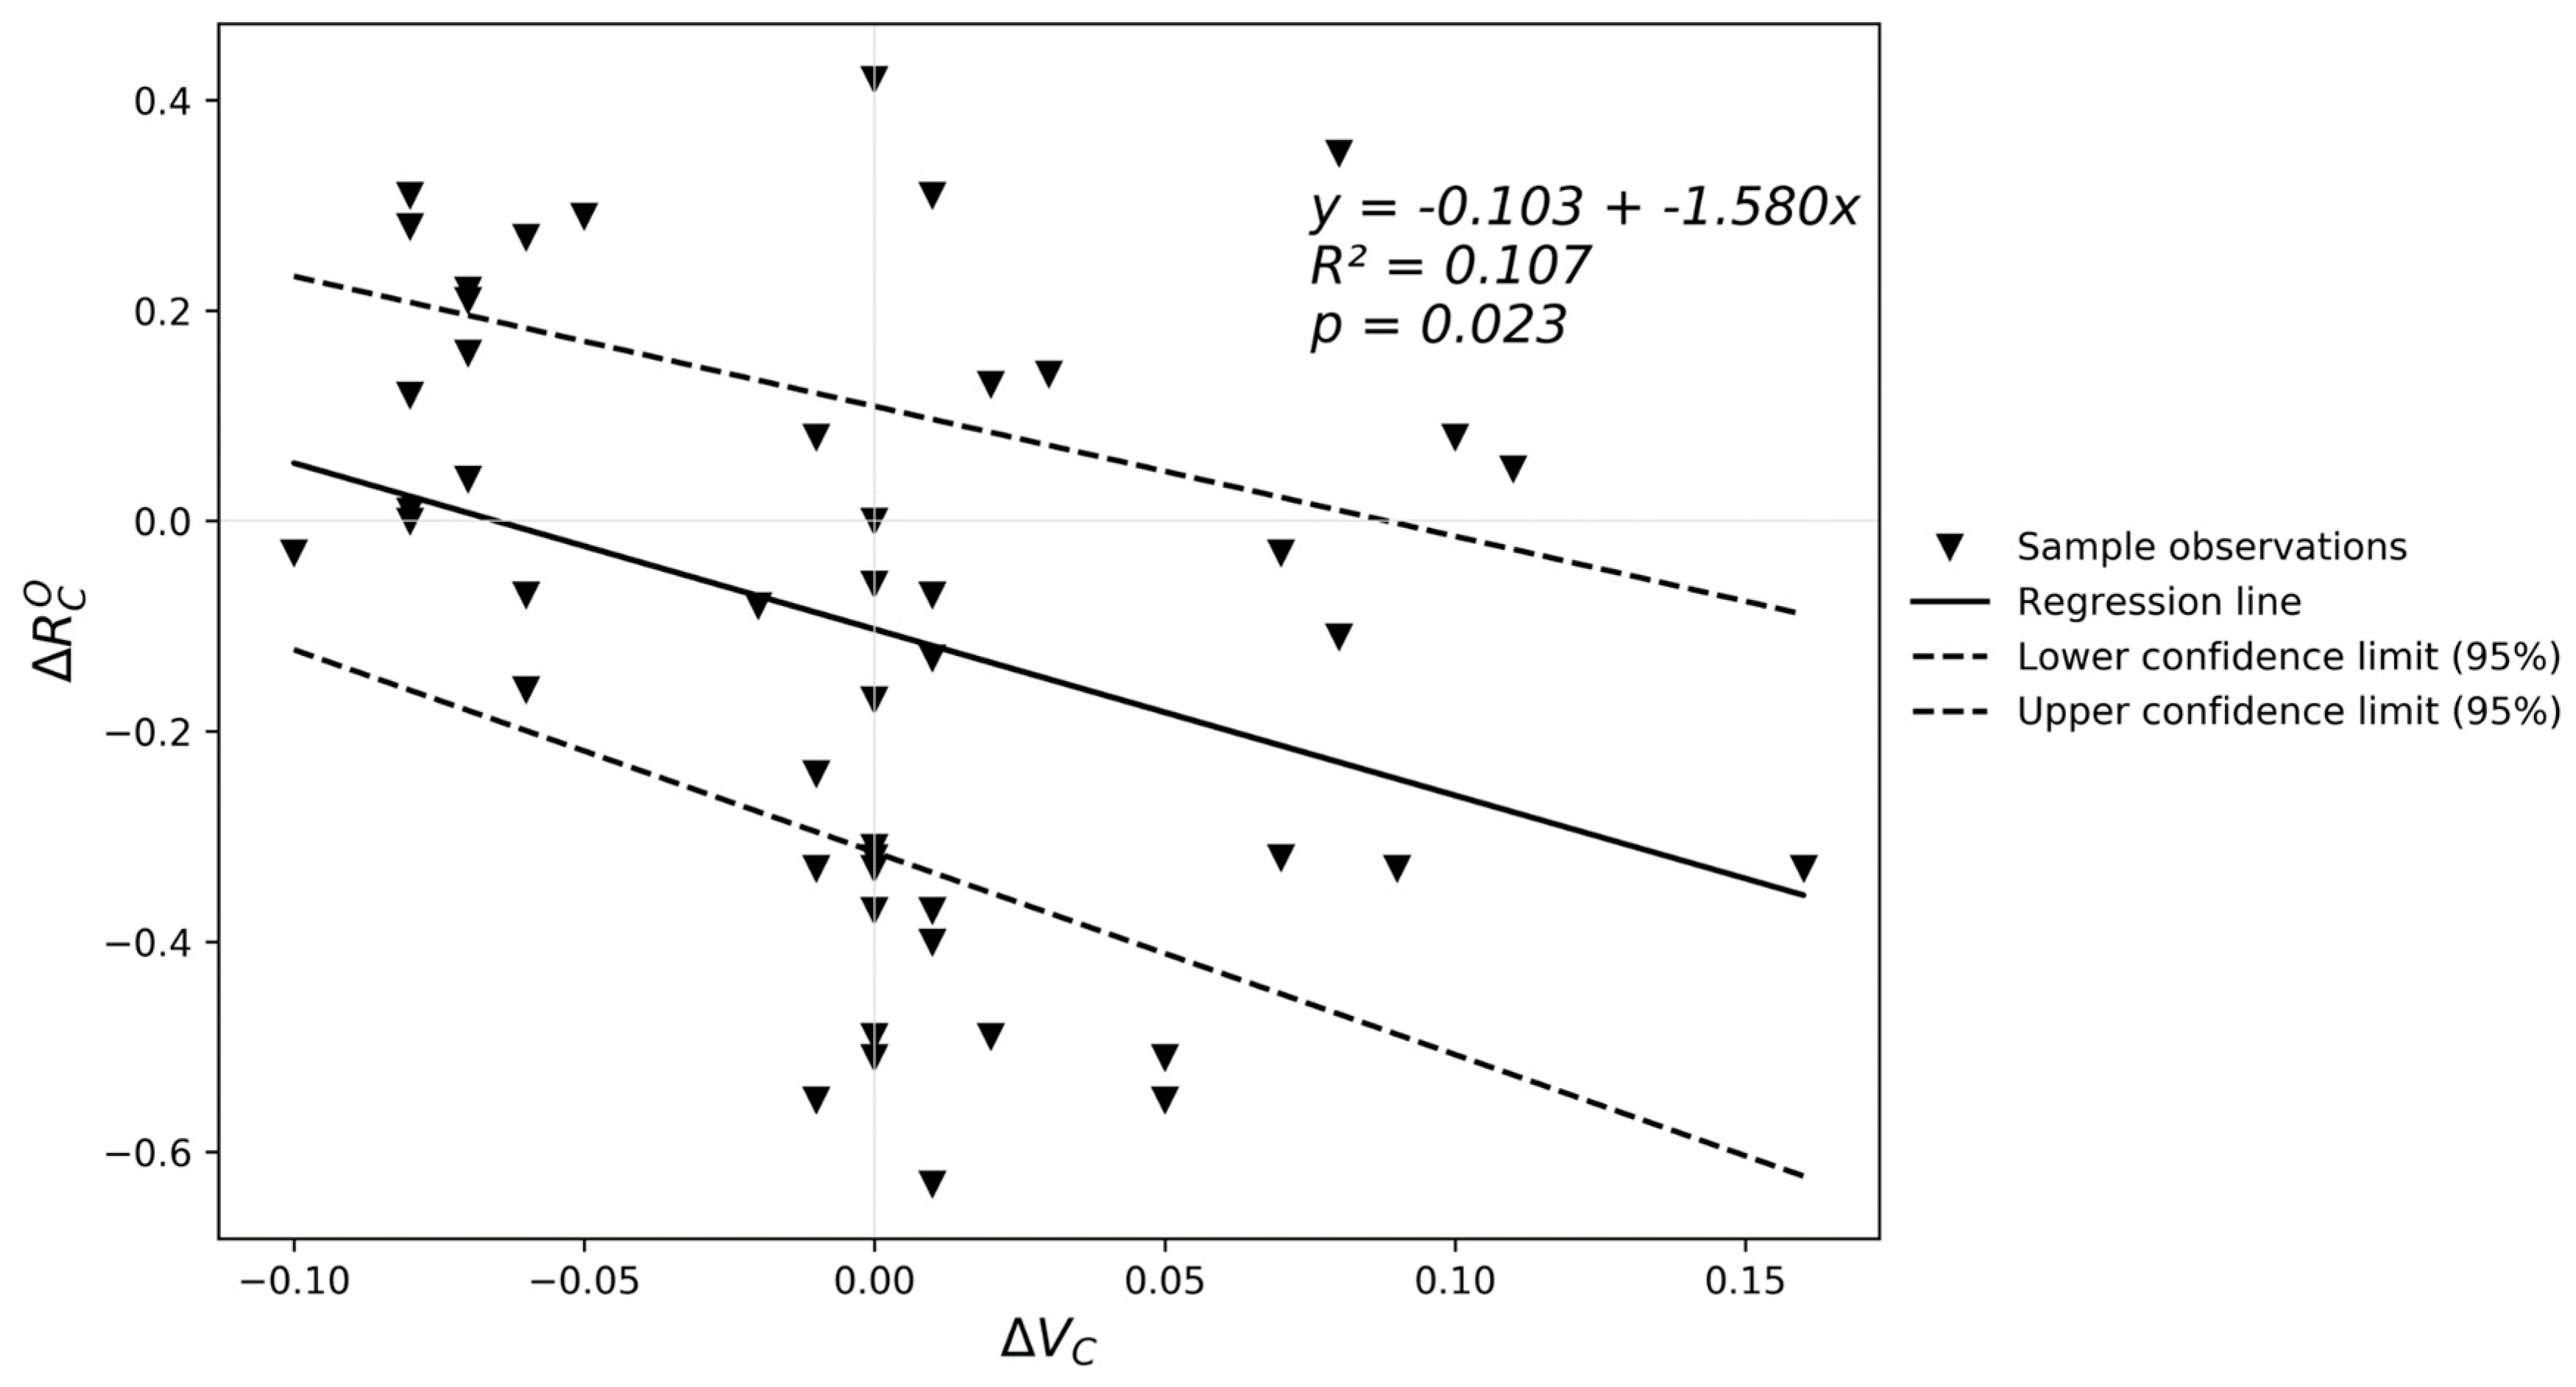
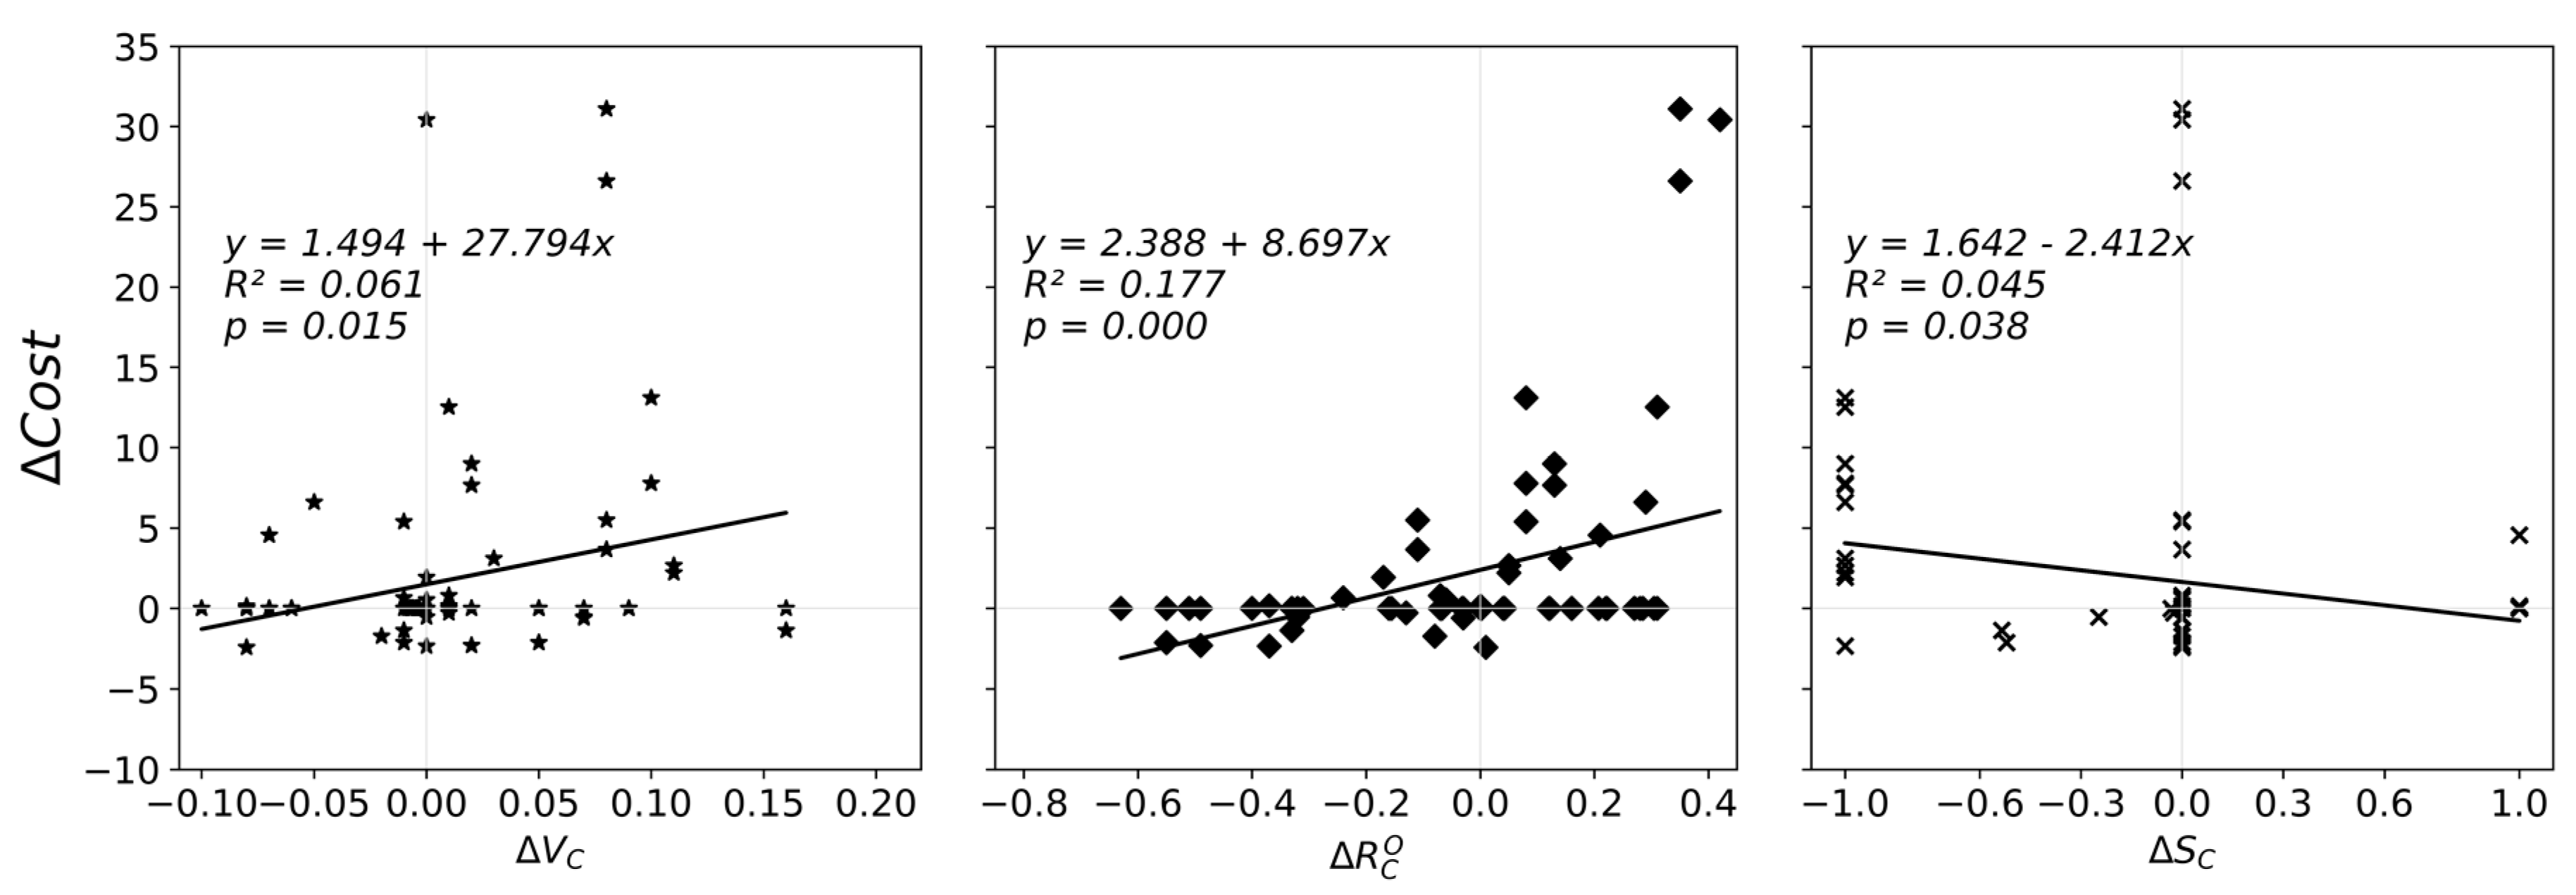
Table 1.
Water Sustainability, Resilience, Vulnerability, and Cost (SRVC) model data requirements.
| Requirement | Description |
|---|---|
| 1. | The identity of each online and potential water source and its capacity limitations. |
| 2. | The operating and capital costs of each online or potential water supply option, where cost includes monetized estimates of risk and insurance against risk. |
| 3. | The time delay required to develop each potential water source. |
| 4. | Sustainability of each water source measured as storage depletion at a given consumption rate. |
| 5. | Current and future Demand-to-Availability on online and potential water sources |
| 6. | Curtailment and conservation options available. |
| 7. | Quantities of water supply and consumption defining each planning scenario, e.g., climate change and growth in population. |
| 8. | The legal, hydrological, and infrastructural capacity and utilization of that capacity to use each online and potential water source. |
| 9. | Water supply deficit contingency plans and pathways. |
Table 2.
Online and potential water sources for Phoenix metropolitan area (PMA) municipalities at the annual decision timescale.
Table 2.
Online and potential water sources for Phoenix metropolitan area (PMA) municipalities at the annual decision timescale.
| Current Online Water Sources | Contractual Water Categories | Description |
| Salt River Project | Normal Flow | The “Normal Flow” a city would receive from the Salt River had there been no surface water storage system built along the Salt River. |
| Stored and Developed Water | Water delivered to On-Project Lands as defined by the 1910 Kent Decree. | |
| Central Arizona Project | Municipal and Industrial (M&I) Subcontracts | Water leased directly to municipalities by the Central Arizona Water Conservation District |
| Indian Contracts | Water originally decreed for agricultural purposes on Native American reservations in Central and Southern Arizona but later obtained by municipalities by lease or exchange | |
| Non-Indian Agricultural Subcontracts | Water originally decreed for agricultural purposes Central and Southern Arizona but later obtained by municipalities by lease or exchange | |
| Central Arizona Project (CAP) Priority Water | Water obtained by municipalities via an exchange with the Wellton-Mohawk Irrigation District located in Yuma County for main stem Colorado River water | |
| Groundwater | — | |
| Potential Online Water Sources | Contractual Water Categories | Description |
| Type 2 Groundwater Rights | — | Grandfathered groundwater right established before Arizona’s 1980 Groundwater Management Act |
| Arizona Water Banking Authority (AWBA) | — | Purchased Long-Term Storage Credit of surface water banked by AWBA |
| Flow Augmentation | — | Thinning overgrown forests in the Salt-Verde Watershed. |
| Investing in irrigation efficiency in the Verde Valley and pledging water savings to in-stream flow. |
Table 3.
Cost and potential capacity of PMA adaptive water options.
| Adaptive Water Option | Phoenix Active Management Area (AMA) AWBA Balance | CAP Lease (Short-Term) | CAP Lease (Long-Term) | Type 2 Lease | Colorado River |
|---|---|---|---|---|---|
| Water Source | AWBA | CAP | CAP | Groundwater | Colorado River |
| Total Annualized Cost a ($ ML−1 year−1) | 100–500 | 100–500 | 100–500 | 100–500 | 100–500 |
| Potential Capacity b, P0 (ML) | 1,373,503 b | ~729,643 c | ~729,643 c | 38,376 d | 972,857 e |
a Cost data adapted from [29]; a range of 100–500 is displayed instead of the precise numbers used in this study as these market cost data are private, sensitive, proprietary, and confidential; Colorado River and CAP Short-Term Lease options have the highest costs among these five options. b Potential Capacity data calculated from [49]. c [68]. d [69]. e [70].
Table 4.
Water security planning scenarios.
| Scenario | Description |
|---|---|
| Baseline Scenario (Base) | Current normal operations of the SRP and CAP water systems for PMA municipalities [46,54,55,56,57,58,59,60,61,62,63]. |
| Colorado River Current Drought Contingency Plan (CRB-D) | The U.S. Bureau of Reclamation declares a shortage on the Colorado River due to the summer elevation of Lake Mead dropping below 1075 ft. above mean sea level. CAP curtails water deliveries to municipalities according to the current drought contingency plan where Arizona takes deepest water cuts [48,50,51]. |
| Colorado River Draft Drought Contingency Plan (CRB-C) | The U.S. Bureau of Reclamation declares a shortage on the Colorado River due to the summer elevation of Lake Mead dropping below 1075 ft. above mean sea level. CAP curtails water deliveries to municipalities according to the draft contingency plan currently discussed by Arizona, California, and Nevada. Arizona takes deeper water cuts, but California and Nevada also take water cuts when the elevation of Lake Mead drops below 1075 ft. above mean sea level [48,50,51]. |
| Drought in the Salt River Watershed (SRD) | The SRP governing board reduces the Stored and Delivered Water multiplier to from 3 acre-feet per acre (9.144 ML ha−1) of on-project lands to 2 acre-feet per acre (6.096 ML ha−1) due ongoing drought in the Salt River Watershed. The scenario is based on the 2003 decision by the Salt River Project to reduce surface water deliveries to customers [33,45]. |
| Increased Verde River Watershed flows from Nature-Based Conservation (VR-NBF) | Augmentation of Verde River flow from various water conservation programs in the Verde River watershed, such as farm retirement and voluntary fallowing [65]. |
| Increased Verde River flows due to Upstream Forest Thinning (VR-FT) | Mechanically thinning ponderosa pine forests increases runoff by 20%, up to 18.1 to 42.9 million m3 per year on average over a 15-year thinning period [37,38]. However, increased runoff declines after a six-year period [37]. |
| Residential Conservation (PMA-RC) | Municipalities reduce water consumption by 10%, meeting or exceeding Phoenix Active Management Area 4th Management Plan Gallons Per Capita Day (GPCD) Targets. We chose a 10% threshold because Tolleson, due to its small size, is not part of the Phoenix AMA GPCD targets [71]. |
| Prolonged Drought in Salt-Verde Watershed (SRD-P) | The local impacts of climate change may permanently reduce Salt-Verde River watershed runoff. SRP estimates the 30-year median runoff is 659,093 ML year−1. Downscaled GCM models estimate a 23% runoff reduction [42]; streamflow data between 1996–2015 show a 64% reduction versus the long-term average [42,44,46]. |
| Combination of CRB-D and SRD (SRD-CRB-D) | A combination of scenarios CRB-C and SRD. |
| Combination of CRB-C, SRD, and PMA-RC (SRD-CRB-RC) | A combination of scenarios CRB-C, SRD, and PMA-RC. |
Table 5.
Sustainability impact (S, ΔS) of water conservation and flow augmentation options based on a 2016 baseline year.
Table 5.
Sustainability impact (S, ΔS) of water conservation and flow augmentation options based on a 2016 baseline year.
| Scenario | Δ Salt River Flow (ML year−1) | Curtailment Year (S, ΔS) |
|---|---|---|
| BASE | 0 | 2020 (4 year, -) |
| VR-NBF | 3556 | 2021 (5 year, +1) |
| VR-FT | 6413 | 2021 (5 year, +1) |
| PMA-RC | 69,435 | 2022 (6 year, +2) |
| VR-NBF, VR-FT, PMA-RC | 111,409 | 2022 (6 year, +3) |
| SRD-P | −162,143 | 2020 (4 year, 0) |
| VR-NBF, PMA-RC, SRD-P | −69,689 | 2020 (4 year, 0) |
Table 6.
Municipal-level Vulnerability, Resilience, and Sustainability cost regressions.
| Municipality | V vs. C | |||||
|---|---|---|---|---|---|---|
| Slope | R2 | Slope | R2 | Slope | R2 | |
| Avondale | −0.02 | 0.06 | −0.02 | 0.12 | −0.15 | 0.02 |
| Chandler | 0.01 | 0.01 | −0.01 | 0.02 | 0.28 | 0.25 |
| Gilbert | 0.00 | 0.08 | 0.01 | 0.12 | −0.09 | 0.36 |
| Glendale | 0.00 | 0.03 | −0.01 | 0.19 | 0.18 | 0.04 |
| Goodyear | −4.25 | 0.07 | 1.46 | 0.02 | 0.00 | 0.00 |
| Mesa | 0.00 | 0.01 | 0.00 | 0.01 | 0.16 | 0.23 |
| Peoria | 0.00 | 0.02 | −0.01 | 0.33 | −0.18 | 0.02 |
| Phoenix | 0.00 | 0.23 | 0.01 | 0.43 | −0.08 | 0.53 |
| Phoenix Metro | 0.00 | 0.00 | 0.01 | 0.60 | −0.03 | 0.07 |
| Scottsdale | 0.00 | 0.01 | −0.01 | 0.01 | 0.18 | 0.26 |
| Tempe | 0.01 | 0.31 | 0.01 | 0.66 | −0.35 | 0.74 |
| Tolleson | 0.00 | 0.46 | 0.00 | 0.29 | −0.01 | 0.09 |
© 2020 by the authors. Licensee MDPI, Basel, Switzerland. This article is an open access article distributed under the terms and conditions of the Creative Commons Attribution (CC BY) license (http://creativecommons.org/licenses/by/4.0/).
Share and Cite
MDPI and ACS Style
Rushforth, R.R.; Messerschmidt, M.; Ruddell, B.L. A Systems Approach to Municipal Water Portfolio Security: A Case Study of the Phoenix Metropolitan Area. Water 2020, 12, 1663. https://0-doi-org.brum.beds.ac.uk/10.3390/w12061663
AMA Style
Rushforth RR, Messerschmidt M, Ruddell BL. A Systems Approach to Municipal Water Portfolio Security: A Case Study of the Phoenix Metropolitan Area. Water. 2020; 12(6):1663. https://0-doi-org.brum.beds.ac.uk/10.3390/w12061663
Chicago/Turabian StyleRushforth, Richard R., Maggie Messerschmidt, and Benjamin L. Ruddell. 2020. "A Systems Approach to Municipal Water Portfolio Security: A Case Study of the Phoenix Metropolitan Area" Water 12, no. 6: 1663. https://0-doi-org.brum.beds.ac.uk/10.3390/w12061663
Note that from the first issue of 2016, this journal uses article numbers instead of page numbers. See further details here.