Article

Optimization of H2 Production through Minimization of CO2 Emissions by Mixed Cultures of Purple Phototrophic Bacteria in Aqueous Samples

1
Department of Chemical and Environmental Technology, ESCET, Rey Juan Carlos University, 28933 Móstoles, Spain
2
Department of Environmental Engineering, Democritus University of Thrace, 67100 Xanthi, Greece
*
Author to whom correspondence should be addressed.
Submission received: 15 June 2020 / Revised: 13 July 2020 / Accepted: 13 July 2020 / Published: 15 July 2020

Abstract

:
One of the current challenges in the treatment of wastewater is the recovery and/or transformation of their resources into high value-added products, such as biohydrogen. The aim of the present study was to optimize the production of hydrogen by mixed cultures of purple phototrophic bacteria (PPB), targeting in low CO2 emission. Batch assays were conducted using different carbon (malic, butyric, acetic acid) and nitrogen (NH4Cl, Na-glutamate, N2 gas) sources by varying the chemical oxygen demand to nitrogen ratio (COD:N 100:3 to 100:44), under infrared radiation as sole energy source. Malate-glutamate (COD:N 100:5.5) and malate-NH4-N (COD:N 100:3) fed cultures, exhibited high H2 production rates of 2.3 and 2.5 mLH2/Lh, respectively. It was observed that the use of glutamate decreased the CO2 emission by 74% (13.4 mLCO2/L) as compared to NH4-N. The H2 production efficiency achieved by organic carbon substrates in combination with glutamate, was in the order of malic (370 mLH2/L) > butyric (145 mLH2/L) > acetic acid (95 mLH2/L). These substrates entailed partitioning of reducing power into biomass at 64%, 50% and 48%, respectively, whereas reductants were derived to biohydrogen at 5.8%, 6.1% and 2.1%, respectively. These results suggest that nitrogen source and carbon dioxide emissions play an important role in the optimization of hydrogen production by PPB.

Graphical Abstract

1. Introduction

Nowadays, human activities associated with food production, agriculture, domestic and industry generate considerable amounts of waste effluents rich in nutrients and organic compounds. Uncontrolled disposal of these wastes alters severely the biogeochemical cycles of the global ecosystems and can cause great damage to the environment. Public or private associations responsible for water sanitation invest lot of energy in wastewater treatment plants just for the destruction of organic matter and removal of nutrients, in order to avoid the contamination of water bodies. However, wastewater treatment processes can be upgraded into sustainable biorefineries for release and recover energy and nutrients within the concept of circular economy and the water-energy-food nexus [1,2].
The use of photosynthetic organisms for partitioning of resources from wastewater has received considerable attention worldwide, since is an environmental-friendly and a low energy alternative, compared to physical separation processes, such as membrane technologies [1,3]. Microalgae have been widely used for nutrients’ partitioning from the liquid into their solid phase from wastewater, however, they form macroscopic structures that hinders their settleability, which makes hard their harvesting [4]. This is, in fact, one of the major limitations for cost-effective wastewater treatment [5]. Alternatively, purple phototrophic bacteria (PPB) are able to simultaneous partition of organics, nitrogen and phosphorous and therefore have been proposed as a new partitioning approach for wastewater treatment [1,6]. PPB are fast growing organisms that can be easily isolated from sources such as soil, freshwater, marine, and sewage [7]. They grow via anoxygenic photosynthesis by converting low energy infrared light into chemical energy, in the form of adenosine triphosphate (ATP) [8]. PPB have an extremely versatile metabolic system, but the most interesting metabolic pathway involves photoheterotrophic growth using sugars or organic acids as electron donors and carbon source in presence of light, which also entails CO2 fixation or emissions depending on the overall redox state of the system [9,10].
PPB can harvest and accumulate electrons during the cyclic anoxygenic photosynthesis, in the form of reduced cofactors. Excess of reductants is handled through CO2 fixation via the Calvin cycle or by H2 release [11]. Hydrogen production is an ATP-driven process occurred under nitrogen-fixing conditions or by directly dissipating electrons via ferredoxin oxidation in the nitrogenase/hydrogenase enzyme complex at the end of the electron transport chain [12,13]. The theoretical stoichiometries for hydrogen production in the presence and absence of dinitrogen gas are presented in Equations (1) and (2), respectively [14].
N 2 + 8 e + 8 H + + 16 ATP 2 NH 3 + H 2 + 16 ADP + 16 P i
2 e + 2 H + + 4 ATP H 2 + 4 ADP + 4 P i
Highly reduced carbon sources relative to PPB biomass (e.g., butyrate), are expected to promote hydrogen production as compared to more-oxidized substrates (e.g., acetate and malate) [10]. However, it has been previously reported for both mixed and pure cultures of PPB, that H2 yields are not strictly co-related with the carbon oxidation state [15,16,17]. Other factors affecting the H2 yield from different organic substrates is the amount of organic carbon stored as polymers such as polyhydroxybutyrate (PHB), as well as the Calvin cycle flux competing for electrons [16]. Moreover, an important factor non correlated with carbon substrates, is the nitrogen source, since the presence of NH4-N represses nitrogenase synthesis of PPB and therefore H2 production [14].
Ammonium salts, reversibly inhibit the enzyme, which is able to recover its activity after the consumption of ammonium. It has been, also reported that inhibition may occur, by the formation of ammonium during the consumption of non-ammonium nitrogen sources, such as glutamate. Nevertheless, glutamate is considered an excellent substrate for hydrogen production, since it serves simultaneously as carbon and nitrogen source [18]. Finally, dinitrogen, which serves as the natural substrate of nitrogenase, inhibits the hydrogen production rate, since N2 fixation and biohydrogen production are two competing processes [19].
Biological hydrogen production generates a renewable environmental-friendly biofuel, that produces H2O upon combustion [20]. Oxygenic (algae, cyanobacteria) and anoxygenic (PPB) photosynthetic hydrogen production, also known as photo-fermentation, is considered the absolute renewable source, since it requires a supply of light energy and H2O or organic electrons donors [21], respectively. However, H2 production from the photo-fermentation of organic compounds may lead to the simultaneous production of CO2 [22], a key greenhouse gas that drives global climate change.
PPB have been widely assessed for industrial wastewater treatment or transformation of organic streams coming from biorefineries towards organics recovery and/or H2 production [9,17,20,23,24,25,26,27,28,29,30,31,32,33,34]. However, most of these studies use pure cultures [9,17,22,25,26,29,30,35,36] and do not deal with the factors involved in CO2 emissions. Controlling the driving factors for CO2 releasing, is key for reducing greenhouse gas emissions in photo-fermentation processes.
This study aims to evaluate the performance of mixed PPB cultures for biohydrogen production from wastewater, while minimizing CO2 emissions. Optimization basis relies on the use of different organic carbon sources and organic and inorganic nitrogen substrates, applying a wide range of COD to nitrogen ratio (100:3 to 100:44) to evaluate the production yield and the CO2 production. An electron balance method based on chemical oxygen demand (COD) was used to determine the partitioning of electrons into H2 and PPB growth.

2. Materials and Methods

2.1. Chemical Compounds

The chemical compounds that were used in this study were purchased from Sigma-Aldrich. Stock solutions (20 gCOD/L) of L-malic acid (C4H6O5), butyric acid (C4H8O2), propionic acid (C3H6O2), acetic acid (C2H4O2) and ethanol (C2H6O) were prepared separately in ultra-pure water and stored at 4 °C. Stock solutions (5 gN/L) of ammonium chloride (NH4Cl) and L-glutamic acid monosodium salt monohydrate (Na-glutamate, C5H8NNaO4·H2O) were prepared separately in ultra-pure water and stored at 4 °C. Finally, nitrogen gas (N2) was used as external gaseous nitrogen source. The pH in stock solutions was adjusted to 7.

2.2. Enrichment of Purple Phototrophic Bacteria (PPB)

The mixed culture of purple phototrophic bacteria (PPB) was enriched from wastewater taken from a pilot-scale WWTP at Rey Juan Carlos University (Mostoles, Madrid, Spain). Enrichment process was performed following the procedure outlined by Vasiliadou et al. [15]. Briefly, a 1 L suspended growth photo-bioreactor (PhBR) containing synthetic wastewater (SW) as growth medium was inoculated with 20% v/v of domestic wastewater. The SW was prepared with tap water containing 5 organic carbon sources (acetic acid, malic acid, propionic acid, butyric acid and ethanol) (total COD 1.2–1.6 gCOD/L), NH4Cl (0.06–0.13 gN/L) as well as 1 mL/L micro-nutrient and 100 mL/L of macro-nutrient solution, which were prepared according to Ormerod et al. [37]. Subsequently, the SW in the reactor was flushed with argon gas to remove dissolved oxygen in order to achieve anaerobic conditions.
The incubation was performed by illuminating the PhBR with LED lamps (850 nm) to provide near infra-red (NIR) light source (Figure 1). The surface of the PhBR was covered with UV-VIS absorbing foil (ND 1.2 299, Transformation Tubes, Banstead, UK), in order to absorb ca. 90% of the wavelength <750 nm. The average light intensity on the outside PhBR surface was 10 W/m2, which results in 512 W/m3 at a surface to volume (VL) ratio of 51.2 m2/m3. These conditions can be considered as non-limiting in irradiation needs [38]. Figure 2, presents a contour diagram, that was constructed using Matlab software, illustrating the IR light intensity measured on different heights around the surface of the PhBR. The measurements covered a surface area of 512 cm2 (PxH = 32 × 16 cm) (Figure 1). The whole acclimation period (around 40 days), PPB culture was kept at room temperature (25 ± 1 °C), while the pH was weekly adjusted to 6.8 ± 0.1. The PhBR was operated using 99% SW replacement with fresh medium on a weekly basis. The system was operated for six weeks. The total COD added in the PhBR during the 6 weeks of operation was in the range of 1.2–1.6 gCOD/L, with ammonium nitrogen concentration of ca. 0.06–0.13 gN/L. The enrichment of PPB was determined by detecting the presence of Bacteriochlorophylls (BChl) and carotenoids in liquor samples of the PhBR using VIS-IR spectra analyses.

2.3. Batch Assays of PPB

Batch experiments were conducted using serum bottles (160 mL) with a working volume of 100 mL, containing 99 mL of SW medium (as previously described) and 1% v/v inoculum of PPB enriched culture, that was grown in the PhBR. In the SW, different organic carbon and nitrogen sources were examined. All experiments were performed using ca. 2 gCOD/L of carbon source (malic-, butyric- and acetic- acid). On the other hand, nitrogen source concentrations were varying from 75 to 600 mgN/L (NH4Cl as inorganic N source and Na-glutamate as organic N source) or the corresponding to the liquid-gas equilibrium with dinitrogen gas filling the headspace of the serum bottles (60 mL of N2). Control experiments without PPB enriched culture were conducted under sterilized conditions for all the conditions tested in this study. The conditions under which each batch assay was performed are given in Table 1. As shown in Table 1, the carbon and nitrogen substrates were tested in different combinations, using a wide range of COD:N ratios (100:3.8–100:30), considering only the COD of organic substrate and the N of the nitrogen substrate. It should be noted that these COD:N ratios were initially calculated based on the theoretical concentrations of organic and nitrogen substrates added. Therefore, Table 1 presents also the actual COD:N for each experiment (R1–R14), as resulted from the experimental measurements, considering also the amount of COD came from the use of Na-glutamate. It should be noted, that during experiment R14, the nitrogen concentration per liquid volume added as N2 was 650 mgN/L. The N2 from the gas phase was gradually diluted into the liquid phase, while based on Henry’s Law the maximum concentration of dissolved N2 each time could not exceeded the 17 mgN/L.
The pH at the beginning of each experiment was adjusted to 6.8 ± 0.1. After the preparation of the bottles, their liquid mediums were flushed with argon for 10 min and closed with rubber stoppers with aluminum seals. Subsequently, the headspace of the bottles was flushed with argon for 2 min. The bottles where nitrogen gas was used, were flushed with N2 gas. The bottles were shaken at 120 rpm and 25 ± 1 °C (Orbital shaker, optic ivymen system) and illuminated using LED lamps from the left and right-top of the shaker, providing an average uniform IR intensity of 20 W/m2. The duration of each experimental run was 7 days.
Chemical oxygen demand (COD), total Kjeldahl Nitrogen (TKN), ammonium nitrogen and PPB and organic acids’ concentrations, were determined at the beginning and at the end of each experimental run. Moreover, throughout each experiment 2 mL of liquid samples (which were replaced with sterile degassed water) were taken from the liquid phase at different time intervals, to evaluate organic acids’ assimilation and PPB growth. Gas samples were taken from the serum bottles and were analyzed periodically to evaluate hydrogen production and CO2 evolution. Biological and control experiments were conducted in duplicate. Runs R4-R8 were conducted initial once, in order to check the potential of H2 production under these conditions. The experiments were not repeated twice for time-saving reasons, since the first screening showed no encouraging results.

2.4. Analytical Methods

All liquid samples were analyzed after filtering with a 0.45 μm nylon filter (Chrodisc filter/syringe, CHMLab, Barcelona, Spain). Total chemical oxygen demand (COD), total Kjeldahl Nitrogen (TKN), biomass absorbance at 660 nm (optical density) and VIS/NIR spectra were determined using unfiltered samples. Total and soluble COD were determined using a dichromate-reflux colorimetric method [39]. The TKN of filtered and unfiltered samples were determined by the standard Kjeldahl procedure (Gerhardt TNK, Vapodest 450, Königswinter, Germany). The NH4-N was analyzed using Spectroquant Ammonium Test (Merck, Darmstadt, Germany). The VSS concentration (gVSS/L) was measured according to standard methods [39]. The optical density of PPB biomass at 660 nm was measured using UV-VIS spectrophotometer (V-630, Jasco, Madrid, Spain). The concentration of PPB was calibrated using a standard curve of optical density against volatile suspended solids (gVSS/L). The detection of BChl and carotenoids of PPB was performed by VIS-NIR spectra (400–950 nm) (V-630, Jasco, Madrid, Spain). The pH was measured using a pH meter (Crison GLP22, Hach Lange, Loveland, CO, USA). Illuminance was measured with a VIS-NIR spectroradiometer (STN-Bluewave-V, MTB, Madrid, Spain). The concentrations of volatile fatty acids (VFAs, malic, acetic and butyric acids) were analyzed using high performance liquid chromatography (HPLC) (Varian 356-LC, Agilent Technologies, Santa Clara, CA, USA), using refractive index (RI) detector and MetaCarb 67H 300 × 6.5 mm column (Agilent Technologies, Santa Clara, CA, USA). The volume of the gas accumulated in the headspace of the bottles was determined using a Boyle-Mariotte Apparatus (3B Scientific S.L., Hamburg, Germany). The gas composition was analyzed using a 7820A GC system equipped with a 3Ft 1/8 2 mm Poropak Q 80/100 SS column, a 6Ft 1/8 2 mm Poropak Q 80/100 SS column and a 6Ft 1/8 2 mm MolSieve 5A 60/80 SS column, a fitting external Luer lock and a thermal conductivity detector (TCD) (Agilent Technologies, Santa Clara, CA, USA).

2.5. Statistical Analysis

Experimental data of experiments were used to calculate average values (Equation (3)) and standard deviations (Equation (4)).
Y ¯ = i = 1 n Y i n
SD = i = 1 n ( Y i Y ¯ ) 2 n 1
where Y ¯ is the average of the measured values, SD is the standard deviation, Y i are the experimental values and n is the total number of data.
Confidence Interval on the mean was computed as follows (Equation (5)):
CI = Y ¯ ± Z 95 · SD n
where Z95 is the number of standard deviations extending from the mean of a normal distribution required to contain 0.95 of the area. With a normal distribution, 95% of the distribution is within 1.96 standard deviations of the mean.

3. Results and Discussion

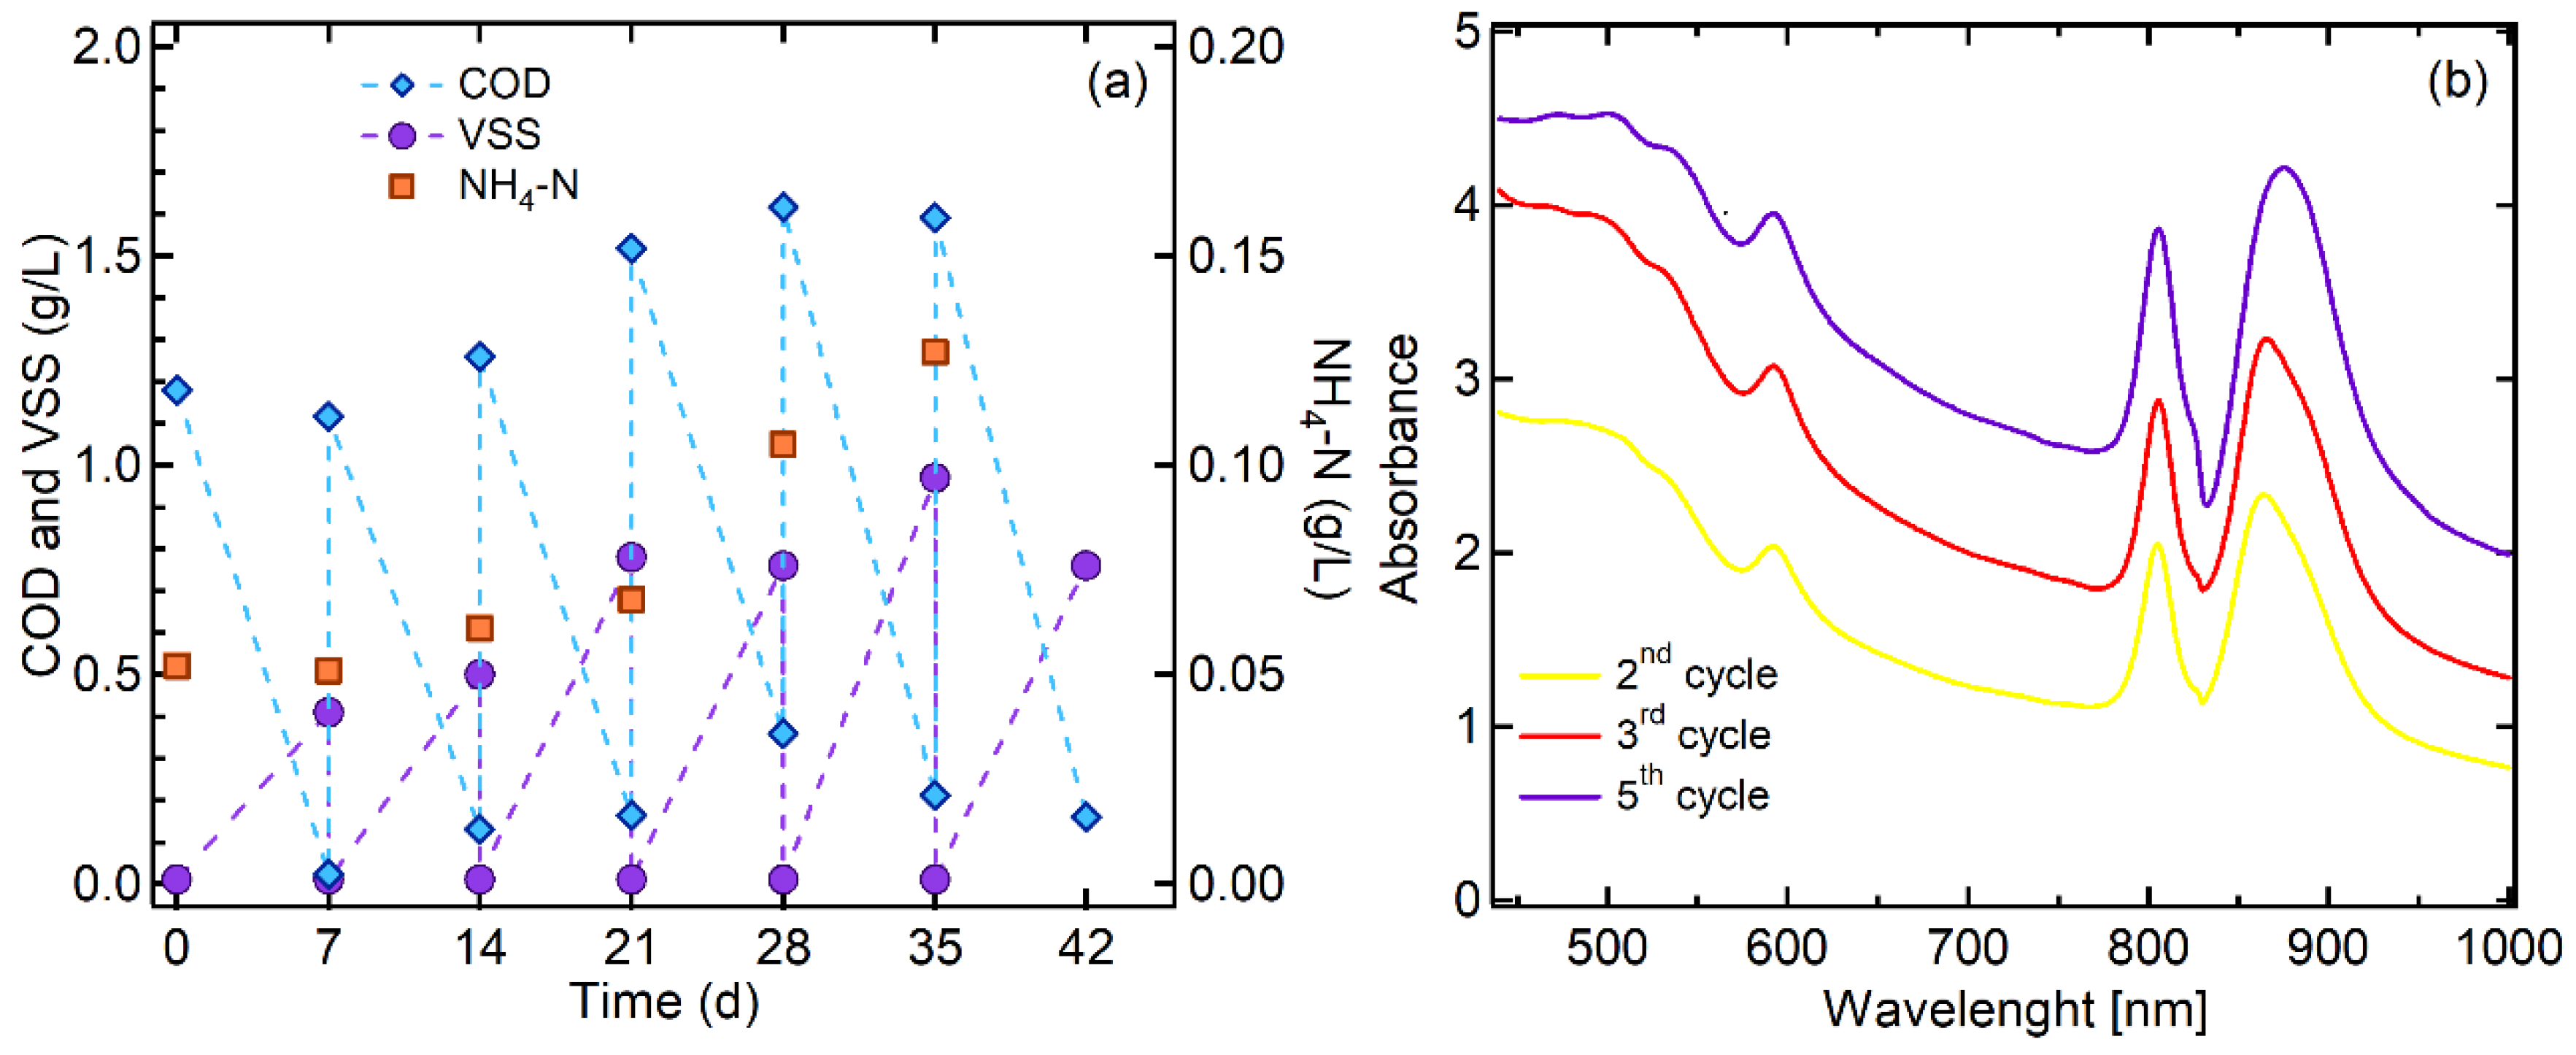
3.1. PPB Culture Enrichment

Figure 3a presents the biomass growth, the soluble COD degradation and the initial ammonium concentration during a 6-weeks enrichment period of the mixed PPB culture. Each operating cycle of the PhBR lasted 7 days (see Section 2.2). After a 2-weeks period, a stable behavior of the system during the next 4 cycles in terms of biomass production rate (0.12 ± 0.01 gVSS/Ld) and biomass yield (0.64 ± 0.08 gVSS/gCOD) in each cycle, was observed. COD consumption rate throughout this steady state was 0.18 ± 0.02 gCOD/Ld. PPB biomass enrichment was evidenced through the accumulation of BChl and carotenoids in the mixed culture. Figure 3b shows the absorption spectra that represent PPB growth at different time intervals, i.e., at the end of 2nd, 3rd and 5th cycle. The peaks with maximum absorbance at 590, 805, and 865 nm represents the absorption maxima for BChla. It was observed that during the 2nd cycle PPB enrichment was sufficient with a high proportion of BChla as evidenced by the sharp increase of the Abs805,865/Abs660 ratio as compared to the 1st cycle (1.0 to 1.6) [40]. It is well known, that PPB under anaerobic conditions and NIR irradiation express their photosynthetic system via bacteriochlorophyll [41] which associated with carotenoid pigments to a light-harvesting complex [8]. The absorption spectrum of carotenoids appeared in the spectral range between 400 and 550 nm [42]. PPB produce a subclass of the molecules commonly referred to as open-chain carotenoids pigments that protect the cells from photooxidative damage [10].
Regarding community composition, it has been previously stated that an Abs805/Abs660 ratio higher than 1.0 indicates a very high dominance of PPB in the bacterial community, with PPB presence (based on Illumina MiSeq analysis on the 16S RNA gene) higher than 50% [40]. In addition, BChla is indicative of species from genera like Rhodobacter sp., Rhodopseudomonas sp. and Rhodospirillum sp., which were found as dominants in domestic wastewater enrichments cultivated under anaerobic photo-heterotrophic environments [3,6]. These genera commonly have a very high efficiency of carbon usage, with biomass yield values close to 1.0 (COD basis), which are very similar to the values reported in this study. These evidences lead to the assumption, that the enriched culture of the present study, was strongly dominated by PPB.

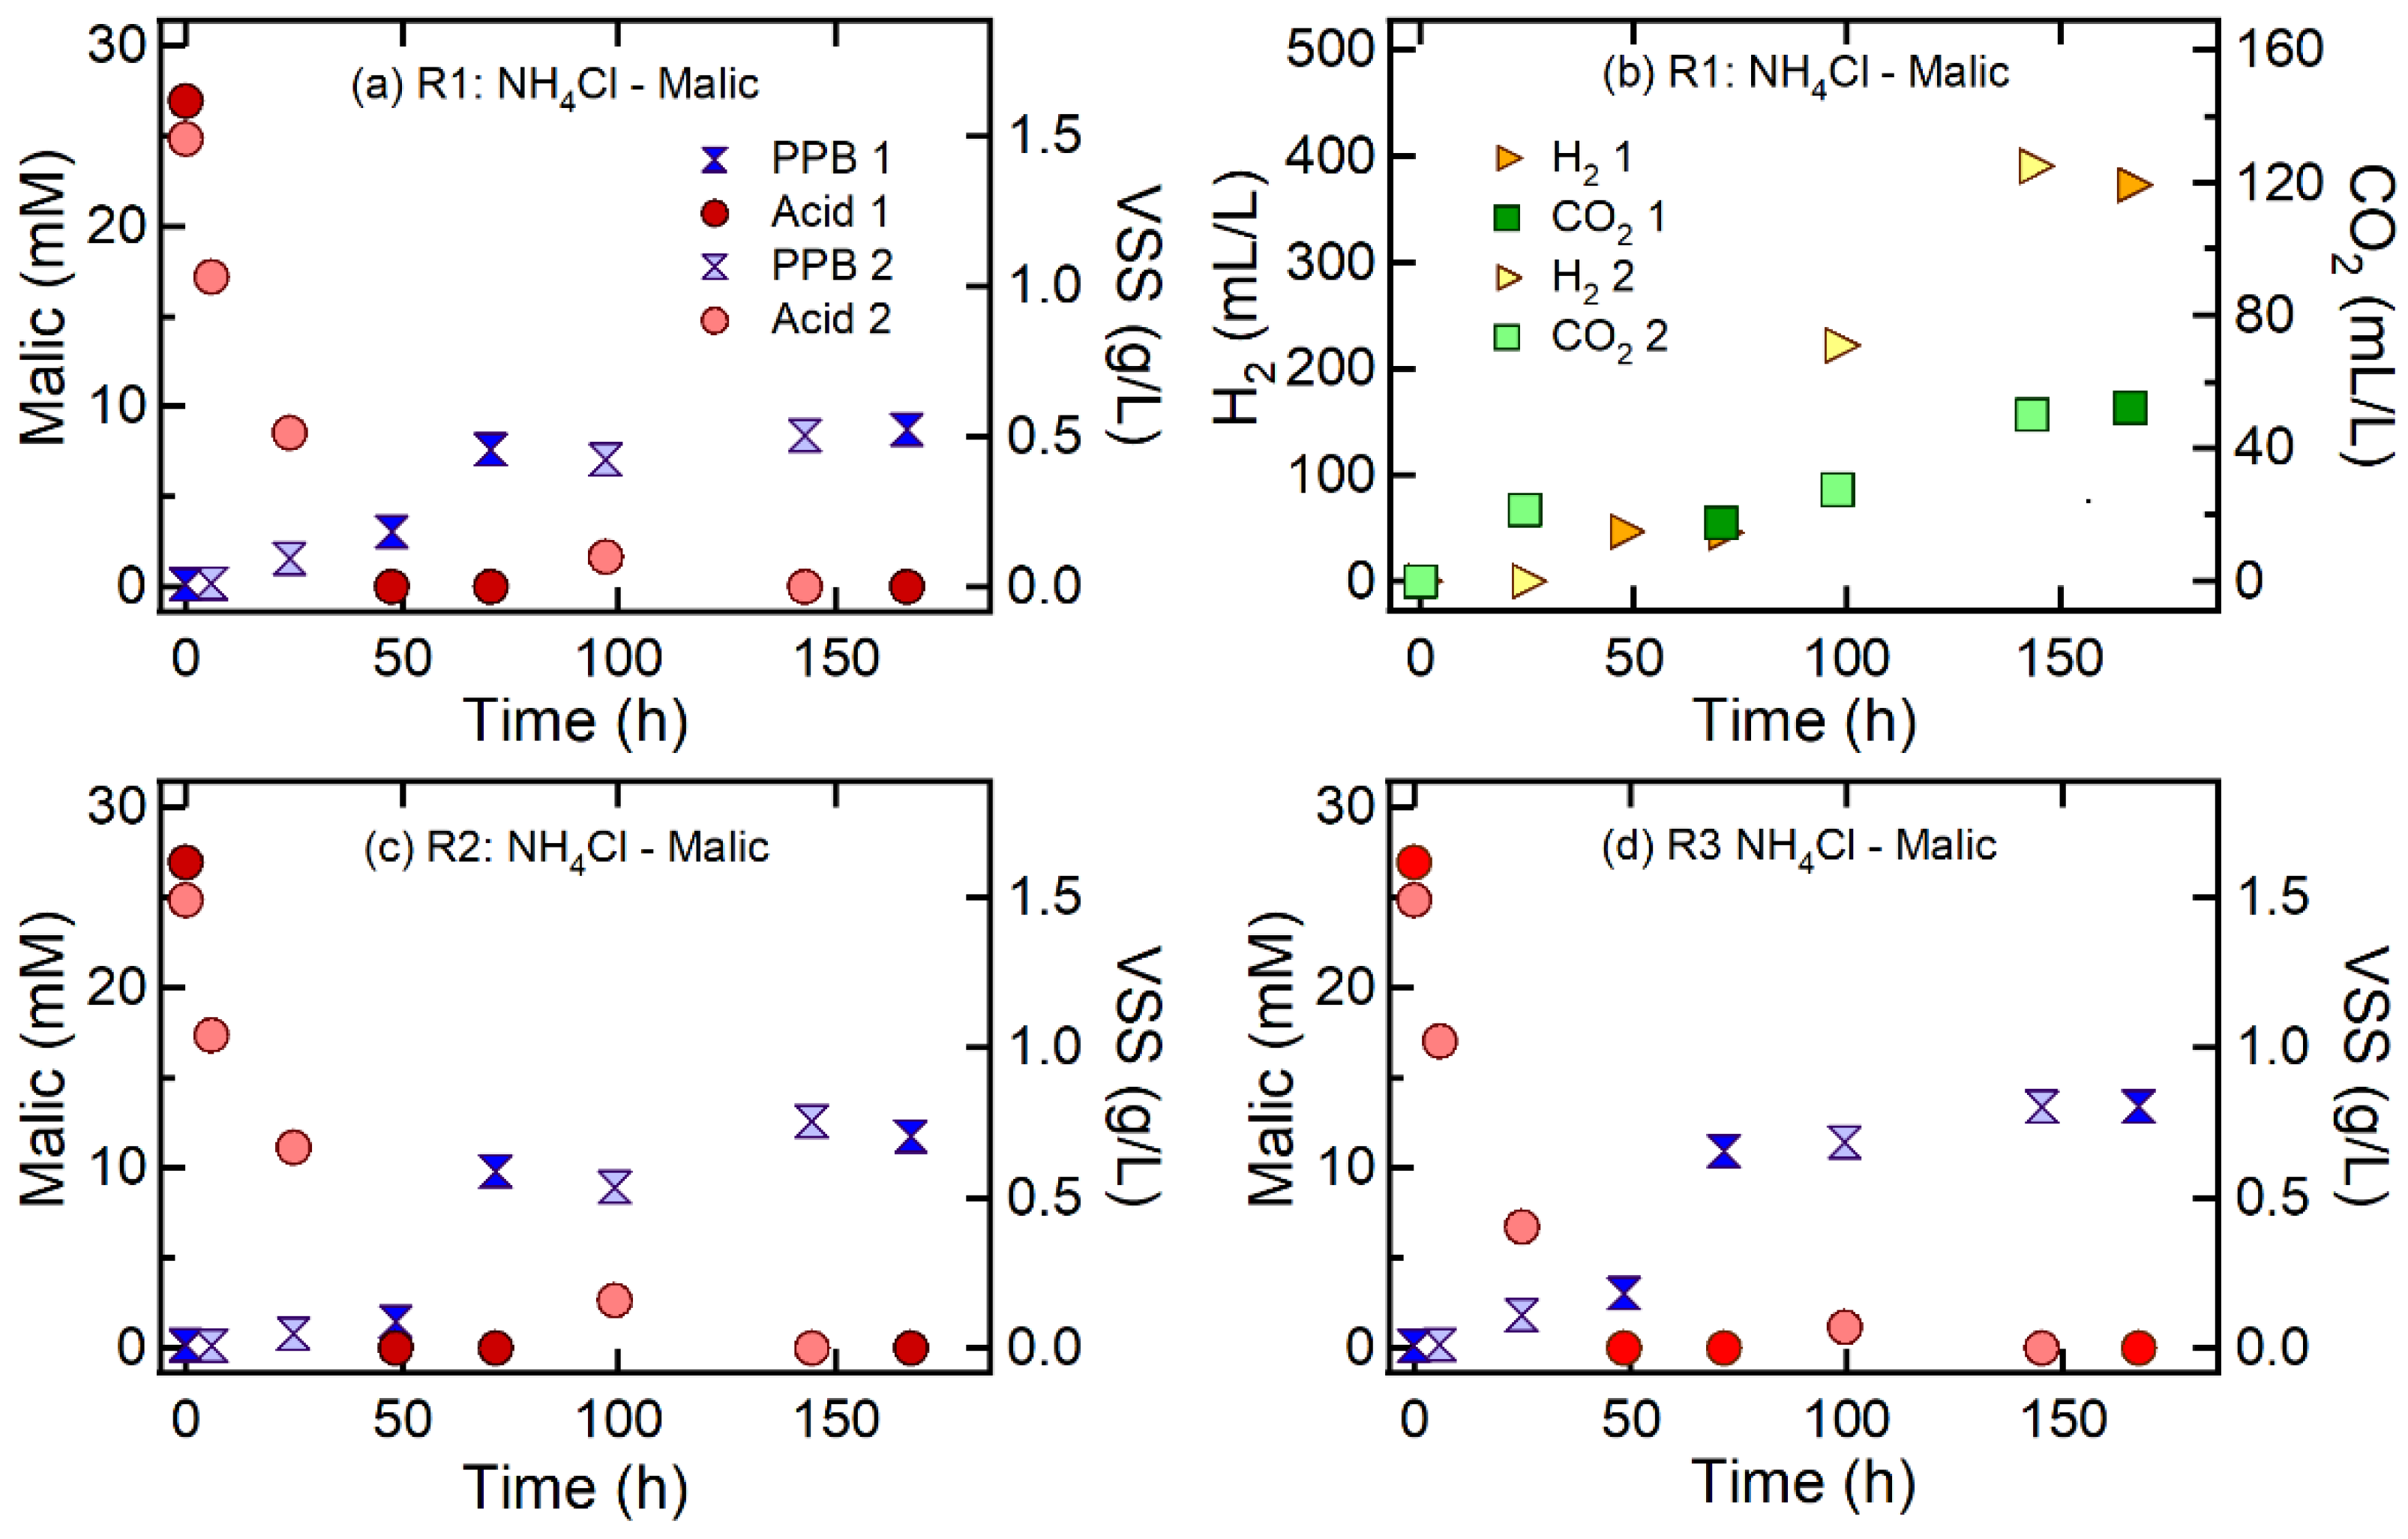
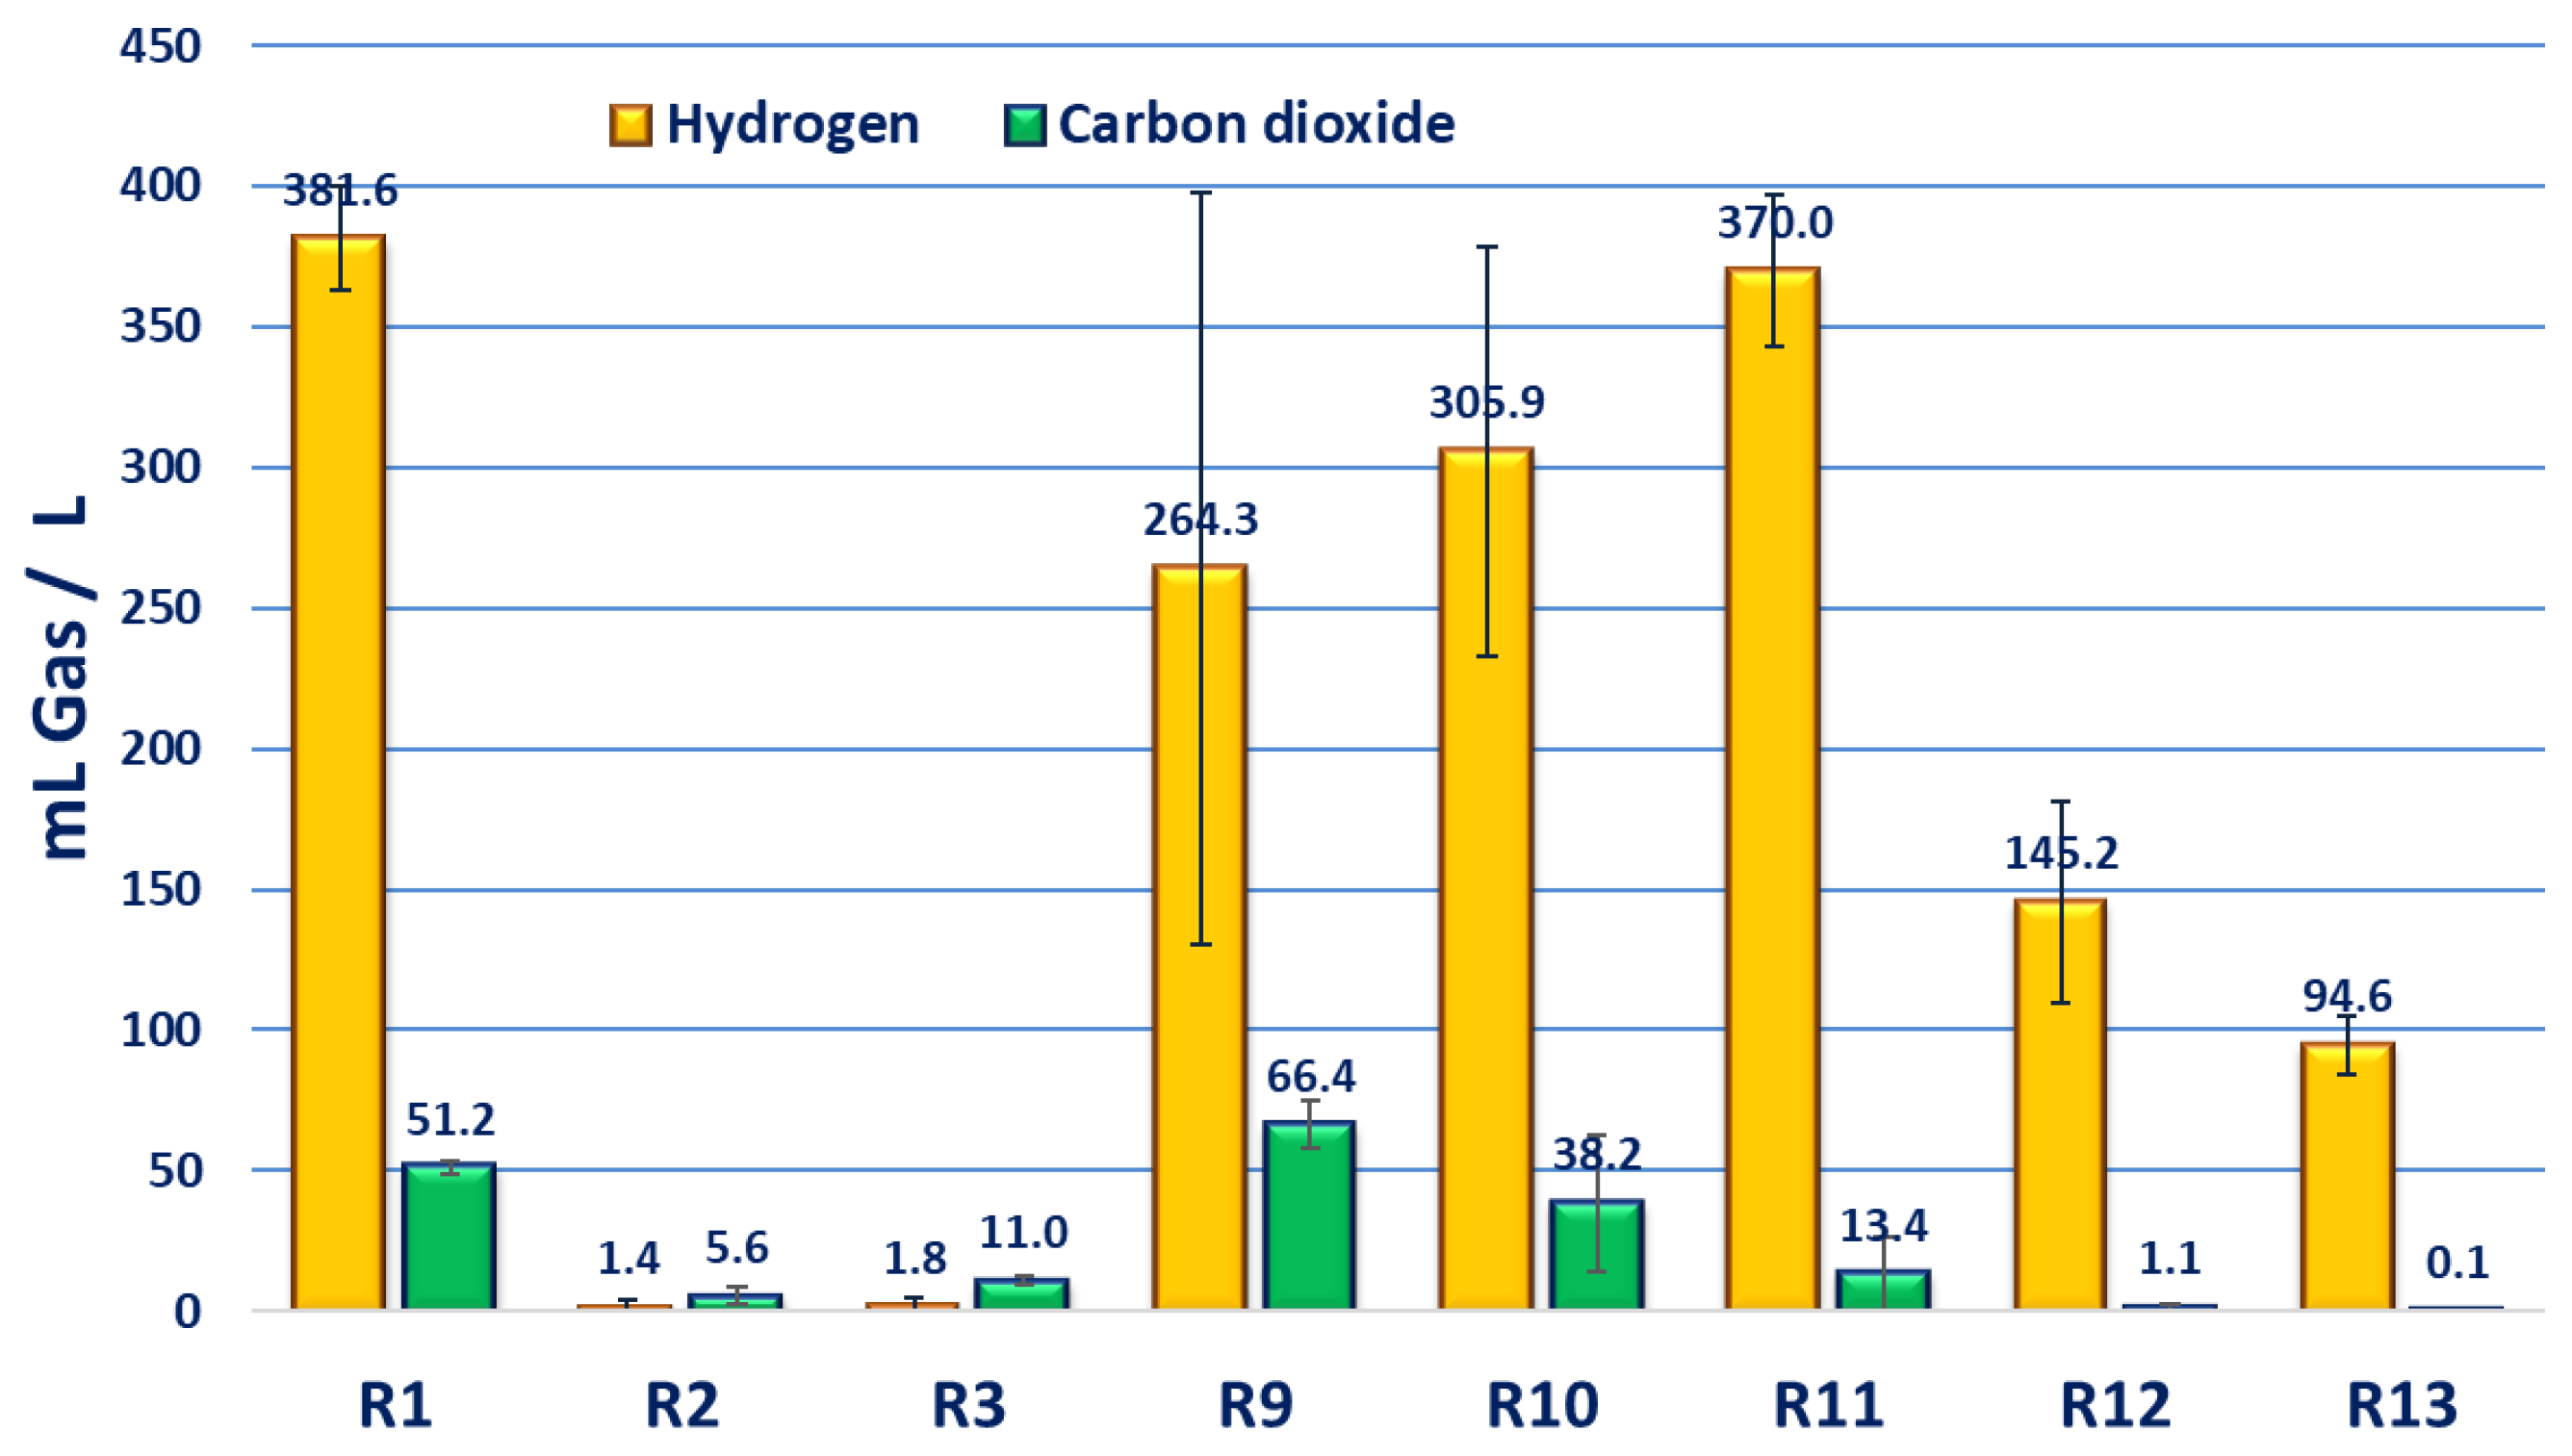
3.2. Effect of Nitrogen Sources on H2 and CO2 Production

In this study, the effect of nitrogen source on the H2 production process by a mixed PPB culture, was investigated using malic, as organic carbon source and ammonium chloride, Na-glutamate and N2 gas, as nitrogen sources. Table 2 summarizes the cell growth rate, the substrate degradation rate, the H2 production rate, the H2 yield and the CO2 production. Figure 4 shows the time profiles using malic acid and NH4Cl as carbon and nitrogen sources, respectively. Figure 4a,c and d represents the malic acid degradation and PPB growth using 75, 150 and 300 mgNH4-N/L (runs R1 – R3) and ca. 1.1 gC/L (ca. 2.2 gCOD/L) of two experimental trials (1 and 2), while Figure 4b shows the H2 and CO2 production by PPB using 75 mgNH4-N/L (run R1). As shown in Table 2, higher H2 production (381.6 mLH2/L) was achieved at the NH4-N concentration of 75 mgNH4-N/L (5.4 mM ammonium, R1), compared to the concentrations of 150–600 mgNH4-N/L (10.7–42.9 mM ammonium, R2 – R4), where little or no H2 generation was detected. It has been previously reported that ammonium concentrations higher than 20 μM strongly inhibit the activity of nitrogenase in axenic cultures of R. sphaeroides [10]. In addition, Kim et al. [43] reported that H2 production by R. sphaeroides was inhibited at ammonium concentrations higher than 2 mM. The results obtained suggest that the mixed PPB culture used in this study, had tolerance to the ammonium concentrations as high as 5 mM. Interestingly, Tichi and Tabita [44] reported that some PPB species, such as Rhodobacter capsulatus, in the absence of a functional Calvin cycle or any other exogenous electron acceptor, are able to develop alternative electron acceptor pathways to preserve their intracellular redox state. In the presence of high ammonium levels, R. capsulatus can derepress the synthesis of the dinitrogenase enzyme complex, allowing the dissipation of excess reducing equivalents towards H2 production.
It should be noted, that during H2 production using 75 mgNH4-N/L (5.4 mM ammonium, R1), significant CO2 production was observed (51.2 mLCO2/L, Figure 4b, Table 2). The oxidation of malic acid, which is more oxidized than PPB biomass, results in CO2 production via TCA cycle [11]. A mass balance over liquid and gas phases on CO2 concentration, using Henry’s law and experimental pH values, provided that the produced CO2 was similar to the theoretically expected production based on the stoichiometry of malic acid, with a ratio of H2:CO2 of 1:1 compared to the theoretical ratio of 3:2.
Subsequently, experiments were conducted using malic acid as carbon source (ca. 26 mM or 1.2 gC/L, and ca. 2.4 gCOD/L) and Na-glutamate as nitrogen source. The nitrogen concentrations used were 75–300 mgN/L. In the cases of runs R9–R11, COD:N ratios were significantly different from the COD-substrate to N ratios, due to the carbon content of Na-glutamate (Table 2). Figure 5 shows the time profiles using Na-glutamate and malic acid as nitrogen and carbon source, respectively. Figure 5a–c illustrates the malic acid degradation and PPB growth using 75, 150 and 300 mgN/L (runs R9 – R11) of two experimental trials (1 and 2), while Figure 5d shows the H2 and CO2 production by PPB using 300 mgN/L (run R11). Increasing initial glutamate concentrations caused a rise in the H2 production values (Figure 6, Table 2). The highest H2 production in these experiments was observed for a concentration of 300 mgN/L of glutamate (R11: 370 mLH2/L) (Figure 6, Table 2). It should be noted, that no ammonium accumulation was observed during the experimental runs with Na-glutamate. This is in contrast with other research studies conducted with R. sphaeroides strain, reporting that H2 evolution was significantly suppressed by ammonium ions, which were accumulated proportionally to the concentration of glutamate added [43].
The H2 production rate and yield obtained for 300 mgN/L of Na-glutamate (R11), were comparable to those achieved by 75 mgNH4-N/L (R1) (Table 2). However, the CO2 gas emission in run R11 was decreased by 74% as compared to run R1b, resulting to the production of 13.4 mLCO2/L. In addition, results showed an inverse relationship between glutamate addition and CO2 gas production (Figure 6). The H2:CO2 ratios achieved were 1.2:1.5, 1.1:1.7 and 1:0.8 for 75, 150 and 300 mgN/L (R9 – R11), respectively. Interestingly, the CO2 gas production using Na-glutamate, was negatively correlated with the PPB growth rate achieved during R9–R11, as resulted from linear regression (y = −15.4x + 118.0, R² = 0.9122) of PPB growth rate vs CO2 (mLCO2/L). This confirms that CO2 fixation process is crucial for photoheterotrophic growth [45]. Actually, Wang et al. [45] showed that in the absence of ribulose-1,5-bisphosphatecarboxylase/oxygenase, which is the responsible enzyme for CO2 fixation, the mutant R. sphaeroides was not able to grow neither photoautotrophically nor photoheterotrophically using malate as the carbon substrate. PPB growth on oxidized organic substrates, such as malic acid, produces CO2 due to the substrates’ oxidation, which then is be re-fixed into cell material using the Calvin cycle [11]. The electrons needed for this come from the transformation of glutamate during its metabolism, as has been previously reported [15]. Thereby, it can be concluded that an organic N source (N-glutamate) considerable decreases the CO2 emissions as compared to an inorganic source (ammonium) in photo-fermentation processes focused on hydrogen production.
Finally, when N2 gas used as nitrogen source (R14), negligible H2 production was observed (Table 2). Moreover, cell growth rate (3.3 ± 2.1 mgVSS/Lh) and substrate consumption rate were significantly lower for the N2-purged reactors than in any other condition using malic acid (R1-R4 and R9–R11) (Table 2). This could be attributed to the N2 passing from the gas to the liquid phase, which could be characterized as the rate-limiting step of the process. In addition, N2 fixation competes with hydrogen production for the reduced cofactors generated during oxidation of organic substrates into biomass. Hydrogen production under nitrogen fixation conditions is an inefficient process as 75% of electrons go to ammonia generation purposes. However, in the absence of N2, nitrogenase exclusively reduces protons towards maximal H2 production [14]. These findings are in accordance with other studies, reporting that the amount of H2 produced from propionate and butyrate, decreased under N2 gas phase growth of R. sphaeroides [19].

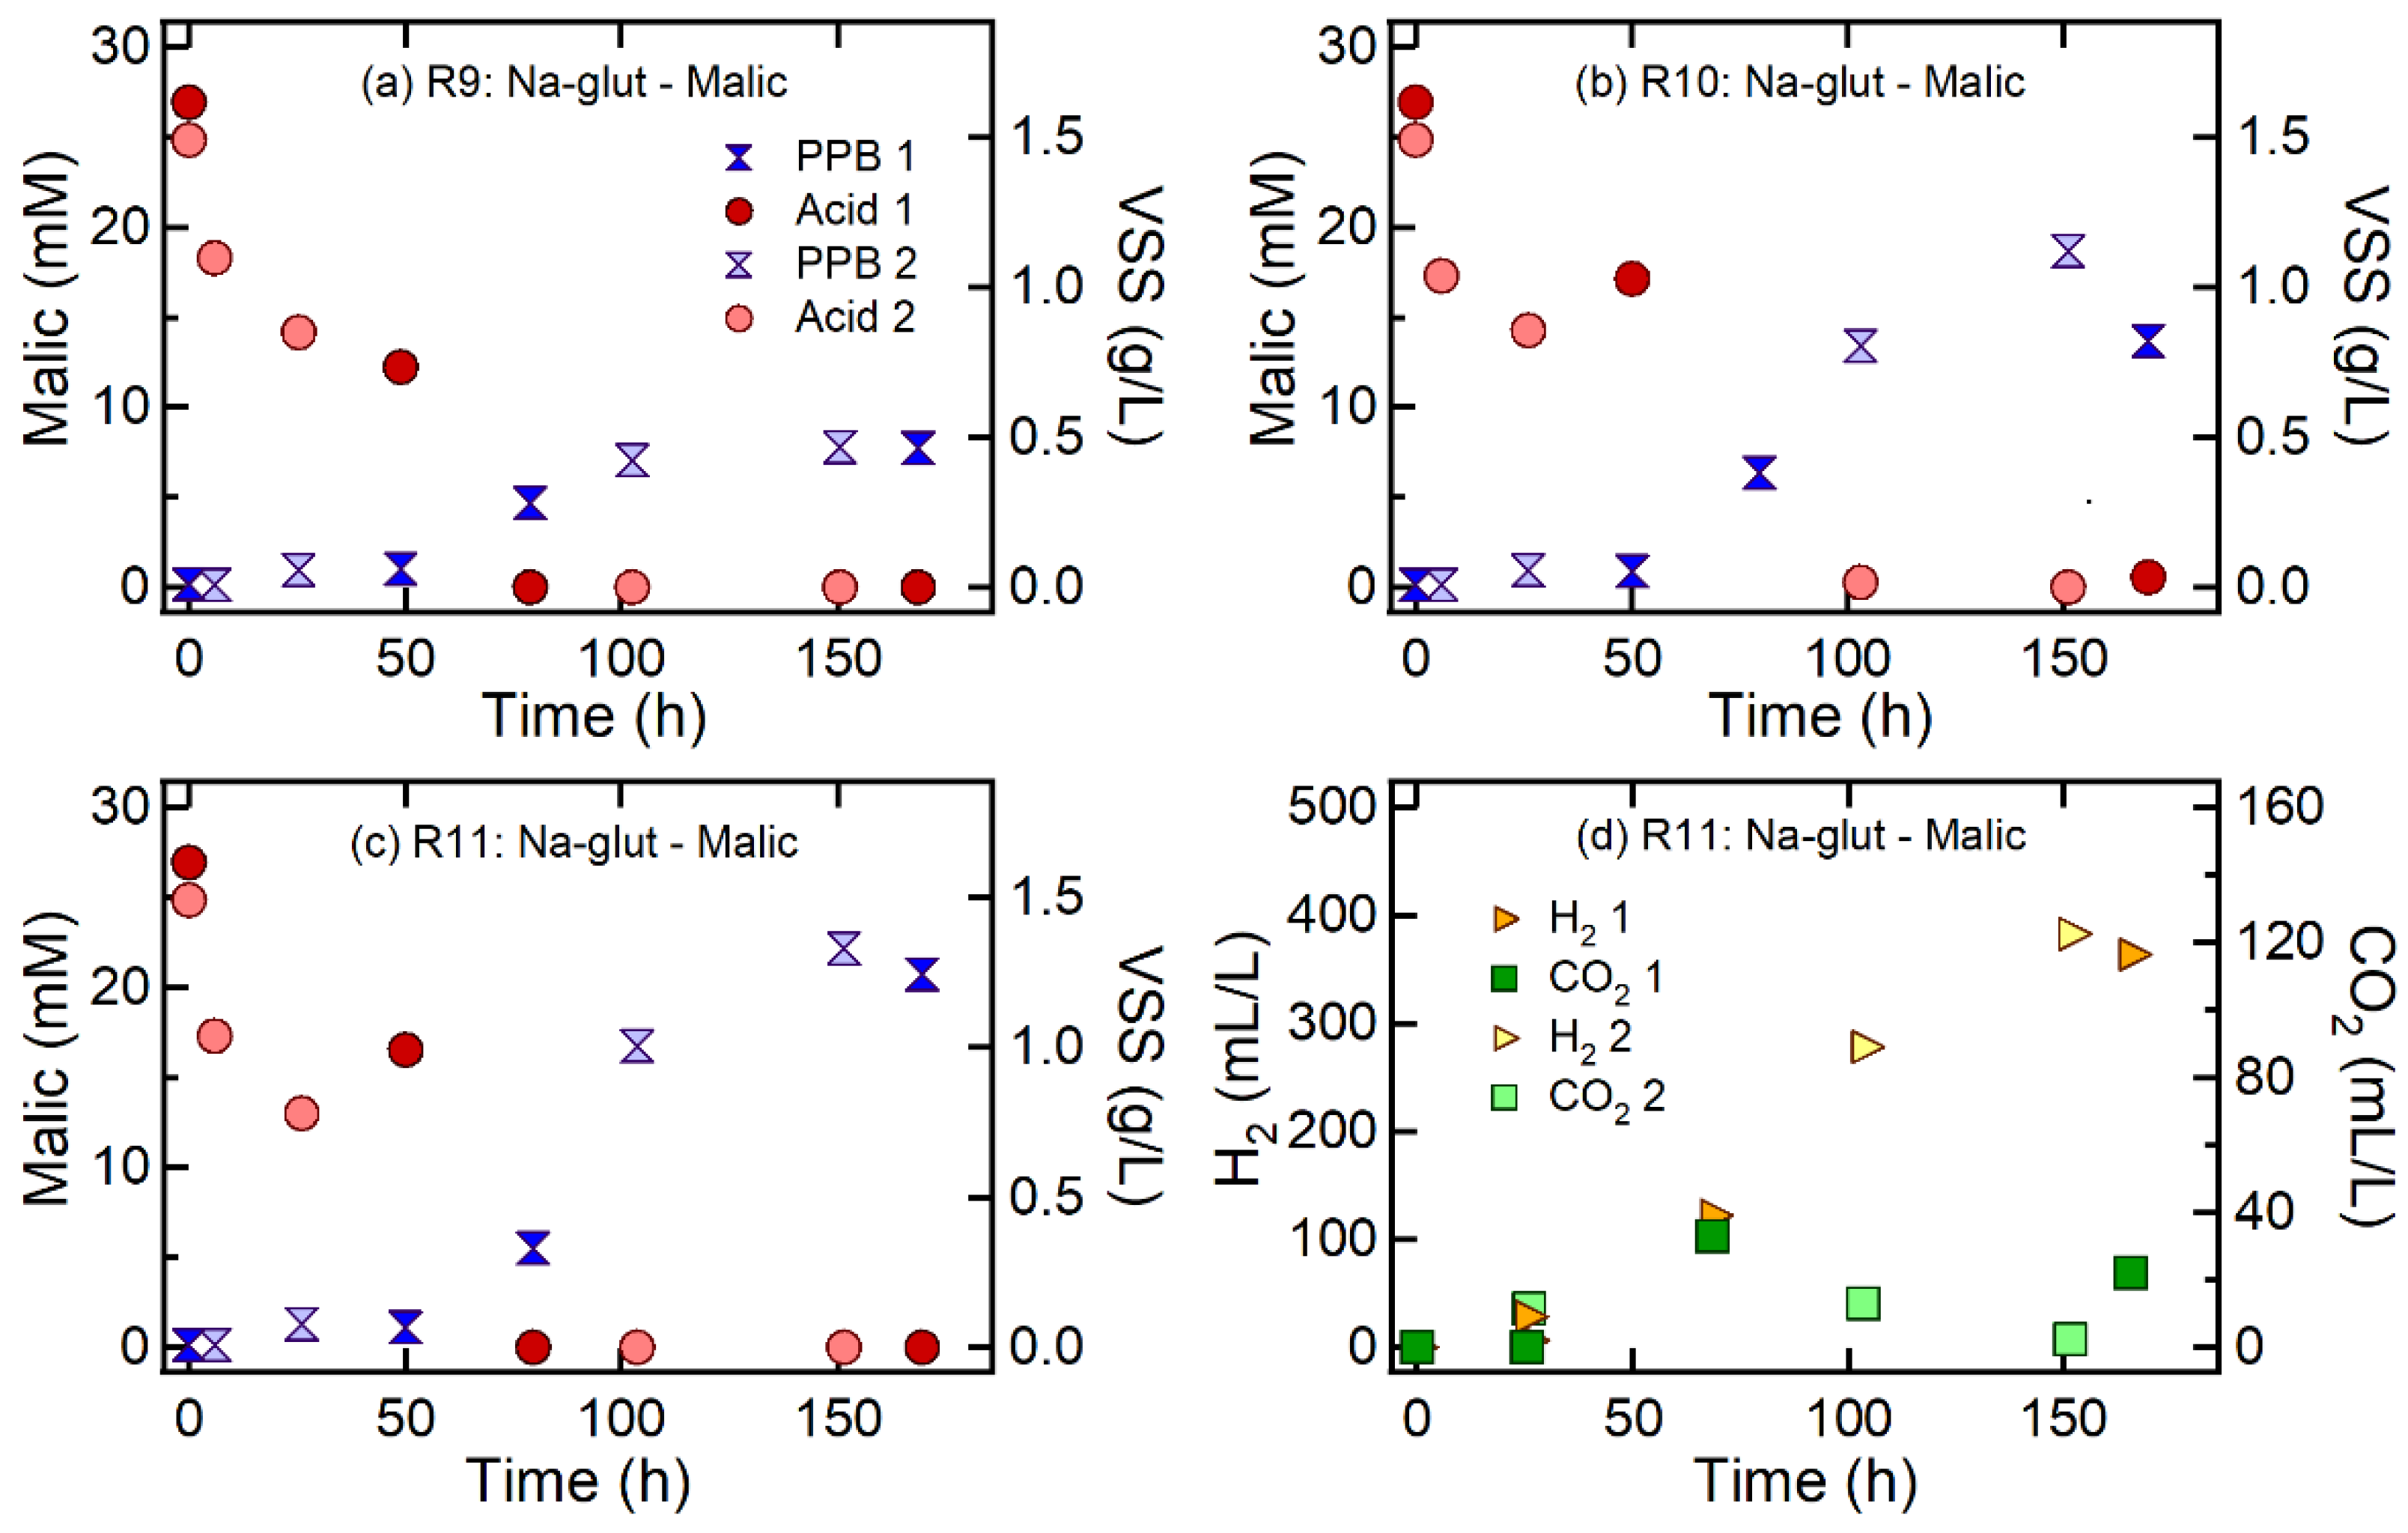
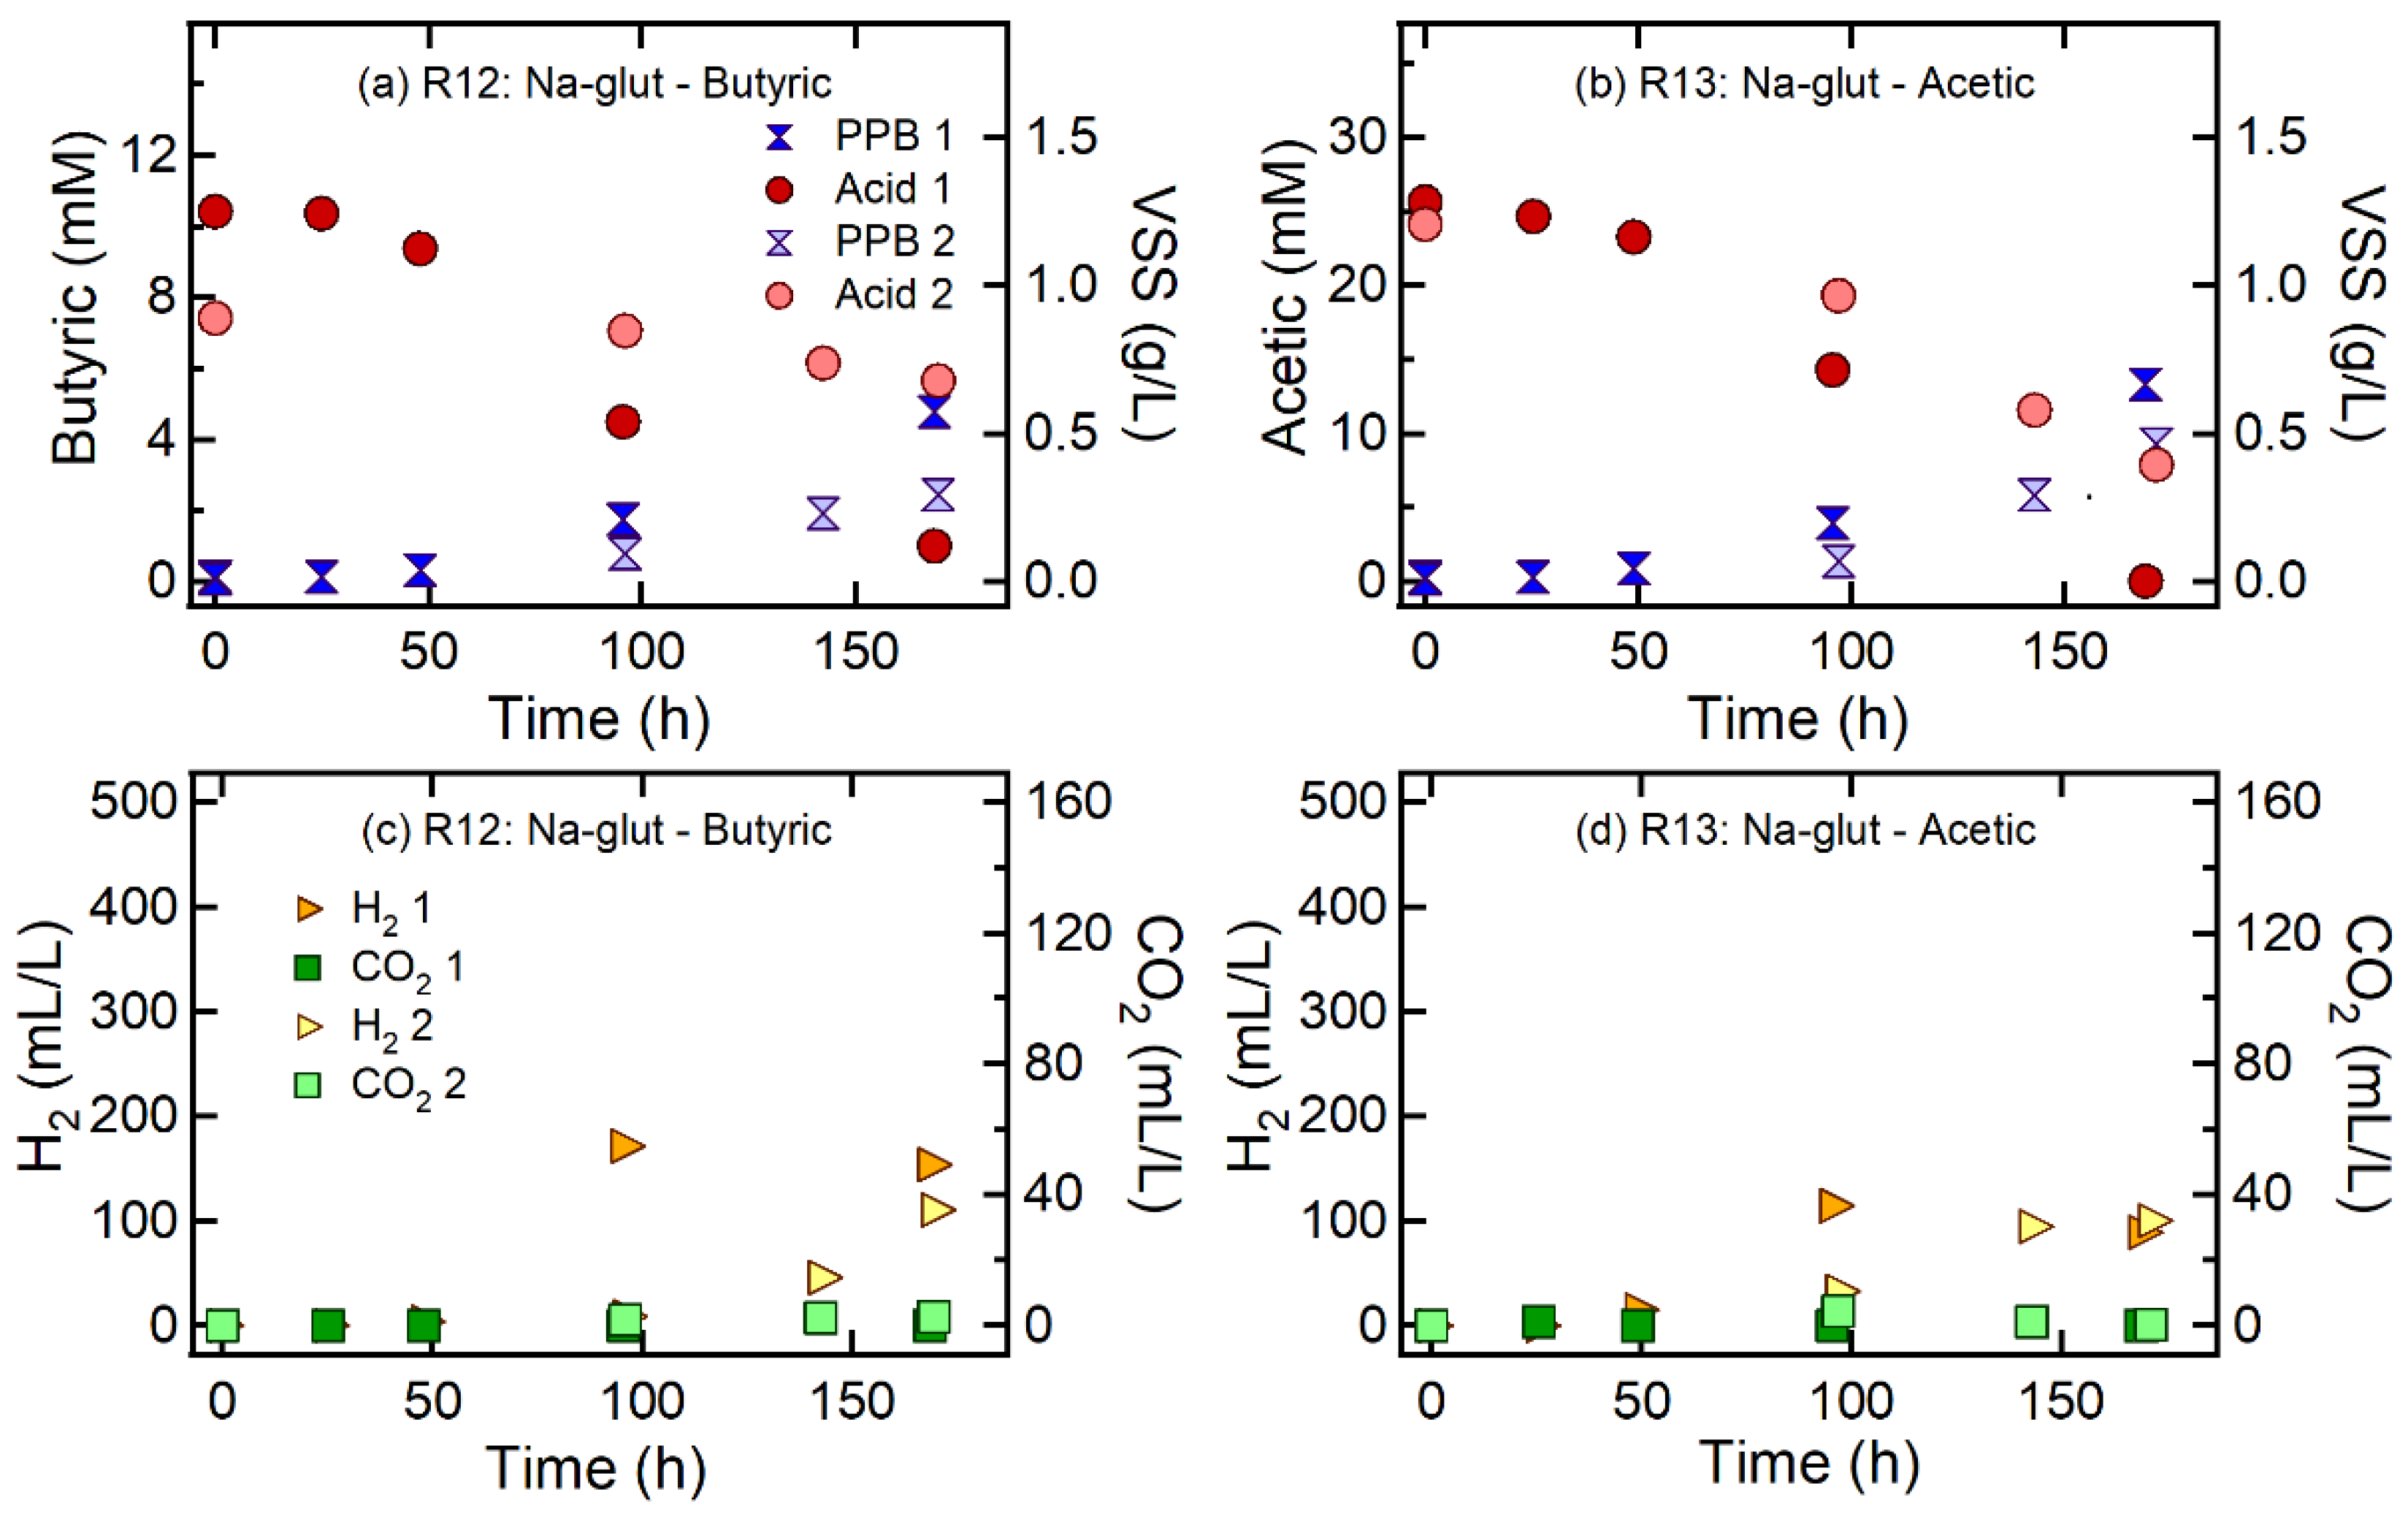
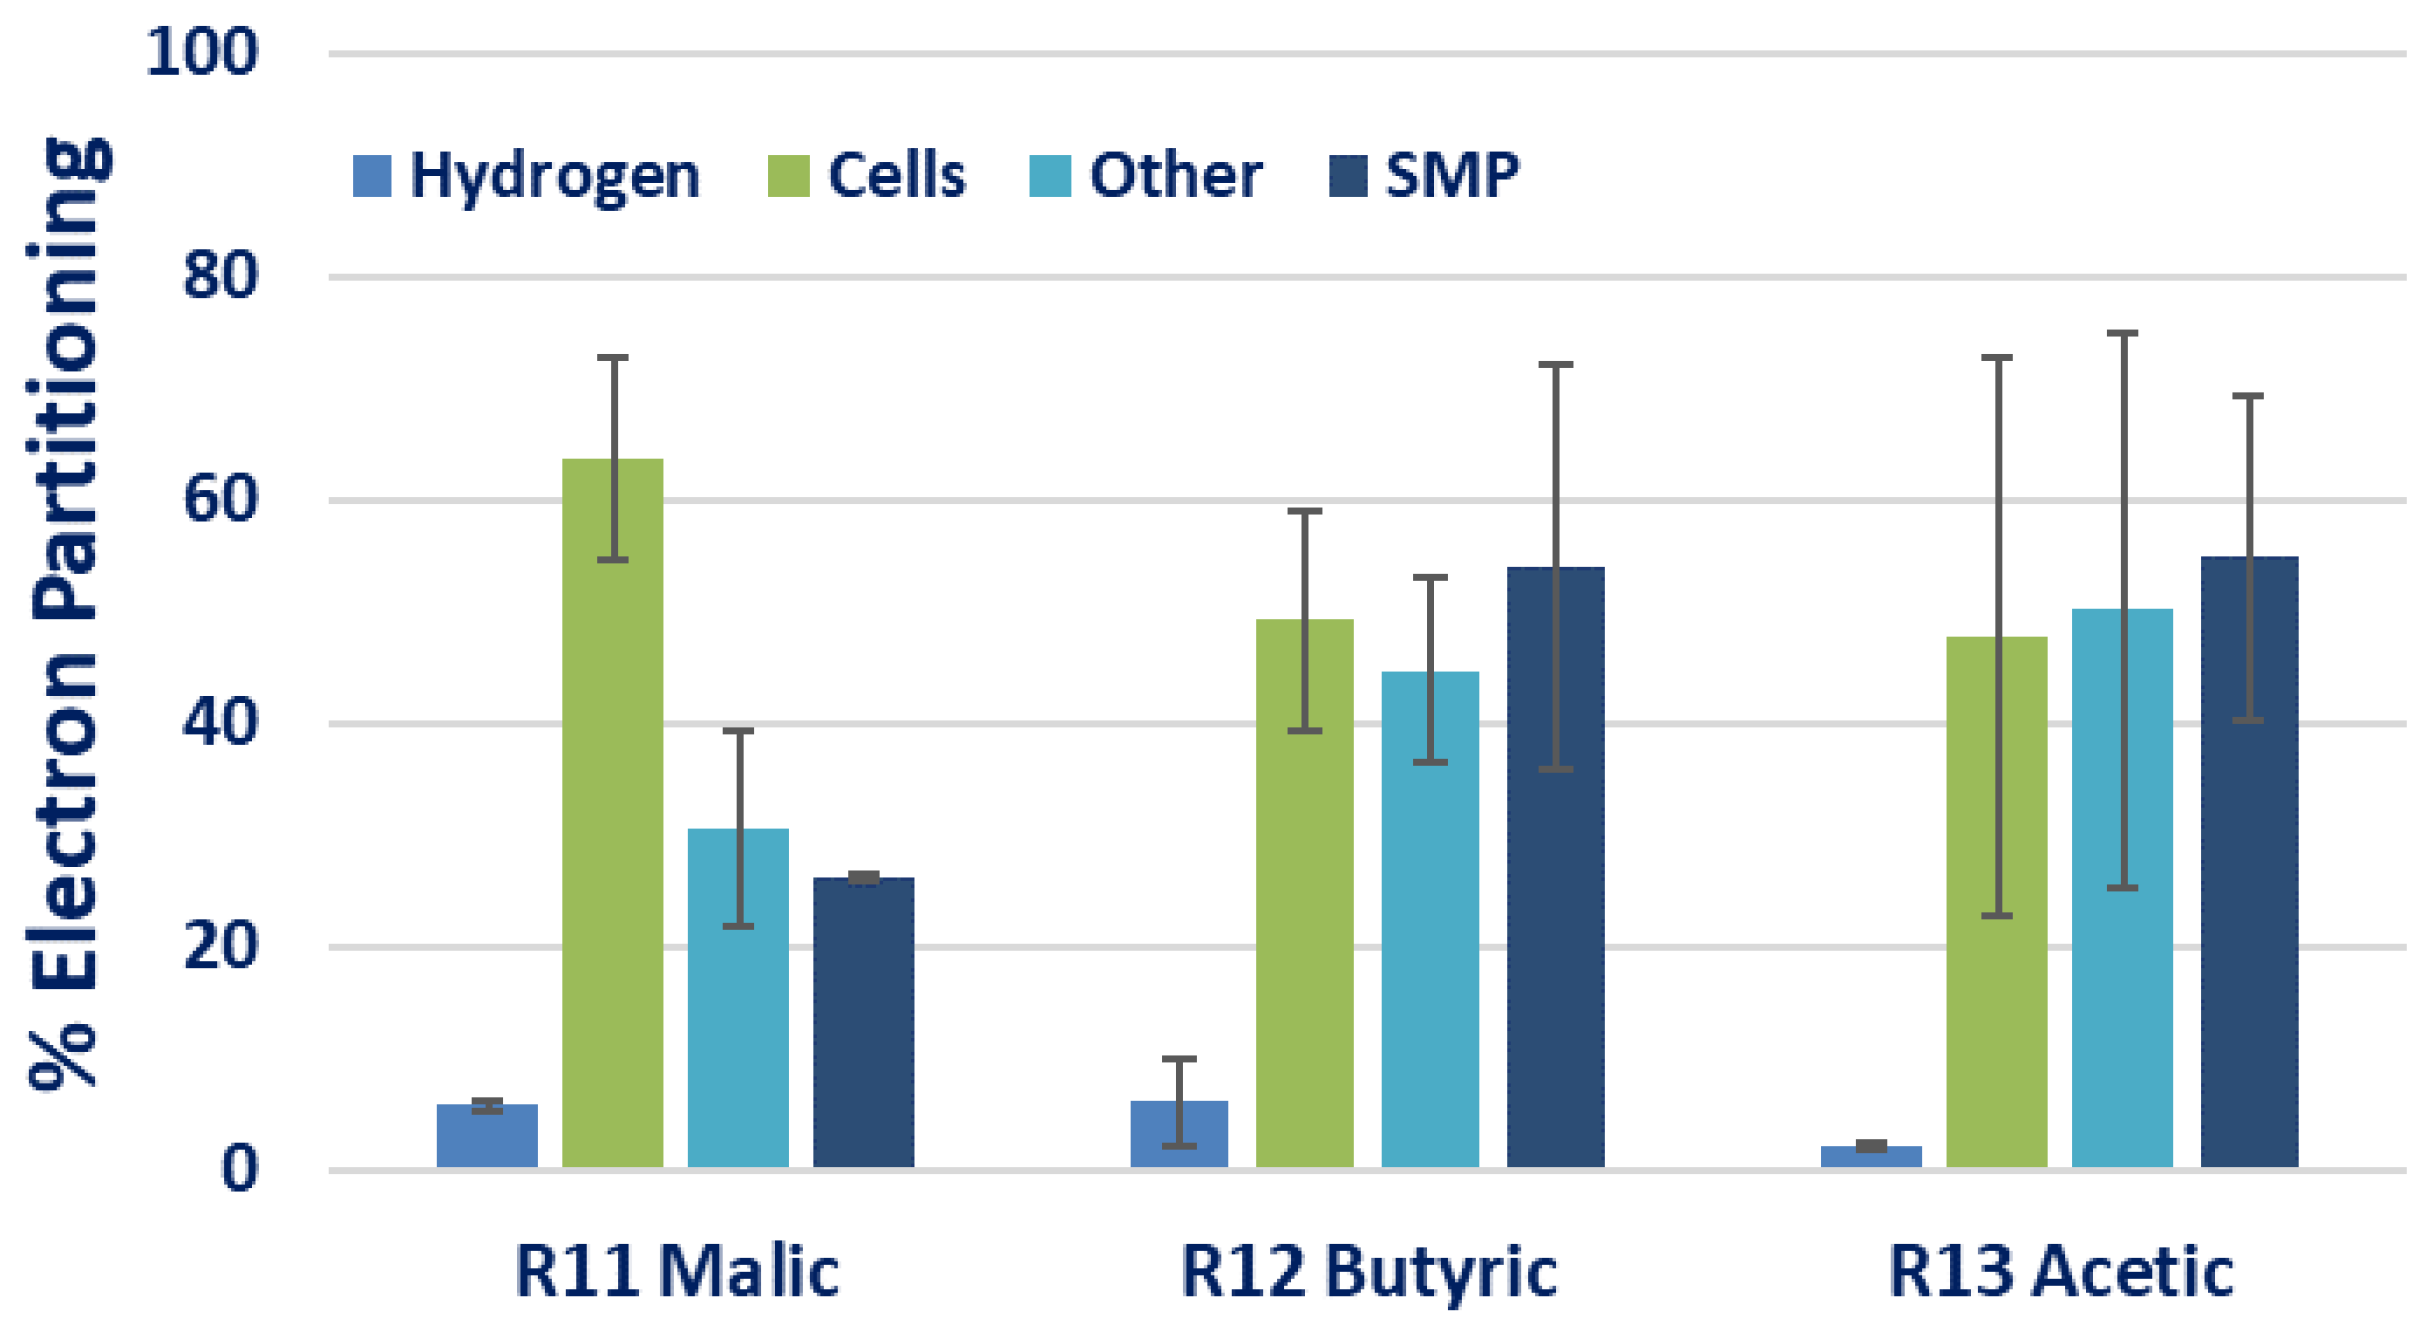
3.3. Effect of Carbon Sources on H2 and CO2 Production

In order to compare the effect of carbon source used, experimental runs (R5–R8, Table 2), were conducted using similar concentrations of NH4-N (75–600 mgNH4-N/L, 5.4–42.9 mM ammonium), but acetic acid as carbon source rather than malic acid. Results showed no H2 or CO2 production at any ammonium concentration used; however, PPB growth rates were comparable to those achieve by malic acid (Table 2). In addition, lower organic substrate assimilation rates were observed when acetic acid was used as carbon source. Acetic acid uptake also caused a rise in pH values more than 9. This pH increase has been related to the metabolic pathway of poly-b-hydroxybutyrate (PHB) formation rather than H2 production [20]. Accumulation of PHB can affect the acid-base equilibrium and rise the pH value in the cultivation medium. Therefore, it may be assumed that the excess of electrons was accumulated as PHB instead of released as H2. The PHB accumulation of PHA as an electron sink using acetate as carbon source has been previously demonstrated in R. sphaeroides cultures [21,22].
Furthermore, a set of experiments was carried out with Na-glutamate as N source but including two additional carbon sources, acetic acid and butyric acid, instead of malic acid. The concentrations used were 300 mgN/L as Na-glutamate and 9.5 mM (ca. 0.5 gC/L) of butyric acid (R12) and 25 mM (ca. 0.60 gC/L) of acetic acid (R13), respectively. Figure 7a,b represents the organic substrates’ degradation and PPB growth of two experimental trials (1 and 2), while Figure 7c,d shows the H2 and CO2 production by PPB. Table 2 summarizes the photo-H2 production, H2 yield, cell growth rate and CO2 emissions of the mixed PPB culture using the two carbon sources and glutamate as nitrogen source. The total amount of H2 produced after one week of cultivation was 145.2 ± 31.6 and 94.6 ± 7.5 mLH2/L for the butyric (R12) and acetic (R13) experiments, respectively, which were anyway much lower than the achieved in the malic experiment (R11, 370.0 ± 27.4 mLH2/L, Table 2). These findings are related to the different entrance of the substrates in the central metabolism of PPB, since malate enters directly into the TCA cycle, and therefore reductants go to succinate/fumarate that can drive direct energy production [10]. Accordingly, the H2 production rate achieved was 2.3 ± 0.2 mLH2/Lh, 0.86 ± 0.19 mLH2/Lh and 0.56 ± 0.04 mLH2/Lh for malic, butyric and acetic acids, respectively (Table 2).
Apart from the H2 production rate achieved, another criterion to evaluate the hydrogen production performance of an organic substrate is the substrate conversion efficiency. This means the amount of the substrate that has been utilized for hydrogen production instead of cell growth. The conversion efficiency can be evaluated by Equation (6).
%   C o n v e r s i o n   e f f i c i e n c y = 100 · A c t u a l   H 2   m o l e s   p r o d u c e d   T h e o r e t i c a l   H 2   m o l e s
The theoretical amount of hydrogen was evaluated assuming that all the acid’s substrate was converted to H2 and CO2 [46]. Results showed that the conversion efficiency achieved by the mixed PPB culture was in the order of butyric (9.3%) > malic (6.5%) > acetic acid (4.4%). However, the conversion efficiencies observed in this study, were lower than those reported for pure PPB cultures [10]. Specifically, other studies, working with PPB species, such as R. sphaeroides or R. capsulatus, observed a 22–56% substrate conversion efficiency with malate as carbon source [47,48,49]. Moreover, researchers working with butyrate or acetate as carbon sources, reported substrates conversions in the range of 40–75% by R. monas or R. sphaeroides [50,51].
The conversion efficiency of each substrate, was also verified by evaluating the electron partitioning during growth and H2 production process, following the procedure outlined by Yilmaz et al. [16]. Therefore, the concentrations of carbon and nitrogen substrates were converted into COD to quantify electron availability and partitioning in different electron sinks. The reducing power was equal to the sum of COD in the carbon source and in glutamate, that were consumed at the end of each experiment. The PPB growth was converted into COD, considering that 1 mg PPB expressed as VSS equals to 1.78 mg COD [13]. The theoretical value of COD for H2 production was calculated as 16 mgCOD / mmol of H2. The fate of substrate electrons in PPB cultures cultivated with different carbon sources are shown in Figure 8. All the COD values have been normalized dividing by the total COD consumed during each test (R11, R12, R13). The data indicated that, in malate-fed culture, the fraction of substrate electrons converted to cell synthesis was 64% (fcells), while the fraction of substrate electron used for H2 formation was 5.8% (fH2). In addition, when butyric and acetic acids were used as carbon sources, 50% and 48% of electrons were partitioned into the cell growth and 6.1% and 2.1% of electrons were partitioned into H2 production, respectively. This is in accordance with the higher yield (YH2) observed for butyric (0.4 LH2/g acid) as compare to acetic acid (0.16 LH2/g acid) (Table 2). Notably, it has been reported that the fraction of substrate electrons used for the cell growth of Rhodobacter sphaeroides was higher using butyrate or acetate (85%) than malate (48%) as organic substrate [43]. It was observed, that based on the theoretical calculation fother = 100 − fH2fcells, more than 30% of the reducing power in all cases, tends to be partitioned into other electron sinks. If the energy used for cell maintenance has a minor portion, fother could be correlated with soluble microbial products (SMPs), which are accumulated to the culture media due to cell lysis or are excreted for metabolic purposes [43]. The SMPs accumulated in this study in each case (Figure 8, R11, R12 and R13), were calculated by subtracting the COD of the remaining carbon and nitrogen sources from the measured soluble COD in the media [16]. It was observed, that the calculated SMPs (26% for malic, 54% for butyric and 55% for acetic) were similar to the theoretical calculated fraction fother (30% for malic, 45% for butyric and 50% for acetic). These results are in agreement with the findings reported by Yilmaz et al. [16], who observed that SMP was a major electron sink (>30% of the substrate electrons especially in resting cells), taking a big fraction of reducing power away from H2 production, in R. sphaeroides cultures. SMP formation during photoheterotrophic growth, may be associated with the formation of metabolic byproducts, such as formate, as well as high-molecular weight extracellular polymeric substances (EPS).
An important electron sink, that is correlated with fcells, is the CO2 fixation, as an electron accepting process. It is well known, that under butyrate-fed conditions, the role of CO2 fixation during PPB growth is to accept electrons, generated during the conversion of the reduced carbon source to PPB biomass, in order to maintain the redox balance [11]. As a result, negligible CO2 emission was occurred during the R12 experiment (Table 2). Negligible CO2 was observed in the case of acetic acid (Table 2), which is slightly more oxidized than the PPB biomass. McKinlay and Harwood [11] demonstrate that CO2 fixation is required for R. palustris photoheterotrophic growth on acetate, as about two times more reduced redox cofactors are produced than is required for biosynthesis during acetate uptake. Therefore, CO2 fixation is an obligatory electron-accepting process for the recycle of the excess of reduced cofactors.
In summary, the PPB mixed culture was able to produce significant amount of H2 using malic acid as carbon source, while the use of glutamate decreases CO2 emissions. The negative correlation between glutamate’s concentration and CO2 gas production, suggests that wastewater with high organic nitrogen content may be a preferable feedstock to produce H2 using PPB mixed cultures. It has been reported, that wastewaters produced from industrial processes, have less microbial (e.g., pathogens), metal, and organic contaminants content than domestic wastewater [33]. Therefore, animal processing wastewaters (e.g., poultry processing wastewater), with high concentration of nutrients and organic carbon, are potential good candidates to drive H2 production by PPB with low C footprint.

4. Conclusions

In this study, a mixed PPB culture was used to assess the effects of organic carbon and nitrogen substrates’ on H2 production as well as on CO2 emissions by the PPB culture. Results suggested that malic acid was more favorable organic source than butyric and acetic acids for H2 formation, achieving higher production rate. Moreover, NH4-N and Na-glutamate were found to produce comparable amounts of H2 when they used in combination with malic acid, in COD:N ratios of 100:3 and 100:5.5, respectively. However, the use of high glutamate’s concentration favors CO2 mitigation emissions. The experimental findings presented herein are useful to better plan wastewater treatment strategies by PPB mixed cultures for H2 production with low CO2 emissions.

Author Contributions

This work was carried out in collaboration between all authors. I.A.V. designed the study, performed the experimental investigation, the data curation, the statistical analysis and wrote the first draft of the manuscript; F.M. and J.A.M. performed the supervision and the writing—review; R.M. and D.P. performed the writing—review and the editing; D.P. performed the supervision, designed the study and performed the data analysis. All authors have read and agreed to the published version of the manuscript.

Funding

“This research was funded by the INTERNATIONAL EXCELLENCE CAMPUS “SMART ENERGY” PROGRAM (CEISEP–Post-doctoral Fellowship of I.A.V), “Comunidad de Madrid” and European Structural Funds by the REMTAVARES-CM project (S2018/EMT-4341) and Spanish Ministry of Economy by the FOTOBIOELECTRO project (CTM2017-91186-EXP).

Conflicts of Interest

The authors declare no conflict of interest.

References

  1. Batstone, D.J.; Hülsen, T.; Mehta, C.M.; Keller, J. Platforms for energy and nutrient recovery from domestic wastewater: A review. Chemosphere 2015, 140, 2–11. [Google Scholar] [CrossRef]
  2. Garcia, D.J.; You, F. The water-energy-food nexus and process systems engineering: A new focus. Comput. Chem. Eng. 2016, 91, 49–67. [Google Scholar] [CrossRef]
  3. Hülsen, T.; Batstone, D.J.; Keller, J. Phototrophic bacteria for nutrient recovery from domestic wastewater. Water Res. 2014, 50, 18–26. [Google Scholar] [CrossRef]
  4. Zimmo, O.; van der Steen, P.; Gijzen, H. Nitrogen mass balance across pilot-scale algae and duckweed-based wastewater stabilisation ponds. Water Res. 2004, 38, 913–920. [Google Scholar] [CrossRef]
  5. Lavrinovičs, A.; Juhna, T. Review on Challenges and Limitations for Algae-Based Wastewater Treatment. Constr. Sci. 2017, 20, 17–25. [Google Scholar] [CrossRef] [Green Version]
  6. Hülsen, T.; Barry, E.M.; Lu, Y.; Puyol, D.; Batstone, D.J. Low temperature treatment of domestic wastewater by purple phototrophic bacteria: Performance, activity, and community. Water Res. 2016, 100, 537–545. [Google Scholar] [CrossRef] [Green Version]
  7. Zhang, D.; Yang, H.; Huang, Z.; Liu, S.-J. Rhodocista pekingensis sp. nov., a cyst-forming phototrophic bacterium from a municipal wastewater treatment plant. Int. J. Syst. Evol. Microbiol. 2003, 53, 1111–1114. [Google Scholar] [CrossRef]
  8. Basak, N.; Das, D. The Prospect of Purple Non-Sulfur (PNS) Photosynthetic Bacteria for Hydrogen Production: The Present State of the Art. World J. Microbiol. Biotechnol. 2006, 23, 31–42. [Google Scholar] [CrossRef]
  9. Kim, M.K.; Choi, K.-M.; Yin, C.-R.; Lee, K.-Y.; Im, W.-T.; Lim, J.H.; Lee, S.-T. Odorous swine wastewater treatment by purple non-sulfur bacteria, Rhodopseudomonas palustris, isolated from eutrophicated ponds. Biotechnol. Lett. 2004, 26, 819–822. [Google Scholar] [CrossRef]
  10. Koku, H. Aspects of the metabolism of hydrogen production by Rhodobacter sphaeroides. Int. J. Hydrog. Energy 2002, 27, 1315–1329. [Google Scholar] [CrossRef]
  11. McKinlay, J.B.; Harwood, C.S. Carbon dioxide fixation as a central redox cofactor recycling mechanism in bacteria. Proc. Natl. Acad. Sci. USA 2010, 107, 11669–11675. [Google Scholar] [CrossRef] [Green Version]
  12. Mckinlay, J.B.; Harwood, C.S. Calvin Cycle Flux, Pathway Constraints, and Substrate Oxidation State Bacteria. mBio 2011, 2, 1–9. [Google Scholar] [CrossRef] [Green Version]
  13. Puyol, D.; Barry, E.; Hülsen, T.; Batstone, D.J. A mechanistic model for anaerobic phototrophs in domestic wastewater applications: Photo-anaerobic model (PAnM). Water Res. 2017, 116, 241–253. [Google Scholar] [CrossRef] [Green Version]
  14. Rey, F.E.; Heiniger, E.; Harwood, C.S. Redirection of Metabolism for Biological Hydrogen Production. Appl. Environ. Microbiol. 2007, 73, 1665–1671. [Google Scholar] [CrossRef] [Green Version]
  15. Vasiliadou, I.; Berná, A.; Manchon, C.; Melero, J.A.; Martinez, F.; Esteve-Nuñez, A.; Puyol, D. Biological and Bioelectrochemical Systems for Hydrogen Production and Carbon Fixation Using Purple Phototrophic Bacteria. Front. Energy Res. 2018, 6, 107. [Google Scholar] [CrossRef] [Green Version]
  16. Yilmaz, L.S.; Kontur, W.S.; Sanders, A.P.; Sohmen, U.; Donohue, T.J.; Noguera, D.R. Electron Partitioning During Light- and Nutrient-Powered Hydrogen Production by Rhodobacter sphaeroides. BioEnergy Res. 2010, 3, 55–66. [Google Scholar] [CrossRef] [Green Version]
  17. Tao, Y. Characteristics of a new photosynthetic bacterial strain for hydrogen production and its application in wastewater treatment. Int. J. Hydrog. Energy 2008, 33, 963–973. [Google Scholar] [CrossRef]
  18. Sasikala, C.H.; Ramana, C.H.V.; Rao, P.R. Regulation of simultaneous hydrogen photoproduction during growth by pH and glutamate in Rhodobacter sphaeroides O.U. 001. Int. J. Hydrog. Energy 1995, 20, 123–126. [Google Scholar] [CrossRef]
  19. Ventura, R.L.G.; Ventura, J.R.S.; Oh, Y.S. Photoheterotrophic hydrogen production of rhodobacter sphaeroides KCTC 1434 under alternating ar and N2 headspace gas. Philipp. J. Sci. 2019, 148, 63–72. [Google Scholar]
  20. Fang, H.; Liu, H.; Zhang, T. Phototrophic hydrogen production from acetate and butyrate in wastewater. Int. J. Hydrog. Energy 2005, 30, 785–793. [Google Scholar] [CrossRef]
  21. Lee, H.-S.; Vermaas, W.F.; Rittmann, B.E. Biological hydrogen production: Prospects and challenges. Trends Biotechnol. 2010, 28, 262–271. [Google Scholar] [CrossRef]
  22. Craven, J.; Sultan, M.A.; Sarma, R.; Wilson, S.; Meeks, N.; Kim, D.Y.; Hastings, J.T.; Bhattacharyya, D. Rhodopseudomonas palustris-based conversion of organic acids to hydrogen using plasmonic nanoparticles and near-infrared light. RSC Adv. 2019, 9, 41218–41227. [Google Scholar] [CrossRef] [Green Version]
  23. Wu, T.Y.; Hay, J.X.W.; Kong, L.B.; Juan, J.C.; Jahim, J.M. Recent advances in reuse of waste material as substrate to produce biohydrogen by purple non-sulfur (PNS) bacteria. Renew. Sustain. Energy Rev. 2012, 16, 3117–3122. [Google Scholar] [CrossRef]
  24. Chiemchaisri, C.; Jaitrong, L.; Honda, R.; Fukushi, K.; Yamamoto, K. Photosynthetic bacteria pond system with infra-red transmitting filter for the treatment and recovery of organic carbon from industrial wastewater. Water Sci. Technol. 2007, 56, 109–116. [Google Scholar] [CrossRef]
  25. Lee, M.G.; Kobayashi, M. Deodorization of swine sewage by addition of a phototrophic bacterium, Rhodopseudomonas capsulata. Soil Sci. Plant Nutr. 1992, 38, 767–770. [Google Scholar] [CrossRef] [Green Version]
  26. Lo, Y.-C.; Chen, C.-Y.; Lee, C.-M.; Chang, J.-S. Photo fermentative hydrogen production using dominant components (acetate, lactate, and butyrate) in dark fermentation effluents. Int. J. Hydrog. Energy 2011, 36, 14059–14068. [Google Scholar] [CrossRef]
  27. Tawfik, A.; El-Bery, H.; Singh, G.; Bux, F. Use of mixed culture bacteria for photofermentive hydrogen of dark fermentation effluent. Bioresour. Technol. 2014, 168, 119–126. [Google Scholar] [CrossRef]
  28. Kantachote, D.; Torpee, S.; Umsakul, K. The potential use of anoxygenic phototrophic bacteria for treating latex rubber sheet wastewater. Electron. J. Biotechnol. 2005, 8, 314–323. [Google Scholar] [CrossRef] [Green Version]
  29. Zhu, H.; Suzuki, T.; Tsygankov, A.; Asada, Y.; Miyake, J. Hydrogen production from tofu wastewater by Rhodobacter sphaeroides immobilized in agar gels. Int. J. Hydrog. Energy 1999, 24, 305–310. [Google Scholar] [CrossRef]
  30. Yetis, M. Photoproduction of hydrogen from sugar refinery wastewater by Rhodobacter sphaeroides O.U. 001. Int. J. Hydrog. Energy 2000, 25, 1035–1041. [Google Scholar] [CrossRef]
  31. Serna, R.L.; Garcia, D.; Bolado, S.; Jiménez, J.J.; Lai, F.Y.; Golovko, O.; Gago-Ferrero, P.; Ahrens, L.; Wiberg, K.; Munoz, R. Photobioreactors based on microalgae-bacteria and purple phototrophic bacteria consortia: A promising technology to reduce the load of veterinary drugs from piggery wastewater. Sci. Total. Environ. 2019, 692, 259–266. [Google Scholar] [CrossRef]
  32. Hülsen, T.; Hsieh, K.; Lu, Y.; Tait, S.; Batstone, D.J. Simultaneous treatment and single cell protein production from agri-industrial wastewaters using purple phototrophic bacteria or microalgae—A comparison. Biores. Technol. 2018, 254, 214–223. [Google Scholar] [CrossRef] [Green Version]
  33. Hülsen, T.; Hsieh, K.; Tait, S.; Barry, E.M.; Puyol, D.; Batstone, D.J. White and infrared light continuous photobioreactors for resource recovery from poultry processing wastewater—A comparison. Water Res. 2018, 144, 665–676. [Google Scholar] [CrossRef]
  34. Hülsen, T.; Hsieh, K.; Batstone, D.J. Saline wastewater treatment with purple phototrophic bacteria. Water Res. 2019, 160, 259–267. [Google Scholar] [CrossRef]
  35. Dalaei, P.; Bahreini, G.; Nakhla, G.; Santoro, D.; Batstone, D.; Hülsen, T. Municipal wastewater treatment by purple phototropic bacteria at low infrared irradiances using a photo-anaerobic membrane bioreactor. Water Res. 2020, 173, 115535. [Google Scholar] [CrossRef]
  36. Hu, J.; Yang, H.; Wang, X.; Cao, W.; Guo, L. Strong pH dependence of hydrogen production from glucose by Rhodobacter sphaeroides. Int. J. Hydrog. Energy 2020, 45, 9451–9458. [Google Scholar] [CrossRef]
  37. Ormerod, J.G.; Ormerod, K.S.; Gest, H. Light-Dependent Utilization of Organic Compounds Photoproduction of Molecular Hydrogen by Photosynthetic Bacteria; Relationships with Nitrogen Metabolism’ of organic com- grown with N, or certain amino acids pro- duce large quantities of molecular hydr. Arch. Biochem. Biophys. 1961, 94, 449–463. [Google Scholar] [PubMed]
  38. Clemens, P.; Walter, C. Microalgal Biotechnology: Potential and Production; Walter de Gruyter: Berlin, Germany, 2012; ISBN 978-3-11-022501-3. [Google Scholar]
  39. APHA. Standard Methods for the Examination of Water and Wastewater Standard Methods for the Examination of Water and Wastewater, 17th ed.; American Public Health Association: Washington, DC, USA, 1989. [Google Scholar]
  40. Heras, I.D.L.; Molina, R.; Segura, Y.; Hülsen, T.; Molina, M.; Gonzalez-Benítez, N.; Melero, J.; de la Rubia, M.; Martínez, F.; Puyol, D. Contamination of N-poor wastewater with emerging pollutants does not affect the performance of purple phototrophic bacteria and the subsequent resource recovery potential. J. Hazard. Mater. 2020, 385, 121617. [Google Scholar] [CrossRef]
  41. Melnicki, M.; Bianchi, L.; de Philippis, R.; Melis, A. Hydrogen production during stationary phase in purple photosynthetic bacteria. Int. J. Hydrog. Energy 2008, 33, 6525–6534. [Google Scholar] [CrossRef]
  42. Niedzwiedzki, D.M.; Dilbeck, P.L.; Tang, Q.; Martin, E.C.; Bocian, D.F.; Hunter, C.N.; Holten, D. New insights into the photochemistry of carotenoid spheroidenone in light-harvesting complex 2 from the purple bacterium Rhodobacter sphaeroides. Photosynth. Res. 2016, 131, 291–304. [Google Scholar] [CrossRef] [Green Version]
  43. Kim, M.-S.; Kim, D.-H.; Cha, J. Culture conditions affecting H2 production by phototrophic bacterium Rhodobacter sphaeroides KD131. Int. J. Hydrog. Energy 2012, 37, 14055–14061. [Google Scholar] [CrossRef]
  44. Tichi, M.A.; Tabita, F.R. Maintenance and control of redox poise in Rhodobacter capsulatus strains deficient in the Calvin-Benson-Bassham pathway. Arch. Microbiol. 2000, 174, 322–333. [Google Scholar] [CrossRef]
  45. Wang, X.; Falcone, D.L.; Tabita, F.R. Reductive pentose phosphate-independent CO2 fixation in Rhodobacter sphaeroides and evidence that ribulose bisphosphate carboxylase/oxygenase activity serves to maintain the redox balance of the cell. J. Bacteriol. 1993, 175, 3372–3379. [Google Scholar] [CrossRef] [PubMed] [Green Version]
  46. Sasikala, K.; Ramana, C.; Rao, P.R.; Kovács, K. Anoxygenic Phototrophic Bacteria: Physiology and Advances in Hydrogen Production Technology. Nat. Eng. Resist. Plant Vir. Part II 1993, 38, 211–295. [Google Scholar] [CrossRef]
  47. Hillmer, P.; Gest, H. H2 metabolism in the photosynthetic bacterium Rhodopseudomonas capsulata: Production and utilization of H2 by resting cells. J. Bacteriol. 1977, 129, 732–739. [Google Scholar] [CrossRef] [PubMed] [Green Version]
  48. Eroglu, N.; Aslan, K.; Gündüz, U.; Yücel, M.; Turker, L. Substrate consumption rates for hydrogen production by Rhodobacter sphaeroidesin a column photobioreactor. Biotransform. Microb. Degrada. Health-Risk Compd. 1999, 35, 103–113. [Google Scholar] [CrossRef]
  49. Eroglu, I. Hydrogen production by Rhodobacter sphaeroides O.U.001 in a flat plate solar bioreactor. Int. J. Hydrog. Energy 2008, 33, 531–541. [Google Scholar] [CrossRef]
  50. Mao, X.-Y.; Miyake, J.; Kawamura, S. Screening photosynthesis bacteria for hydrogen production from organic acids. J. Ferment. Technol. 1986, 64, 245–249. [Google Scholar] [CrossRef]
  51. Barbosa, M.J.; Rocha, J.; Tramper, J.; Wijffels, R.H. Acetate as a carbon source for hydrogen production by photosynthetic bacteria. J. Biotechnol. 2001, 85, 25–33. [Google Scholar] [CrossRef]
Figure 1. Photo-bioreactor’s set-up.
Water 12 02015 g001
Figure 2. Infrared (IR) light intensity (W/m2) on the PhBR surface.
Water 12 02015 g002
Figure 3. (a) COD assimilation, biomass growth and NH4-N concentration added throughout the weekly operation photo-bioreactor and (b) Absorbance spectra (440–1000 nm) of PPB in culture medium for three cycles.
Water 12 02015 g003
Figure 4. (a) Malic acid uptake and PPB growth for R1, (b) gases production for R1, (c) malic acid uptake and PPB growth for R2 and (d) malic acid uptake and PPB growth for R3.
Water 12 02015 g004
Figure 5. Malic acid assimilation, PPB growth in media supplemented with malic acid and Na-glutamate for (a) R9, (b) R10 and (c) R11 and (d) gases production for R11.
Water 12 02015 g005
Figure 6. H2 and CO2 production under different conditions tested. Error bars present the corresponding CI (95%) for each combination of sources tested.
Water 12 02015 g006
Figure 7. Acids’ assimilation, PPB growth and gases’ production in media supplemented with (a,c) butyric acid and Na-glutamate for R12 and (b,d) acetic acid and Na-glutamate for R13.
Water 12 02015 g007
Figure 8. Electron partitioning during PPB growth using different organic substrates. Error bars present the represent the standard deviation of data.
Water 12 02015 g008
Table 1. Experimental condition of batch assays of purple phototrophic bacteria (PPB) using different carbon and nitrogen sources.
RUN Number Carbon
Source
Nitrogen
Source
Nitrogen
(mgN/L)
COD-Substrate to N Ratio a
COD:N
Measured COD to N Ratio b
COD:N
R1Malic acidNH4Cl75100:3.8100:3
R2150100:7.5100:6.8
R3300100:15100:12.1
R4600100:30100:33.8
R5Acetic acidNH4Cl75100:3.8100:2.9
R6150100:7.5100:8.6
R7300100:15100:15.6
R8600100:30100:44
R9Malic acidNa-glutamate75100:3.8100:2.3
R10150100:7.5100:4.6
R11300100:15100:5.5
R12Butyric acidNa-glutamate300100:15100:6.9
R13Acetic acidNa-glutamate300100:15100:6.7
R14Malic acidΝ2 gas650 c100:33100:36
a COD-substrate to N ratio, considering only the COD of organic substrate and the N of the nitrogen substrate; b Measured COD to N ratio, considering also the COD content of glutamate; c Nitrogen concentration per liquid volume added as N2.
Table 2. H2 and CO2 production by PPB under different nitrogen and carbon sources.
RUN Number Carbon
Source
Nitrogen
Source
Nitrogen
(mgN/L)
COD-Substrate to N Ratio a
COD:N
Measured COD to N Ratio b
COD:N
RPPB c
(mgVSS/Lh)
Racid d
(mM acid/h)
H2 e
(mLH2/L)
H2_rate f
(mLH2/Lh)
YH2 g
(LH2/g_Acid)
CO2 h
(mLCO2/L)
R1Malic acidNH4Cl75100:3.8100:33.7 ± 0.80.32 ± 0.11381.6 ± 13.22.5 ± 0.80.11 ± 0.0151.2 ± 1.6
R2150100:7.5100:6.83.7 ± 1.70.28 ± 0.101.4 ± 2.10 ± 00 ± 05.6 ± 3.0
R3300100:15100:12.14.2 ± 2.30.26 ± 0.111.8 ± 2.90 ± 00 ± 011.0 ± 1.7
R4600100:30100:33.81.690.3100015.1
R5Acetic acidNH4Cl75100:3.8100:2.93.620.1100.010.0020
R6150100:7.5100:8.62.930.072.40.020.0040
R7300100:15100:15.63.950.122.90.020.0020
R8600100:30100:444.300.092.8000.2
R9Malic acidNa-glutamate75100:3.8100:2.33.8 ± 0.50.31 ± 0.08264.3 ± 96.41.7 ± 0.80.08 ± 0.0366.4 ± 6.1
R10150100:7.5100:4.64.6 ± 2.90.23 ± 0.12305.9 ± 64.22.1 ± 0.90.12 ± 0.0538.2 ± 21.4
R11300100:15100:5.56.9 ± 2.40.30 ± 0.05370.0 ± 27.42.3 ± 0.20.11 ± 0.0113.4 ± 13.6
R12Butyric acidNa-glutamate300100:15100:6.92.7 ± 0.90.04 ± 0.03145.2 ± 31.60.86 ± 0.190.40 ± 0.281.1 ± 1.3
R13Acetic acidNa-glutamate300100:15100:6.73.3 ± 0.90.10 ± 0.0894.6 ± 7.50.56 ± 0.040.16 ± 0.150.10 ± 0.12
R14Malic acidΝ2 gas650 100:33100:363.3 ± 2.10.01 ± 01.7 ± 00 ± 00 ± 01.6 ± 1.9
a COD-substrate to N ratio, considering only the COD of organic substrate and the N of the nitrogen substrate; b Measured COD to N ratio, considering also the COD content of glutamate; c PPB growth rate; d organic substrate assimilation rate; e H2 production; f H2 production rate; g H2 yield, h CO2 production.

