Article

Performance of a Full-Scale Biogas Plant Operation in Greece and Its Impact on the Circular Economy

by
Apostolos Spyridonidis
1,
Ioanna A. Vasiliadou
1,
Christos S. Akratos
2 and
Κaterina Stamatelatou
1,*
1
Department of Environmental Engineering, Democritus University of Thrace, 67132 Xanthi, Greece
2
Department of Civil Engineering, Democritus University of Thrace, 67100 Xanthi, Greece
*
Author to whom correspondence should be addressed.
Submission received: 23 September 2020 / Revised: 22 October 2020 / Accepted: 27 October 2020 / Published: 2 November 2020

Abstract

:
Biogas plants have been started to expand recently in Greece and their positive contribution to the economy is evident. A typical case study is presented which focuses on the long-term monitoring (lasting for one year) of a 500 kW mesophilic biogas plant consisting of an one-stage digester. The main feedstock used was cow manure, supplemented occasionally with chicken manure, corn silage, wheat/ray silage, glycerine, cheese whey, molasses and olive mill wastewater. The mixture of the feedstocks was adjusted based on their availability, cost and biochemical methane potential. The organic loading rate (OLR) varied at 3.42 ± 0.23 kg COD m−3 day−1 (or 2.74 ± 0.18 kg VS m−3 day−1) and resulted in a stable performance in terms of specific biogas production rate (1.27 ± 0.12 m3 m−3 day−1), biogas yield (0.46 ± 0.05 m3 kg−1 VS, 55 ± 1.3% in methane) and electricity production rate (12687 ± 1140 kWh day−1). There were no problems of foaming, nor was there a need for trace metal addition. The digestate was used by the neighboring farmers who observed an improvement in their crop yield. The profit estimates per feedstock indicate that chicken manure is superior to the other feedstocks, while molasses, silages and glycerin result in less profit due to the long distance of the biogas plant from their production source. Finally, the greenhouse gas emissions due to the digestate storage in the open air seem to be minor (0.81% of the methane consumed).

1. Introduction

Biogas, alongside second-generation biofuels, has been emerged as a reliable alternative to the fossil fuel economy, towards low-CO2 emissions [1]. Anaerobic digestion (AD) is suitable for reducing the organic content of biomass, such as energy crops, lignocellulosic residues, fermentable organic wastes and algae, ensuring ecological and climate-neutral biogas production [2]. It is an established technology with promising further development worldwide as long as there are low-cost feedstocks available, and a wide spectrum of possible uses of biogas (e.g., heat, electricity, steam, hydrogen and biomethane) and digestate are fully exploited [3].
AD is a complex process, sensitive to several factors that could influence the stable performance of a digester, such as pH, ammonia (NH3), temperature, salinity, organic loading rate (OLR), hydraulic retention time (HRT), trace element supplementation, carbon-to-nitrogen (C/N) ratio and composition of the feeding mixture [4,5,6,7,8,9]. Co-digestion of several types of biomass (feedstocks) in a biogas plant can address many of the aforementioned issues successfully, since (i) the supplementation of nutrients and trace metals, present in the various components of the feeding mixture at different levels, balances the micro and macronutrients and trace metals’ requirements; (ii) mixing various streams of feedstock results in the dilution of possible inhibitory agents (e.g., NH3 or volatile fatty acids from the degradation of wastes containing proteins and carbohydrates in high concentrations respectively); (iii) the enhanced diversity of microbial communities and their synergistic activity plays a vital role in methanogenesis; and (iv) there is more efficient use of equipment and cost-sharing by processing multiple waste streams in a single plant [10,11]. As a result, during co-digestion, it becomes feasible to increase the organic loading, which leads to higher biogas production per digester volume, without compromising the stability of the process.
Publications focusing on a biogas plant as a case study aim to show the merits of co-digestion to enhance the biogas production from sewage sludge by mixing it with organic waste [12] or cattle manure by mixing it with agro-wastes at different temperature ranges [2]. Näegele et al. [13] demonstrated the efficiency of an external biological desulfurization unit. Garuti et al. [9] showed that the proper trace element supplementation helped to both prevent and solve biological process failure in full-scale agricultural biogas plants. In another publication, Garuti et al. [14] presented how the hydrodynamic cavitation pretreatment of agricultural feedstocks improved biogas production in a full-scale agricultural biogas plant. Rasheed et al. [15] reported the real-time operation of an industrial scale AD plant of a novel design, consisting of tri-digesters connected through an underground up-flow anaerobic sludge blanket (UASB), allowing it to function as a continuous flow reactor. Marti-Herrero et al. [16] evaluated the performance of a full-scale anaerobic digester treating fruit and vegetable waste from a municipal market without pre-treatment, clean water consumption, active heating or mixing.
Full-scale case studies have shown that upscaling problems related to inadequate mixing, deficient online monitoring or control, development of foaming, hydrogen sulfide (H2S) removal, etc., can deteriorate seriously the operation of the biogas plant. These technical difficulties are not met at the laboratory-scale, which most of the studies are based on. Indeed, comparisons of laboratory (or even pilot) scale and full-scale plants have shown that a laboratory-scale bioreactor can operate at 3–4 times the OLR of a full-scale digester [17], either because the plant operators feel safer to operate far below the maximum capacity with the lack of a trustworthy online monitoring and control system, or because the full capacity as determined from laboratory-scale experiments is overestimated due to the more efficient mixing achieved in smaller units [2]. Moreover, when laboratory-scale experiments are based on batch tests, the conclusions about the biodegradability and the rate of biogas production cannot be extrapolated to full-scale biogas plants [18] which are continuously operated (and not in batch mode). The conditions and the microorganism consortiums in batch tests are very different from what prevails in digesters, which are continuously exposed to the same operating conditions, altering the microbial synthesis, activity and response in the long term. This was observed in a study of Zhurka et al. [19] about the effect of alkaline pretreatment on biogas production from sunflower residues, which was positive based on batch experiments, but negative based on continuous experiments. Therefore, reporting the response of continuously run systems at the laboratory-scale, but most importantly, at full scale, is a valuable record of the biogas experience.
AD has been recently started getting established in Greece and the number of biogas plants is continuously growing (Figure 1). The electrical power installed by the end of 2019 was 73.6 MW from 49 biogas plants, according to the Hellenic Electricity Distribution Network Operator, but more than half of it (ca. 40 MW) comes from the landfills and sewage treatment plants [20]. Although the target set by the Greek state in 2010 for the energy from biogas and biomass was 350 MW at the end of 2020, only 18.7% had been achieved by 2018. The biogas plants based on the rural originated feedstocks could be much more widespread in all Greek rural areas, but instead, they are mostly concentrated in northern Greece. The reasons for this slow development are mainly spot to policy measures, although there are more influential factors prevailing in the northern part of Greece related to the vast availability of manure from the intensive livestock and the large agricultural areas where digestate can be disposed of. However, the capacity of the Greek agricultural sector to promote the biogas economy further is still underexploited [20].
The present study is the first case study of a biogas plant in Greece. It also contributes to the limited number of publications focusing on the full-scale operation, emphasizing the importance of the close monitoring of all parameters and correlating the performance with the feeding variable mixture of feedstocks. The full-scale biogas plant is installed in the area of Xanthi city in Northern Greece. It is of 0.5 MW capacity, which is typical in the rural areas in Greece and has become the center of a circular economy module in a narrow regional setting. The circular economy concept aims at maximizing the value of products and resources as much as possible throughout the life cycles of materials. The linear economy model simply exploits the resources producing goods and profits while disposing of wastes, including the products themselves when they are not used anymore. The agricultural wastes contain a significant amount of energy and matter of fertilizing value, which makes the loop close when they are used as feedstocks in AD plants. As a result, the AD economy is integrated into the circular economy concept by default, and this study shows how the activities of several stakeholders are complementary, while they make more profits and promote the protection of the environment.

2. Materials and Methods

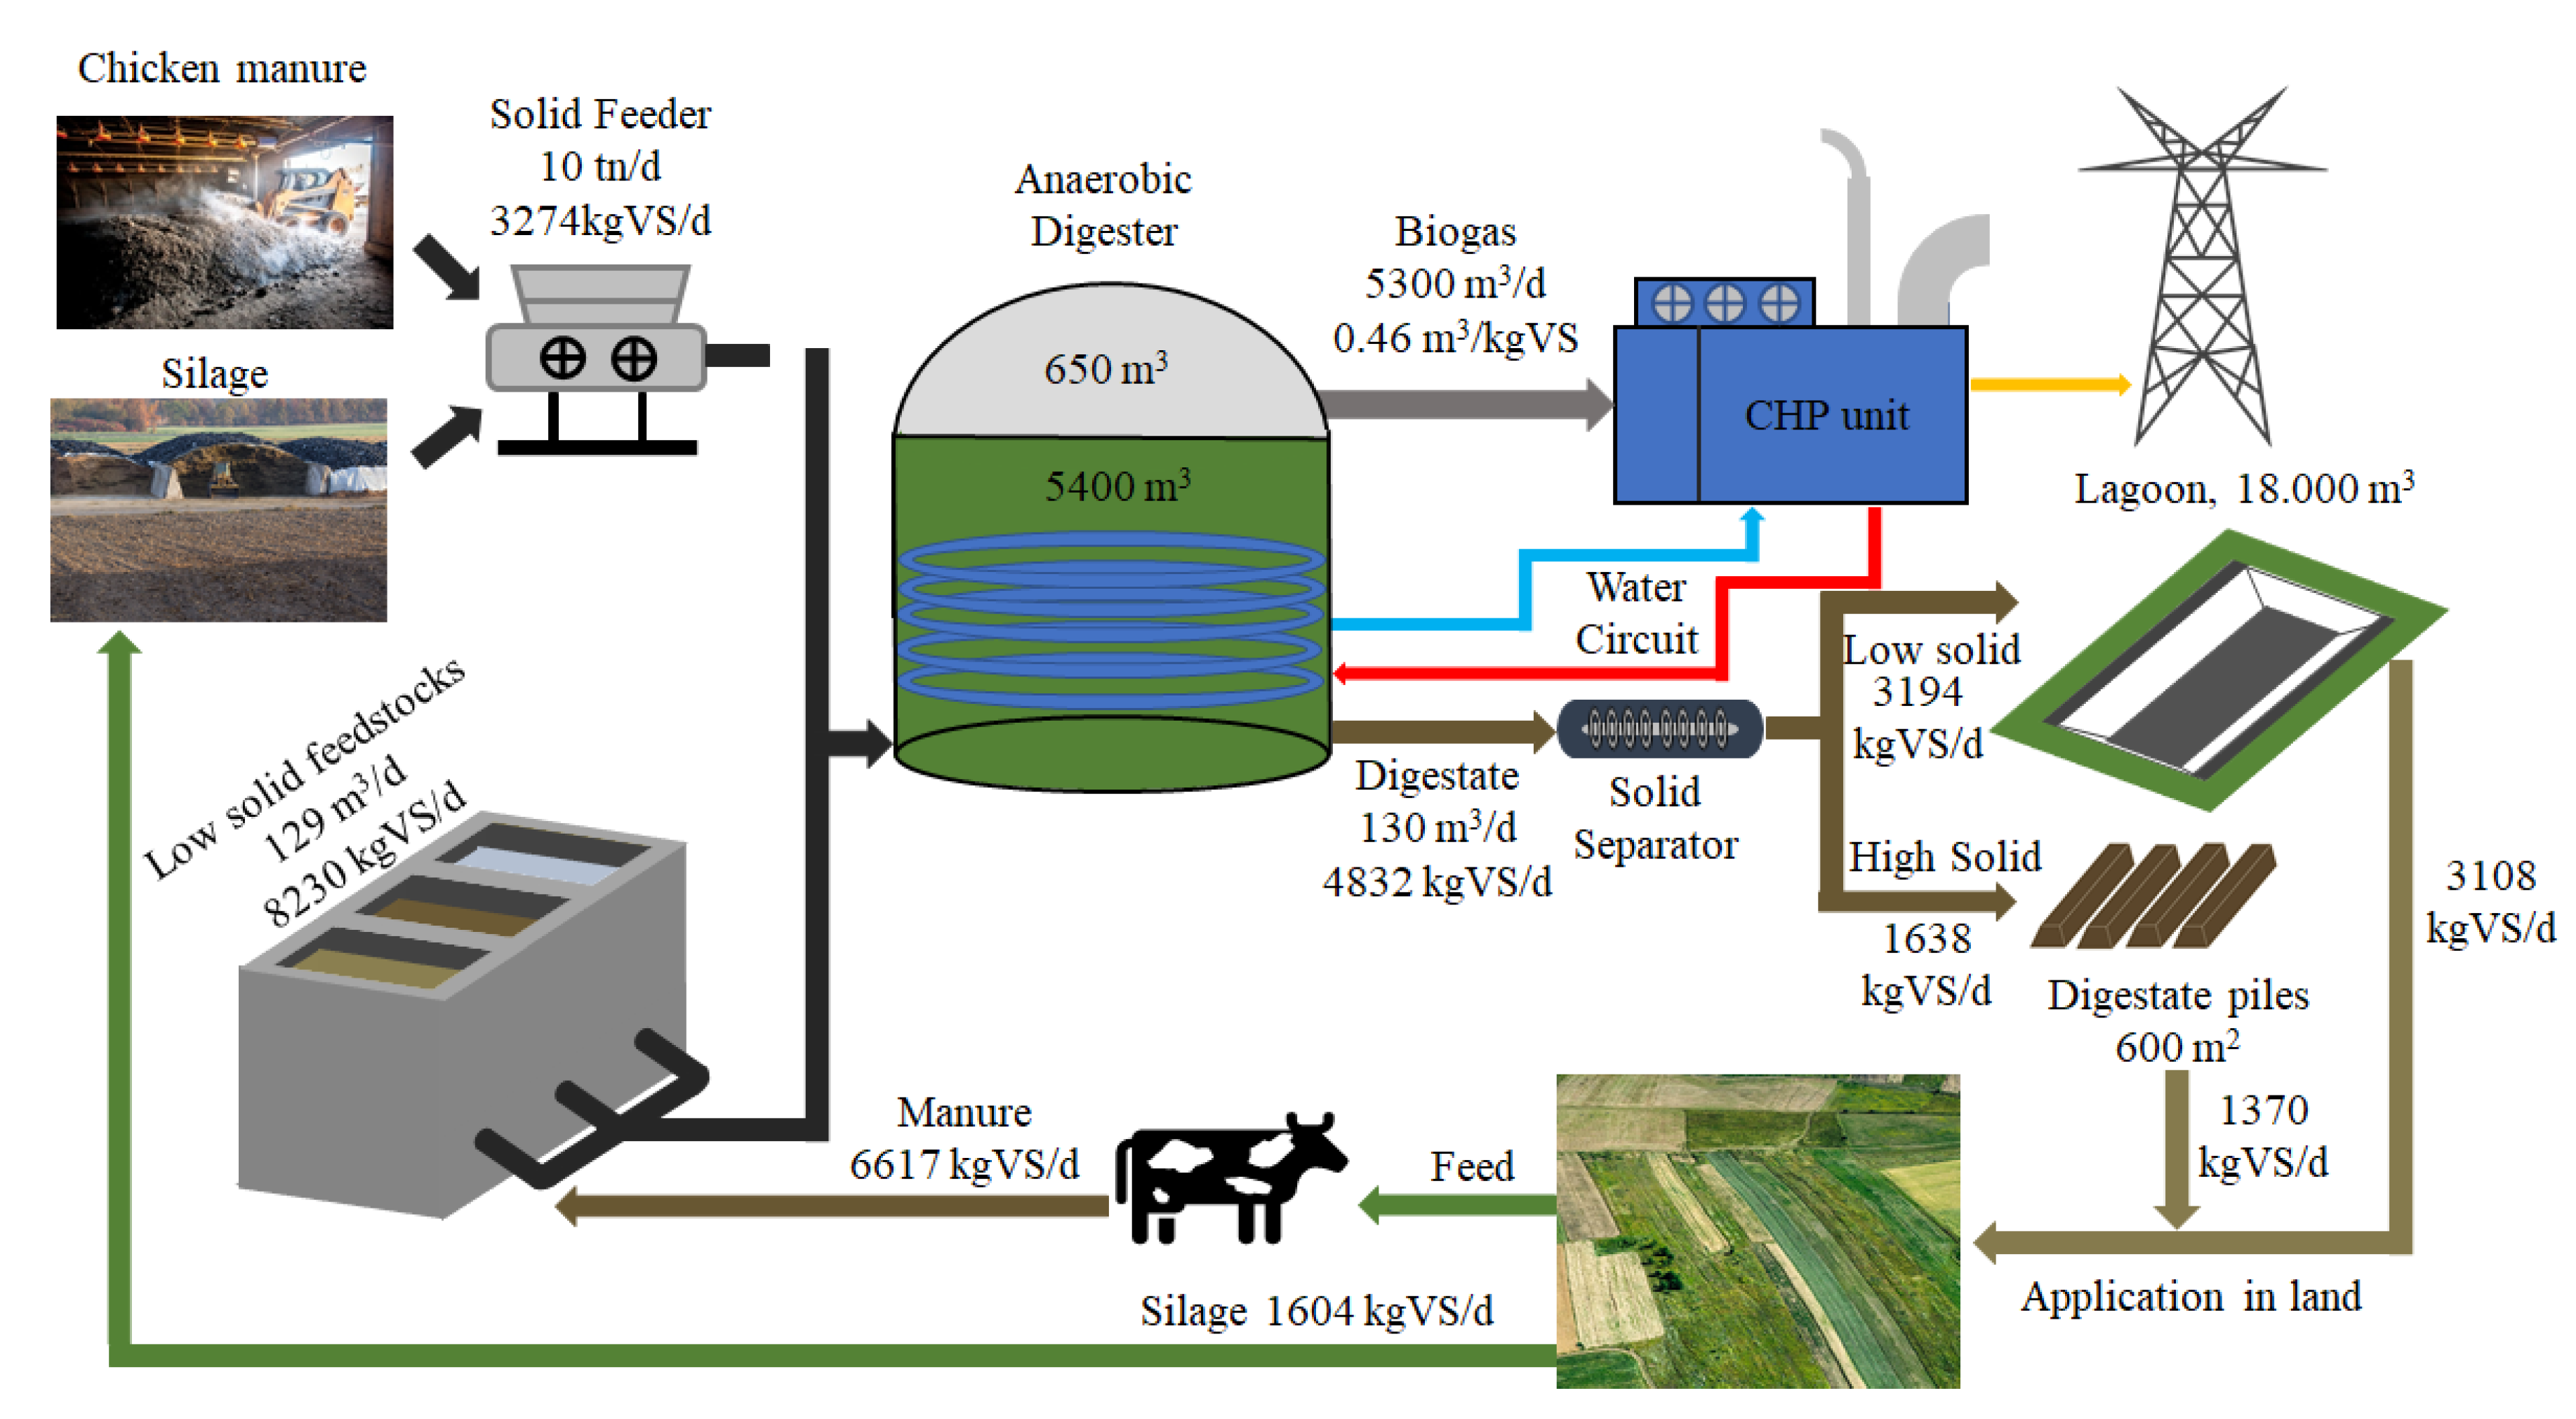
2.1. The Digester’s Design

The full-scale biogas unit is located in the province of Xanthi (Avato), Northern Greece. It consists of an anaerobic continuously stirred tank reactor (CSTR) with a total volume of 6050 m3 (Figure 2). The CSTR is cylindrically shaped and made from concrete. Concrete was preferred to stainless steel [22] since iron-based chemicals (e.g., ferric chloride, ferrous chloride) used for desulfurization may lead to stainless steel corrosion. The AD zone is 5400 m3 with a working volume of 4200 m3. The CSTR is covered with a double membrane roof to store the biogas. The volume of the biogas capturing zone is 650 m3. There is a net of mesh size 10 cm in the headspace to support biological growth of sulfate oxidizing bacteria. A mechanical feeding system was used for the solid feedstocks (10 t day−1), while liquid wastes were fed with a total rate of 129 m3 day−1. The mixing was provided by four submersible propellers (two of them placed 3 m and the other two 5 m above the digester’s bottom) in an automatic on/off mode.
As shown in Figure 2, the effluent digestate was sent to a solid/liquid separation unit (Cri-man SM300/100, Reggio Emilia, Italy). The separator consists of an electromechanical screw that moves and presses the digestate to a screen basket with a mesh size of 1 mm. The solid fraction was stored in an area of 600 m2, while the liquid fraction was sent to the lagoon (18,000 m3). The average daily production rate of the total digestate was 130 m3 day−1.
The biogas plant was fed with a mixture of feedstocks, to sustain a continuous production of biogas, utilized by a combined heat and power unit (CHP, Avus 500 plus, 2G company, Heek, Germany) of 550 kW electrical capacity. Biogas was continuously released from the top of the digester, ending up at the CHP-engine. The electrical energy was provided to the public power grid (Public power corporation S.A.-Hellas) while the thermal energy was used to heat the slurry in the CSTR, through 60 spiral pipes placed perimetrically on the wall of the digester (Figure 2). The CHP is equipped with a radiator to cool down the unit, since not all heat can be recovered via heating the digester. A temperature sensor was placed into the liquid phase of the CSTR (3 m above the bottom). A thermostat adjusted at 39 °C was used to activate the heating of the CSTR.
Moreover, biogas desulfurization was conducted using both in-situ and ex-situ methods. One of the in-situ methods was based on adding iron compounds into the digester. Two compounds were tested for their ability to remove H2S from CSTR’s liquid phase: iron(III) hydroxide (Fe(OH)3) (from 0 to 100th day) and iron(II) chloride (FeCl2) (from 100th onwards). The average loading rates during the monitoring period were 32.1 ± 13.3 kgFe(OH)3 day−1 and 26.5 ± 9 kgFeCl2 day−1, respectively. Another in-situ method was based on the introduction of atmospheric air into the gas phase of the CSTR at low doses to avoid the dilution of the biogas produced. The ex-situ desulfurization strategy for the removal of H2S from the gas phase was based on adsorption using an activated carbon filter (FCA 800 × 1250, Progeco, Castrezzato, Italy).

2.2. Feedstocks’ Characterization

Eight total feedstocks composed the feeding mixture of the CSTR-digester. These were cow manure (CM), chicken manure (ChM), corn silage (CS), wheat/ray silage—triticale (WS), cheese whey (CW), olive mill wastewater (OMW), glycerin (Gl) and molasses (Ml). Six of the feedstocks came from the industrial units from the broader region of Xanthi city. Glycerin came from a full-scale biodiesel plant located 400 km away. Molasses was produced as residual waste from a sugar production plant, located in Thessaloniki city (200 km away from the biogas plant). The feedstocks were collected, transferred at regular time intervals and characterized for total (TS) and volatile solids (VS) and other physicochemical characteristics during the monitored operating period (from 1 April 2018 until 31 March 2019). Table 1 summarizes the key characteristics of each feedstock.

2.3. Digester’s Operation

The CSTR-digester was initially loaded in August 2017 with 20 m3 of biomass slurry (as inoculum). The inoculum was taken from a digester treating cow manure and silage. Thereafter, the CSTR was gradually loaded (70 m3 day−1) with undiluted cow manure up to its operating volume (4200 m3). For eight months (August 2017–March 2018), the digester was fed daily at 110 ± 47 m3 day−1 corresponding to an HRT of 44 ± 16 day, until it achieved a steady-state performance. The OLR and the BPR during this acclimation period were 2 ± 1 kgCOD m−3 day−1 and 4147 ± 1003 m3 day−1, respectively. After the acclimation period, the operation of the CSTR was daily monitored for a whole year (April 2018–March 2019).
The feeding plan was scheduled based on the demand to keep the electricity production rate (EPR) constant at 13,000 kWh day−1 approximately. The daily required methane (CH4) production rate was calculated at 3195 m3 day−1 according to Equation (1).
MPR ( m 3 day ) = EPR ( kWh day ) n × LHV ( kWh m 3 )
where n is the electrical energy efficiency of the CHP unit (0.406), and LHV is the lower heating value of methane (9.971 kWh m−3).
The mixture of the feed was determined by taking into account the availability of the feedstocks, and the HRT was maintained at 30 day. Other factors influencing the decision to add or exclude feedstocks were their costs and CH4 yields, and the requirement to keep the ratio of COD/TKN ratio close to 30. The average quantities of chicken manure, olive mill wastewater, cheese whey, corn and wheat/ray silage were estimated based on the methane yield of each feedstock, as shown in Table 2. It should be noted that Table 2 shows an indicative composition of the feeding mixture when all eight feedstocks were available. The cow manure was added at a rate of 120 t day−1 approximately. Even though its availability was higher, it was decided not to increase the rate; otherwise, the HRT would have become less than 30 day. When the calculated CH4 was lower than the required CH4 production rate (due to a deficiency of a feedstock or due to the cow manure being more diluted than usual), the operator added glycerin and molasses to achieve the daily CH4 production target.
All feedstocks were loaded into the digester as they arrived, without any pre-treatment or dilution. Figure 3 shows the fractional composition of the influent COD in terms of the 8 feedstocks, distinguishing ten different operating phases (Table A1 in Appendix A). Cow and chicken manure were the basis of the daily feeding throughout the year, except for period IX when chicken manure was minimized. Corn silage was replaced with wheat/ray silage (periods II–VI) and vice versa. Cheese whey and olive mill wastewater, the two seasonally produced wastewaters, were interchanged in periods I–III and VII–X respectively. The cost of glycerin was lower, and for this reason, it was the preferred feedstock added to reach the desired OLR, and in cases of deficiency, molasses was used too.

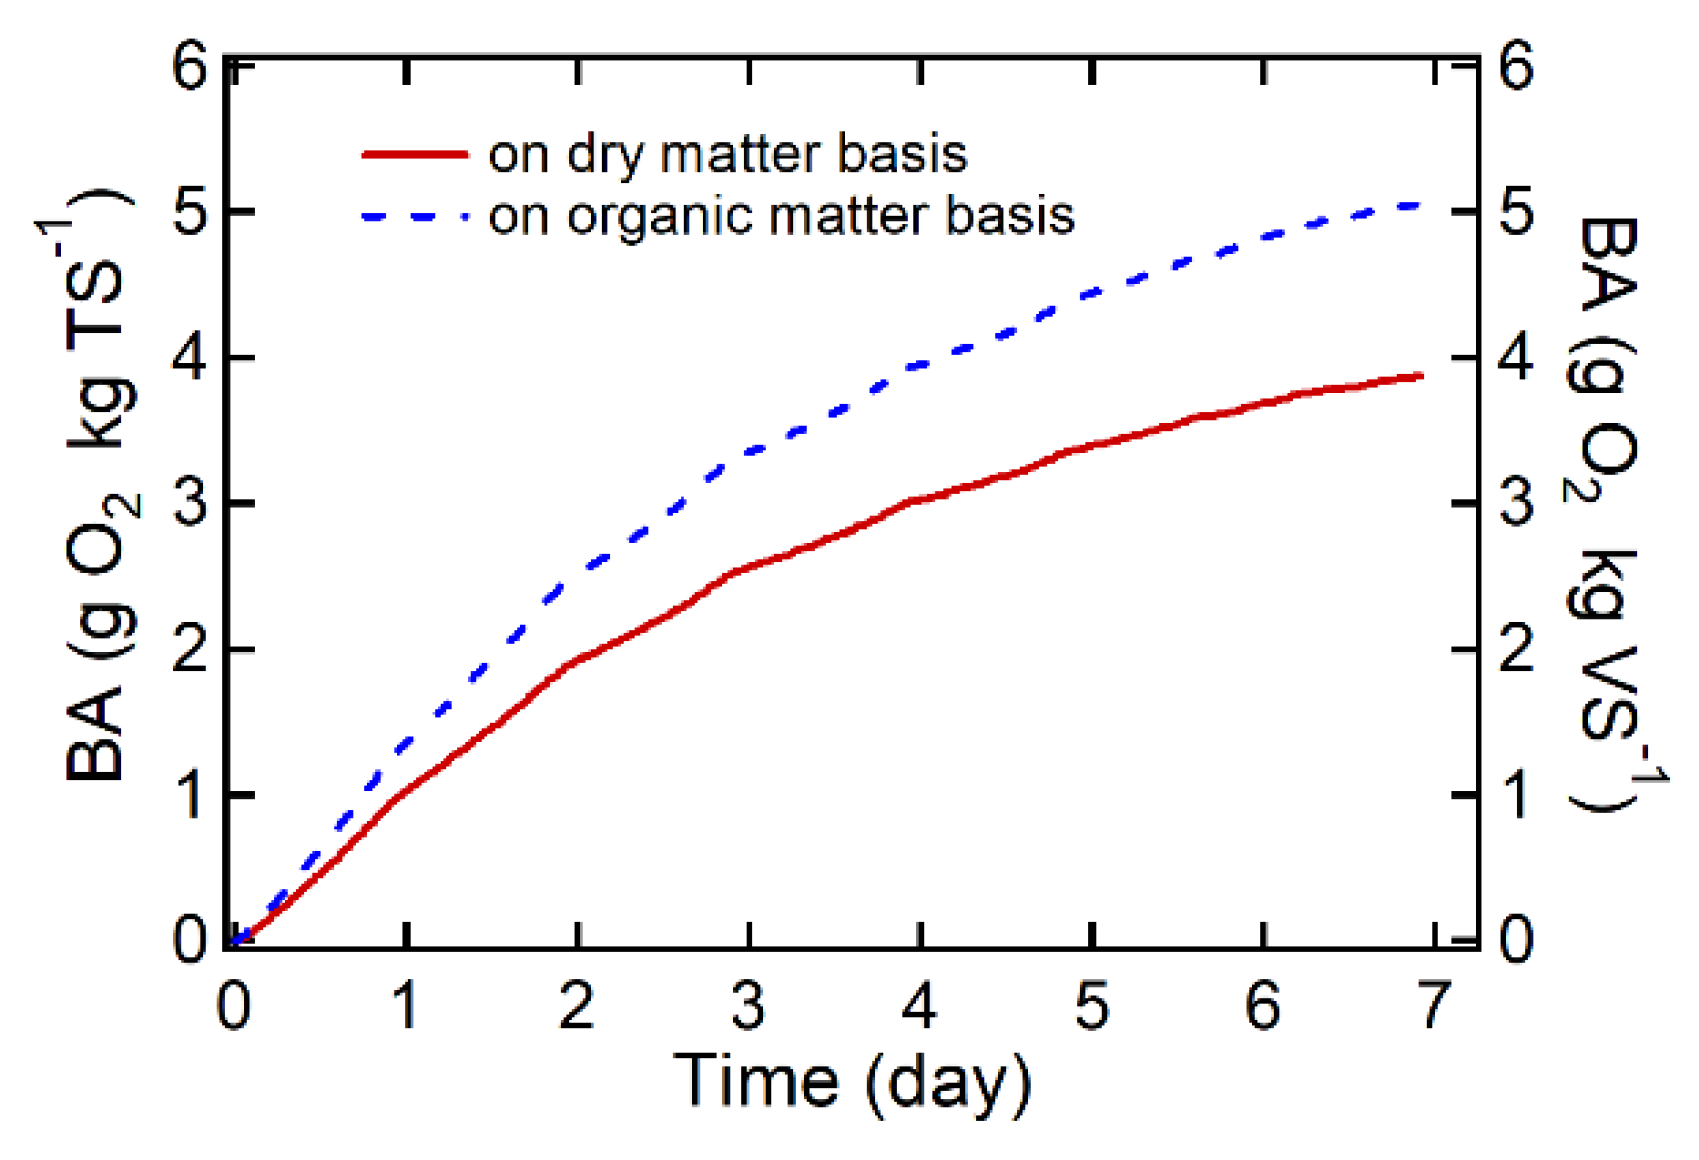
2.4. Assessment of the Digestate’s Stability

Static respiration activity of the digestate was measured using manometric respirometers from WTW (Wissenschaftlich-Technische Werkstätten GmbH & Co. KG, Weilheim, Germany) following the procedure outlined by Komilis and Tziouvaras [23]. Samples of 80 g (wet weight, humidity 82%) were placed into respirometer vessels (2.5 L). The TS and VS were 160.3 g kgww−1 and 130.3 g kgww−1, respectively. In total, 50 mL NaOH 1N contained in the special small beaker was placed in each respirometer to absorb the CO2 produced. Respirometers were placed in an incubator which was thermostatically controlled to maintain 20 ± 1 °C and incubated over 7 days. Oxygen consumption was determined based on the reduction in pressure that was recorded according to the principles of the ideal gas law. The static respiration activity is expressed as g O2 consumed per kg dry matter.

2.5. Analytical Methods

Chemical analysis of all the collected samples was conducted in duplicate at the Laboratory of Wastewater Management and Treatment Technologies of the Department of Environmental Engineering at Democritus University of Thrace (DUTH, Xanthi, Greece). Total chemical oxygen demand (COD), TS, VS, NH3-N and total Kjeldahl nitrogen (TKN) were determined according to standard methods [24]. The pH was measured with a pH meter (HANNA, HΙ 83141, Hanna instruments Hellas, Athens, Greece), and the electrical conductivity (EC) with an EC meter (CRISON, CM35, Crison instruments S.A., Barcelona, Spain). The volatile fatty acids’ (VFAs) concentrations were measured using a gas chromatograph with a capillary FFAP column (length 30 m, diameter 0.32 mm, thickness 0.25 μm) and a flame ionization detector [25]. The ratio of volatile organic acids to total inorganic carbon (FOS/TAC), was determined titrimetrically using a solution of H2SO4 0.1N.
The biogas production was recorded daily by a gas measuring unit (FV4000, ABB, Zürich, Switzerland, 2G company, Heek, Germany). The CH4, carbon dioxide (CO2), oxygen (O2) and H2S contents of biogas were also determined (Awiflex, Awite, Germany). The daily biogas production was standardized to normal conditions (0 °C and 1 atm). All sensors were connected to a data logger unit and interfaced with a computer for automatic recording of data processed by specialized software (Scada system, Powertronik, Ptolemaida, Greece).
The stability of the plant was evaluated by monitoring biogas production rate and its composition, and more parameters determined in the frequently collected samples (once per week) from the digester. These parameters were the pH, EC, NH3-N, VFAs, TS, VS and the ratio FOS/TAC. The feedstocks were also measured on a regular basis (at least once a month), especially whenever a feedstock of a new origin arrived in the plant; the typical parameters were TS, VS, COD, TKN and occasionally pH, EC and VFAs. Sampling of the digestate in the storing areas took place twice and TS and VS were measured. The parameters measured or estimated during each operational phase were expressed based on their average values, their standard deviations and their 95% confidence intervals (CIs). The CI of the mean was computed as follows (Equation (2)):
CI = Y ¯ ± t 0.05 , n 1 × SD n
where t 0.05 ,   n 1 is the value of the Student’s t distribution for 95% confidence of the mean, n is the number of the experimental data, SD is the standard deviation and n−1 the degrees of freedom.

3. Results and Discussion

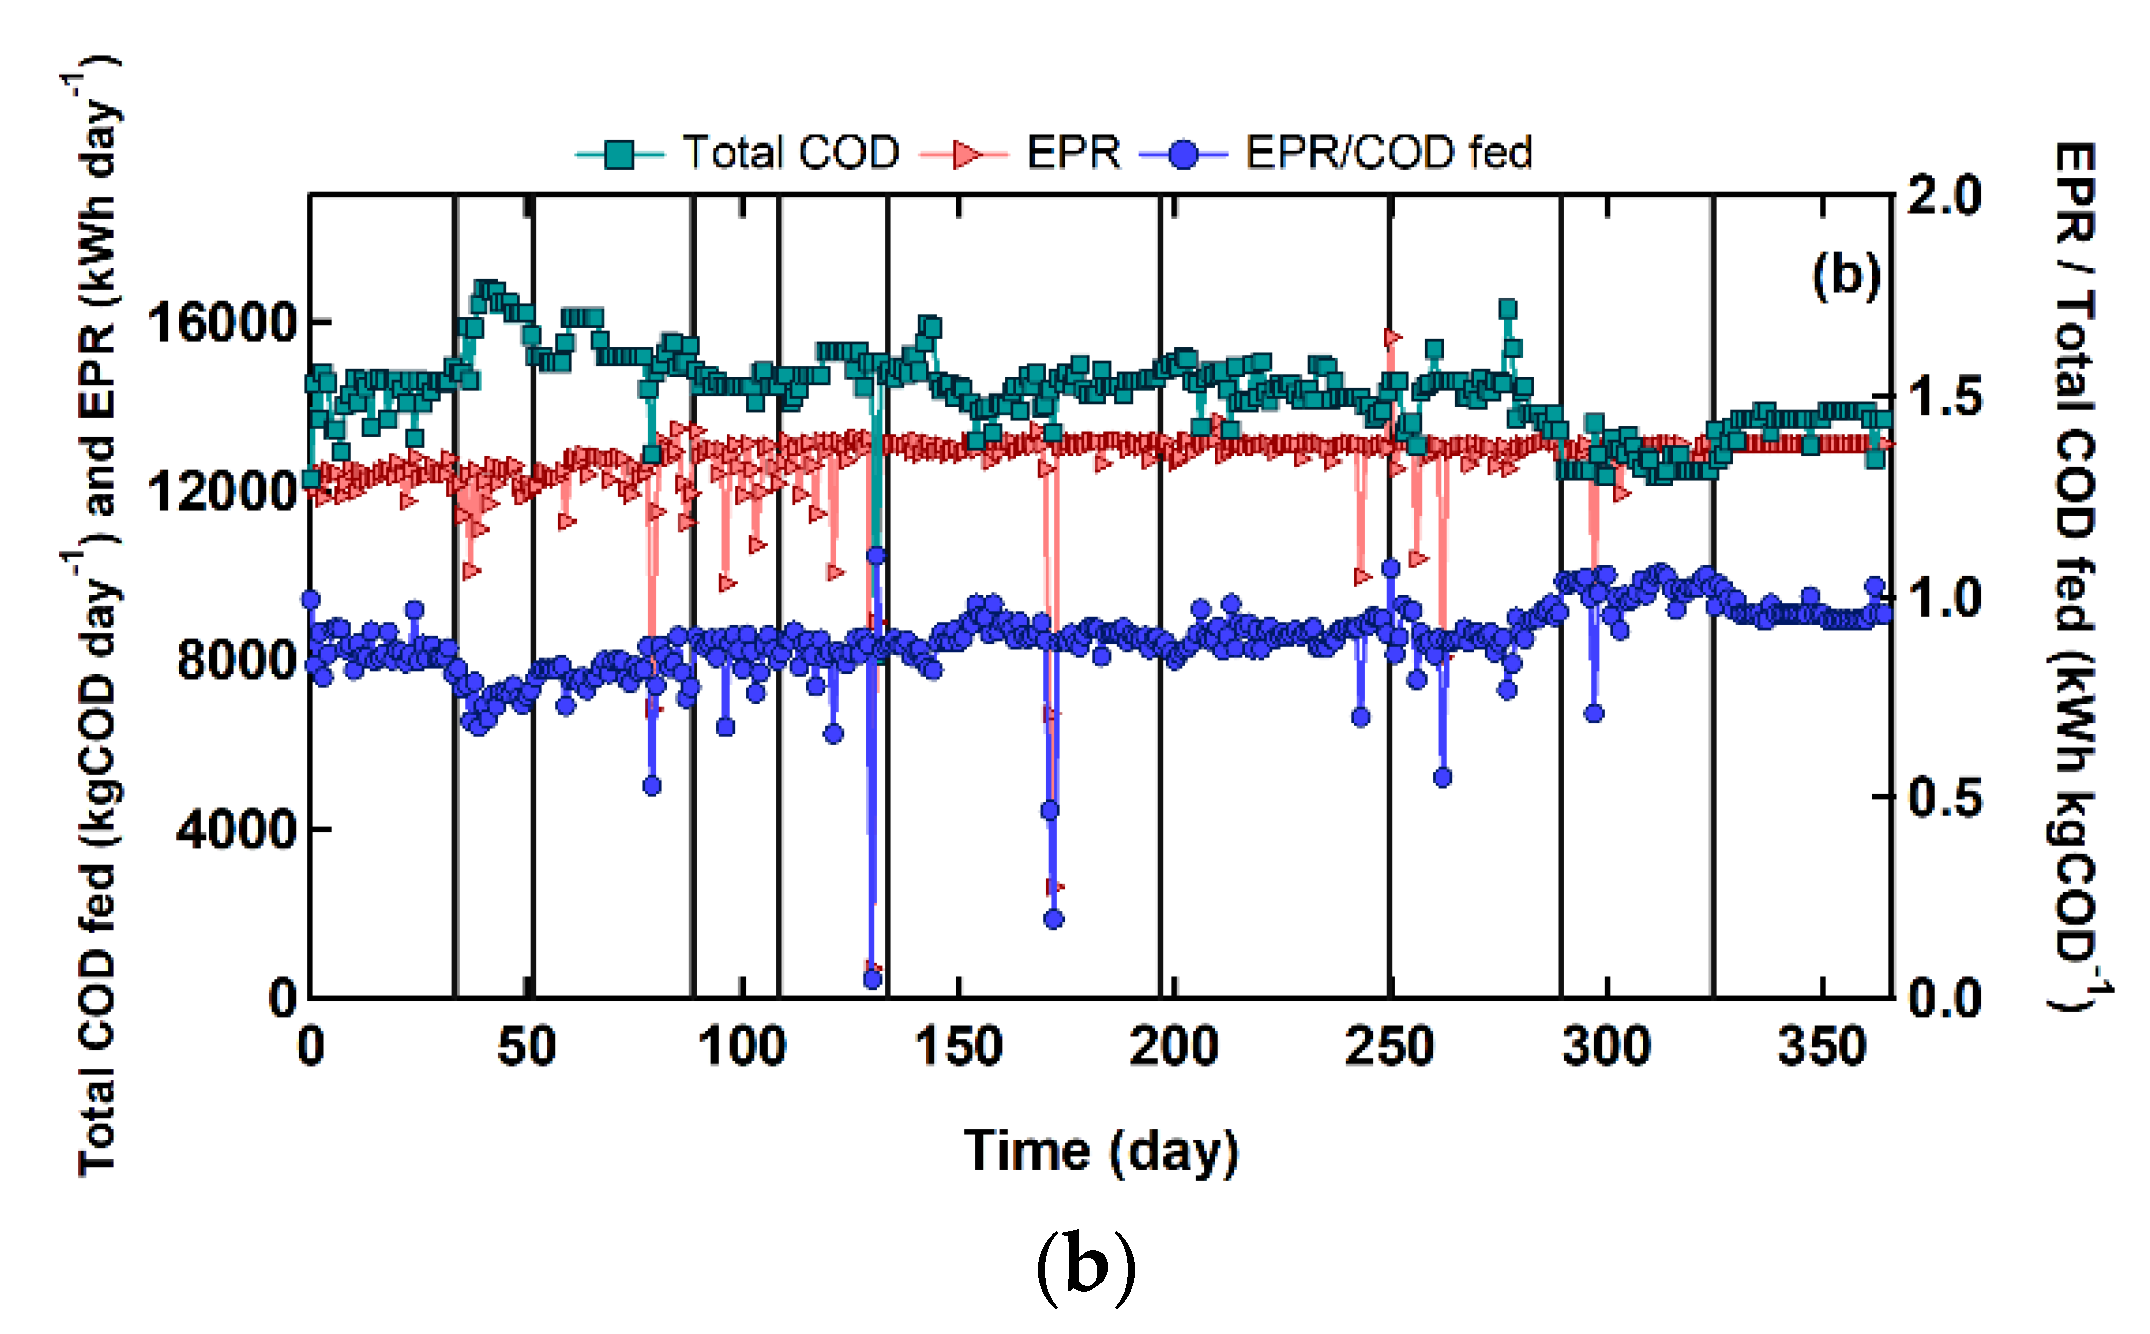
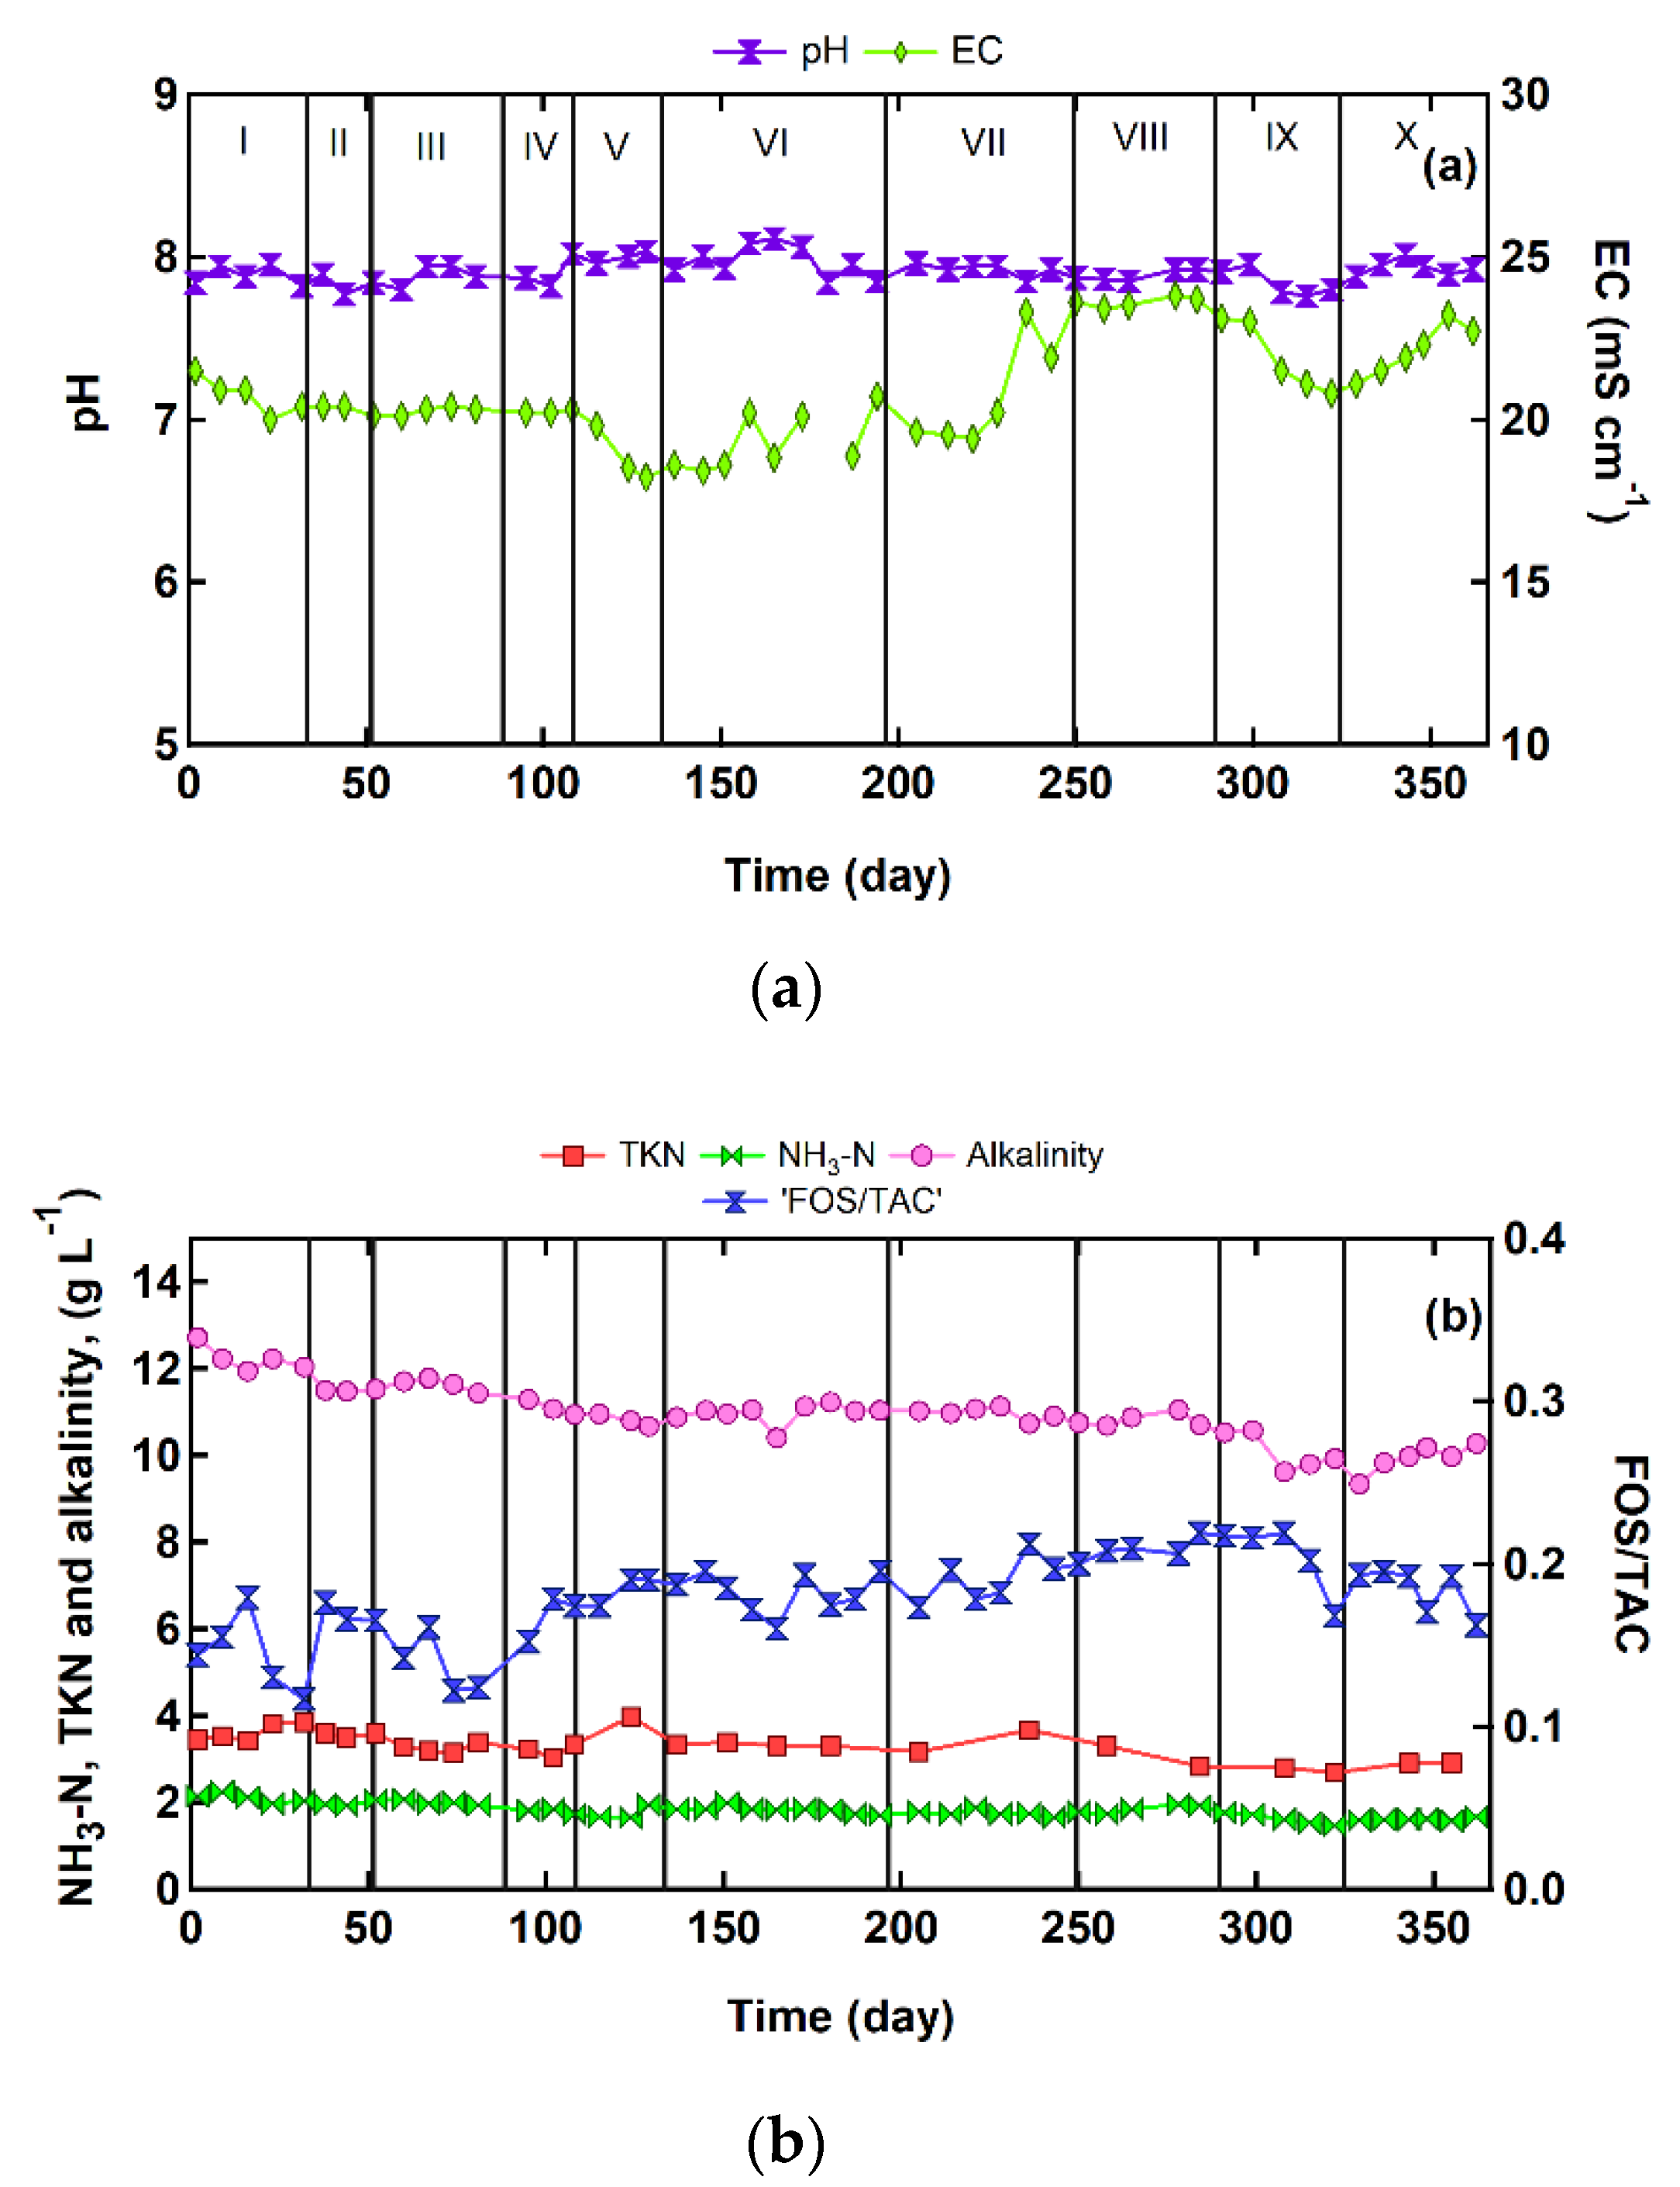
3.1. Full-Scale Digester’s Performance

The biogas plant of the case study consisted of one continuous type digester, which is the most common type (90%) in the industrial-scale plants operating in Europe [26]. The digester was closely monitored for one year, while the feeding scheme changed 10 times by combing eight feedstocks (Table A1). It should be mentioned that during all feeding phases, the main component of the feeding mixture was cow manure (total average fraction 46 ± 4%) which was co-digested with various kinds of waste, originated from agricultural, food-processing and biodiesel production industries. It is well known that the mono-fermentation of manure results in low biogas yields (BY). On the other hand, the high buffering capacity and the high content of manure in trace elements are related to the stability of the AD process [27]. For these reasons, there was no need to control the pH, nor supplement the digester with trace metals.
Figure 4a schematically illustrates the small variation of the OLR (3.42 ± 0.23 kgCOD m−3 day−1 with narrow 95% CI 3.39–3.44) which was followed by a slightly variable BPR (5327 ± 484 m3 day−1, 95% CI 5277–5376). The specific BPR was 1.27 ± 0.12 m3 m−3 day−1 and BY was 0.46 ± 0.05 m3 kg−1 VS, with a CH4 content of 55.1 ± 1.3% (95% CI 54.9–55.2). The CH4 production rate recorded was 2972 ± 121 m3 day−1, which was 12.2% lower than the one targeted (3195 m3 day−1, see Table 2). This was anticipated, since the CH4 production in the biochemical methane potential (BMP) tests was the maximum possible in ideal experimental conditions as compared to the continuous operation digesters [19]. The electrical energy produced was correlated with the COD introduced in the digester (Figure 4b). The production rate of electricity was relatively constant (12,687 ± 1140 kWh day−1; 95% CI, 12,569–12,804) throughout the year, except for some cases of the CHP unit’s maintenance when the electrical output was minimized. Initially (particularly in phases II and III), the ratio of electrical energy to kilogram of COD fed was lower than at the end of the monitoring period (phases IX and X). In those phases, cheese whey and olive mill wastewater were introduced into the digester respectively (Figure 3). Cheese whey, consisting mostly of carbohydrates, yields less energy than olive mill wastewater. Moreover, the substrates fed in the previous phases had an impact, since the yield monitored at a specific time was the result of the slow dynamics of the process and the high retention time (30 day). From this aspect, starting to feed with cheese whey from phase I and with olive mill wastewater from phase VI and VII, may have affected the response of the digesters in terms of yield in the subsequent phases.
pH and EC values during the whole operation of the plant are shown in Figure 5a. The pH value was 7.91 ± 0.08 (95% CI, 7.89–7.93). On the other hand, EC was found to decrease during phase V (absence of cheese whey feeding) and subsequently increased during the phases VI and VII (addition of olive mill wastewater); it decreased again during phase IX (decrease of chicken manure), and increased during phase X (addition of chicken manure). These wastes have high EC [28], and by being introduced into the digester, they resulted in an increase of the EC of the digester. The changes in the EC of the digester follow the changes in the composition of the feeding mixture and may appear much later, depending on the speed of the kinetics and the hydraulic retention time.
The concentration profiles of NH3-N, TKN, alkalinity and FOS/TAC versus time, are depicted in Figure 5b. NH3-N concentrations were slightly decreased during the whole monitored period, which was accompanied by a decrease in alkalinity. Both parameters were positively correlated in a linear form (alkalinity (g CaCO3 L−1) = 0.0035 NH3-N (mg L−1) + 4.5116, correlation coefficient R2 = 0.7462), indicating the NH3-N released via the digestion of the various feedstocks had a direct impact on the alkalinity levels. The manures (which were the main source of TKN entered the digester) were fed to the digester at similar levels, with a slight increase up to phase VIII, but afterwards, they were reduced steeply. Other sources of TKN (wheat/ray, cheese whey and molasses) were fed mostly in the initial phases (Figure 3) followed by less N-containing feedstocks, such as corn silage, glycerol and olive mill wastewater. The contributions of these feedstocks determined the decreasing tendency of the TKN entering, and therefore, the NH3-N release in the digester.
The NH3-N concentration remained below 2 g/L throughout the whole monitoring period and the concentrations of VFAs (acetic-acid, propionic-acid, isobutyric-acid, butyric-acid) were far below the limiting values (e.g., <0.05 g/L for acetic acid), demonstrating the high stability of the process. The stable performance of the biogas plant was also reflected through the FOS/TAC index (0.18 ± 0.03, 95% CI 0.17–0.19), which was below the limiting value range of 0.2–0.3 [9,29]. Finally, it should be mentioned that TS and VS concentrations were almost constant in the ranges of 50–53 gTS L−1 (95% CI) and 36–38 gVS L−1 (95% CI), with average values (± standard deviation) of 52 ± 4 gTS L−1 and 37 ± 3 gVS L−1, respectively.

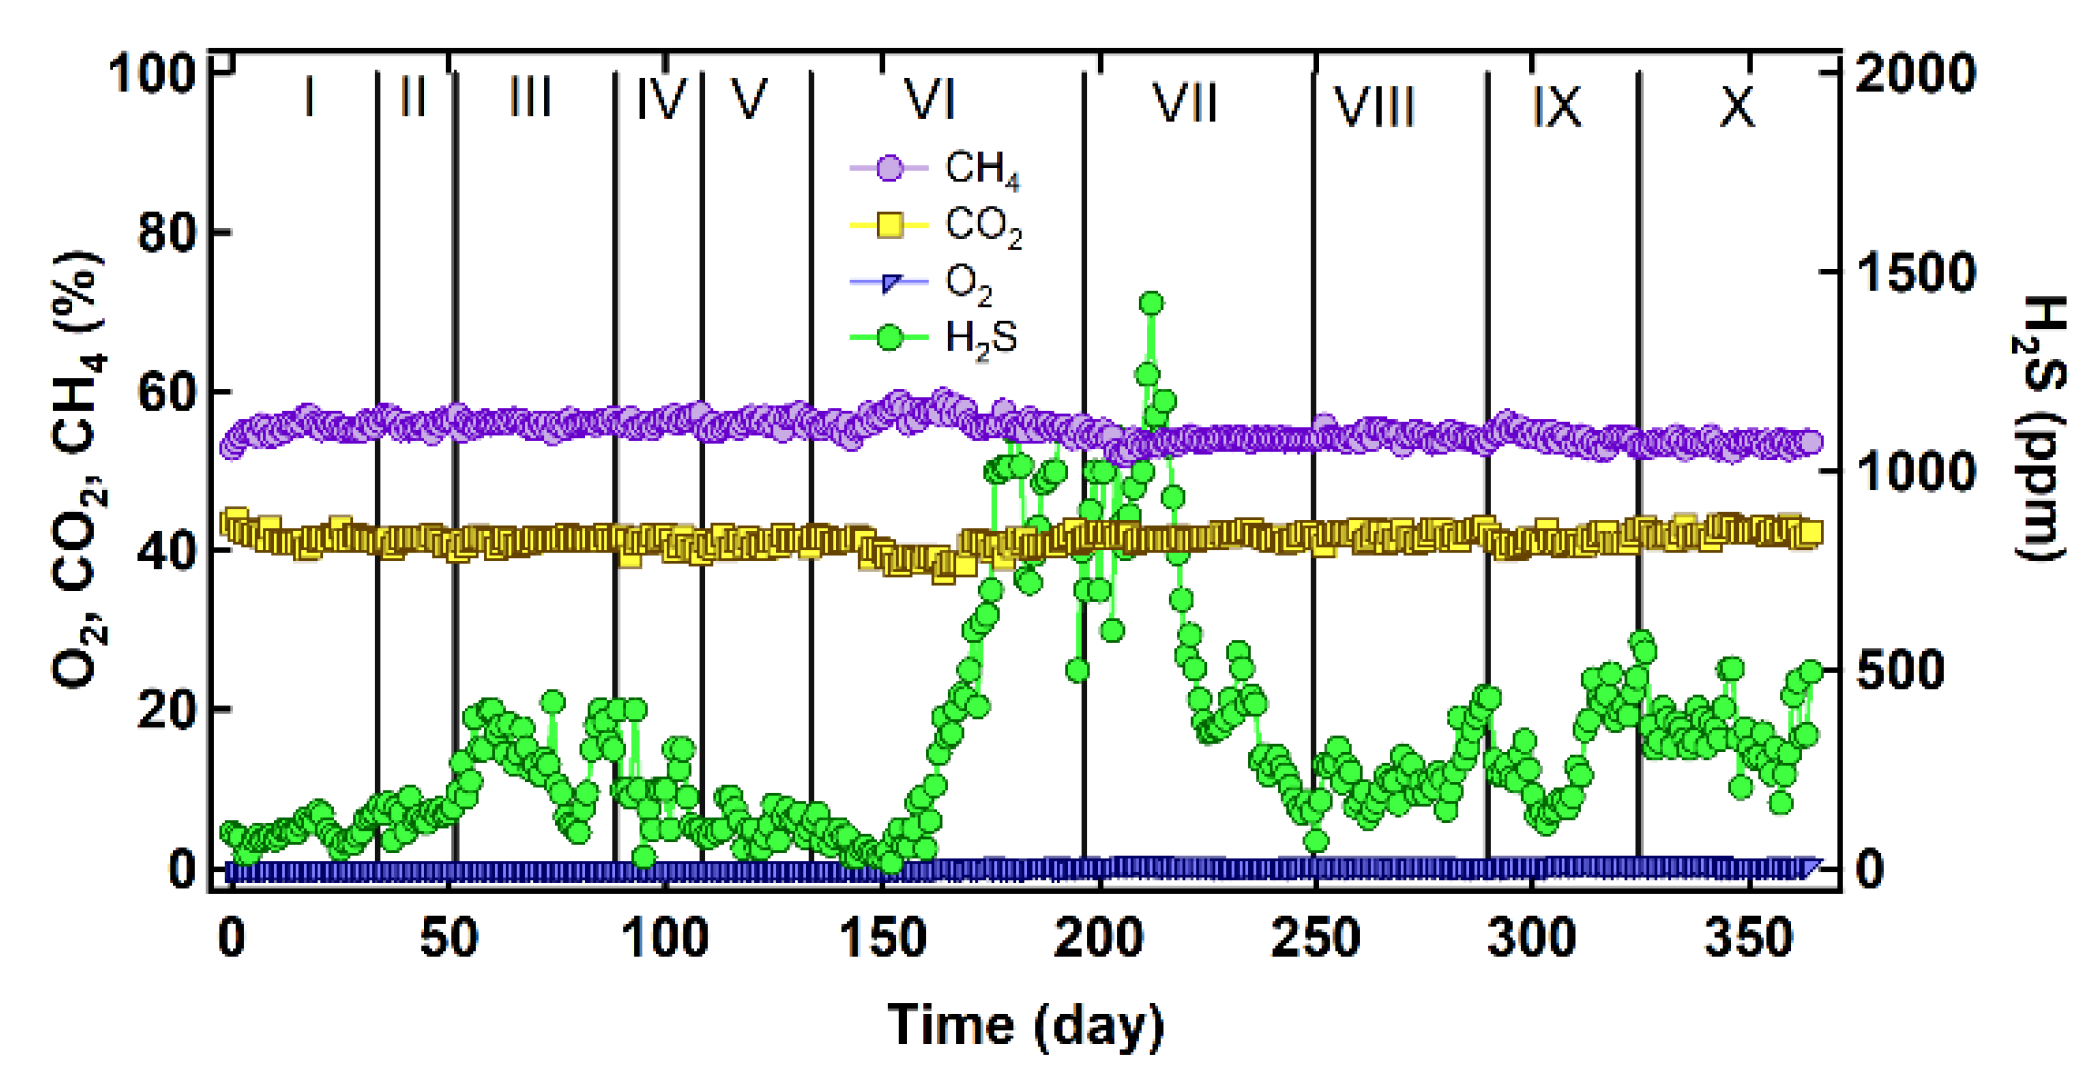
3.2. Desulfurization

H2S is a typical component of the biogas that comes from inorganic sulfate, present in feedstocks, through the action of sulfate reducing bacteria which compete with the methanogenic archaea for the intermediate carbon source [25,30]. H2S is a highly toxic, odorous and corrosive gas that inhibits the biogas formation process [26]. Furthermore, during biogas combustion, H2S is mainly converted to SO2 and further to H2SO4 [31], which is responsible for the acidification of the engine’s oil, deposits and harmful gas emissions during combustion [32], and shortens the operating life of the CHP-engine. As a result, desulfurization of biogas for concentrations of H2S higher than 1000 ppm is recommended. On the other hand, removing sulfur into the digestate is beneficial, since digestate rich in sulfate is considered a valuable fertilizer [13].
The feedstocks used in this study contained sulfur; according to Thompson and He [33], crude glycerol from different seed oil biomass and waste cooking oils contain sulfur in concentrations from 14 to 128 ppm; the sulfur content of cow manure is considerable at 0.7–0.8 g kg−1 [32]; the chicken manure contained an even higher sulfur concentration (0.5–1% on a dry matter basis or 2.8–3.2 g kg−1) [32,34]. On the other hand, OMW was not expected to contribute into sulfur production much, since it is the lowest element contained in this waste (0.16% of total weight) [35].
Therefore, proper desulfurization strategies were set up, combining chemical precipitation with iron(III) hydroxide (Fe(OH)3) and iron(II) chloride (FeCl2) into the digester, aerobic oxidation of H2S in the digester and filtration through an activated carbon filter outside the digester (see Section 2.1). Each method has advantages and limitations and was applied up to a certain extent. The removal of the largest part of H2S was carried out through chemical precipitation, which was simple (a dosing pump was required for introducing the iron chloride, while iron hydroxide was mixed with the silage during feeding), efficient and cheap compared to filtration with activated carbon, while holding the sulfur in the digestate as iron sulfide (FeS). However, excessive use of chemicals is required to keep H2S down to the required levels (20–100 ppm) and this was avoided through air injection in the gas to promote aerobic oxidation of H2S. Air addition though, was minimal to keep the air level low inside the digester. In this way, the deterioration of the biogas content was avoided; besides biogas dilution, the nitrogen from air makes upgrading biogas to biomethane difficult, since it cannot be removed easily [36]. Finally, the activated carbon filter (ex-situ) was meant to be used for refining the biogas to a range of 1–5 ppm.
Figure 6 shows the biogas composition as a result of all the in-situ desulfurization strategies (iron compounds, air injection) performed. It was observed that CH4 and CO2 remained almost constant. Initially, Fe(OH)3 was added at an average rate of 29.7 ± 15.3 kg day−1. During phase II, the Fe(OH)3 dosage was decreased from 30.6 to 20.2 kg day−1 due to deficiency of Fe(OH)3. This resulted in a rise of H2S up to 400 ppm, which was eliminated by restoring the Fe(OH)3 dosage again in phase III (to 30.6 kg day−1). The ferrous compound changed on the 100th day until the end of the monitoring period and was added at an average loading rate of 24.6 ± 10.5 kg day−1. The reason for this change was the lower cost of FeCl2. It was expected that this change would also benefit the sulfur removal, since Fe(OH)3 is considered relatively unstable [13]. Moreover, ferrous iron seems to react faster than ferric iron, since ferric iron first must undergo a reduction to ferrous iron before sulfide precipitation occurs [37]. However, on day 149, due to technical problems (malfunction of the dosing pump), the FeCl2 was not sufficient (decreased to 12.7 ± 3.5 kg day−1), resulting in the H2S increase from 30 up to 1422 ppm until day 212. On day 213 the FeCl2 concentration was restored and the system responded directly by reducing the H2S, although its concentration varied as a result of the frequent short-term deficiencies of the ferrous agent (Figure 6).

3.3. Recycling Digestate

Biogas production through AD of manure, slurries and other bio-convertible organic wastes, is accompanied by the production of digestate known for its fertilizing and soil conditioning properties [38]. Approximately 130 m3 day−1 or 0.031 m3 m−3 day−1 of fresh digestate was discharged from the full-scale CSTR. The digestate was separated into two fractions, one of low and the other of high solid content. The low solid fraction of the digestate (liquid digestate) was stored in the lagoon area at an HRT of 160 day. Typical characteristics of the digestate in the lagoon were: pH = 7.49 ± 0.04, conductivity = 21.75 ± 0.35 mS cm−1 at 25 °C, TS = 41.7 ± 0.2 g L−1, VS = 25.9 ± 0.4 g L−1 and NH3-N = 1691 ± 16 mg L−1. The VS removed from the lagoon were slightly less prevalent than the VS entered (2.7% lower; see Figure 2), meaning that it had been already stabilized before its disposal to the lagoon. Therefore, the gas emissions (GHG) are anticipated to be low from this stage. No water leakage was detected since the lagoon bottom was properly layered with a geomembrane liner, made of high-density polyethylene (HDPE) with 2.5 mm thickness. The liquid digestate was pumped from the lagoon via a pipeline net by the local farmers (within a 4 km radius) who applied this as a fertilizer to their crops (corn, wheat/ray, sorghum, sunflower and cotton in a 100 hectare cultivated area). They observed an improvement in the yield while saving money from the reduced amounts of fertilizers. For example, a farmer cultivating corn in a 100,000 m2 field irrigated 75 m3 of digestate per 1000 m2 of land during the cultivation period and observed a production yield of 6500 kg per 1000 m2 (instead of 5900 kg per 1000 m2), while he used 70 kg per 1000 m2 of commercial fertilizer (instead of 90 per 1000 m2) at a 6.25 €/kg, which increased the total profit from 156.2 to 190.2 € per 1000 m2.
The high solid fraction of the digestate (solid digestate) was sent for further stabilization (maturing) for 60 d to a 600 m2 area at a rate of 10 m3 day−1. The VS reduction during the maturing stage was estimated to be 16% (Figure 2). For this estimation it was assumed that the processes were similar to what occurs during composting in a static pile. Ahn et al. [39] estimated that 1.6 kg of GHG are released per kg VS degraded during composting of manure in a static pile. Based on this result, the GHG emissions were approximately 430 kg CO2-eq day−1. Given that the CH4 production of 2972 ± 121 m3 day−1 from the digester is equivalent to 2.123 metric tonnes per day, and that the CO2 equivalent of CH4 is 25:1, the CH4 produced and consumed in the CHP unit is equivalent to 53.1 t CO2-eq day−1. Therefore, the GHG emissions from the digestate stored in the pile are 0.81% of the CH4 consumed. This is near the lower limit of the range observed by Liebetrau et al. [40], who found the main CH4 emission source in the biogas plants to be the open storage of digestates ranging from 0.22 to 11.2% of the CH4 utilized. However, more regular monitoring of the storage would give a more accurate assessment of the GHG emissions, which is anticipated to vary along with the climatic conditions, etc.
The stability of the solid digestate was assessed by quantifying the microbial respiration through static respiration tests lasting for 7 days (Figure 7). The values of O2 consumption, as calculated on the 4th day and the 7th day, were 3.03 and 3.87 g O2 kgTS−1, respectively. This agrees with the recommendation of the EU for the stability of compost products, which suggests that the O2 consumption in static respirometric tests should be less than 10 g kg−1 dry matter after four days [41]. Moreover, the oxygen uptake rate (OUR) was calculated from the slope of the curve of cumulative O2 consumption on an organic matter basis (g O2 kgVS−1). OUR did not exceed 0.055 g O2 kgVS−1 h−1 (1.72 mmol O2 kgVS−1 h−1) during the first days of microbial degradation activity. Thereafter, OUR decreased to 0.031 g O2 kgVS−1 h−1 (0.95 mmol O2 kg VS−1 h−1) between the 4th and 7th days. This is far less than the upper limit of 0.4 g O2 kgVS−1 h−1 (static respiration index; SRI) which was used by Komilis and Tziouvaras [23] to characterize their samples as stable. Therefore, the solid digestate obtained in this study is stable and can be used for cultivation, considering that neither its respiration activity nor its SRI exceeded the permitted limits. Indeed, the solid digestate was spread into a 450,000-m2 area approximately, where corn, wheat/ray and sunflower were the main crops. Most of these fields are located near the biogas plant, less than 10 km away.
The stability of the solid digestate ensures that the CH4 emissions will be minimal. However, the accumulation of metal elements such as Cu, Zn and Mn in soils as a result of continuous applications of anaerobic digestate may deteriorate the soil’s structure and properties. Moreover, some NH3 and nitrous oxide emissions are anticipated from the liquid fraction of digestate due to its elevated pH and NH3 levels (pH = 7.49, NH3-N = 1691 mg L−1 [42]). It is true that the main focus of the biogas sector is the maximization of the revenue and the benefits for all stakeholders, often ignoring the long-term effects of this activity on the environment. This is why studies of life cycle analysis are crucial to demonstrate the weaknesses of this circular scheme which would strengthen the sustainability along all the way.

3.4. Economic Considerations

The economic viability of a biogas plant relies on reducing the operational cost, maximizing the profits from exploiting all generated forms of energy and materials and maintaining the stability of the process. The investment cost of the 500 W biogas plant was estimated to be 2500 k€ with a payback period of 6 years. The operation costs are about 600 k € annually and are influenced by several factors, such as the self-consumption energy and the raw materials’ cost of purchase. The average self-consumption in terms of the produced electricity was estimated to be 12.36 ± 2.31%. CHP seems to be the most energy-intensive unit of the plant, since it requires about 30 kW, which corresponds to a consumption of 6–7% of the electricity produced. The CHP’s electricity consumption also includes the energy required for the engine radiator. Since only a proportion of the produced heat is needed for the digester heating, the warm liquid of the engine circuit is cooled down using a radiator with a power requirement of 15 kW on average. This means that if there was a provision for supplying the surplus heat in a district heating network, the self-consumption would be lower, and extra profit could be obtained from supplying thermal energy. Agitation of the fermenter is also an energy demanding process, resulting in a consumption of 15–20 kW approximately. Other pieces of equipment that require less energy are pumps, pneumatic hardware, mechanical separators for digestate, air blowers, etc.
Regarding maximization of the profit in a biogas plant, minimization of the raw materials’ (feedstocks) cost is a prerequisite. The procurement for each feedstock (€ t1) includes the purchase and the transport cost. The transport cost is determined by the distance between the biogas plant and the source of the selected feedstock. The main feedstock (cow manure) was near the plant (7 km). Since the truck used is capable of transferring 18 t each time approximately, the daily distance required for feeding one t of cow manure was calculated to be 0.778 km t−1 day−1. Cow manure transportation required the shortest distance per tonne per day, followed by the transfer of silages (Table 3). On the contrary, other by-products like glycerin and molasses were brought from further away but, still, their usage was profitable due to their high organic content (Table 1). The long distance is positively correlated with greenhouse emissions too; however, the two feedstocks contributing more to the greenhouse emissions due to the long distance of their transfer (glycerin and molasses) were used only supplementarily. In this case, the criterion of the profitability increase also secures the decrease of the environmental footprint related to the transfers.
Based on the biochemical methane potential of each feedstock, the CH4 yield per t of feedstock (wet weight, WW) was calculated. The electrical and the thermal energy efficiencies of the CHP unit were 40.6% and 43.4% respectively, providing a total efficiency of 84.0%. This was used to calculate the electrical energy yield of each feedstock. The profit per kWh resulted from the subtraction of the cost from the revenue (0.225 € kWh−1) (Table 4). Chicken manure seems to be the most profitable feedstock, especially compared to the most common feedstocks such as cow manure and corn silage. However, using chicken manure in mono-digestion will result in a high NH3 concentration and probably in process failure [43]. Olive mill wastewater and cheese whey also have good profit margins, but they are available only for a few months during the year. When a feedstock was needed to reach the required organic loading rate, glycerin was preferred over molasses due to its higher profit.
The biogas plant performance for over year demonstrates a successful business case, which is beneficial not only to the owners but also to the farmers who take advantage of the fertilizing properties of the digestate without any economic cost, and the livestock owners of the proximity who have adopted a safe and free of charge way to dispose of their wastes. Compared with literature reports on the efficiency of full-scale plants (Table 5), the digester was operated in typical conditions, that is, at an HRT of 29.4 ± 2.1 (95% CI 29.2–29.6), in mesophilic conditions. The pretreatment of feedstocks, aiming to increase the biogas yield, has been extensively studied [44], but inevitably raises the operational cost which should be counterbalanced by the increase in revenue [16,45]. Moreover, the environmental impacts associated with the pretreatment methods should also be considered [46]. In this work, the biogas yield (0.46 m3 kg−1 VS) achieved in this study was high compared to the other full-scale AD plants, with a high CH4 content (55 ± 1.3%), without any pretreatment applied (Table 5). Co-digestion of eight feedstocks offered the conditions for the development of a robust mixed culture which exhibited high stability and recovery in incidents of environmental stresses (e.g., temperature variations, exposure to air/inhibitory substrates) in other operating phases, not presented herein.
It is also worth noting that no problems of foaming correlated with high organic loading rate and deficient mixing were reported, verifying the findings of Nguyen et al. [47] who reported incidents of foaming in an 8500 m3 biogas plant operated at an organic loading rate of 4.1 kg VS m−3 day−1 under poor mixing conditions. In the present work, and in the other two cases of biogas plants operated at lower organic loading rates with adequate mixing, no foaming was observed. Ganidi et al. [48] also reported foaming problems while operating a digester at 4.5 kg VS m−3 day−1. Indeed, the OLR of the studied digester was much lower at 2.7 kg VS m−3 day−1. Probably, at lower OLRs, the concentrations of intermediate products such as amino acids, volatile fatty acids and long chain fatty acids, which are related with foaming, are low. Furthermore, co-digestion ensured a balanced COD/TKN mixture (see Table A1), keeping proteins at low concentrations, while fats were not a regular component of the feeding.
The socioeconomic benefits for the local area seem to be of great importance, even though the plant capacity is considered average (500 kW). Actually, 12,500 kWh day−1 of clean electrical energy is produced by treating an amount of 130 t organic wastes daily. If not for the anaerobic plant, the manure would be spread to the nearby agricultural land without any prior treatment according to the common practice, resulting in high CH4 emissions and incompatibility with the environmental laws, raising issues with the authorities, charging fines, etc. Taking advantage of the biogas plant’s operation, the local cow farmers obtained the permission from the authorities to expand their animal capital since they had a legitimate way to dispose of the manure. Indeed, the main manure supplier of the biogas plant increased their livestock by 20% approximately during the first four years of the plants’ operation. Another advantage to the local farmers is that they get the digestate for free. The biogas plant focusses on the exploitation of the biogas, yet it seeks a way to dispose of the digestate, which is very much acceptable to the farmers. Even though the livestock and agricultural farms are closely related to the biogas plant within the circular economy concept, the stockholders of the facility do not belong to the agricultural sector. The high investment cost and the lack of information about the new technologies are hurdles for these people to be actively involved in this type of business.

4. Conclusions

In this work, a typical full-scale biogas plant of 500 kW nominal power installed in Northern Greece has been closely monitored for over one year. During this year of operation, the performance in terms of biogas and electrical energy production was fully recorded and correlated with the feeding pattern, the organic loading rate and other parameters used to monitor a full-scale digester. The stability of the plant is evident by its yielding 0.46 ± 0.05 m3 biogas kg VS−1 with 55 ± 1.3% CH4. The feeding mixture was based on cow manure (46 ± 4%) and was supplemented with seven more feedstocks depending on their availability, cost and organic content. This case study is an exemplary success story of a business sector that has started growing in Greece, and benefits the neighboring farmers, but also, the neighboring livestock owners who seek environmentally sound ways for disposing of their waste. The growing biogas sector in Greece has proven to be an important economic activity that has a long way to go to reach its full potential.

Author Contributions

Conceptualization, K.S.; methodology, A.S., C.S.A. and I.A.V.; investigation, A.S. and I.A.V.; resources, I.A.V.; data curation, A.S., C.S.A. and I.A.V.; writing—original draft preparation, I.A.V.; writing—review and editing, K.S.; visualization, A.S. and I.A.V.; supervision, K.S.; project administration, K.S. All authors have read and agreed to the published version of the manuscript.

Funding

This research was funded by AVATO Biogas Xanthi SA, under the grant “MONITORING OF BIOGAS UNIT (AVAX)”, grant number 82066.

Conflicts of Interest

The authors declare no conflict of interest.

Appendix A

Table A1. Operating conditions of the biogas plant.
Phase
Time (Day)
IIIIIIIVVVIVIIVIIIIXX
0–3334–5152–8889–108109–133134–196197–249250–289290–324325–365
Total COD Feeding (t COD day−1)14.2 ± 0.616.1 ± 0.715.3 ± 0.614.6 ± 0.214.6 ± 1.414.5 ± 0.514.5 ± 0.414.3 ± 0.612.7 ± 0.313.6 ± 0.3
Total VS Feeding
(t VS day−1)
11.6 ± 0.512.6 ± 0.512.0 ± 0.311.8 ± 0.211.6 ± 1.111.8 ± 0.411.6 ± 0.411.3 ± 0.410.1 ± 0.210.9 ± 0.2
Total OLR (kg COD m−3 day−1)3.4 ± 0.1
(3.3–3.4)
3.8 ± 0.2
(3.8–3.9)
3.6 ± 0.1
(3.6–3.7)
3.5 ± 0.0
(3.5–3.5)
3.5 ± 0.3
(3.4–3.6)
3.5 ± 0.1
(3.4–3.5)
3.4 ± 0.1
(3.4–3.5)
3.4 ± 0.2
(3.4–3.5)
3.0 ± 0.1
(3.0–3.0)
3.3 ± 0.1
(3.2–3.3)
COD/TKN29 ± 130 ± 130 ± 129 ± 029 ± 228 ± 128 ± 128 ± 334 ± 128 ± 1
HRT (day)31 ± 228 ± 129 ± 128 ± 130 ± 629 ± 129 ± 130 ± 030 ± 030 ± 1
Values in parentheses indicate the limits of 95% confidence interval (CI).

References

  1. European Commission Roadmap 2050. Policy; Publications Office of the European Union: Luxembourg, 2012; pp. 1–9. ISBN 978-92-79-21798-2. [Google Scholar] [CrossRef]
  2. Cavinato, C.; Fatone, F.; Bolzonella, D.; Pavan, P. Thermophilic anaerobic co-digestion of cattle manure with agro-wastes and energy crops: Comparison of pilot and full scale experiences. Bioresour. Technol. 2010, 101, 545–550. [Google Scholar] [CrossRef]
  3. Weiland, P. Biogas production: Current state and perspectives. Appl. Microbiol. Biotechnol. 2010, 85, 849–860. [Google Scholar] [CrossRef]
  4. Pobeheim, H.; Munk, B.; Johansson, J.; Guebitz, G.M. Influence of trace elements on methane formation from a synthetic model substrate for maize silage. Bioresour. Technol. 2010, 101, 836–839. [Google Scholar] [CrossRef]
  5. Comino, E.; Riggio, V.A.; Rosso, M. Biogas production by anaerobic co-digestion of cattle slurry and cheese whey. Bioresour. Technol. 2012, 114, 46–53. [Google Scholar] [CrossRef] [Green Version]
  6. Zhang, C.; Xiao, G.; Peng, L.; Su, H.; Tan, T. The anaerobic co-digestion of food waste and cattle manure. Bioresour. Technol. 2013, 129, 170–176. [Google Scholar] [CrossRef] [PubMed]
  7. Fitamo, T.; Boldrin, A.; Boe, K.; Angelidaki, I.; Scheutz, C. Co-digestion of food and garden waste with mixed sludge from wastewater treatment in continuously stirred tank reactors. Bioresour. Technol. 2016, 206, 245–254. [Google Scholar] [CrossRef] [PubMed] [Green Version]
  8. Jha, P.; Schmidt, S. Reappraisal of chemical interference in anaerobic digestion processes. Renew. Sustain. Energy Rev. 2017, 75, 954–971. [Google Scholar] [CrossRef]
  9. Garuti, M.; Langone, M.; Fabbri, C.; Piccinini, S. Methodological approach for trace elements supplementation in anaerobic digestion: Experience from full-scale agricultural biogas plants. J. Environ. Manag. 2018, 223, 348–357. [Google Scholar] [CrossRef]
  10. Alatriste-Mondragón, F.; Samar, P.; Cox, H.H.J.; Ahring, B.K.; Iranpour, R. Anaerobic Codigestion of Municipal, Farm, and Industrial Organic Wastes: A Survey of Recent Literature. Water Environ. Res. 2006, 78, 607–636. [Google Scholar] [CrossRef]
  11. Shah, F.A.; Mahmood, Q.; Rashid, N.; Pervez, A.; Raja, I.A.; Shah, M.M. Co-digestion, pretreatment and digester design for enhanced methanogenesis. Renew. Sustain. Energy Rev. 2015, 42, 627–642. [Google Scholar] [CrossRef]
  12. Zupančič, G.D.; Uranjek-Ževart, N.; Roš, M. Full-scale anaerobic co-digestion of organic waste and municipal sludge. Biomass Bioenergy 2008, 32, 162–167. [Google Scholar] [CrossRef]
  13. Nägele, H.J.; Steinbrenner, J.; Hermanns, G.; Holstein, V.; Haag, N.L.; Oechsner, H. Innovative additives for chemical desulphurisation in biogas processes: A comparative study on iron compound products. Biochem. Eng. J. 2017, 121, 181–187. [Google Scholar] [CrossRef]
  14. Garuti, M.; Langone, M.; Fabbri, C.; Piccinini, S. Monitoring of full-scale hydrodynamic cavitation pretreatment in agricultural biogas plant. Bioresour. Technol. 2018, 247, 599–609. [Google Scholar] [CrossRef]
  15. Rasheed, R.; Yasar, A.; Ahmad, S.R.; Tabinda, A.B.; Khan, S.A.; Su, Y. Bioenergy recovery analysis from various waste substrates by employing a novel industrial scale AD plant. Energy Sources Part A Recovery Util. Environ. Eff. 2018, 40, 1935–1946. [Google Scholar] [CrossRef]
  16. Martí-Herrero, J.; Soria-Castellón, G.; Diaz-de-Basurto, A.; Alvarez, R.; Chemisana, D. Biogas from a full scale digester operated in psychrophilic conditions and fed only with fruit and vegetable waste. Renew. Energy 2019, 133, 676–684. [Google Scholar] [CrossRef]
  17. Björnsson, L.; Murto, M.; Mattiasson, B. Evaluation of parameters for monitoring an anaerobic co-digestion process. Appl. Microbiol. Biotechnol. 2000, 54, 844–849. [Google Scholar] [CrossRef]
  18. Carrere, H.; Antonopoulou, G.; Affes, R.; Passos, F.; Battimelli, A.; Lyberatos, G.; Ferrer, I. Review of feedstock pretreatment strategies for improved anaerobic digestion: From lab-scale research to full-scale application. Bioresour. Technol. 2016, 199, 386–397. [Google Scholar] [CrossRef]
  19. Zhurka, M.; Spyridonidis, A.; Vasiliadou, I.A.; Stamatelatou, K. Biogas production from sunflower head and stalk residues: Effect of alkaline pretreatment. Molecules 2020, 25, 164. [Google Scholar] [CrossRef] [Green Version]
  20. Alexandridis, C. Map of biogas plants (in Greek). Bioenergy News 2018, 2, 14–17. [Google Scholar]
  21. Hellenic Electricity Distribution Network Operator S.A. Available online: https://www.deddie.gr/en/ (accessed on 19 February 2020).
  22. Obregón Valencia, D.; García Sánchez, H.; Díaz Tang, I. The corrosion behavior of ferrous materials immersed in acidic-media using D-optimal design. Multidiscip. Model. Mater. Struct. 2019, 16, 647–656. [Google Scholar] [CrossRef]
  23. Komilis, D.P.; Tziouvaras, I.S. A statistical analysis to assess the maturity and stability of six composts. Waste Manag. 2009, 29, 1504–1513. [Google Scholar] [CrossRef] [PubMed]
  24. APHA. Standard Methods for the Examination of Water & Wastewater, 20th ed.; American Public Health Association/American Water Works Association/Water Environment Federation: Washington, DC, USA, 2005. [Google Scholar]
  25. Spyridonidis, A.; Skamagkis, T.; Lambropoulos, L.; Stamatelatou, K. Modeling of anaerobic digestion of slaughterhouse wastes after thermal treatment using ADM1. J. Environ. Manag. 2018, 224, 49–57. [Google Scholar] [CrossRef] [PubMed]
  26. Bouallagui, H.; Touhami, Y.; Ben Cheikh, R.; Hamdi, M. Bioreactor performance in anaerobic digestion of fruit and vegetable wastes. Process Biochem. 2005, 40, 989–995. [Google Scholar] [CrossRef]
  27. Weiland, P. Biomass digestion in agriculture: A successful pathway for the energy production and waste treatment in Germany. Eng. Life Sci. 2006, 6, 302–309. [Google Scholar] [CrossRef]
  28. Khoufi, S.; Louhichi, A.; Sayadi, S. Optimization of anaerobic co-digestion of olive mill wastewater and liquid poultry manure in batch condition and semi-continuous jet-loop reactor. Bioresour. Technol. 2015, 182, 67–74. [Google Scholar] [CrossRef]
  29. Drosg, B. Process Monitoring in Biogas Plants; IEA Bioenergy: Paris, France, 2013; pp. 1–38. ISBN 978-1-910154-02-1. [Google Scholar]
  30. Carrera-Chapela, F.; Donoso-Bravo, A.; Jeison, D.; Díaz, I.; Gonzalez, J.A.; Ruiz-Filippi, G. Development, identification and validation of a mathematical model of anaerobic digestion of sewage sludge focusing on H2S formation and transfer. Biochem. Eng. J. 2016, 112, 13–19. [Google Scholar] [CrossRef]
  31. Okoro, O.V.; Sun, Z. Desulphurisation of Biogas: A Systematic Qualitative and Economic-Based Quantitative Review of Alternative Strategies. ChemEngineering 2019, 3, 76. [Google Scholar] [CrossRef] [Green Version]
  32. Naegele, H.J.; Lindner, J.; Merkle, W.; Lemmer, A.; Jungbluth, T.; Bogenrieder, C. Effects of temperature, pH and O2 on the removal of hydrogen sulfide from biogas by external biological desulfurization in a full scale fixed-bed trickling bioreactor (FBTB). Int. J. Agric. Biol. Eng. 2013, 6, 69–81. [Google Scholar] [CrossRef]
  33. Thompson, J.C.; He, B.B. Characterization of crude glycerol from biodiesel production from multiple feedstocks. Appl. Eng. Agric. 2006, 22, 261–265. [Google Scholar] [CrossRef]
  34. Antonious, G.F.; Perkins, E.; Cantor, A.H. Chicken manure increased concentration of organic sulfur compounds in field-grown onions. J. Environ. Sci. Health Part B Pestic. Food Contam. Agric. Wastes 2009, 44, 481–487. [Google Scholar] [CrossRef]
  35. Ouazzane, H.; Laajine, F.; El Yamani, M.; El Hilaly, J.; Rharrabti, Y.; Amarouch, M.Y.; Mazouzi, D. Olive mill solid waste characterization and recycling opportunities: A review. J. Mater. Environ. Sci. 2017, 8, 2632–2650. [Google Scholar]
  36. Allegue, L.B.; Hinge, J. Biogas Upgrading Evaluation of Methods for H2S Removal; Danish Technological Institute: Taastrup, Denmark, 2014; Volume 31. [Google Scholar]
  37. Hvitved-Jacobsen, T.; Vollertsen, J.; Nielsen, A.H. Sewer Processes: Microbial and Chemical Process Engineering of Sewer Networks, 2nd ed.; CRC Press: Boca Raton, FL, USA, 2013; ISBN 978-1-4398-8177-4. [Google Scholar]
  38. Valli, L.; Rossi, L.; Fabbri, C.; Sibilla, F.; Gattoni, P.; Dale, B.E.; Kim, S.; Ong, R.G.; Bozzetto, S. Greenhouse gas emissions of electricity and biomethane produced using the Biogasdoneright™ system: Four case studies from Italy. Biofuels Bioprod. Bioref. 2017, 11, 847–860. [Google Scholar] [CrossRef]
  39. Ahn, H.K.; Mulbry, W.; White, J.W.; Kondrad, S.L. Pile mixing increases greenhouse gas emissions during composting of dairy manure. Bioresour. Technol. 2011, 102, 2904–2909. [Google Scholar] [CrossRef]
  40. Liebetrau, J.; Reinelt, T.; Clemens, J.; Hafermann, C.; Friehe, J.; Weiland, P. Analysis of greenhouse gas emissions from 10 biogas plants within the agricultural sector. Water Sci. Technol. 2013, 67, 1370–1379. [Google Scholar] [CrossRef] [PubMed]
  41. European Commission. Biological Treatment of Biowaste. Available online: http://europa.eu.int/comm/environment/waste/facts_en.htm (accessed on 1 September 2020).
  42. Nkoa, R. Agricultural benefits and environmental risks of soil fertilization with anaerobic digestates: A review. Agron. Sustain. Dev. 2014, 34, 473–492. [Google Scholar] [CrossRef] [Green Version]
  43. Molaey, R.; Bayrakdar, A.; Sürmeli, R.Ö.; Çalli, B. Anaerobic digestion of chicken manure: Mitigating process inhibition at high ammonia concentrations by selenium supplementation. Biomass Bioenergy 2018, 108, 439–446. [Google Scholar] [CrossRef]
  44. Stamatelatou, K.; Antonopoulou, G.; Ntaikou, I.; Lyberatos, G. The Effect of Physical, Chemical, and Biological Pretreatments of Biomass on its Anaerobic Digestibility and Biogas Production. Biogas Prod. Pretreat. Methods Anaerob. Dig. 2012, 3, 55–90. [Google Scholar] [CrossRef]
  45. Carrère, H.; Dumas, C.; Battimelli, A.; Batstone, D.J.; Delgenès, J.P.; Steyer, J.P.; Ferrer, I. Pretreatment methods to improve sludge anaerobic degradability: A review. J. Hazard. Mater. 2010, 183, 1–15. [Google Scholar] [CrossRef]
  46. Carballa, M.; Duran, C.; Hospido, A. Should we pretreat solid waste prior to anaerobic digestion? An assessment of its environmental cost. Environ. Sci. Technol. 2011, 45, 10306–10314. [Google Scholar] [CrossRef]
  47. Nguyen, L.N.; Johir, M.A.H.; Commault, A.; Bustamante, H.; Aurisch, R.; Lowrie, R.; Nghiem, L.D. Impacts of mixing on foaming, methane production, stratification and microbial community in full-scale anaerobic co-digestion process. Bioresour. Technol. 2019, 281, 226–233. [Google Scholar] [CrossRef]
  48. Ganidi, N.; Tyrrel, S.; Cartmell, E. Anaerobic digestion foaming causes—A review. Bioresour. Technol. 2009, 100, 5546–5554. [Google Scholar] [CrossRef] [PubMed] [Green Version]
  49. Mattioli, A.; Gatti, G.B.; Mattuzzi, G.P.; Cecchi, F.; Bolzonella, D. Co-digestion of the organic fraction of municipal solid waste and sludge improves the energy balance of wastewater treatment plants: Rovereto case study. Renew. Energy 2017, 113, 980–988. [Google Scholar] [CrossRef]
Figure 1. Evolution of the number of biogas plants and amount of installed power in Greece [21].
Water 12 03074 g001
Figure 2. Layout of the full-scale biogas plant and the end uses of the final products.
Water 12 03074 g002
Figure 3. Fractional composition (% w/w as kgCOD) of each of the 8 feedstocks for the different operational phases.
Water 12 03074 g003
Figure 4. (a) Organic loading rate (OLR), the biogas production rate (BPR) and the resulting yield, and (b) the total chemical oxygen demand (COD) loading, the electrical energy production rate (EPR) and the yield of the electrical energy per COD fed, versus time during one-year of operation.
Water 12 03074 g004aWater 12 03074 g004b
Figure 5. (a) pH and electrical conductivity (EC) values, and (b) NH3-N, TKN, alkalinity concentration and FOS/TAC during the whole operating period of the full-scale plant.
Water 12 03074 g005
Figure 6. Biogas composition during the monitoring period of the full-scale plant.
Water 12 03074 g006
Figure 7. Cumulative oxygen consumption obtained from static respiration test of solid digestate.
Water 12 03074 g007
Table 1. Feedstocks’ characterization.
Parameter (Unit)TS
(g kgww−1)
VS
(g kgww−1)
COD
(gCOD kgww−1)
Total Nitrogen TKN
(g kgww−1)
COD/ΤKΝpH
Cow manure, CM67 ± 20
(48–86)
55 ± 16
(39–71)
66 ± 3
(63–69)
2.6 ± 0.2
(2.5–2.8)
25.4 ± 2.0
(23.4–27.3)
6.99 ± 0.24
(6.75–7.23)
Chicken manure, ChM627 ± 28
(603–652)
522 ± 11
(512–532)
746 ± 67
(687–805)
35.9 ± 2.2
(33.9–37.8)
20.8 ± 1.7
(19.3–22.3)
N.D.
Corn silage, CS293 ± 13
(280–306)
278 ± 13
(265–291)
399 ± 14
(380–418)
3.8 ± 0.2
(3.6–4.1)
104.8 ± 6.0
(96.5–113)
N.D.
Wheat/Ray Silage, WS299 ± 8
(287–310)
220 ±2
(217–222)
377 ± 23
(351–403)
4.5 ± 0.5
(4.0–5.1)
84.0 ± 8.6
(72.1–95.9)
N.D.
Cheese whey, CW121 ± 1
(119–123)
100 ± 2
(97–103)
159 ± 8
(151–167)
2.7 ± 0.1
(2.6–2.8)
58.6 ± 0.1
(58.5–58.6)
4.06 ± 0.08
(3.98–4.14)
Olive mill wastewater, OMW70.7 ± 0.3
(70–71)
53.3 ± 0.6
(53–54)
137 ± 6
(128–146)
1.14 ± 0.04
(1.1–1.2)
119.8 ± 5.8
(111.7–127.8)
4.28 ± 0.28
(3.89–4.67)
Glycerin, Gl812 ± 52
(752–871)
769 ± 55
(707–831)
1242 ± 35
(1208–1276)
N.D.N.D.9.28 ± 1.8
(6.79–11.77)
Molasses, Ml768 ± 23
(736–800)
645 ± 41
(589–701)
695 ± 23
(669–721)
14.6 ± 1.5
(12.5–16.7)
48 ± 4.0
(42.1–53.4)
5.50
ww: wet weight; values in parenthesis indicate the limits of 95% CI.; N.D.: not detected.
Table 2. Estimated daily CH4 production based on the feeding feedstocks.
FeedstockAverage Daily Feeding (t day−1)CH4 Yield (m3 CH4 tWW−1)CH4 Production (m3 CH4 day−1)
Chicken manure3.2136434
Olive mill wastewater4.424106
Cheese whey2.541103
Corn silage397290
Wheat/ray silage3.557200
Cow manure120121440
Glycerin1.2460552
Molasses0.1621635
Total--3195
ww: wet weight.
Table 3. Distance required for the feeding of each substrate.
SubstrateDistance Required for Feeding (km t−1 day−1)
Cow manure0.778
Corn silage0.900
Wheat/ray silage0.900
Olive mill wastewater2.000
Chicken manure5.000
Cheese whey8.800
Glycerin17.500
Molasses19.130
Table 4. Cost and profit for each feedstock.
SubstrateAquisition Cost (€ tWW−1)CH4 Yield (m3 CH4 tVS−1)VS
(kg tWW−1)
CH4 Yield (m3 CH4 tWW−1)Production Cost (€ m3CH4−1)Production Cost (€ kWh−1)Profit
(€ kWh−1)
Chicken manure102605221360.070.020.207
Olive mill wastewater4.545053240.190.050.178
Cheese whey10413100410.240.060.165
Cow manure3.521855120.290.070.153
Glycerin1774687693600.490.120.104
Corn silage50348278970.520.130.097
Triticale silage40260220570.700.170.052
Molasses1703356452160.790.190.031
Table 5. Effects of feedstock and operation on biogas production in the full-scale digester.
Feedstock aDigestor bT (°C)HRT
(day)
OLR
(kg VS m−3 day−1)
BY
(m3 kg VS−1)
CH4 (%)Energy (MWhel year−1)Power (W)Ref.
DR, MS2 CSTR in series, R 2010.39 [12]
CM, MaS, FPW, BTwo-stage digester47335.390.4552.387891000[2]
DR, MS2 CSTR in parallel 30–401.38 ± 0.780.557 ± 32847 [49]
Pretreated PS, MaS, M, CoM3 CSTR in series42–4330–352.920.38 ± 0.0458.7 ± 0.66433 ± 330725[14]
MaS, WS, CM2 CSTR in series, R40–42107 ± 181.83 ± 0.160.25 ± 0.0151.9 ± 1.7 380[9]
PS, MS, ChM MG2 CSTR in parallel and a Post Fermenter40–4240 ± 22.33 ± 0.190.35 ± 0.0353.7 ± 1.5 999[9]
CM, PW 3 digesters35–37 0.11262170150[15]
CM, ChM, CS, WS, CWW, OMW
Gl, M
One-stage digester4029.4 ± 2.12.70.46 ± 0.0555 ± 1.34631500This study
a DR: domestic refuse; MS: municipal sludge; CM: cow manure; ChM: chicken manure; MaS: maize silage; FPW: food processing waste; B: bread; PS: pig slurry; M: molasses; CoM: corn meal; WS: wheat/ray silage; MG: maize grain; PW: potato waste; FVW: fruit-vegetable waste; CS: corn silage; CWW: cheese whey wastewater; OMW: olive mill wastewater; Gl: glycerine; b recirculation.
Publisher’s Note: MDPI stays neutral with regard to jurisdictional claims in published maps and institutional affiliations.

