Assessing the Impact of Chemical Loads from Agriculture Holdings on the Puck Bay Environment with the High-Resolution Ecosystem Model of the Puck Bay, Southern Baltic Sea


Abstract
:1. Introduction
- a numerical model of groundwater flow based on Modflow [6],
- a comprehensive model of surface water runoff based on Soil & Water Assessment Tool (SWAT) [7],
- a three-dimensional numerical model of the Puck Bay ecosystem consisting of a hydrodynamic [1] and biochemical part with a nutrient spread module (this paper).
2. Materials and Methods
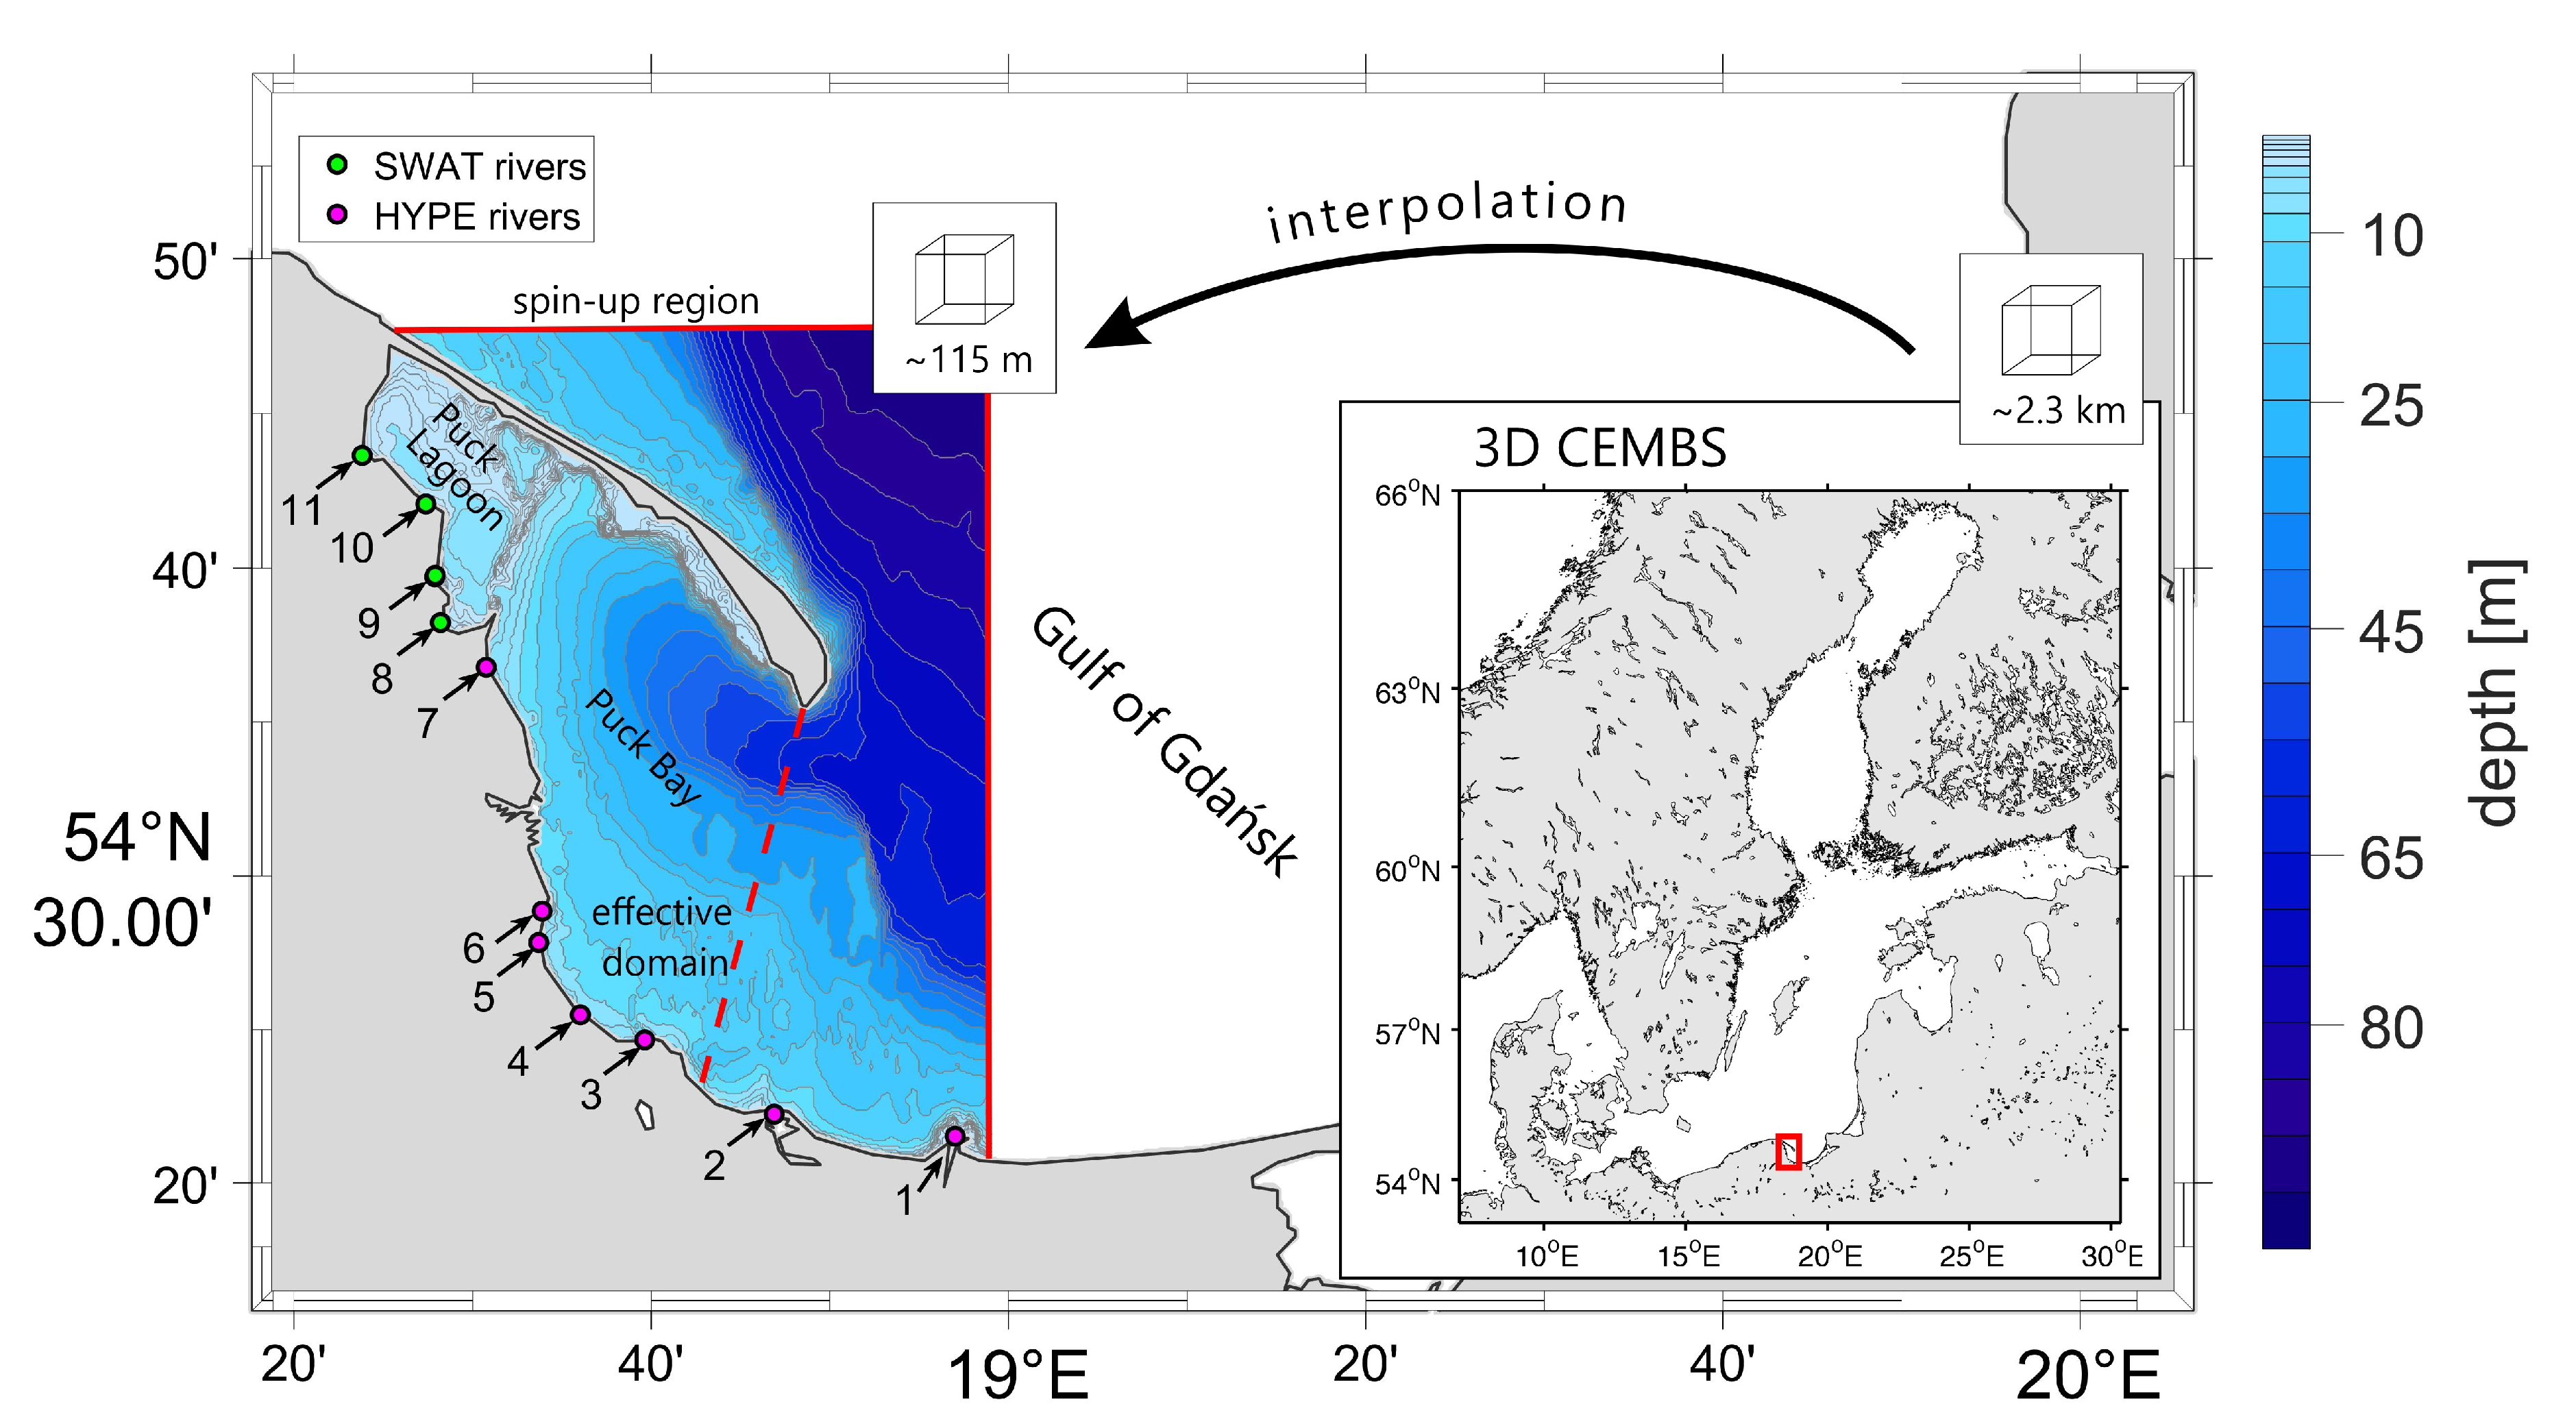
2.1. Study Area
2.2. EcoPuckBay Configuration
2.3. Land–Water Linkage
2.3.1. Surface Water
2.3.2. Groundwater
2.4. Water–Water Border
2.5. Data Used for Evaluation
2.5.1. VIEP
2.5.2. NEMO-SCOBI
2.6. Nutrient Spread Module
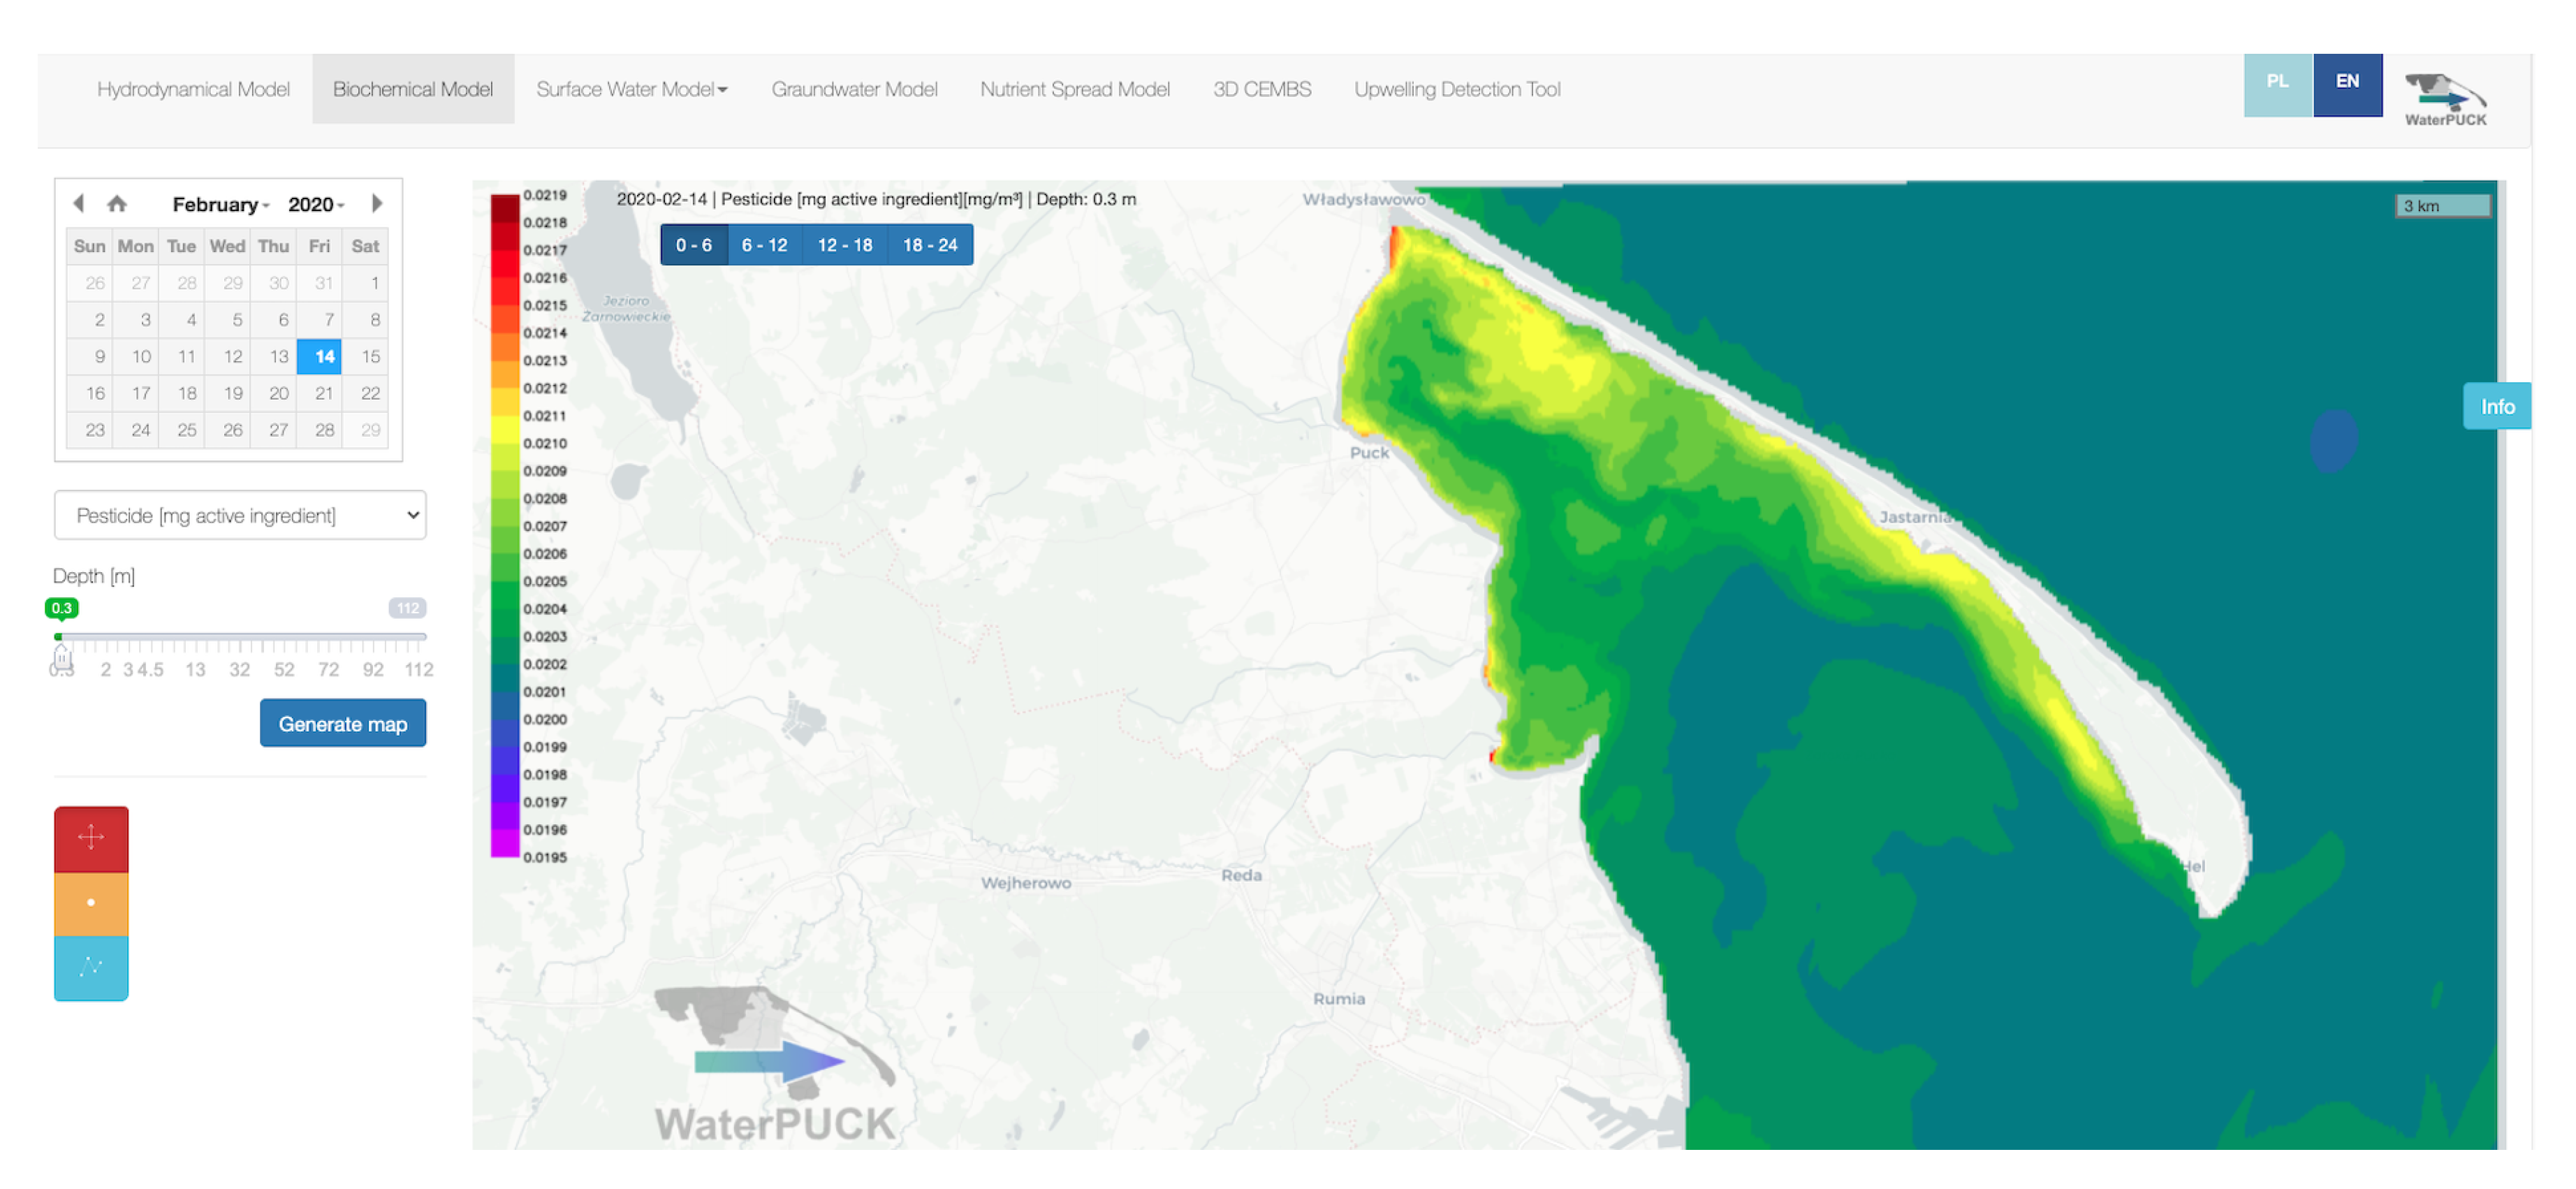
2.7. Pesticide Distribution
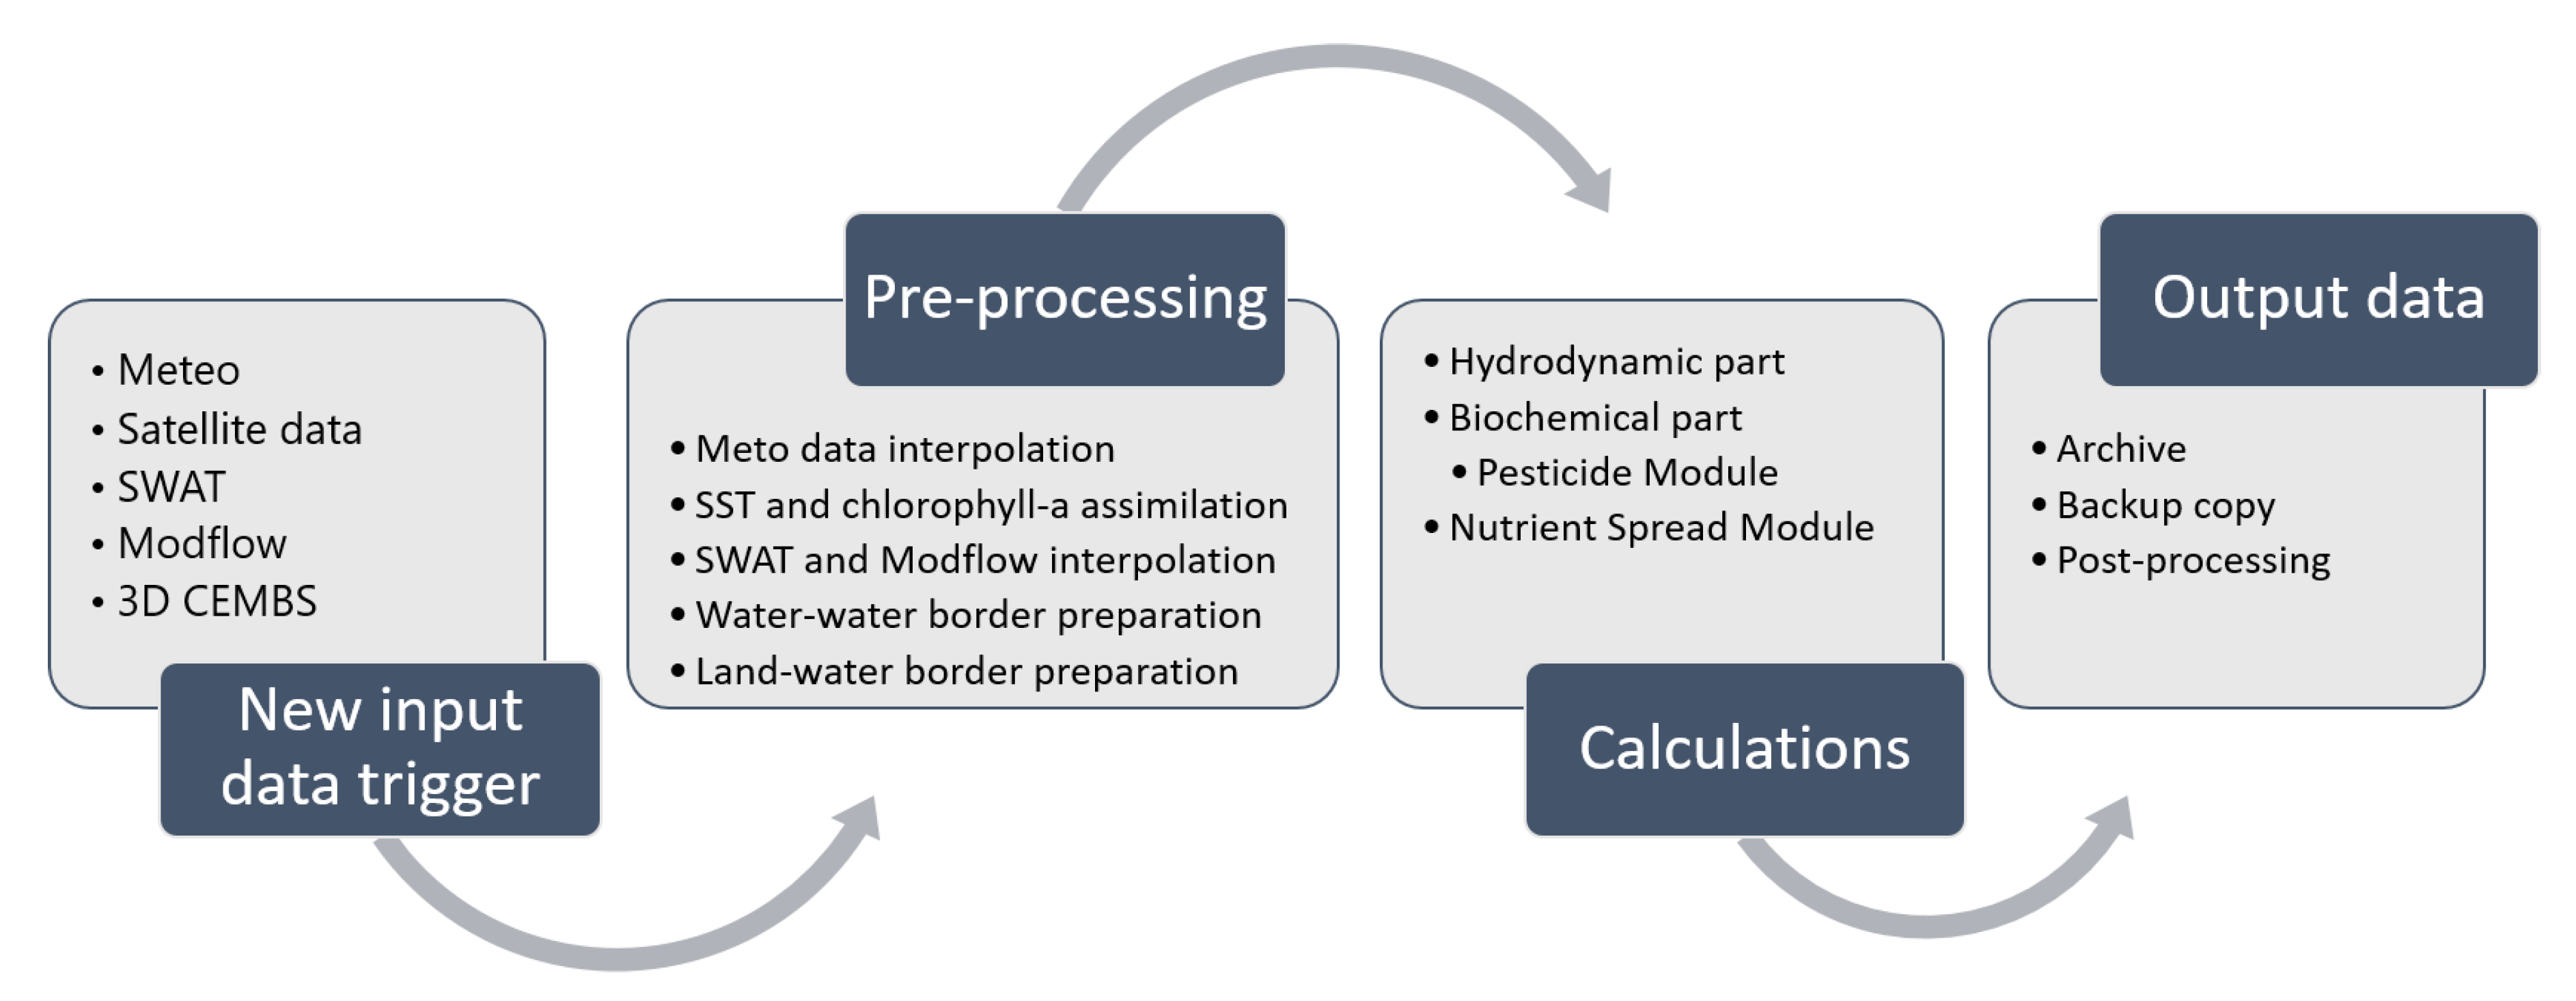
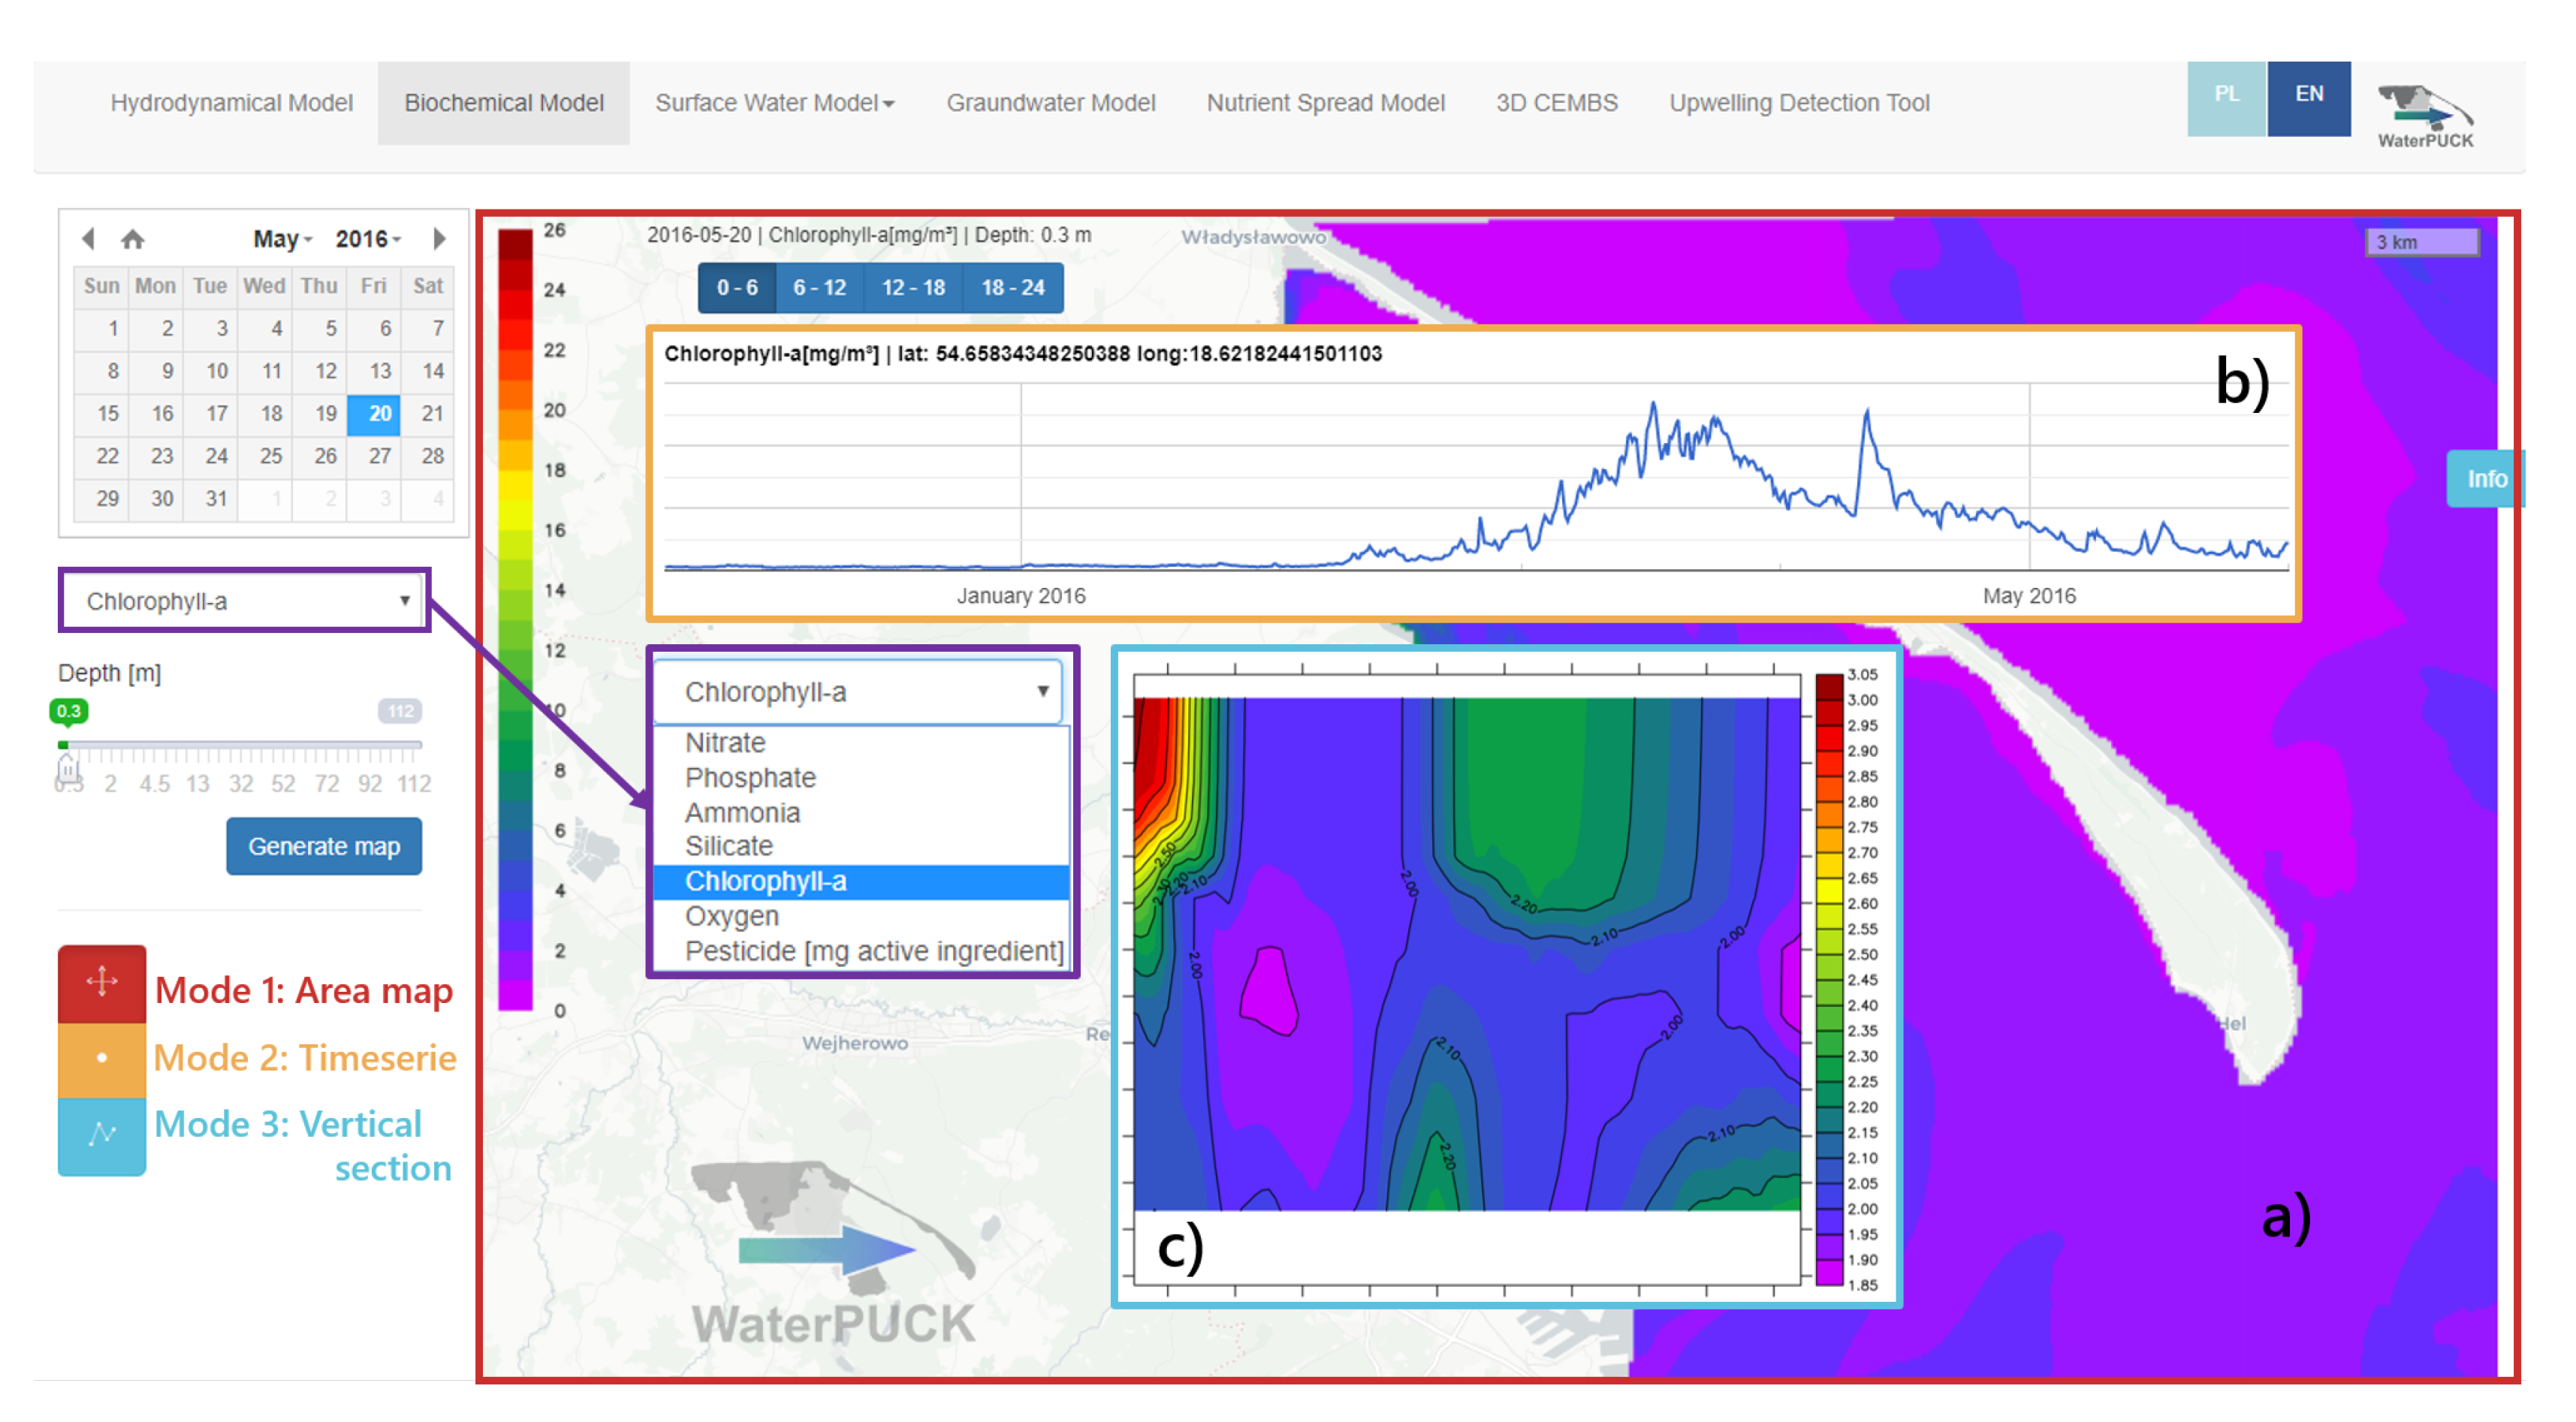
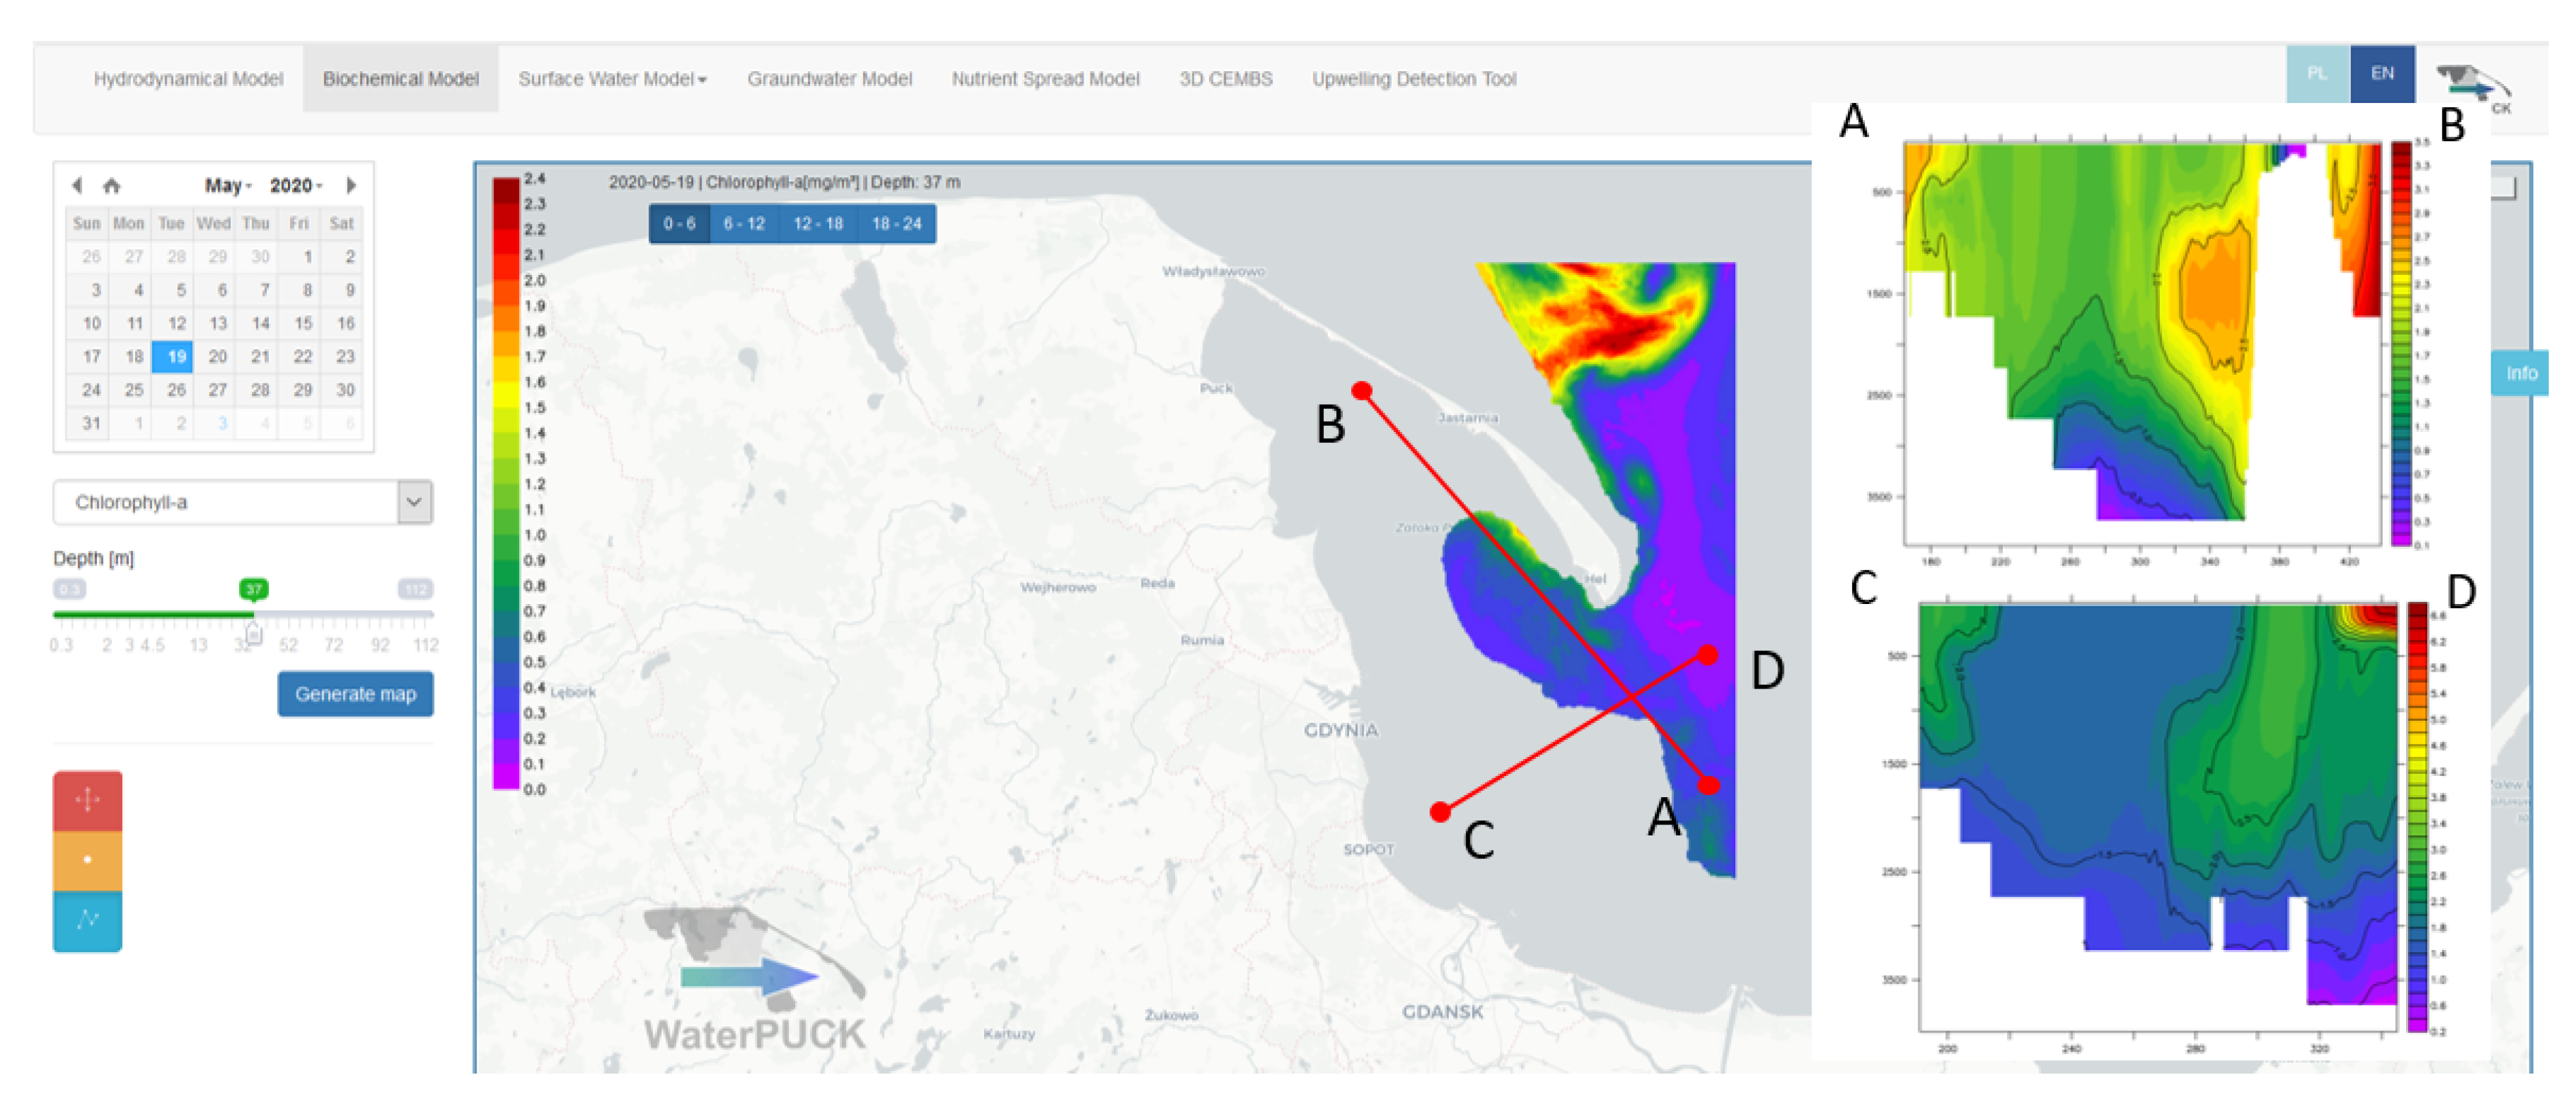
2.8. Operational Mode
3. Results
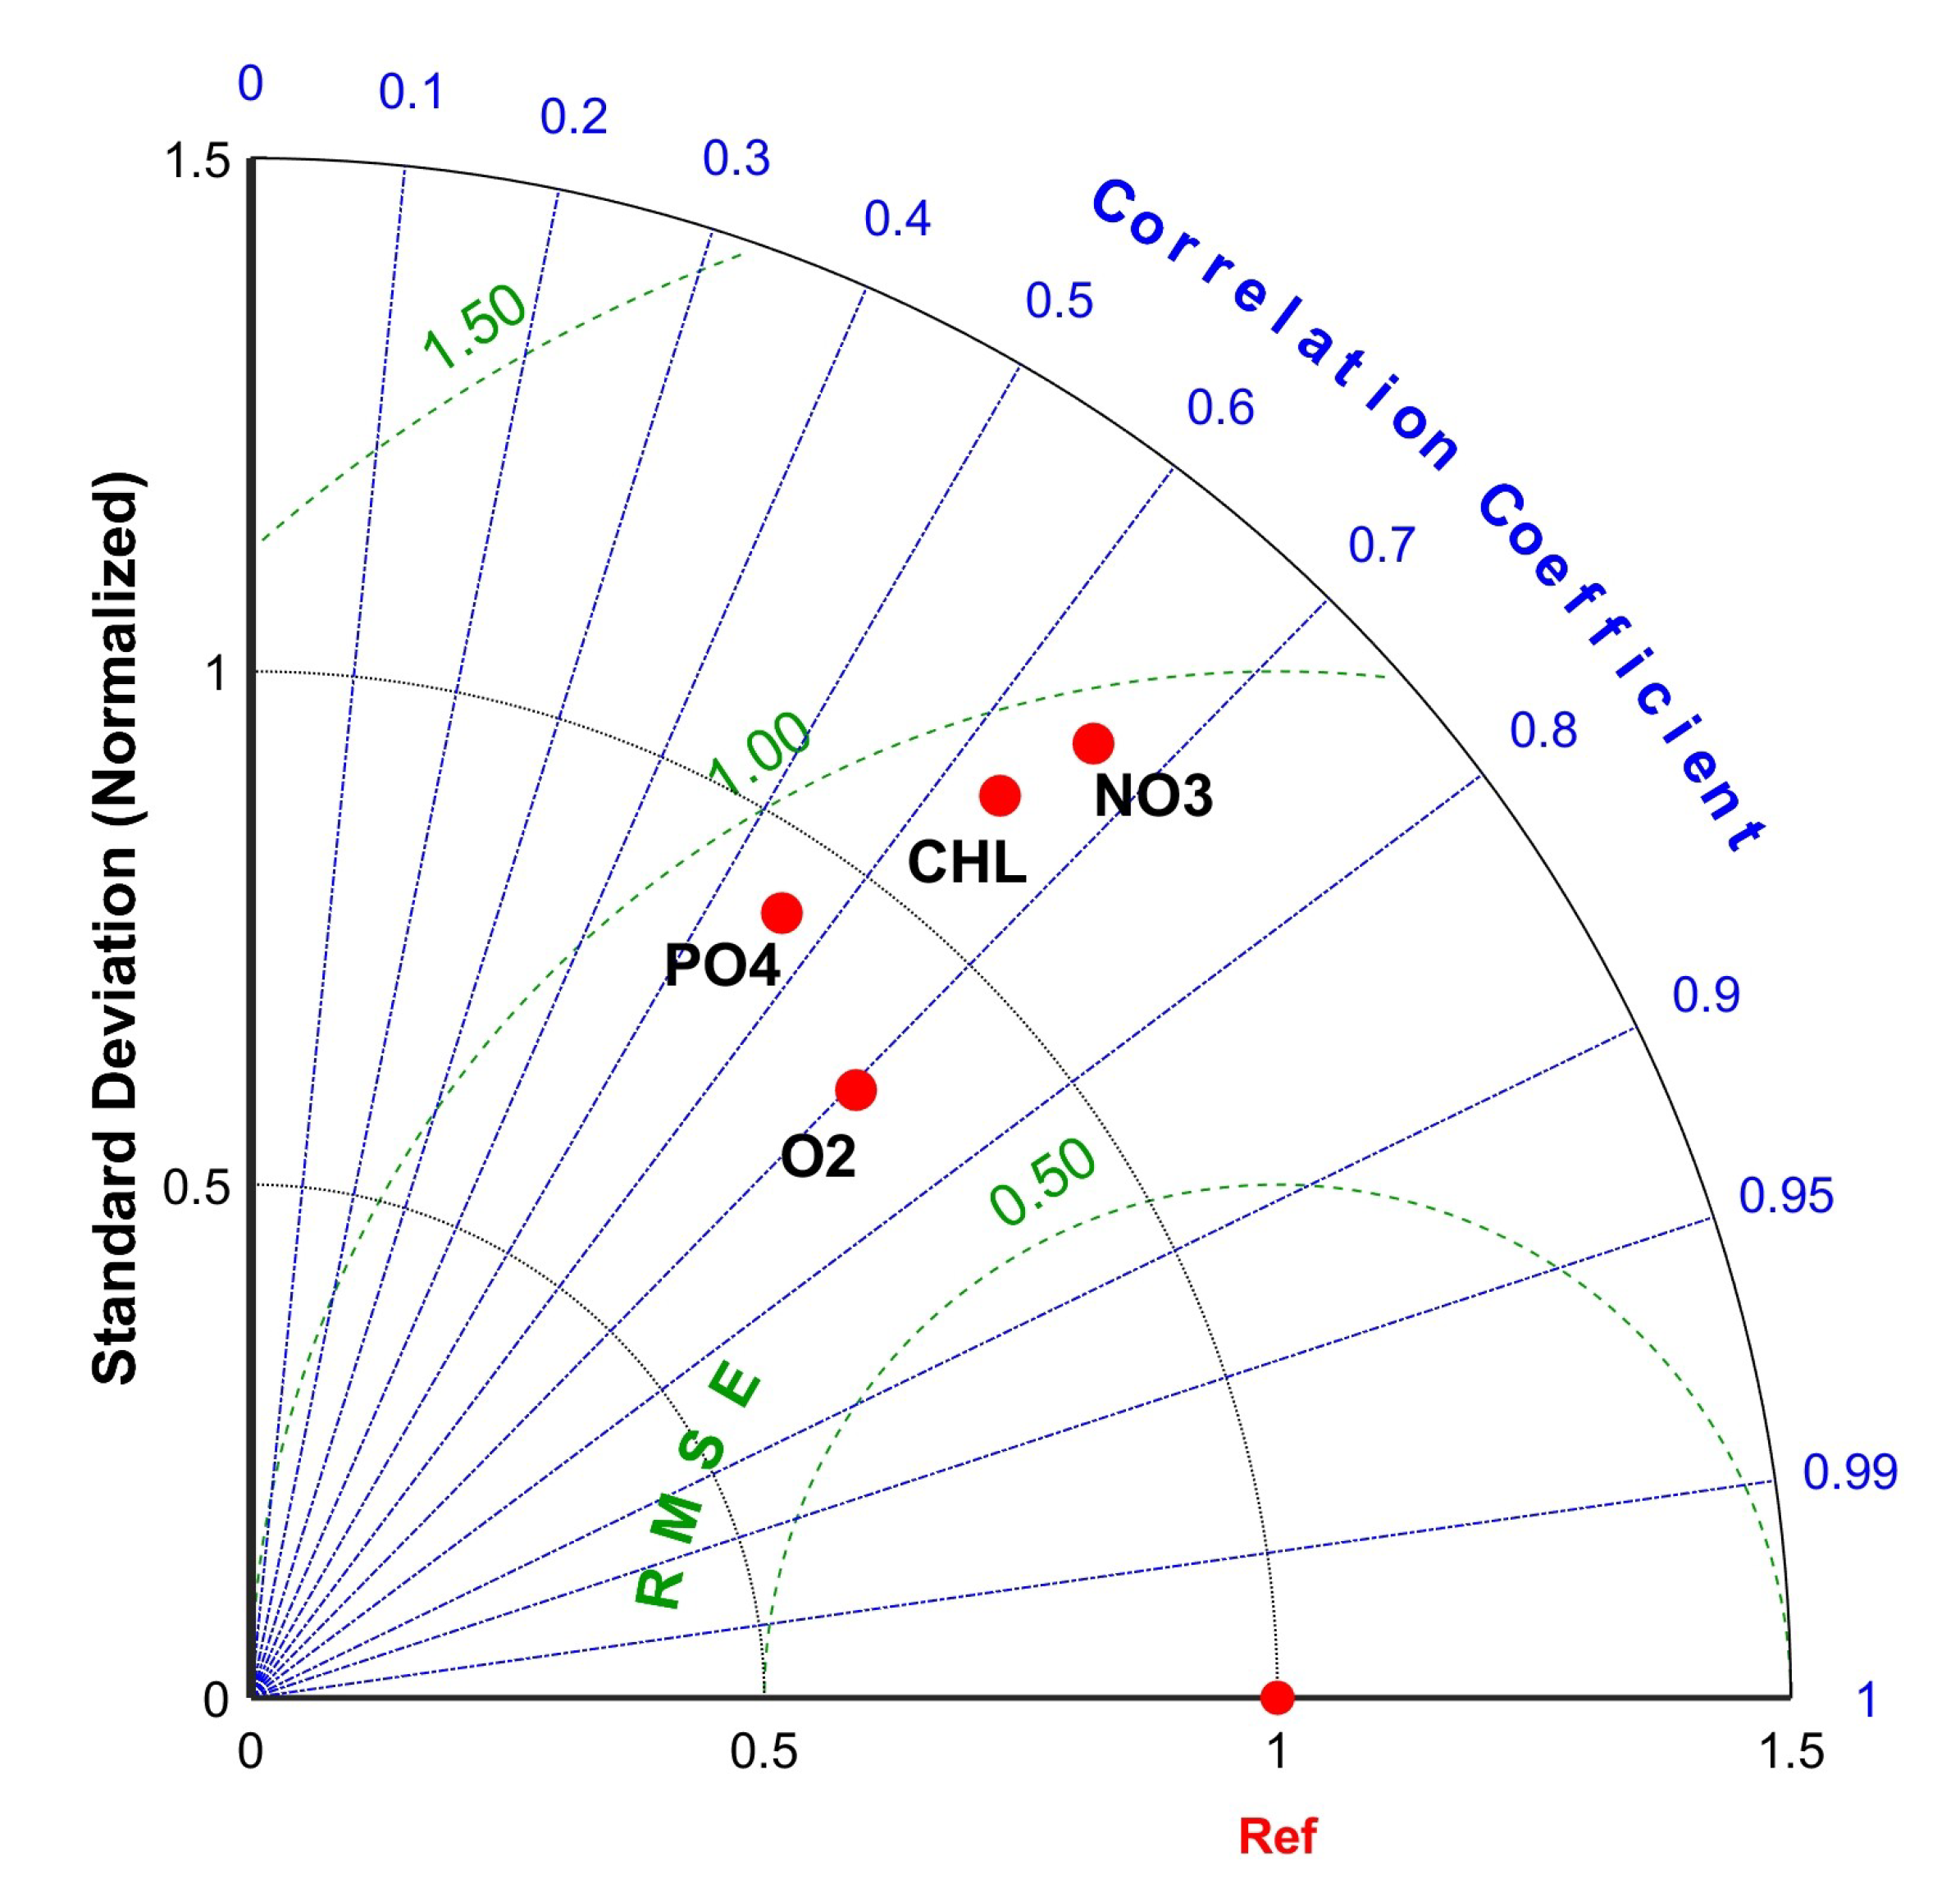
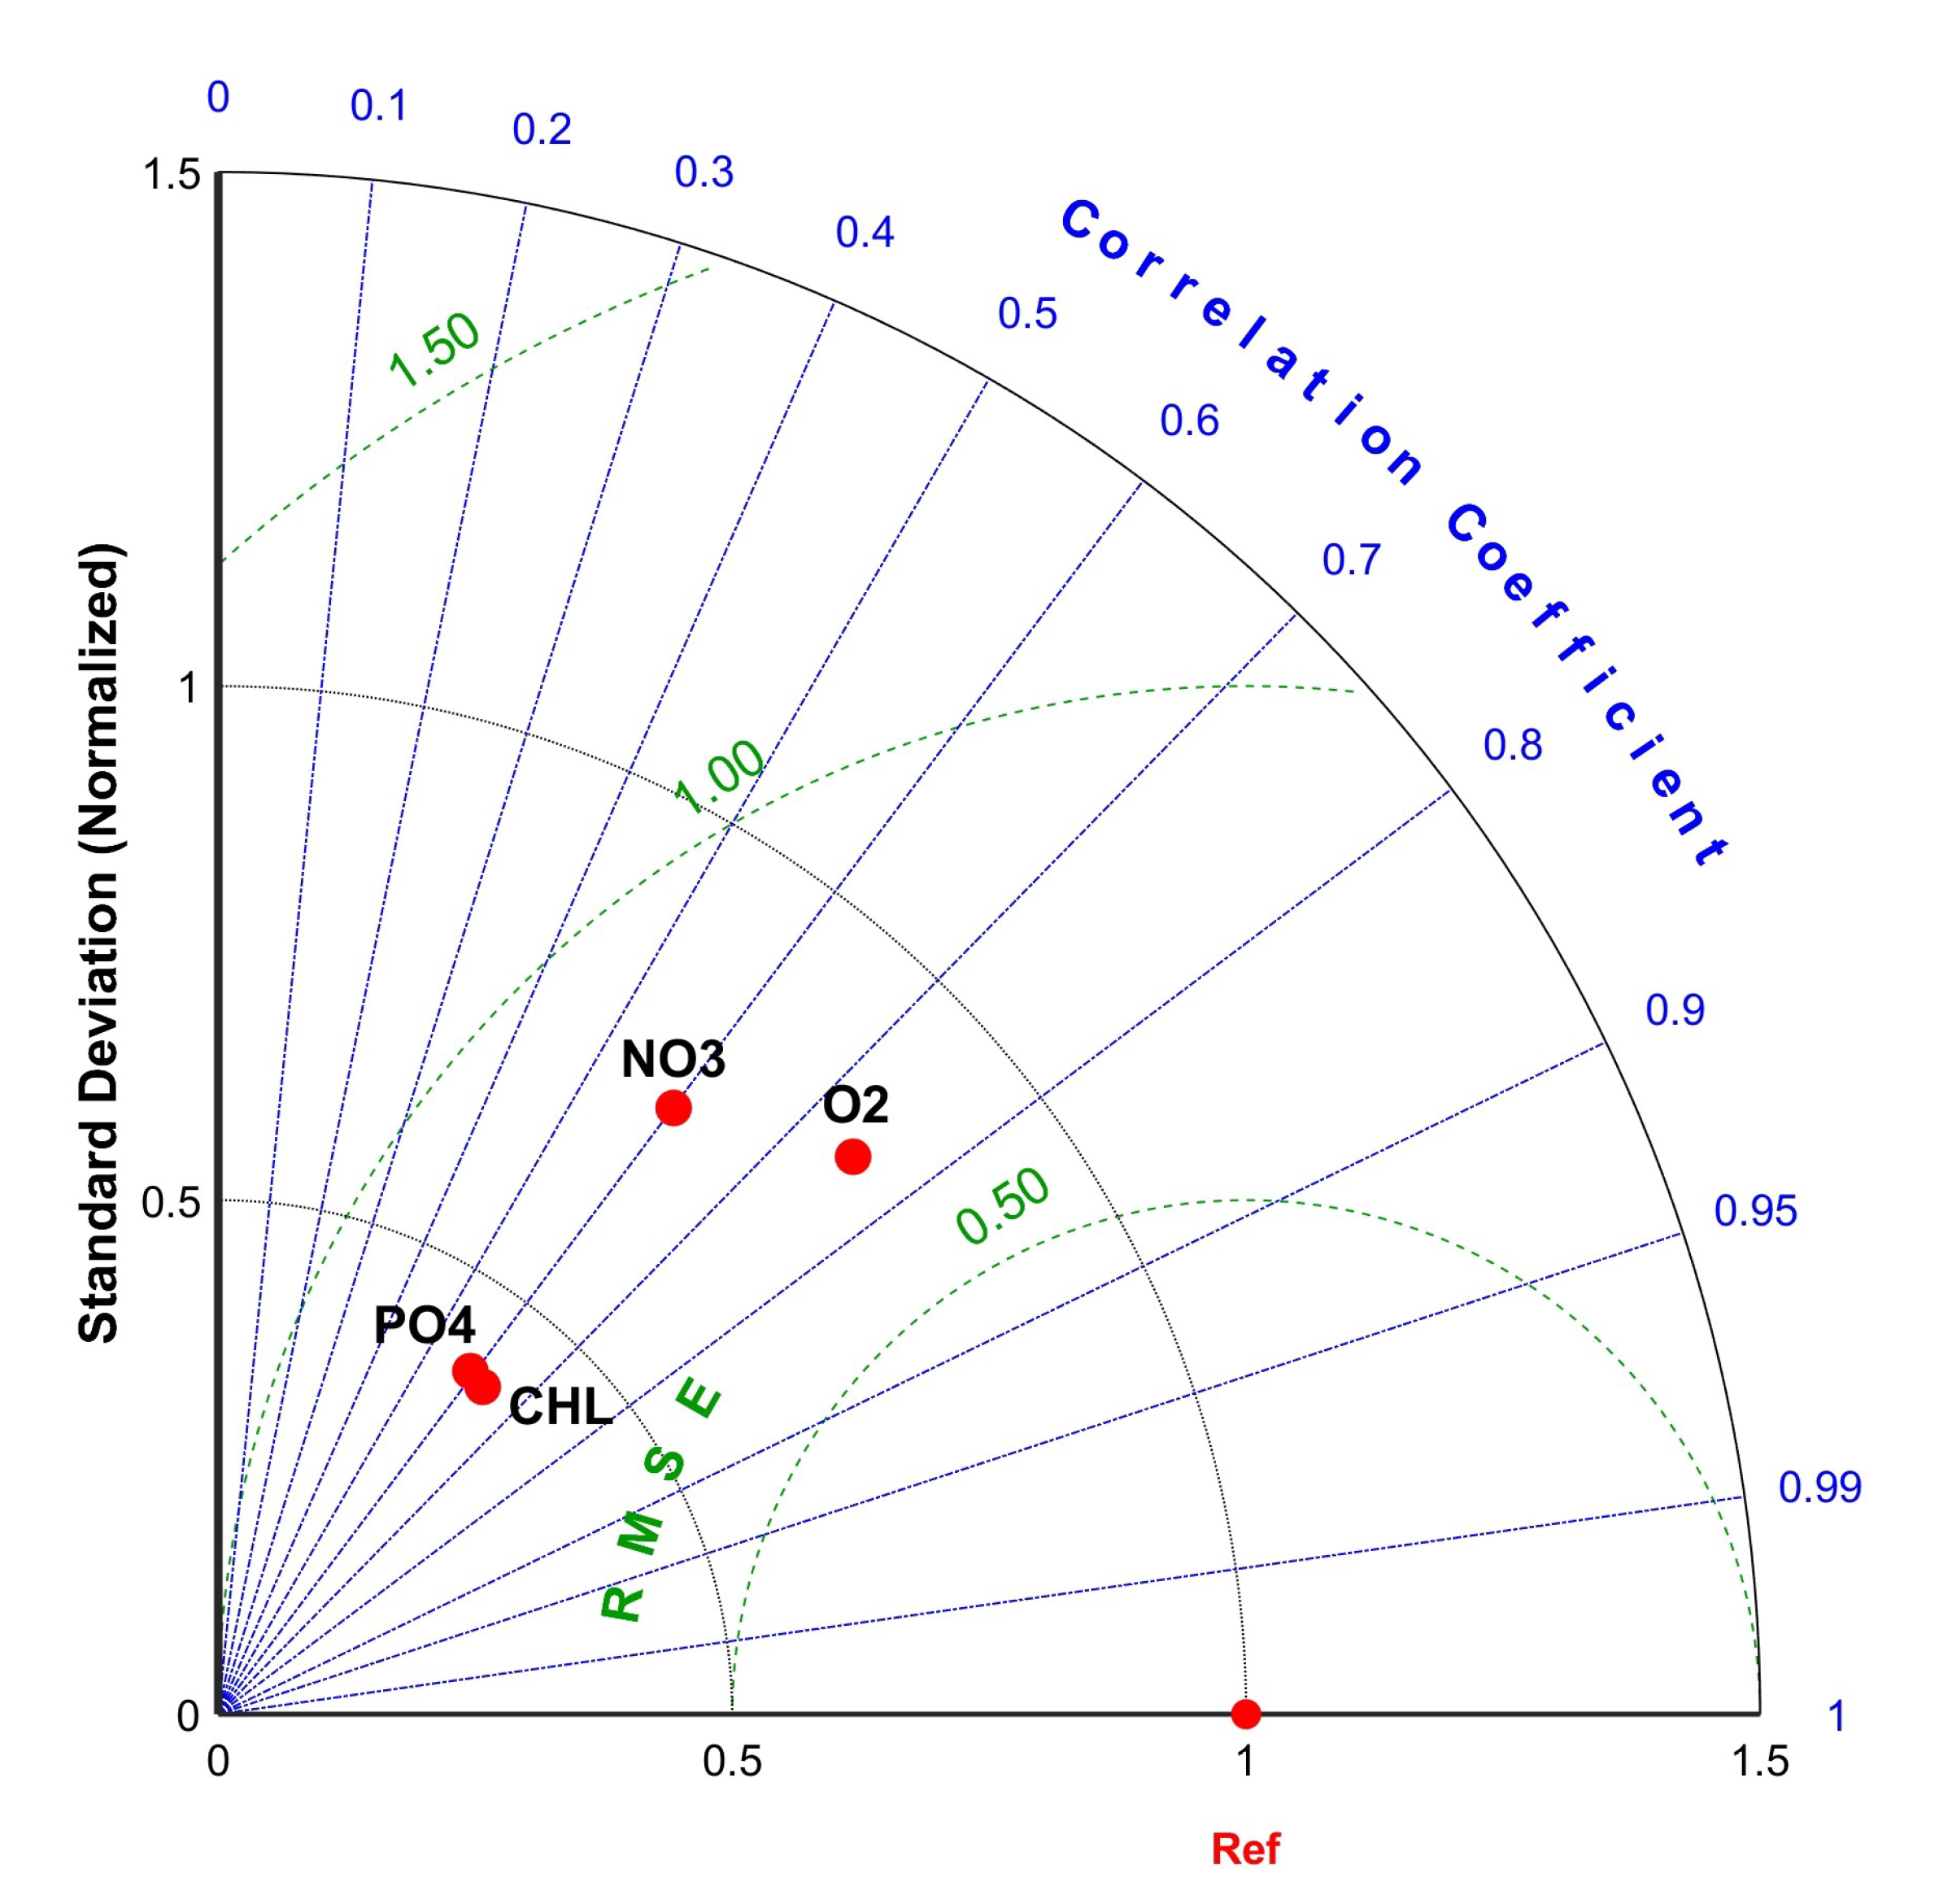
3.1. Statistical Comparison of EcoPuckBay Model With VIEP Monitoring Data and NEMO-SCOBI Model Results
3.1.1. VIEP Monitoring Data
3.1.2. NEMO-SCOBI Model Results
3.2. Land–Water Linkage
3.2.1. River Runoff
3.2.2. Groundwater Discharge
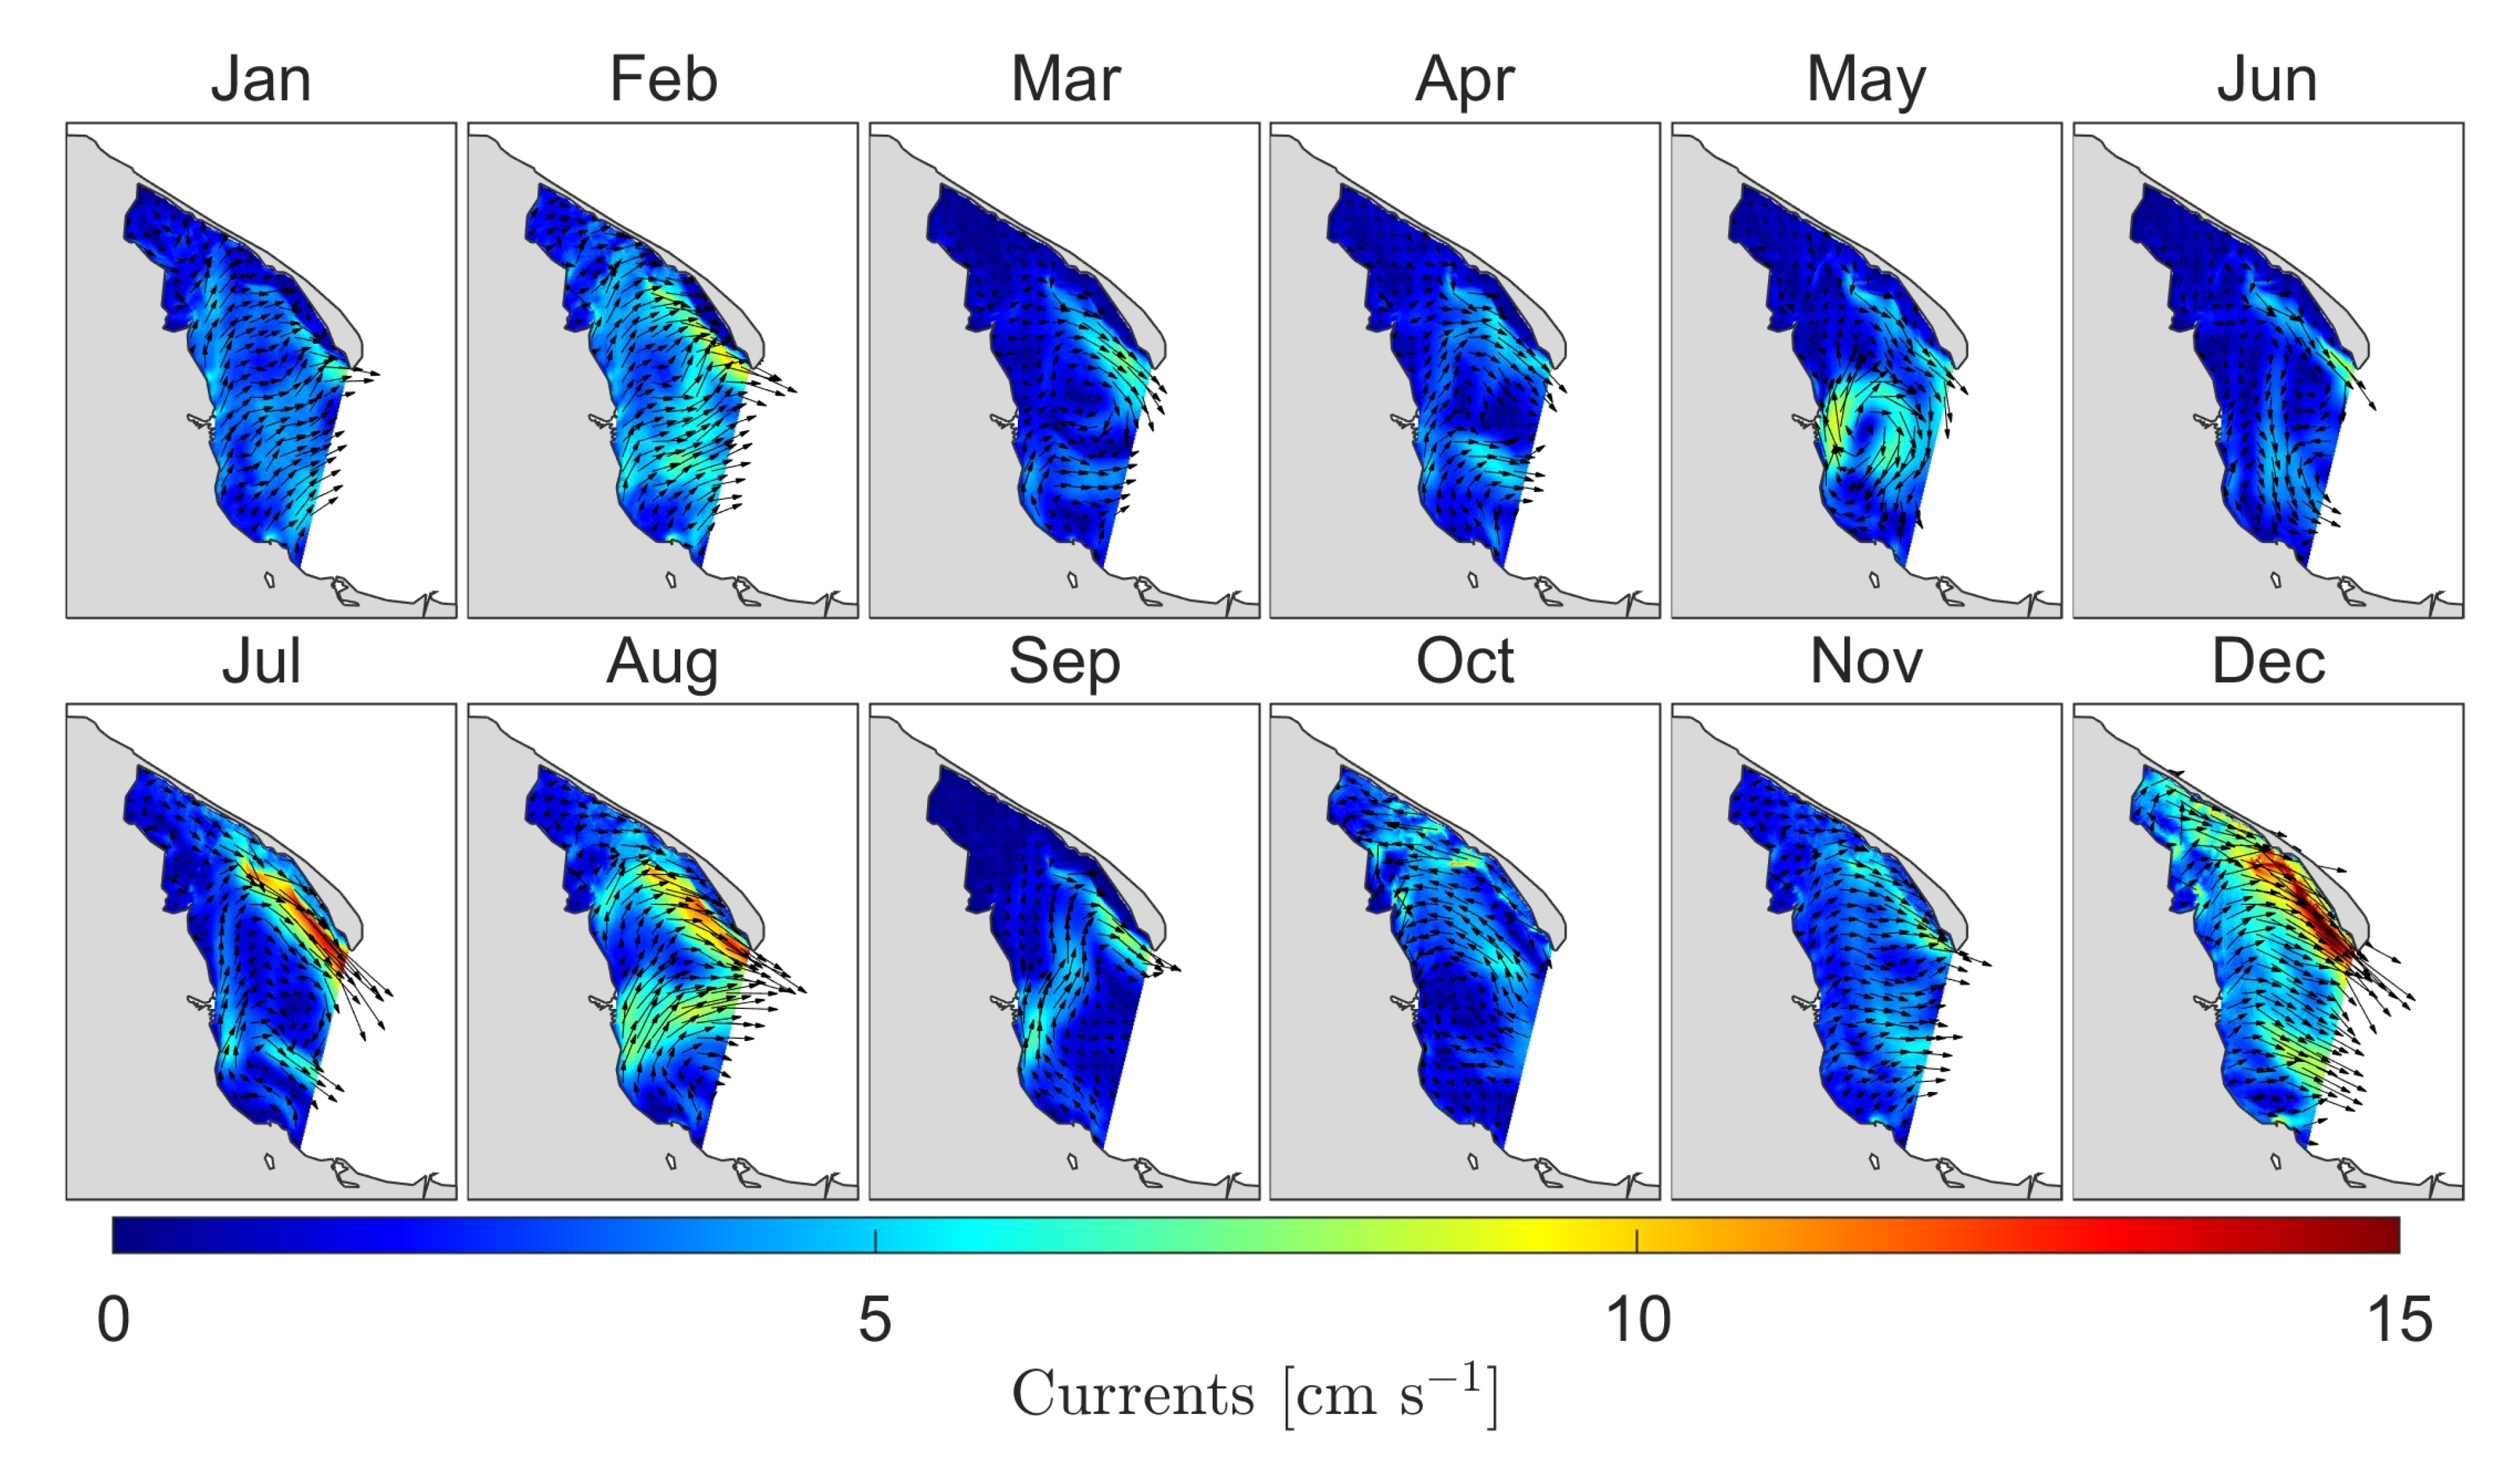
3.3. Prognostic Model Parameters
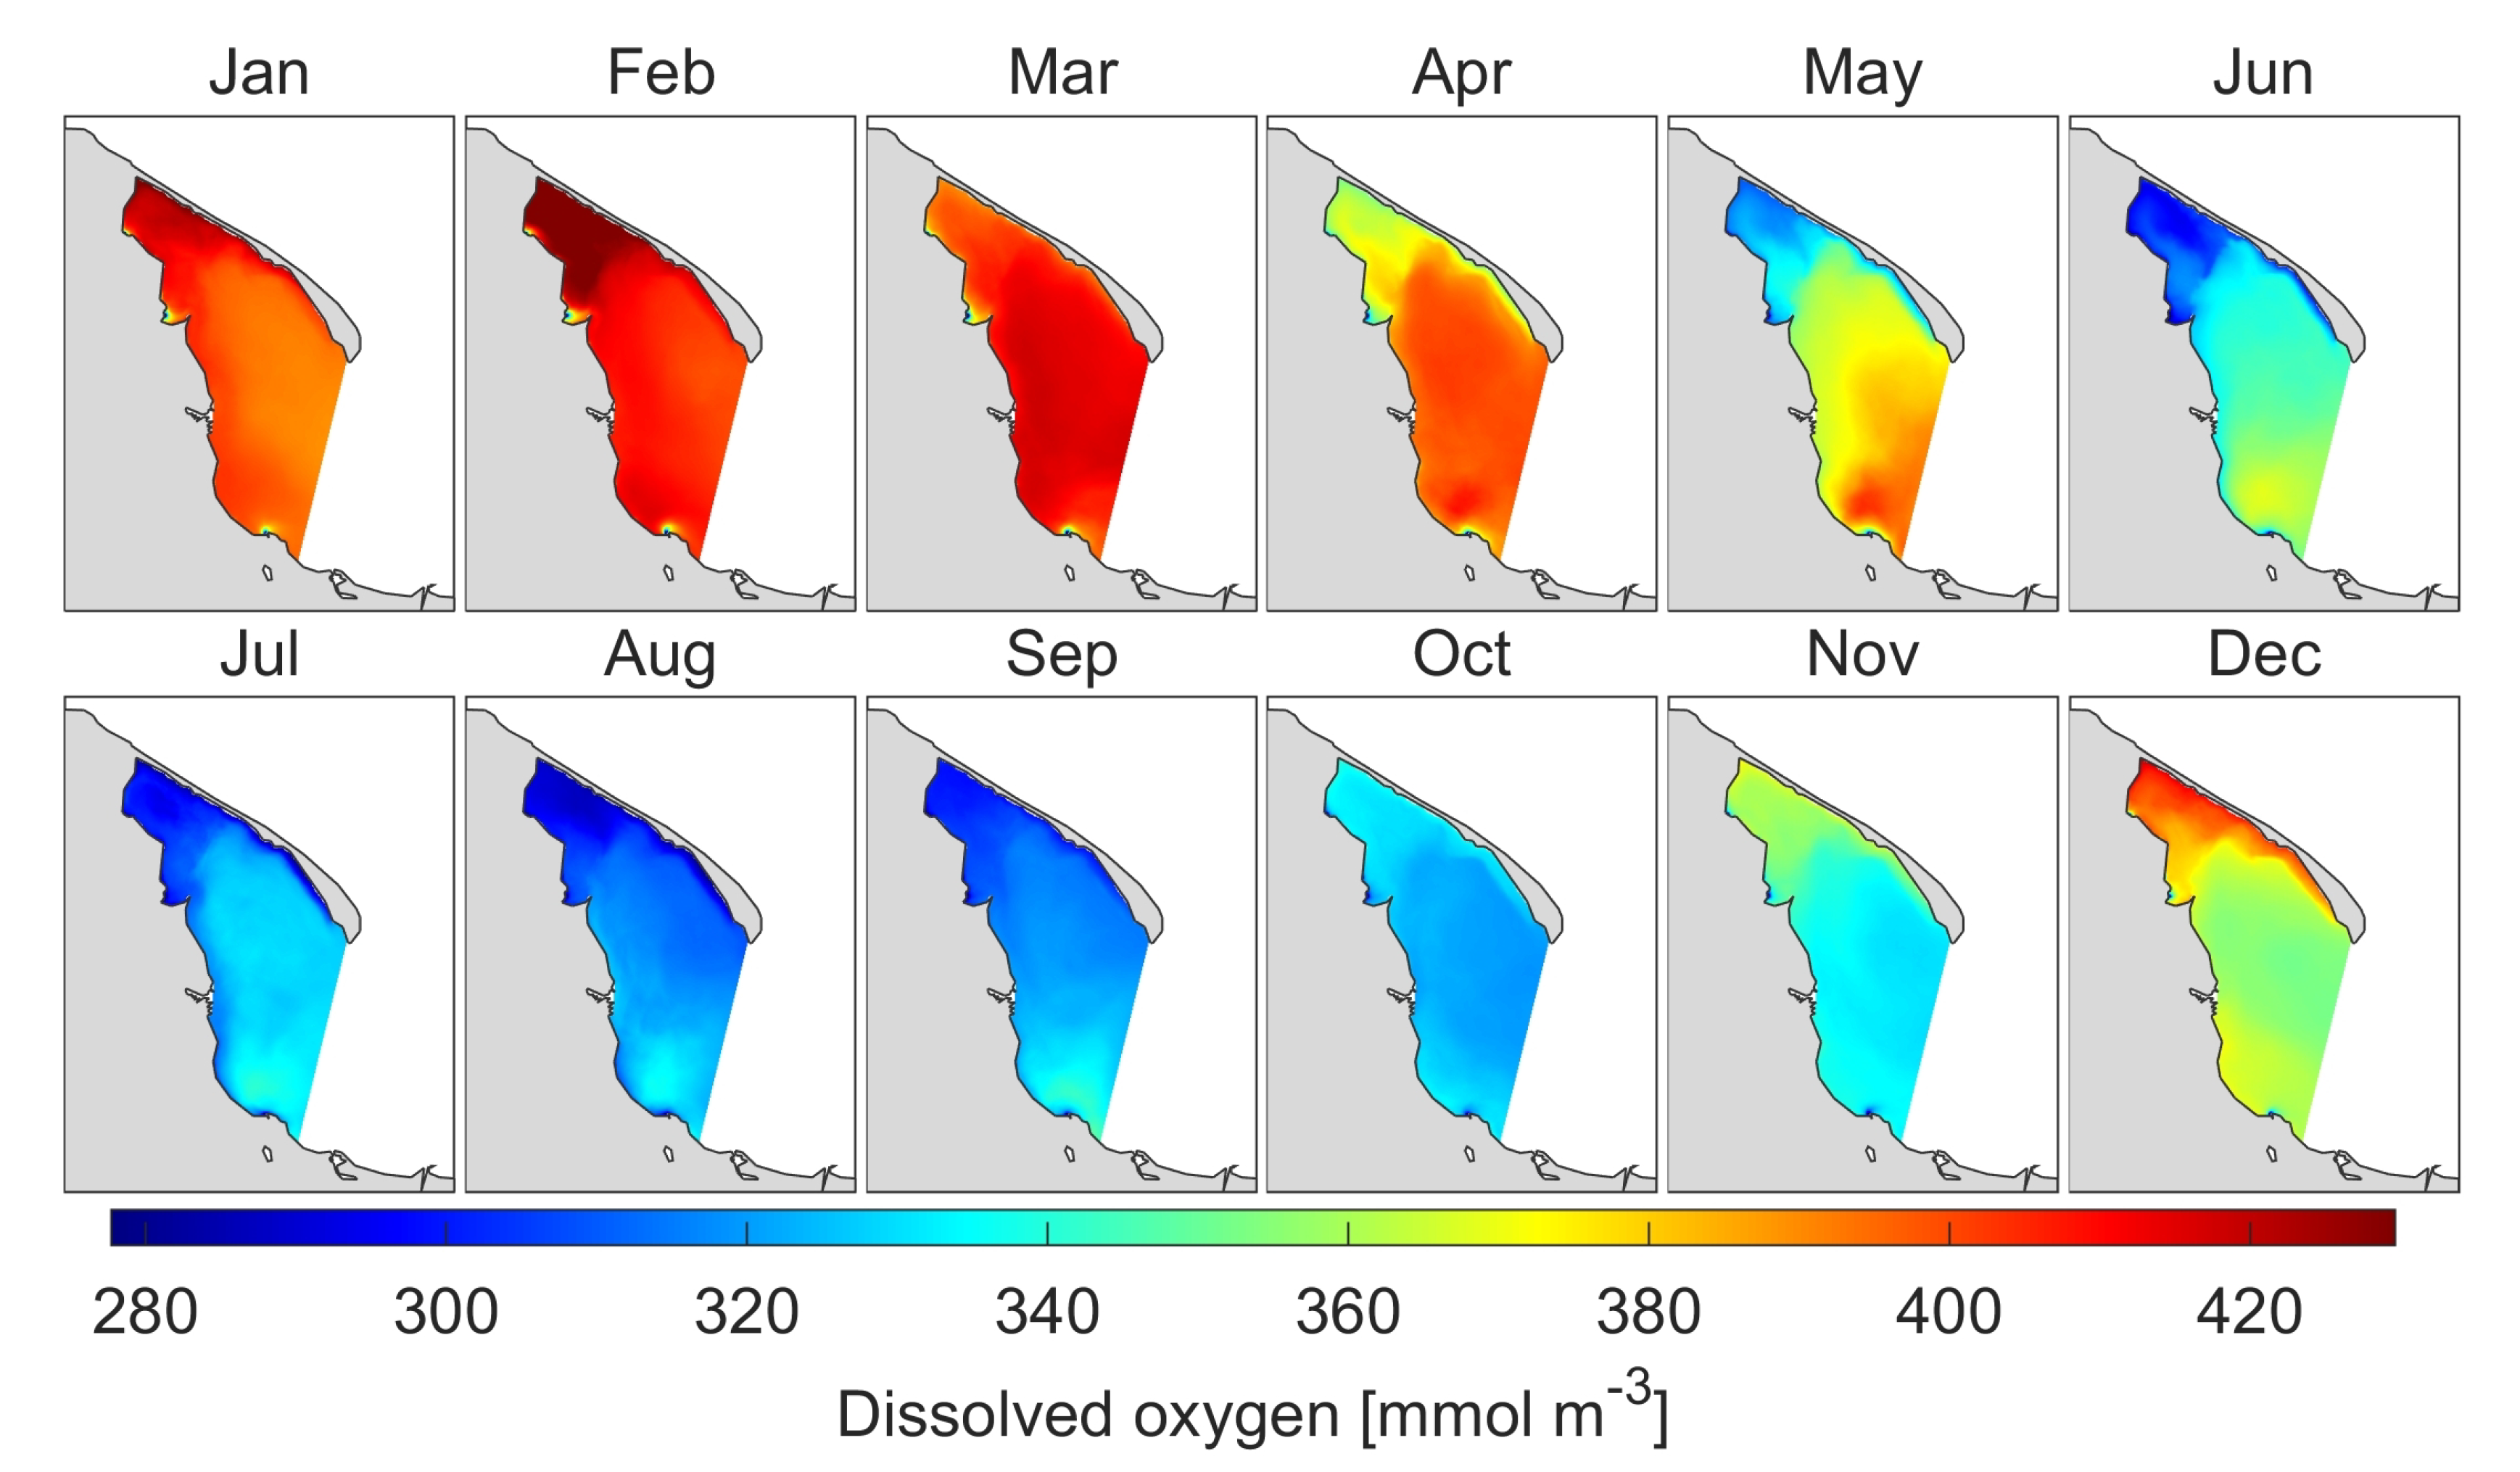
3.3.1. Dissolved Oxygen
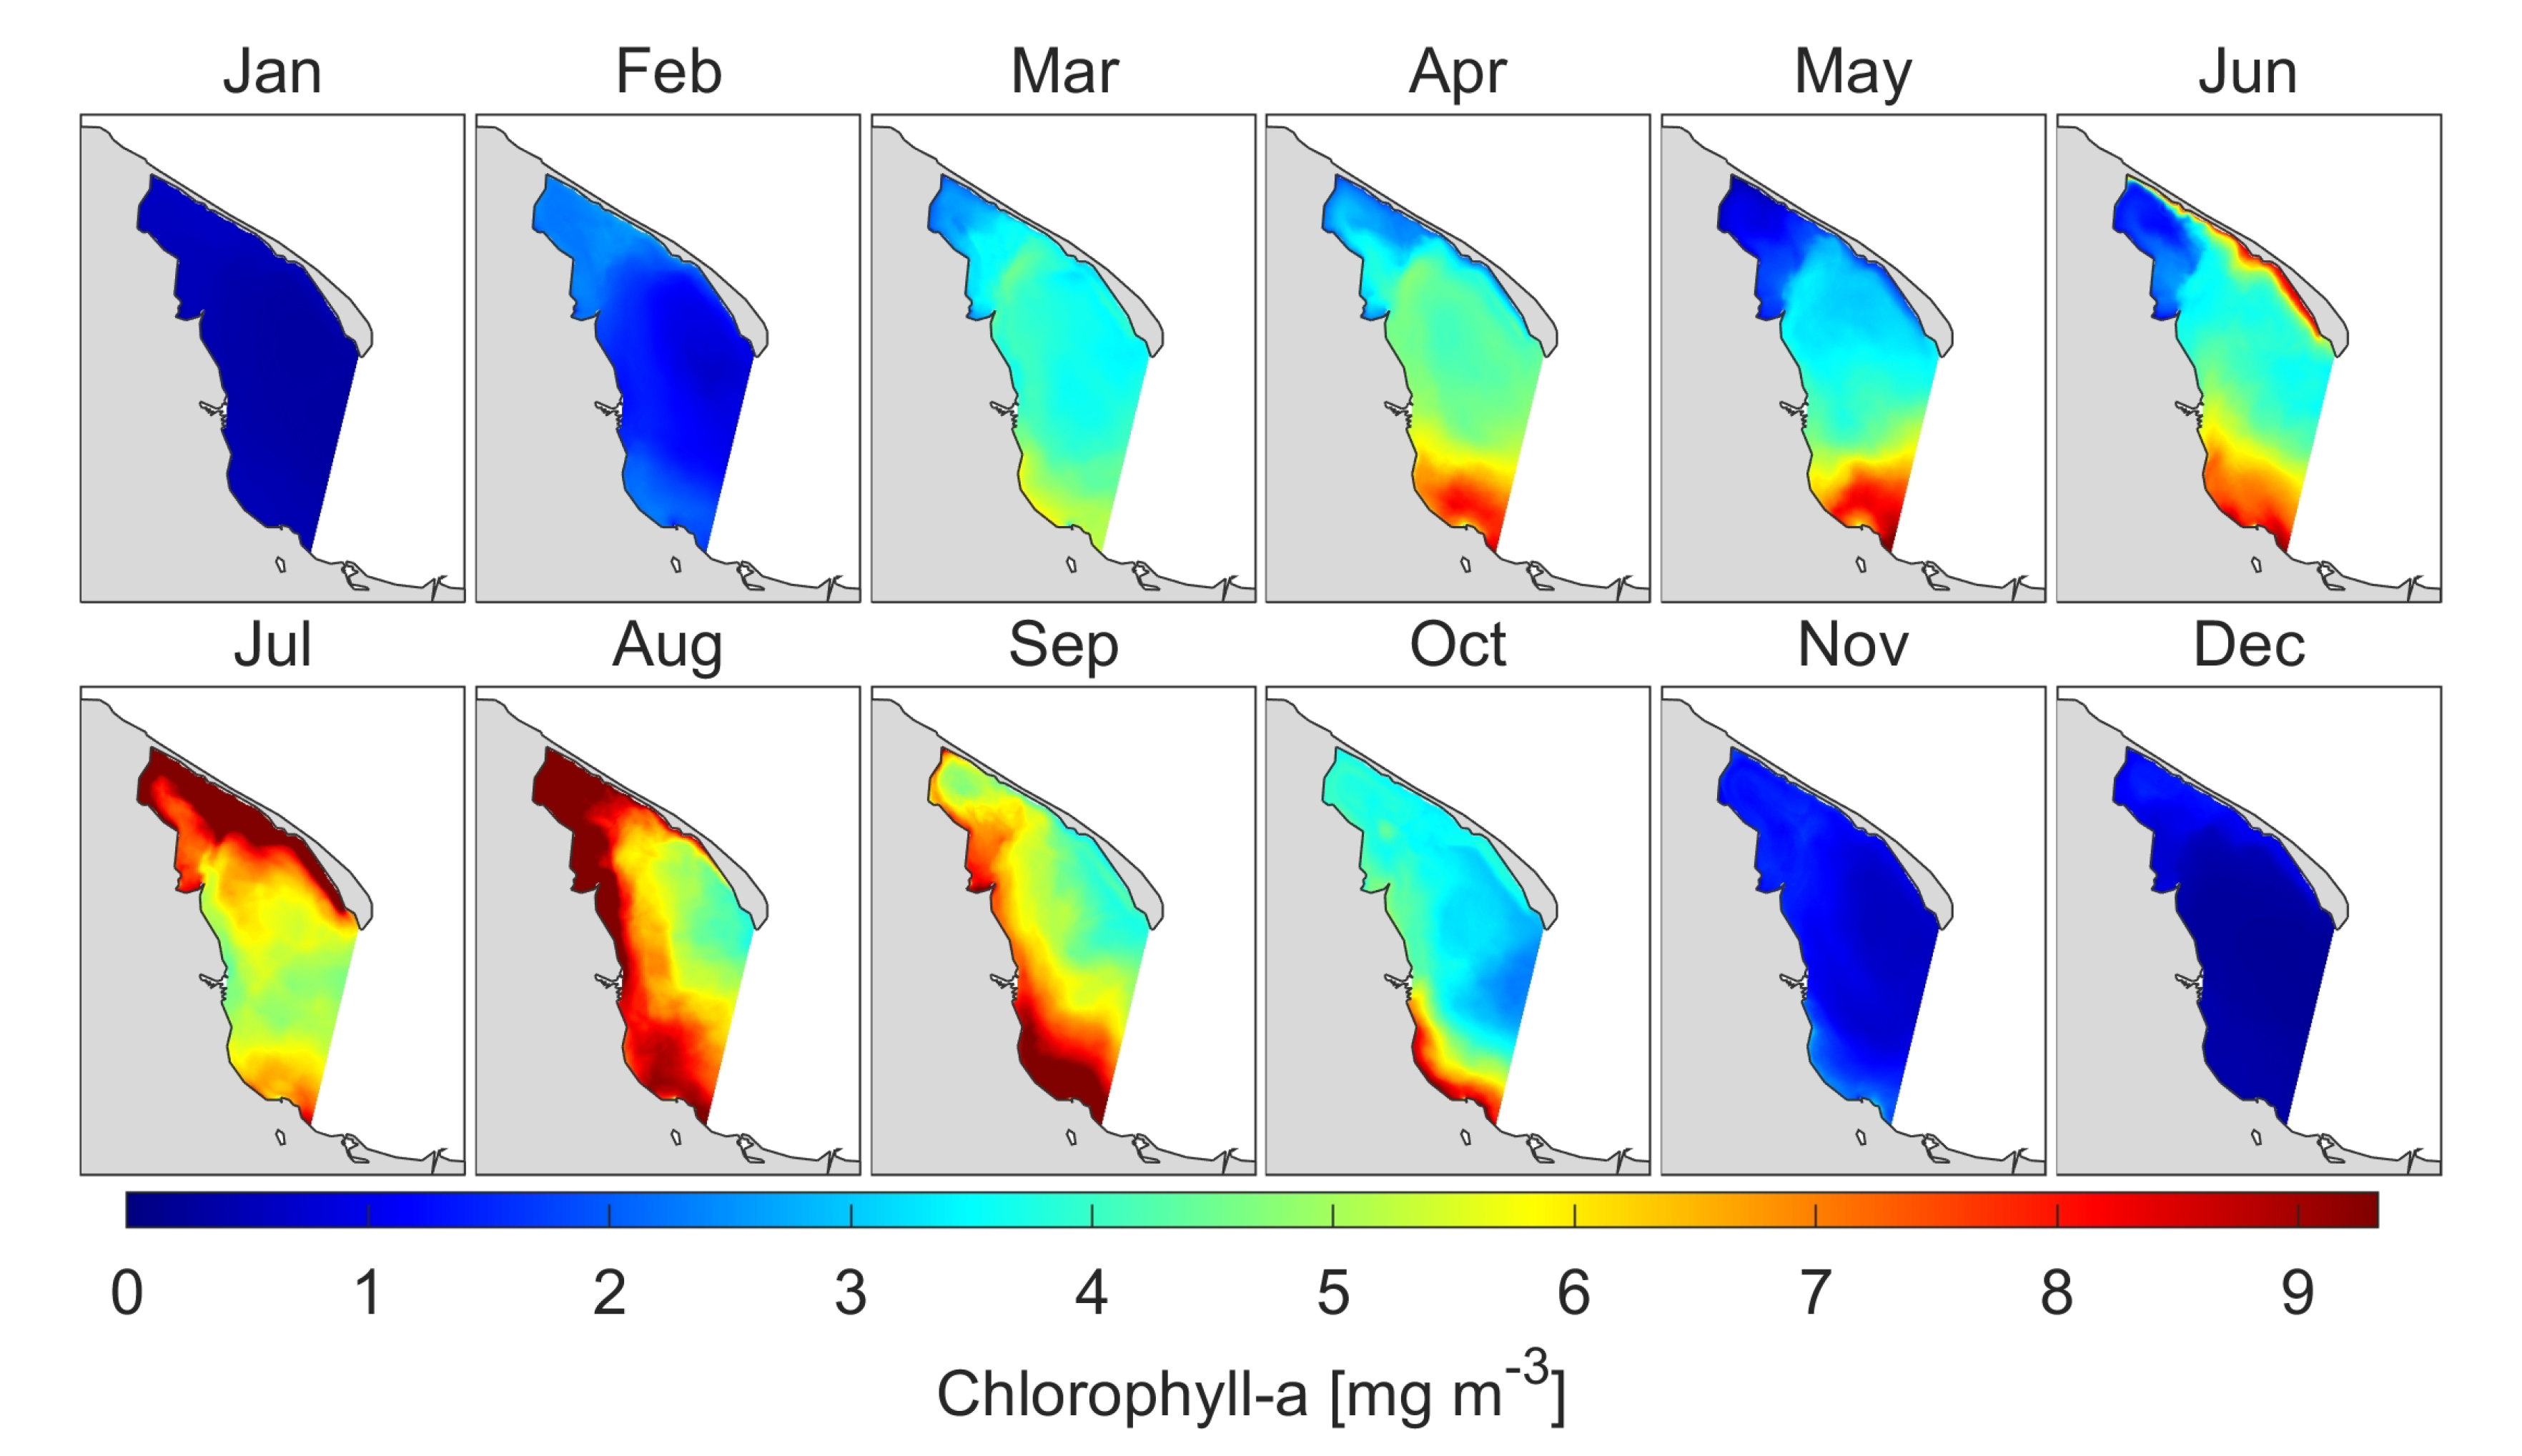
3.3.2. Chlorophyll-a
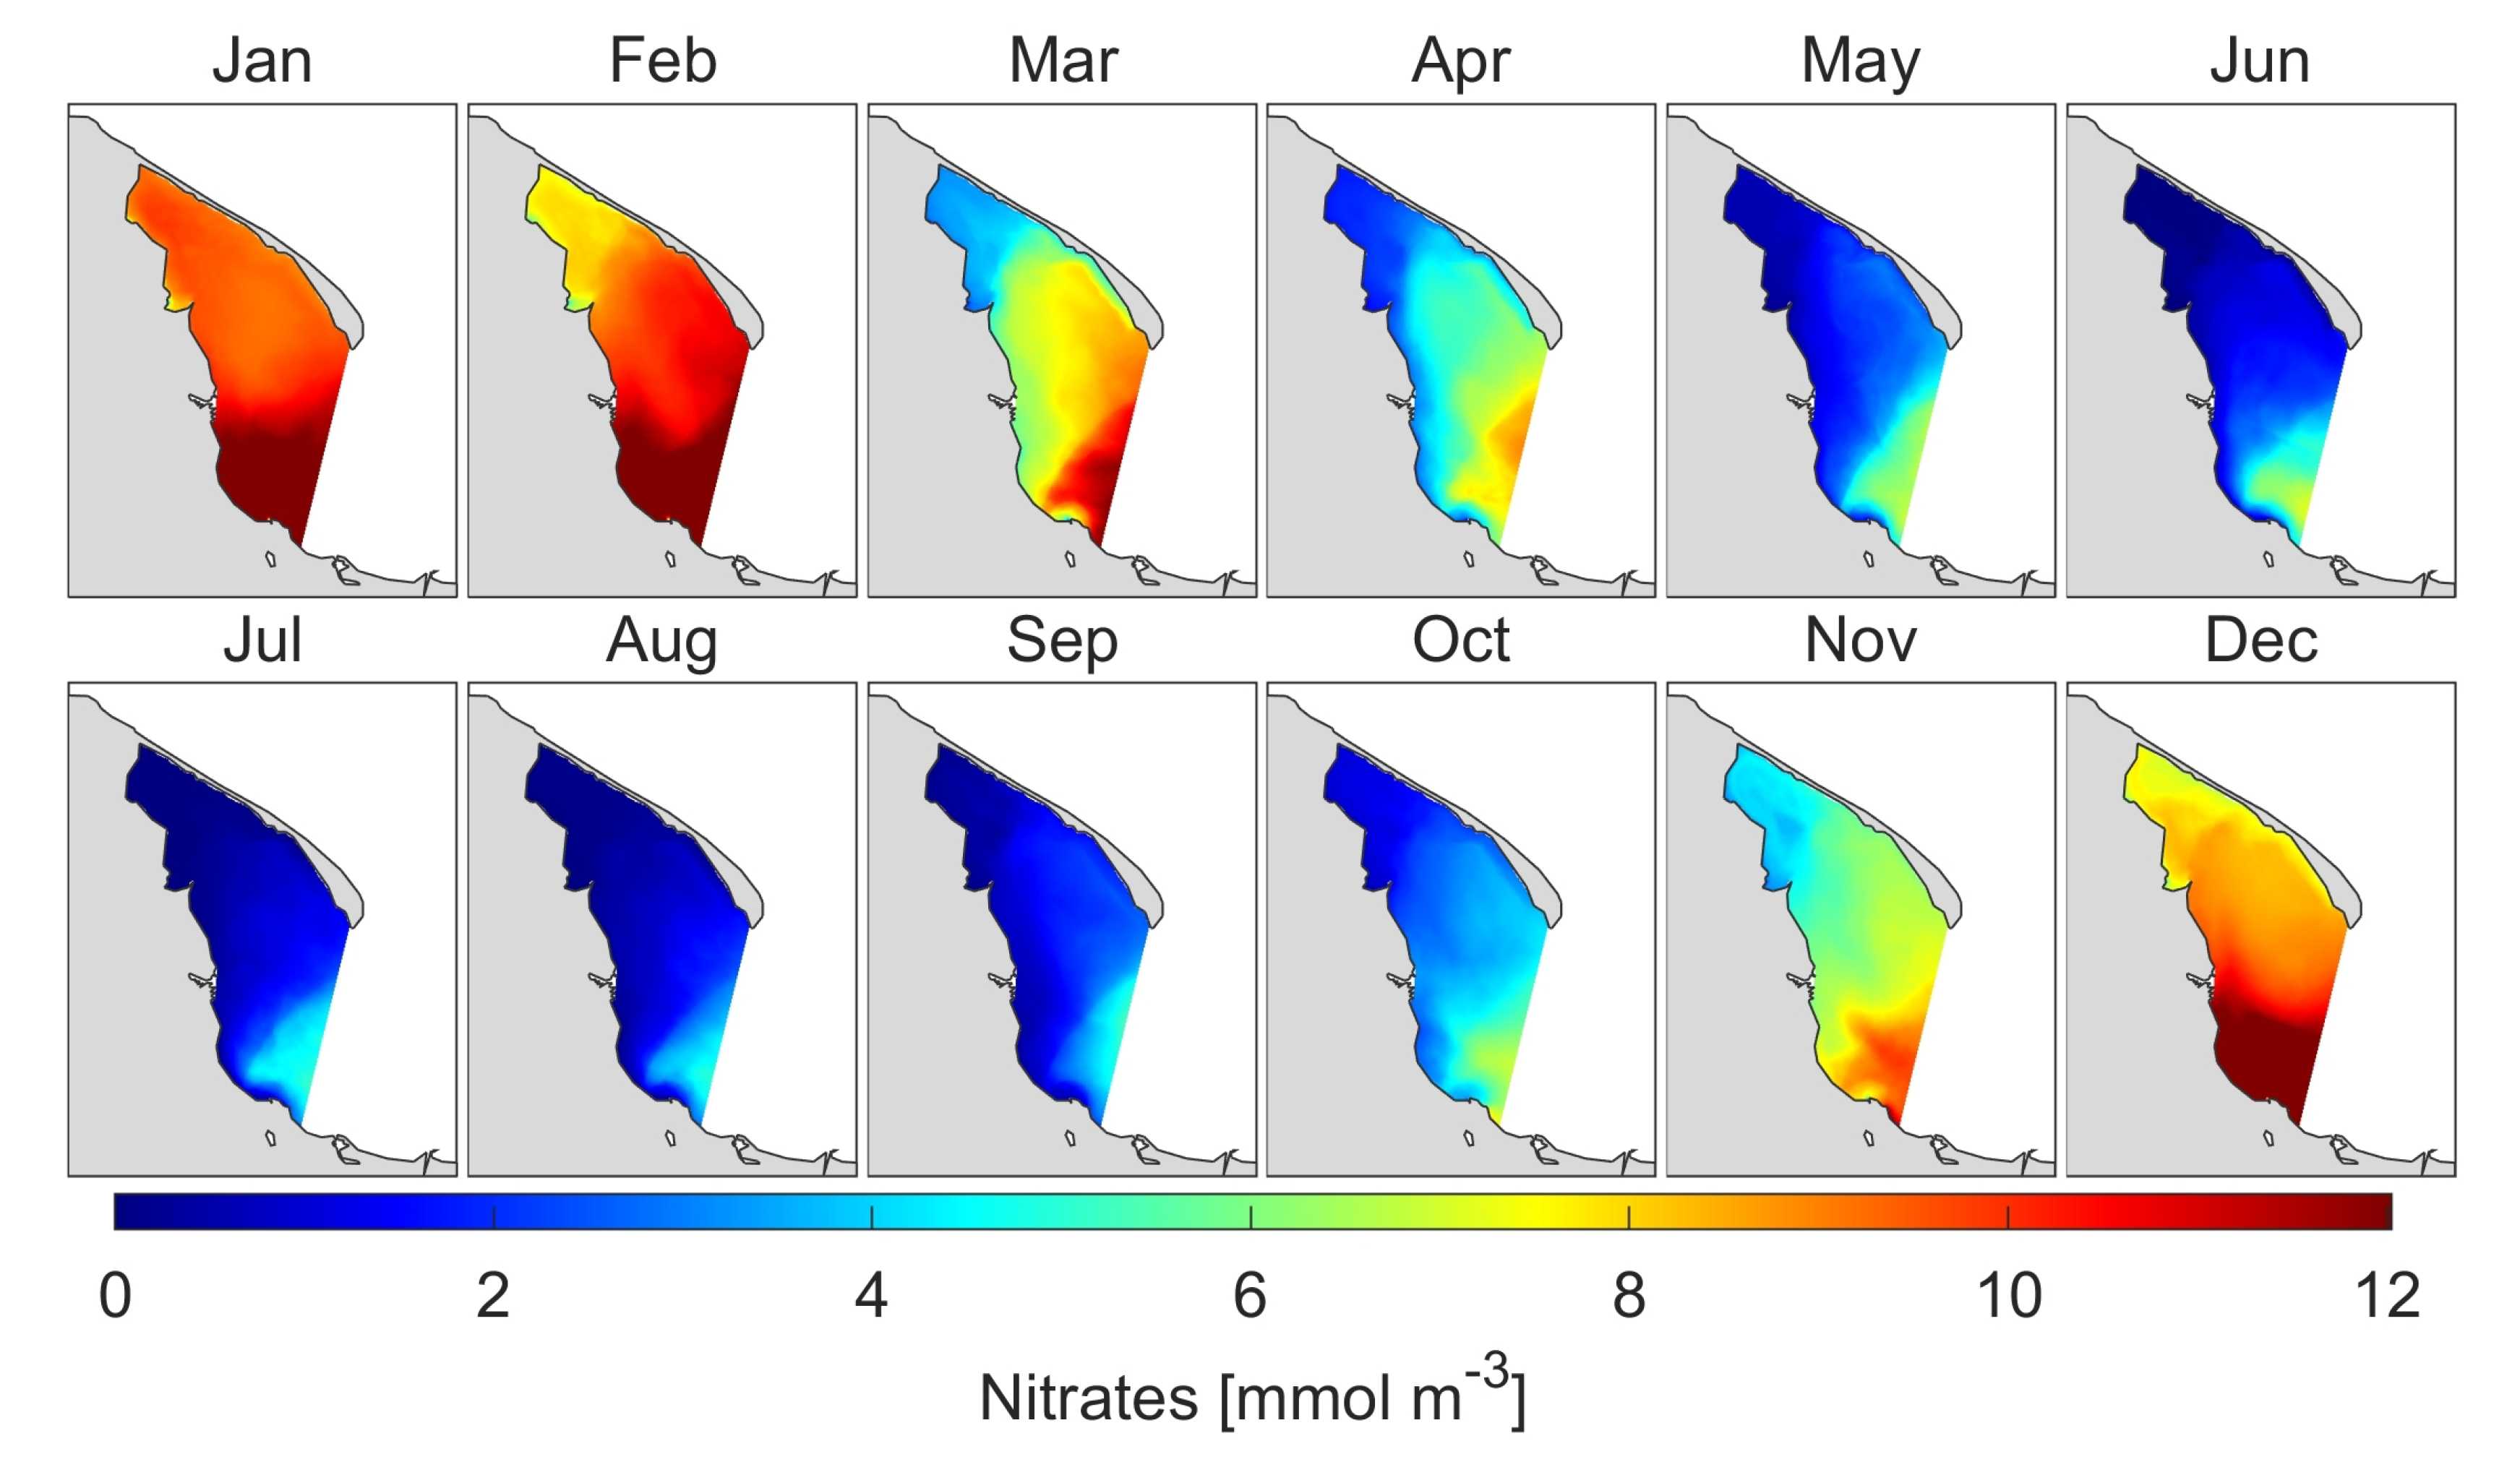
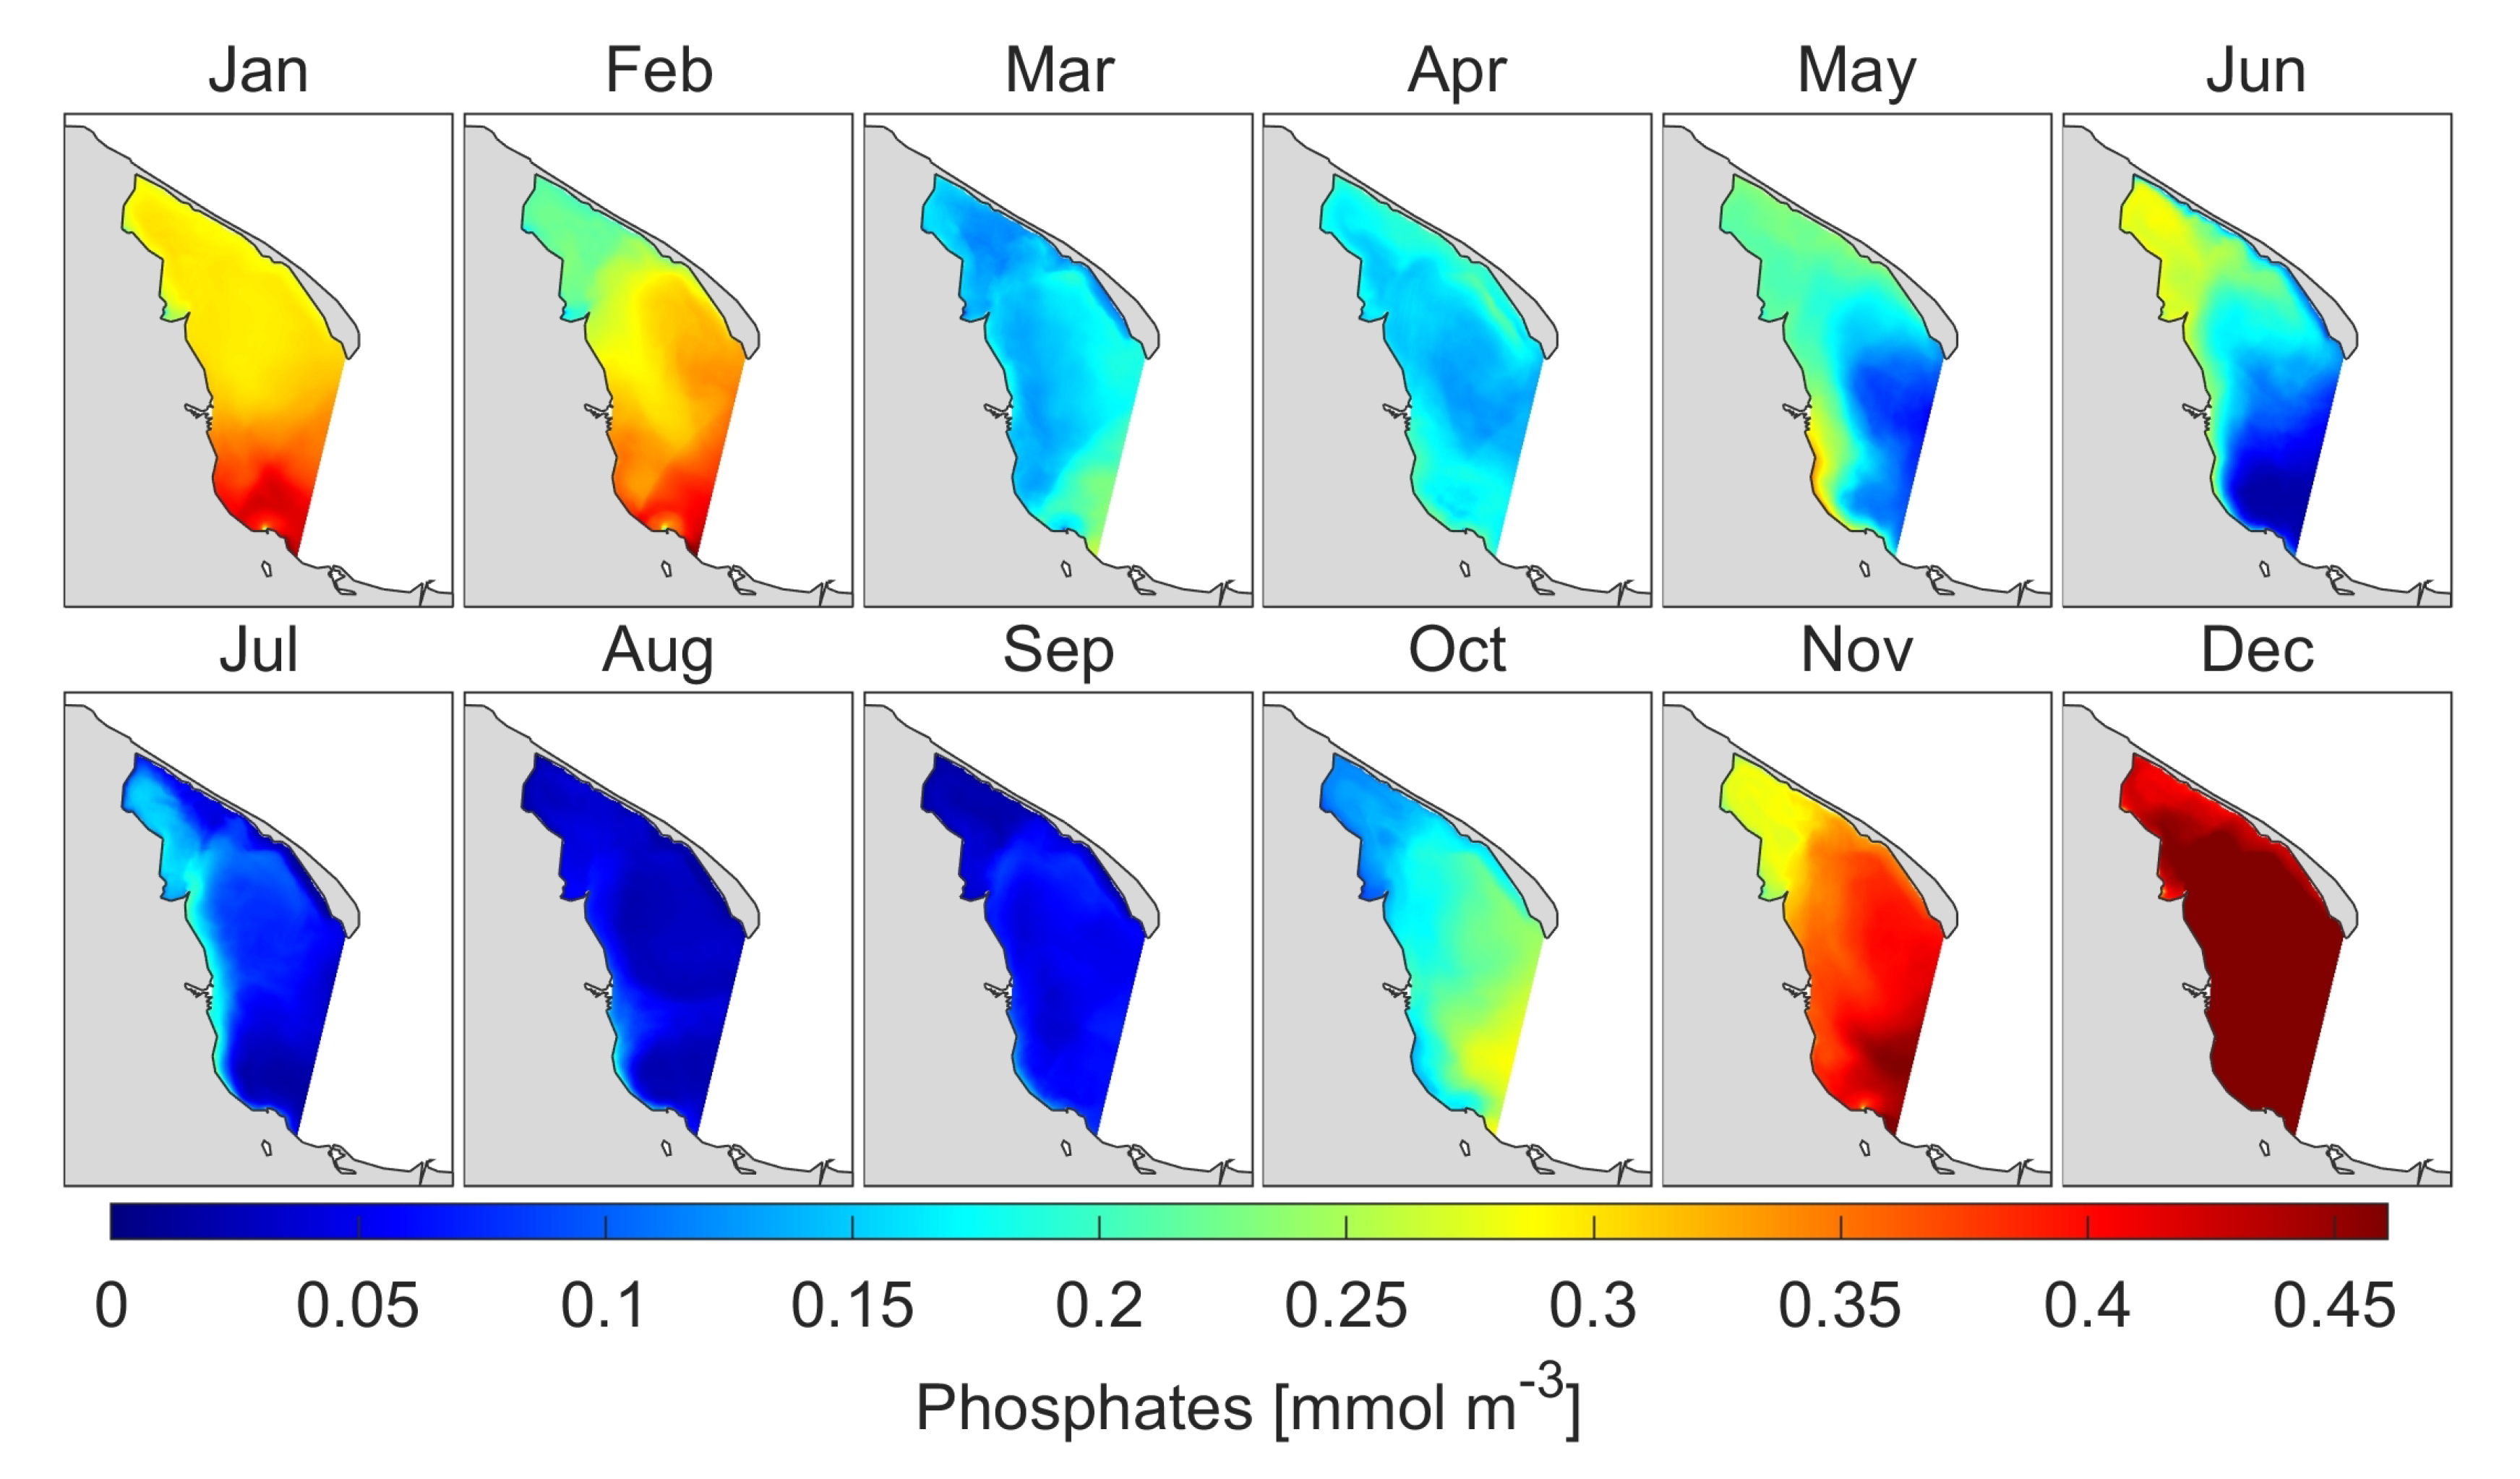
3.3.3. Nutrients
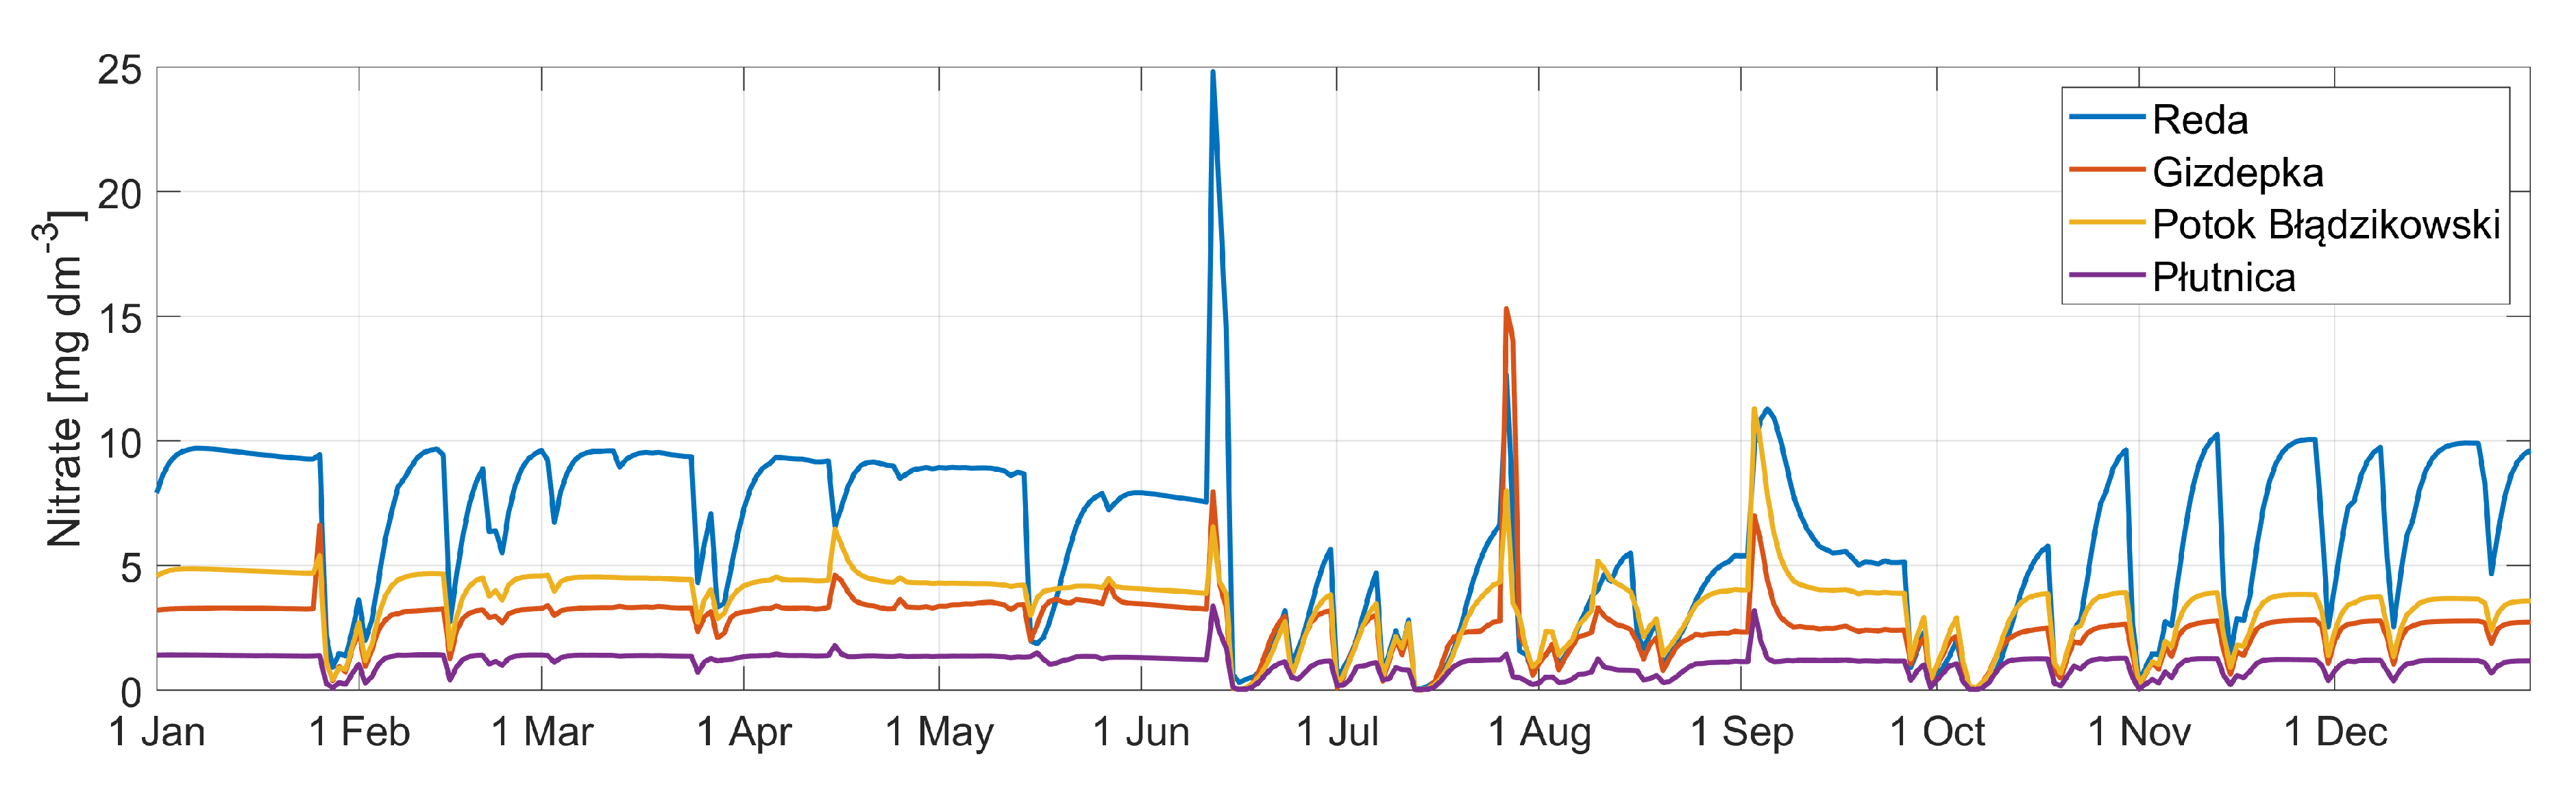
Nitrates
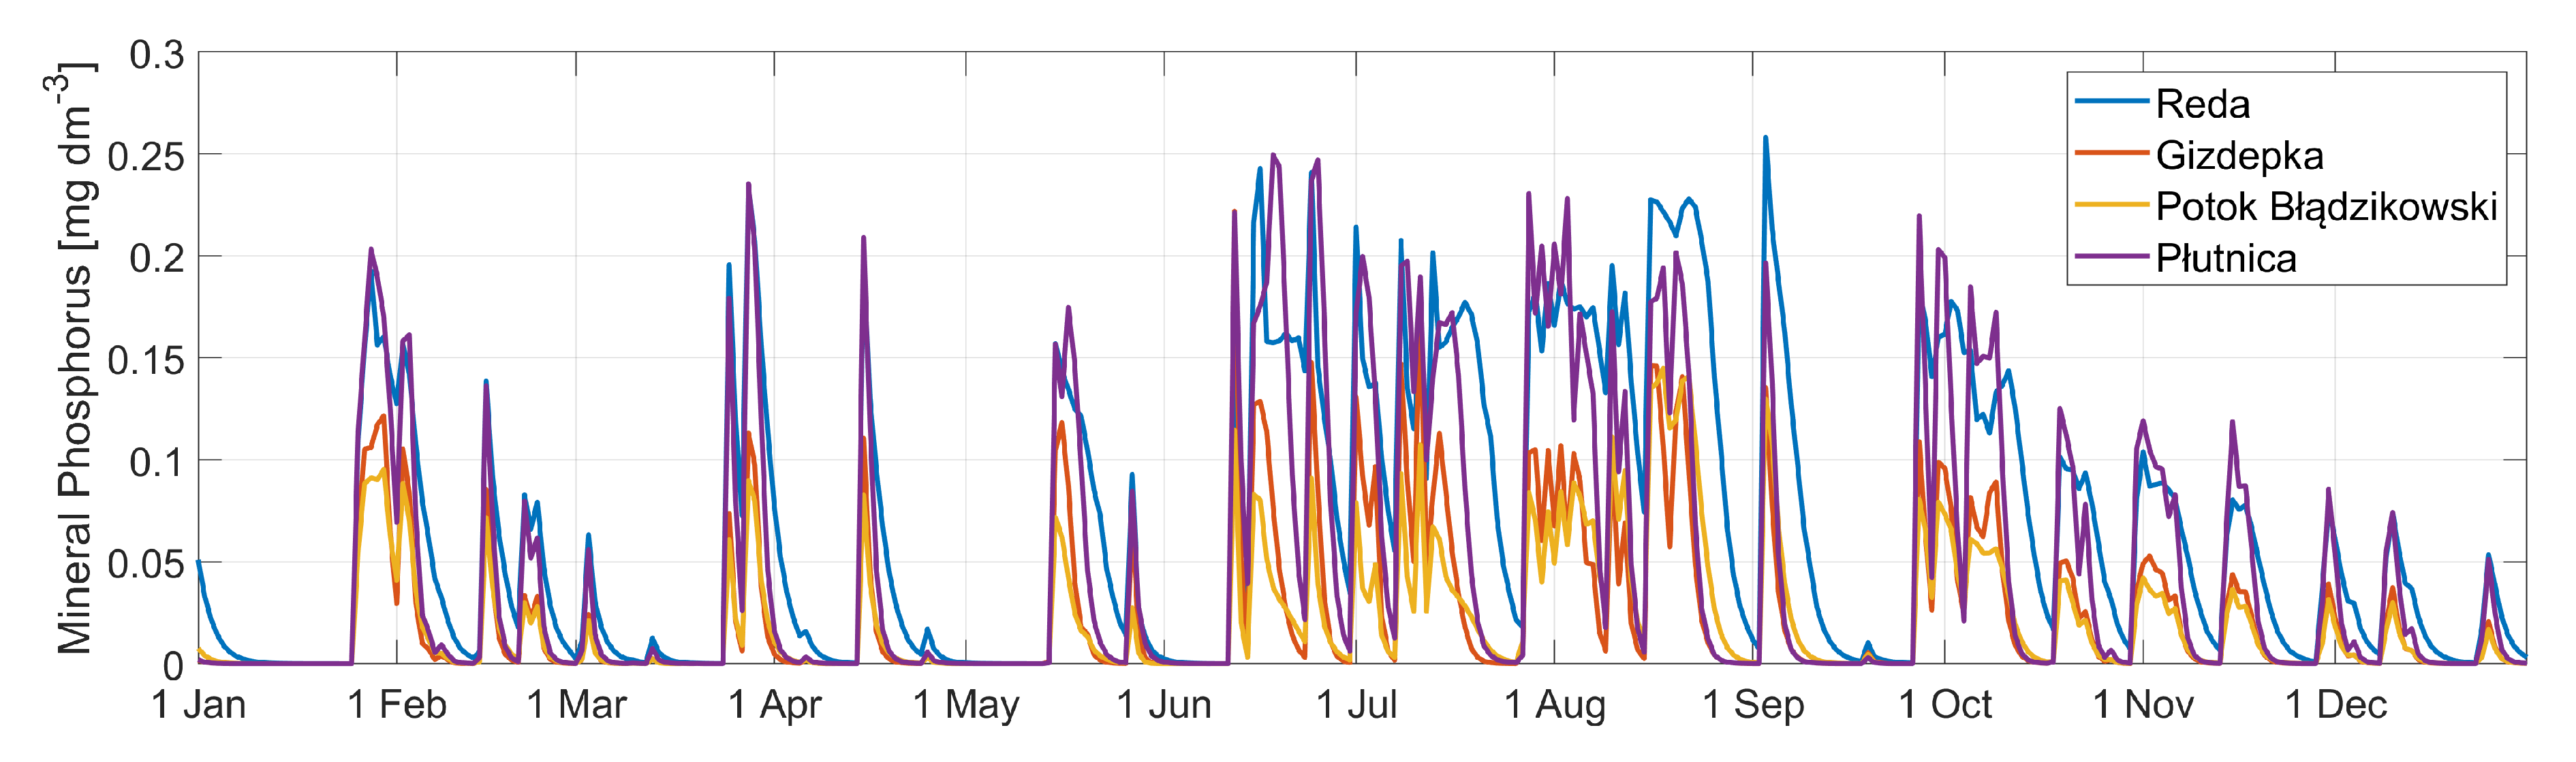
Phosphates
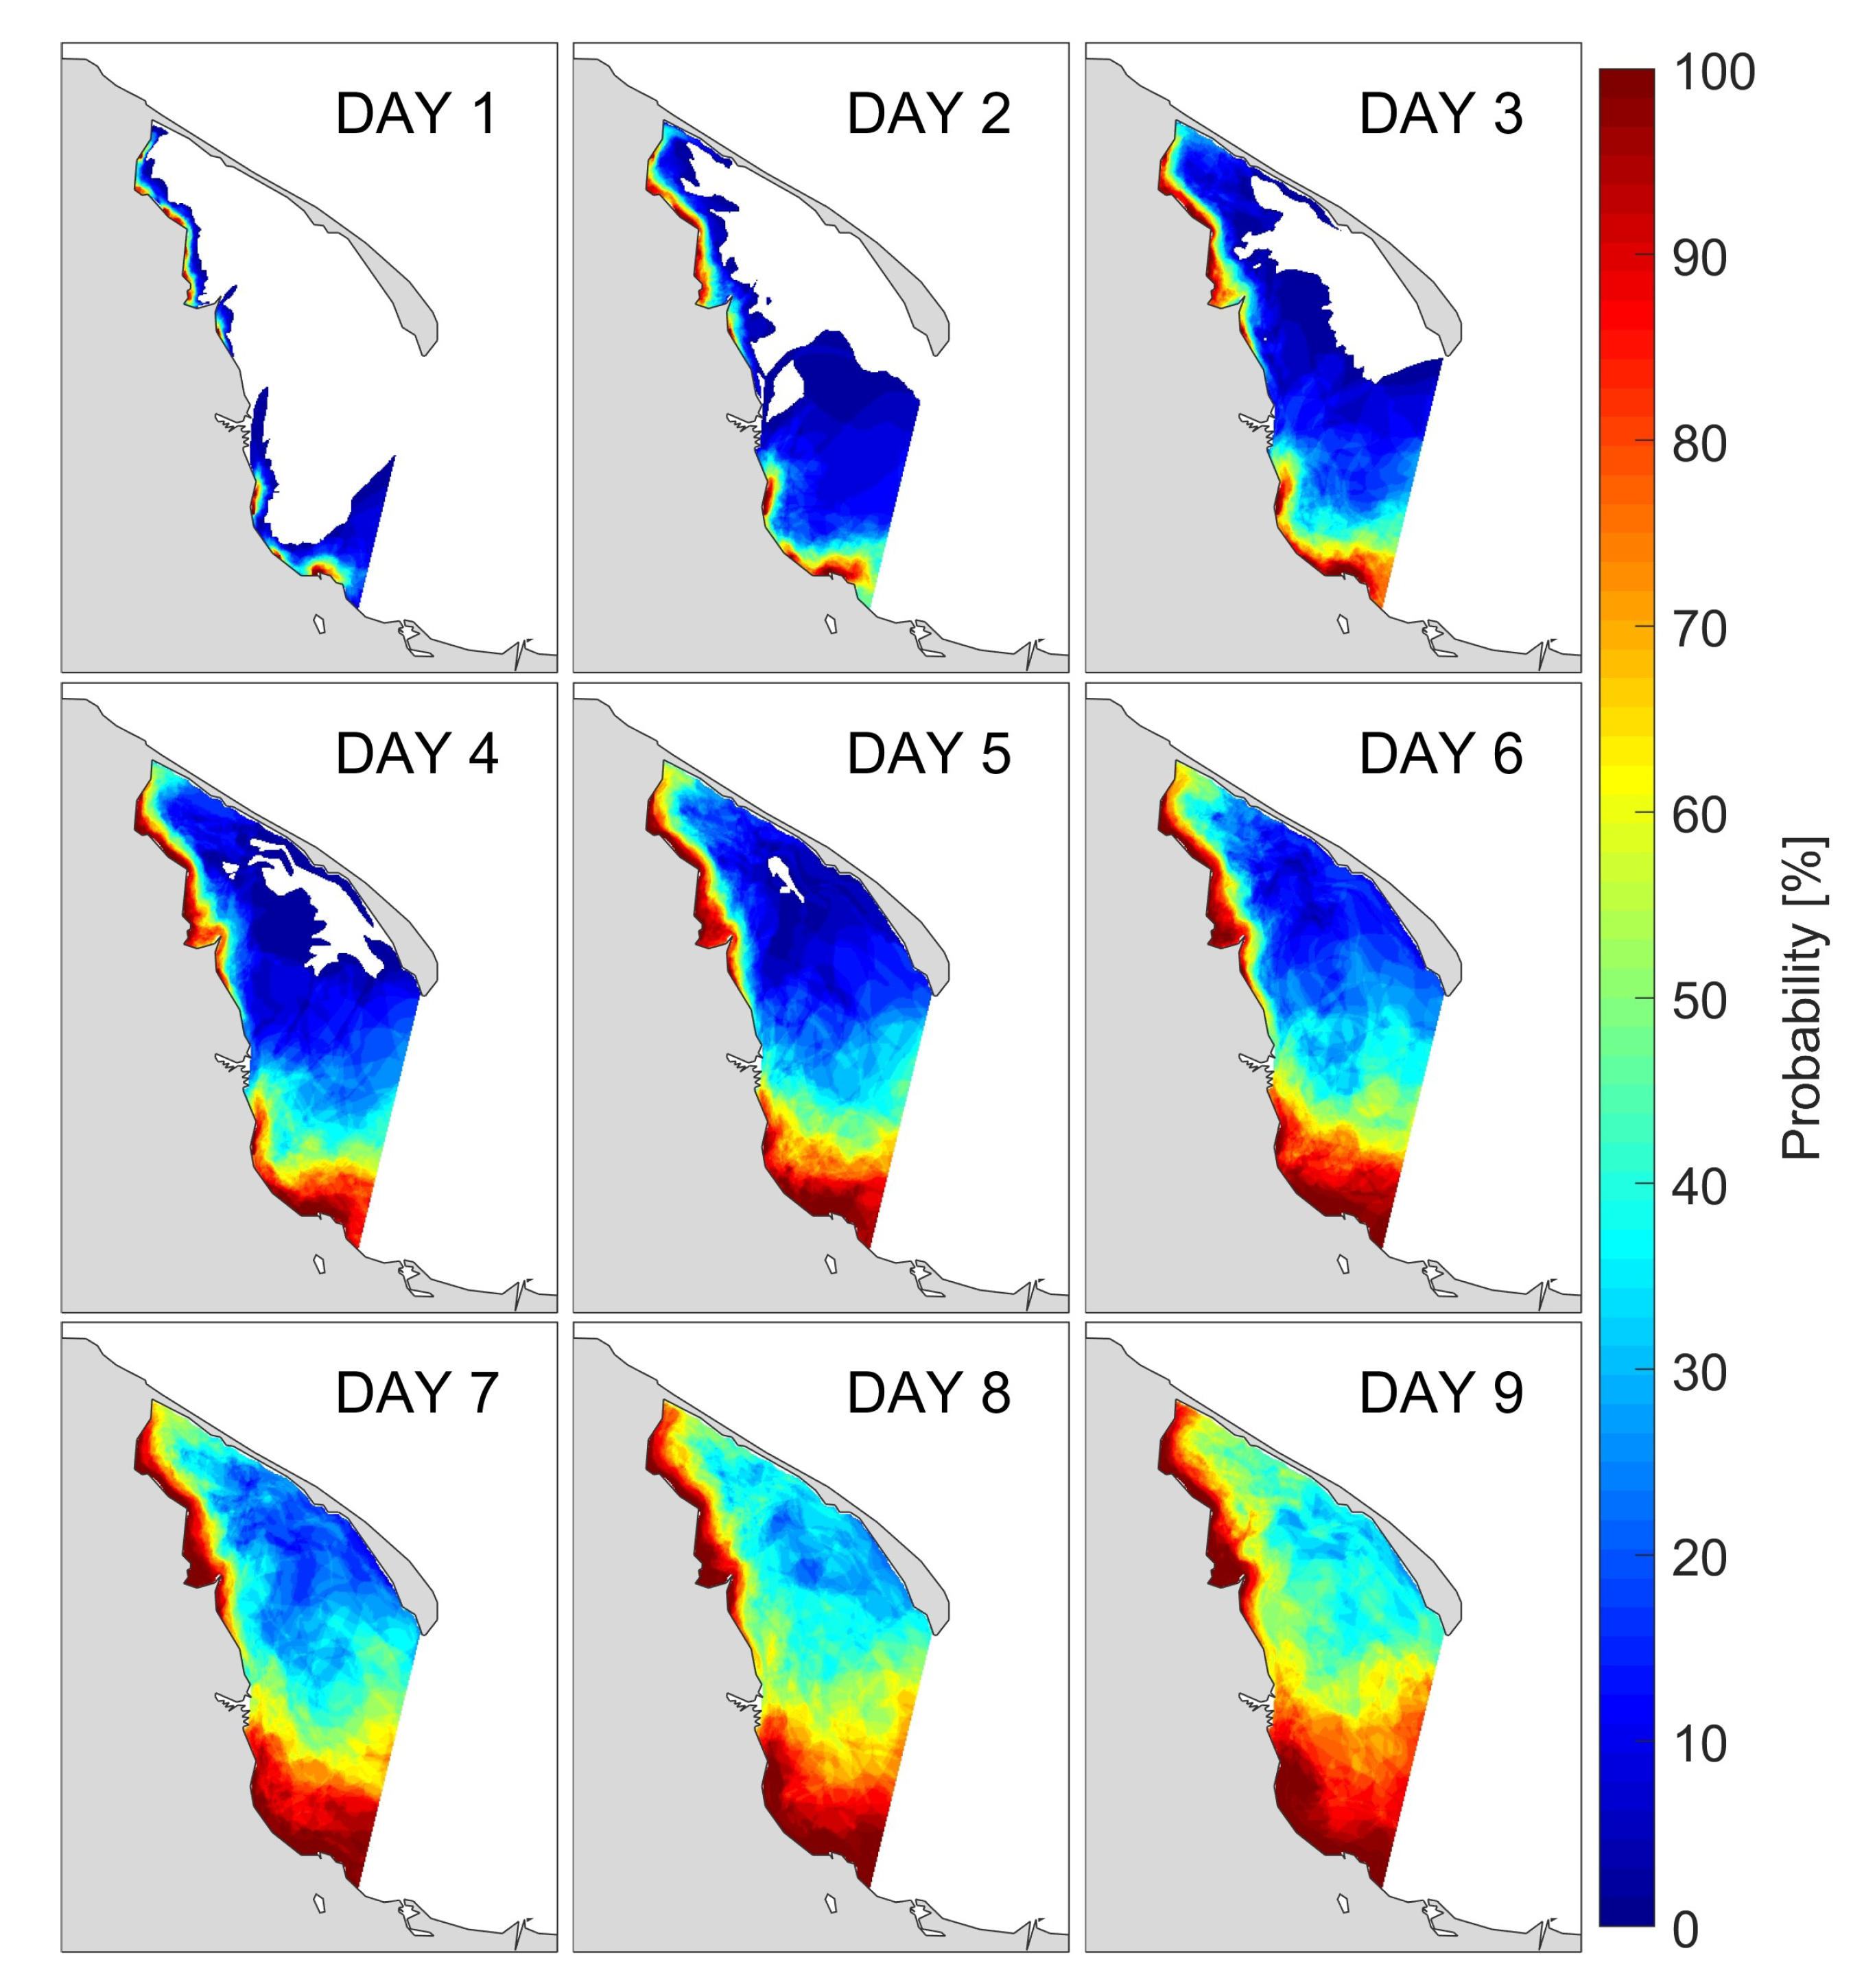
3.4. Nutrient Spread
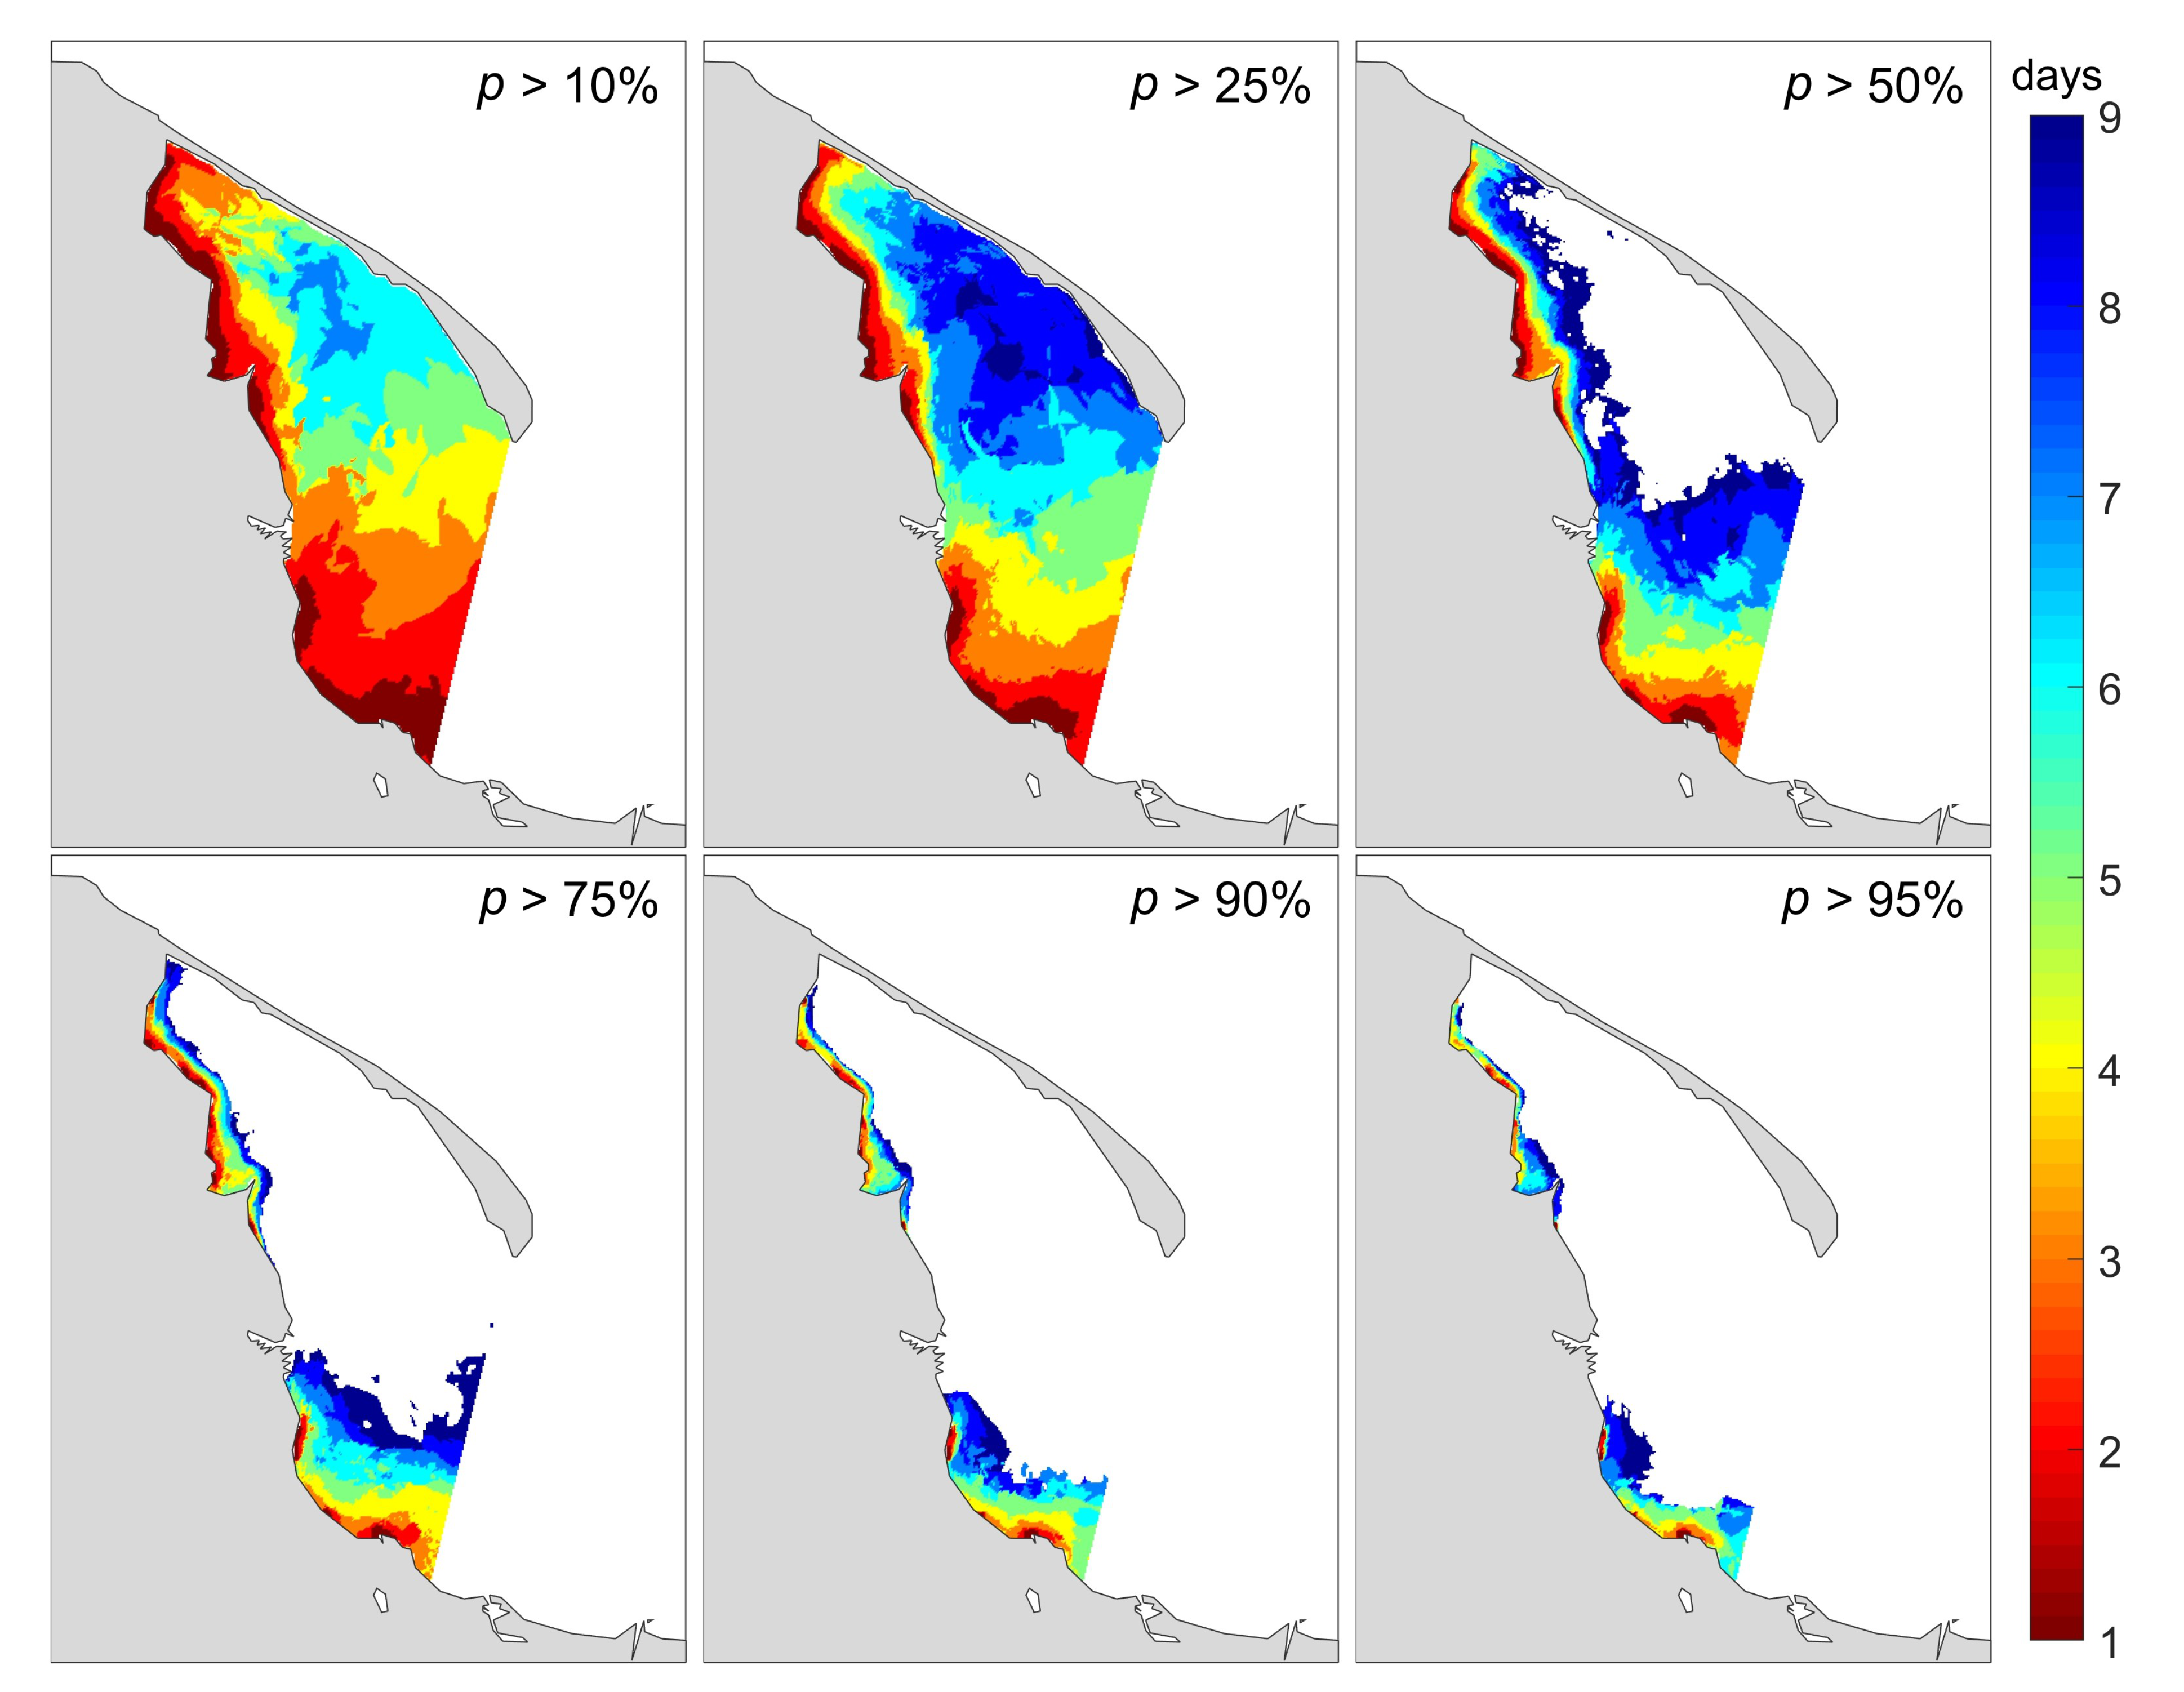
3.5. Pesticides
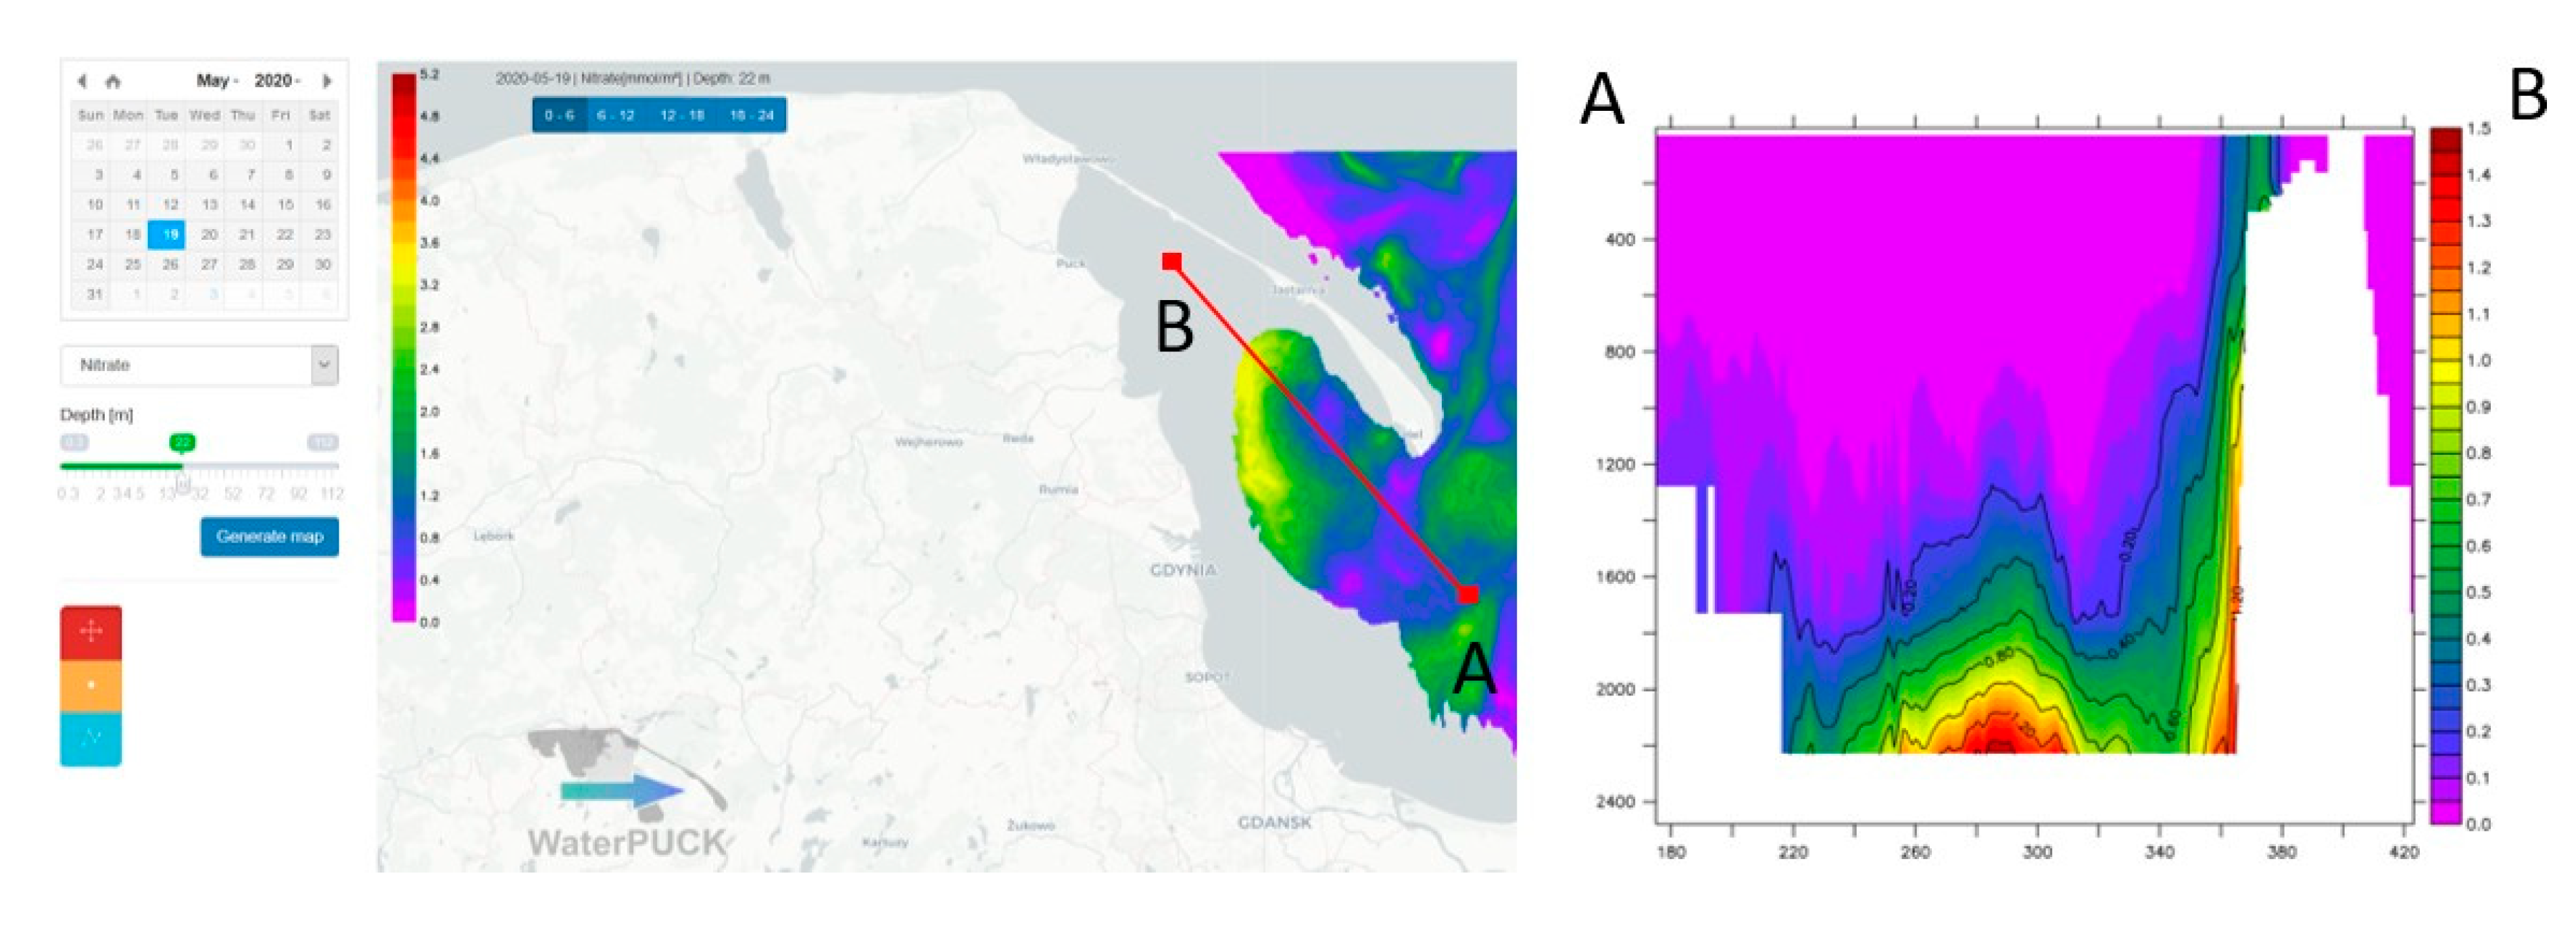
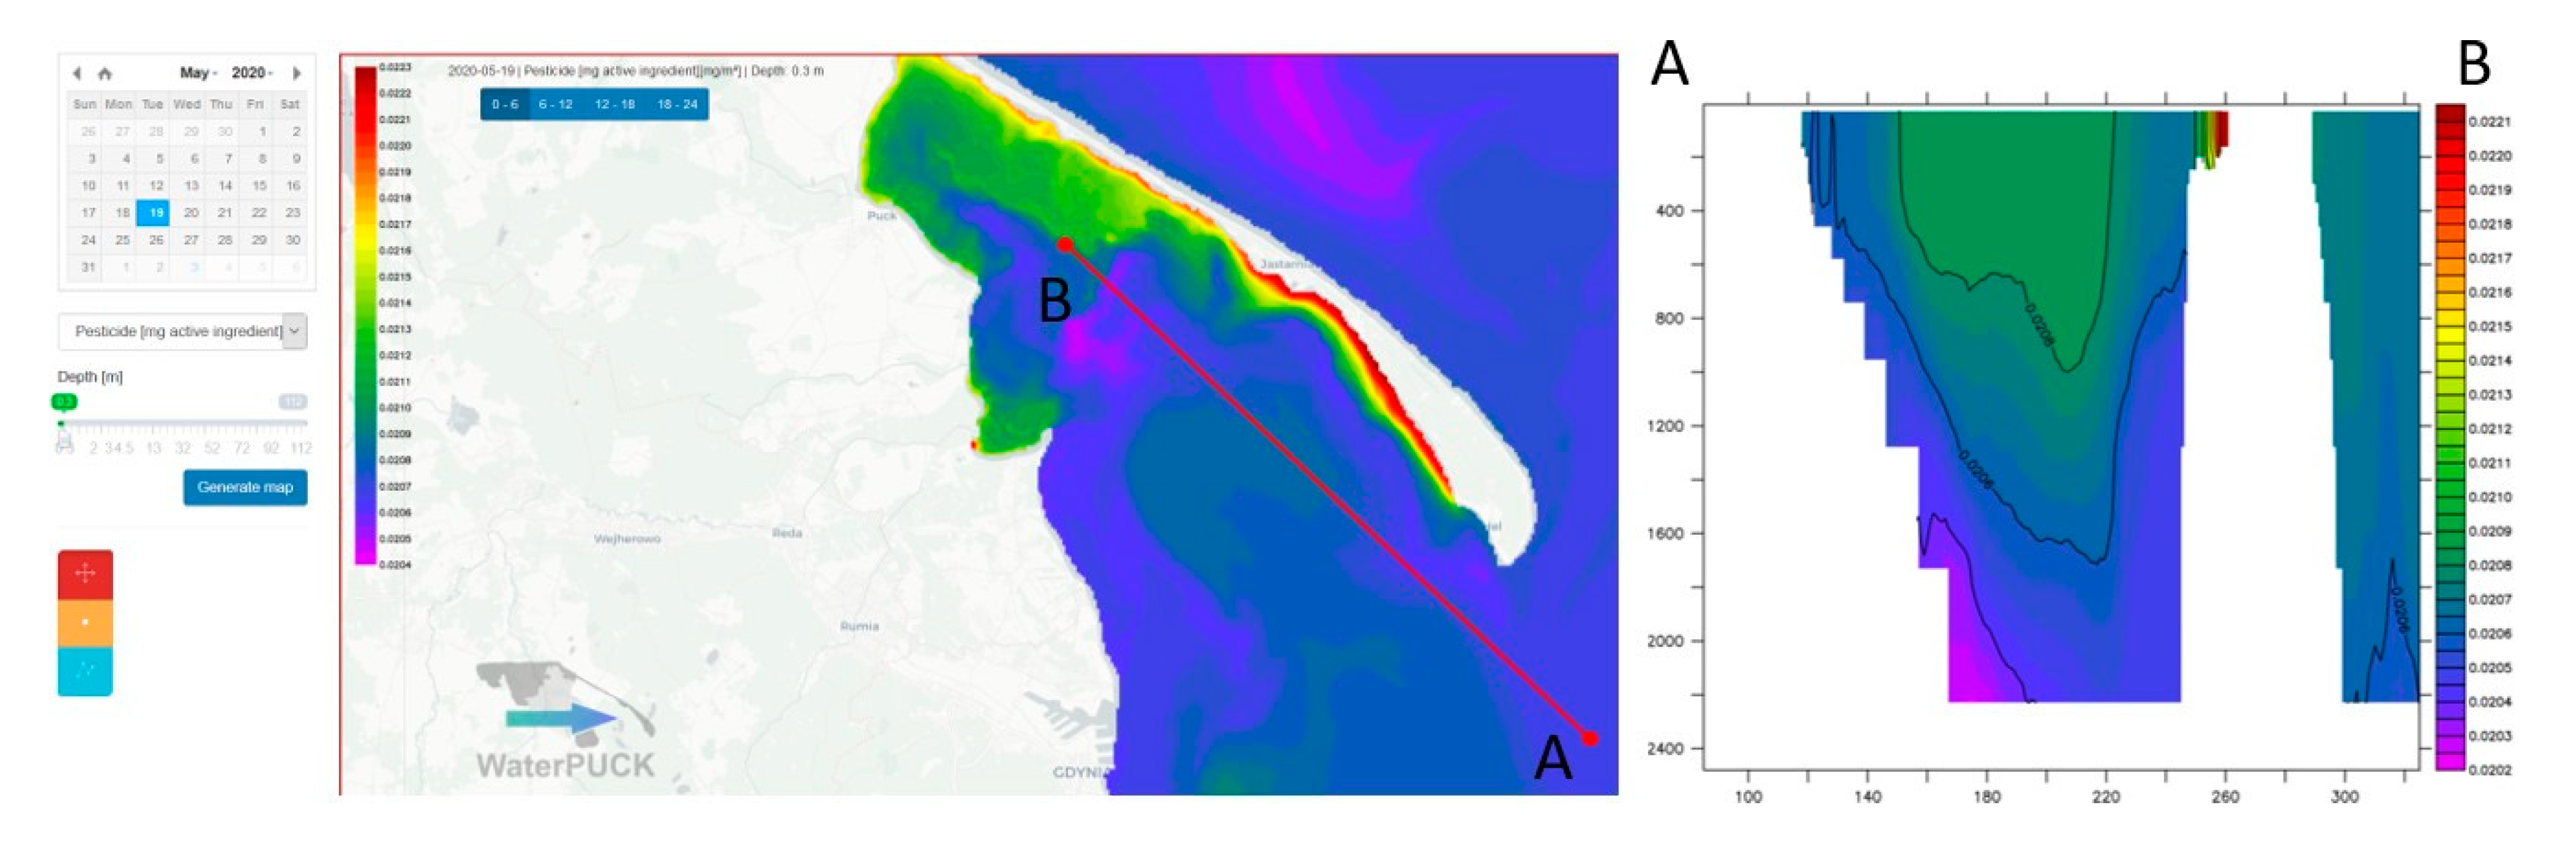
3.6. Web Portal
4. Discussion
4.1. Prognostic Model Parameters
4.2. Nutrient Spread and Pesticides Distribution
4.3. Web Portal
5. Conclusions
Author Contributions
Funding
Acknowledgments
Conflicts of Interest
References
- Dybowski, D.; Jakacki, J.; Janecki, M.; Nowicki, A.; Rak, D.; Dzierzbicka-Glowacka, L. High-Resolution Ecosystem Model of the Puck Bay (Southern Baltic Sea)—Hydrodynamic Component Evaluation. Water 2019, 11, 2057. [Google Scholar] [CrossRef] [Green Version]
- Dzierzbicka-Glowacka, L.; Janecki, M.; Szymczycha, B.; Dybowski, D.; Nowicki, A.; Kłostowska, Z.; Obarska-Pempkowiak, H.; Zima, P.; Jaworska-Szulc, B.; Jakacki, J.; et al. Integrated information and prediction Web Service WaterPUCK General concept. MATEC Web Conf. 2018, 210, 02011. [Google Scholar] [CrossRef] [Green Version]
- Dzierzbicka-Głowacka, L.; Janecki, M.; Dybowski, D.; Szymczycha, B.; Obarska-Pempkowiak, H.; Wojciechowska, E.; Zima, P.; Pietrzak, S.; Pazikowska-Sapota, G.; Jaworska-Szulc, B.; et al. A New Approach for Investigating the Impact of Pesticides and Nutrient Flux from Agricultural Holdings and Land-Use Structures on Baltic Sea Coastal Waters. Pol. J. Environ. Stud. 2019, 28, 2531–2539. [Google Scholar] [CrossRef]
- Dzierzbicka-Glowacka, L.; Pietrzak, S.; Dybowski, D.; Białoskórski, M.; Marcinkowski, T.; Rossa, L.; Urbaniak, M.; Majewska, Z.; Juszkowska, D.; Nawalany, P.; et al. Impact of agricultural farms on the environment of the Puck Commune: Integrated agriculture calculator—CalcGosPuck. PeerJ 2019, 7, e6478. [Google Scholar] [CrossRef] [PubMed]
- Dybowski, D.; Dzierzbicka-Glowacka, L.A.; Pietrzak, S.; Juszkowska, D.; Puszkarczuk, T. Estimation of nitrogen leaching load from agricultural fields in the Puck Commune with an interactive calculator. PeerJ 2020, 8, e8899. [Google Scholar] [CrossRef] [PubMed] [Green Version]
- Szymkiewicz, A.; Potrykus, D.; Jaworska-Szulc, B.; Gumuła-Kawęcka, A.; Pruszkowska-Caceres, M.; Dzierzbicka-Głowacka, L. Evaluation of the Influence of Farming Practices and Land Use on Groundwater Resources in a Coastal Multi-Aquifer System in Puck Region (Northern Poland). Water 2020, 12, 1042. [Google Scholar] [CrossRef] [Green Version]
- Kalinowska, D.; Wielgat, P.; Kolerski, T.; Zima, P. Model of Nutrient and Pesticide Outflow with Surface Water to Puck Bay (Southern Baltic Sea). Water 2020, 12, 809. [Google Scholar] [CrossRef] [Green Version]
- Moore, J.K.; Doney, S.C.; Kleypas, J.A.; Glover, D.M.; Fung, I.Y. An intermediate complexity marine ecosystem model for the global domain. Deep Sea Res. Part II Top. Stud. Oceanogr. 2001, 49, 403–462. [Google Scholar] [CrossRef] [Green Version]
- Dzierzbicka-Głowacka, L.; Janecki, M.; Nowicki, A.; Jakacki, J. Activation of the operational ecohydrodynamic model (3D CEMBS)—The ecosystem module. Oceanologia 2013, 55, 543–572. [Google Scholar] [CrossRef] [Green Version]
- Pastuszak, M.; Bryhn, A.C.; Håkanson, L.; Stålnacke, P.; Zalewski, M.; Wodzinowski, T. Reduction of nutrient emission from Polish territory into the Baltic Sea (1988–2014) confronted with real environmental needs and international requirements. Oceanol. Hydrobiol. Stud. 2018, 47, 140–166. [Google Scholar] [CrossRef]
- Zheng, C.; Wang, P.P. MT3DMS: A Modular Three-Dimensional Multispecies Transport Model for Simulation of Advection, Dispersion, and Chemical Reactions of Contaminants in Groundwater Systems; Documentation and User’s Guide; Contract Report SERDP-99-1; U.S. Army Corps of Engineers: Washington, DC, USA, 1999. [Google Scholar]
- Dzierzbicka-Głowacka, L.; Jakacki, J.; Janecki, M.; Nowicki, A. Activation of the operational ecohydrodynamic model (3D CEMBS)—The hydrodynamic part. Oceanologia 2013, 55, 519–541. [Google Scholar] [CrossRef]
- Thieulot, C. FANTOM: Two- and three-dimensional numerical modelling of creeping flows for the solution of geological problems. Phys. Earth Planet. Inter. 2011, 188, 47–68. [Google Scholar] [CrossRef]
- Taylor, K.E. Summarizing multiple aspects of model performance in a single diagram. J. Geophys. Res. Atmos. 2001, 106, 7183–7192. Available online: https://0-agupubs-onlinelibrary-wiley-com.brum.beds.ac.uk/doi/pdf/10.1029/2000JD900719 (accessed on 12 December 2019). [CrossRef]
- Jaworska-Szulc, B. Groundwater flow modelling of multi-aquifer systems for regional resources evaluation: The Gdansk hydrogeological system, Poland. Hydrogeol. J. 2009, 17, 1521–1542. [Google Scholar] [CrossRef]
- Pazikowska-Sapota, G.; Galer-Tatarowicz, K.; Dembska, G.; Wojtkiewicz, M.; Duljas, E.; Pietrzak, S.; Dzierzbicka-Glowacka, L.A. The impact of pesticides used at the agricultural land of the Puck commune on the environment of the Puck Bay. PeerJ 2020, 8, e8789. [Google Scholar] [CrossRef] [PubMed] [Green Version]
- Węsławski, J.M.; Kryla-Straszewska, L.; Piwowarczyk, J.; Urbański, J.; Warzocha, J.; Kotwicki, L.; Włodarska-Kowalczuk, M.; Wiktor, J. Habitat modelling limitations – Puck Bay, Baltic Sea—A case study. Oceanologia 2013, 55, 167–183. [Google Scholar] [CrossRef] [Green Version]


| Watercourse | Longitude | Latitude | |
|---|---|---|---|
| 1 | Vistula | 18.95 | 54.35 |
| 2 | Bold Vistula | 18.78 | 54.37 |
| 3 | Still Vistula | 18.66 | 54.41 |
| 4 | Oliwski Stream | 18.60 | 54.42 |
| 5 | Kamienny Stream | 18.56 | 54.46 |
| 6 | Kacza | 18.56 | 54.48 |
| 7 | Ściekowy Canal | 18.51 | 54.61 |
| 8 | Reda | 18.47 | 54.64 |
| 9 | Gizdepka | 18.46 | 54.66 |
| 10 | Potok Błądzikowski | 18.45 | 54.70 |
| 11 | Płutnica | 18.39 | 54.72 |
| Watercourse | Mean Runoff | Nitrogen | Ammonia | Phosphorous | |
|---|---|---|---|---|---|
| [m s] | [tons year] | [tons year] | [tons year] | ||
| 1 | Vistula | 1064.20 | 15,102.32 | 1174.63 | 1174.63 |
| 2 | Bold Vistula | 2.06 | 29.17 | 2.27 | 2.27 |
| 3 | Still Vistula | 6.07 | 86.08 | 6.69 | 6.69 |
| 4 | Oliwski Stream | 0.35 | 4.98 | 0.39 | 0.39 |
| 5 | Kamienny Stream | 0.35 | 4.98 | 0.39 | 0.39 |
| 6 | Kacza | 0.35 | 4.98 | 0.39 | 0.39 |
| 7 | Ściekowy Canal | 0.35 | 4.98 | 0.39 | 0.39 |
| 8 | Reda | 0.28 | 36.33 | 3.24 | 0.94 |
| 9 | Gizdepka | 0.49 | 29.74 | 1.83 | 0.72 |
| 10 | Potok Błądzikowski | 0.31 | 25.17 | 0.83 | 0.36 |
| 11 | Płutnica | 1.35 | 32.62 | 9.04 | 3.79 |
| VIEP Mean | VIEP STD | EPB Mean | EPB STD | RMSE | r | |
|---|---|---|---|---|---|---|
| O [mmol m] | 315.30 | 43.06 | 337.50 | 35.97 | 31.03 | 0.71 |
| NO [mmol m] | 1.74 | 2.31 | 2.48 | 2.87 | 2.19 | 0.66 |
| PO [mmol m] | 0.35 | 0.23 | 0.32 | 0.21 | 0.21 | 0.56 |
| CHL [mg m] | 4.44 | 3.14 | 4.40 | 3.59 | 2.89 | 0.64 |
| NEMO Mean | NEMO STD | EPB Mean | EPB STD | RMSE | r | |
|---|---|---|---|---|---|---|
| O [mmol m] | 360.63 | 43.74 | 358.90 | 35.95 | 29.02 | 0.75 |
| NO [mmol m] | 4.68 | 5.18 | 5.70 | 3.82 | 4.20 | 0.60 |
| PO [mmol m] | 0.68 | 0.36 | 0.21 | 0.15 | 0.29 | 0.59 |
| CHL [mg m] | 6.37 | 5.87 | 3.51 | 2.40 | 4.74 | 0.63 |
| O [mmol m] | NO [mmol m] | PO [mmol m] | CHL [mg m] | |
|---|---|---|---|---|
| EPB mean | 358.06 | 5.06 | 0.21 | 3.76 |
| NEMO mean | 360.63 | 4.68 | 0.68 | 6.37 |
| VIEP mean | 315.30 | 1.74 | 0.35 | 4.44 |
© 2020 by the authors. Licensee MDPI, Basel, Switzerland. This article is an open access article distributed under the terms and conditions of the Creative Commons Attribution (CC BY) license (http://creativecommons.org/licenses/by/4.0/).
Share and Cite
Dybowski, D.; Janecki, M.; Nowicki, A.; Dzierzbicka-Glowacka, L.A. Assessing the Impact of Chemical Loads from Agriculture Holdings on the Puck Bay Environment with the High-Resolution Ecosystem Model of the Puck Bay, Southern Baltic Sea. Water 2020, 12, 2068. https://0-doi-org.brum.beds.ac.uk/10.3390/w12072068
Dybowski D, Janecki M, Nowicki A, Dzierzbicka-Glowacka LA. Assessing the Impact of Chemical Loads from Agriculture Holdings on the Puck Bay Environment with the High-Resolution Ecosystem Model of the Puck Bay, Southern Baltic Sea. Water. 2020; 12(7):2068. https://0-doi-org.brum.beds.ac.uk/10.3390/w12072068
Chicago/Turabian StyleDybowski, Dawid, Maciej Janecki, Artur Nowicki, and Lidia Anita Dzierzbicka-Glowacka. 2020. "Assessing the Impact of Chemical Loads from Agriculture Holdings on the Puck Bay Environment with the High-Resolution Ecosystem Model of the Puck Bay, Southern Baltic Sea" Water 12, no. 7: 2068. https://0-doi-org.brum.beds.ac.uk/10.3390/w12072068