Differences in Risk Perception of Water Quality and Its Influencing Factors between Lay People and Factory Workers for Water Management in River Sosiani, Eldoret Municipality Kenya


Abstract
:1. Introduction
- Is there a difference in risk perception between factory workers and lay people?
- Do the two groups (i.e., factory workers and lay people) use different factors to determine risk perception?
2. Literature Review
2.1. Risk Research in the Water Sector
2.2. Risk Perception and Risk Communication
2.3. Factors that Influence Risk Perception
2.4. Study Framework and Hypothesis
- (1)
- People working for industries and people living in different locations of the River determine risk perception differently.
- (2)
- Risk perception is influenced by trust factors, socio-demographic characteristics, water quality perceptions, the nature of the risks involved and psychological and cognitive factors.
3. Methodology
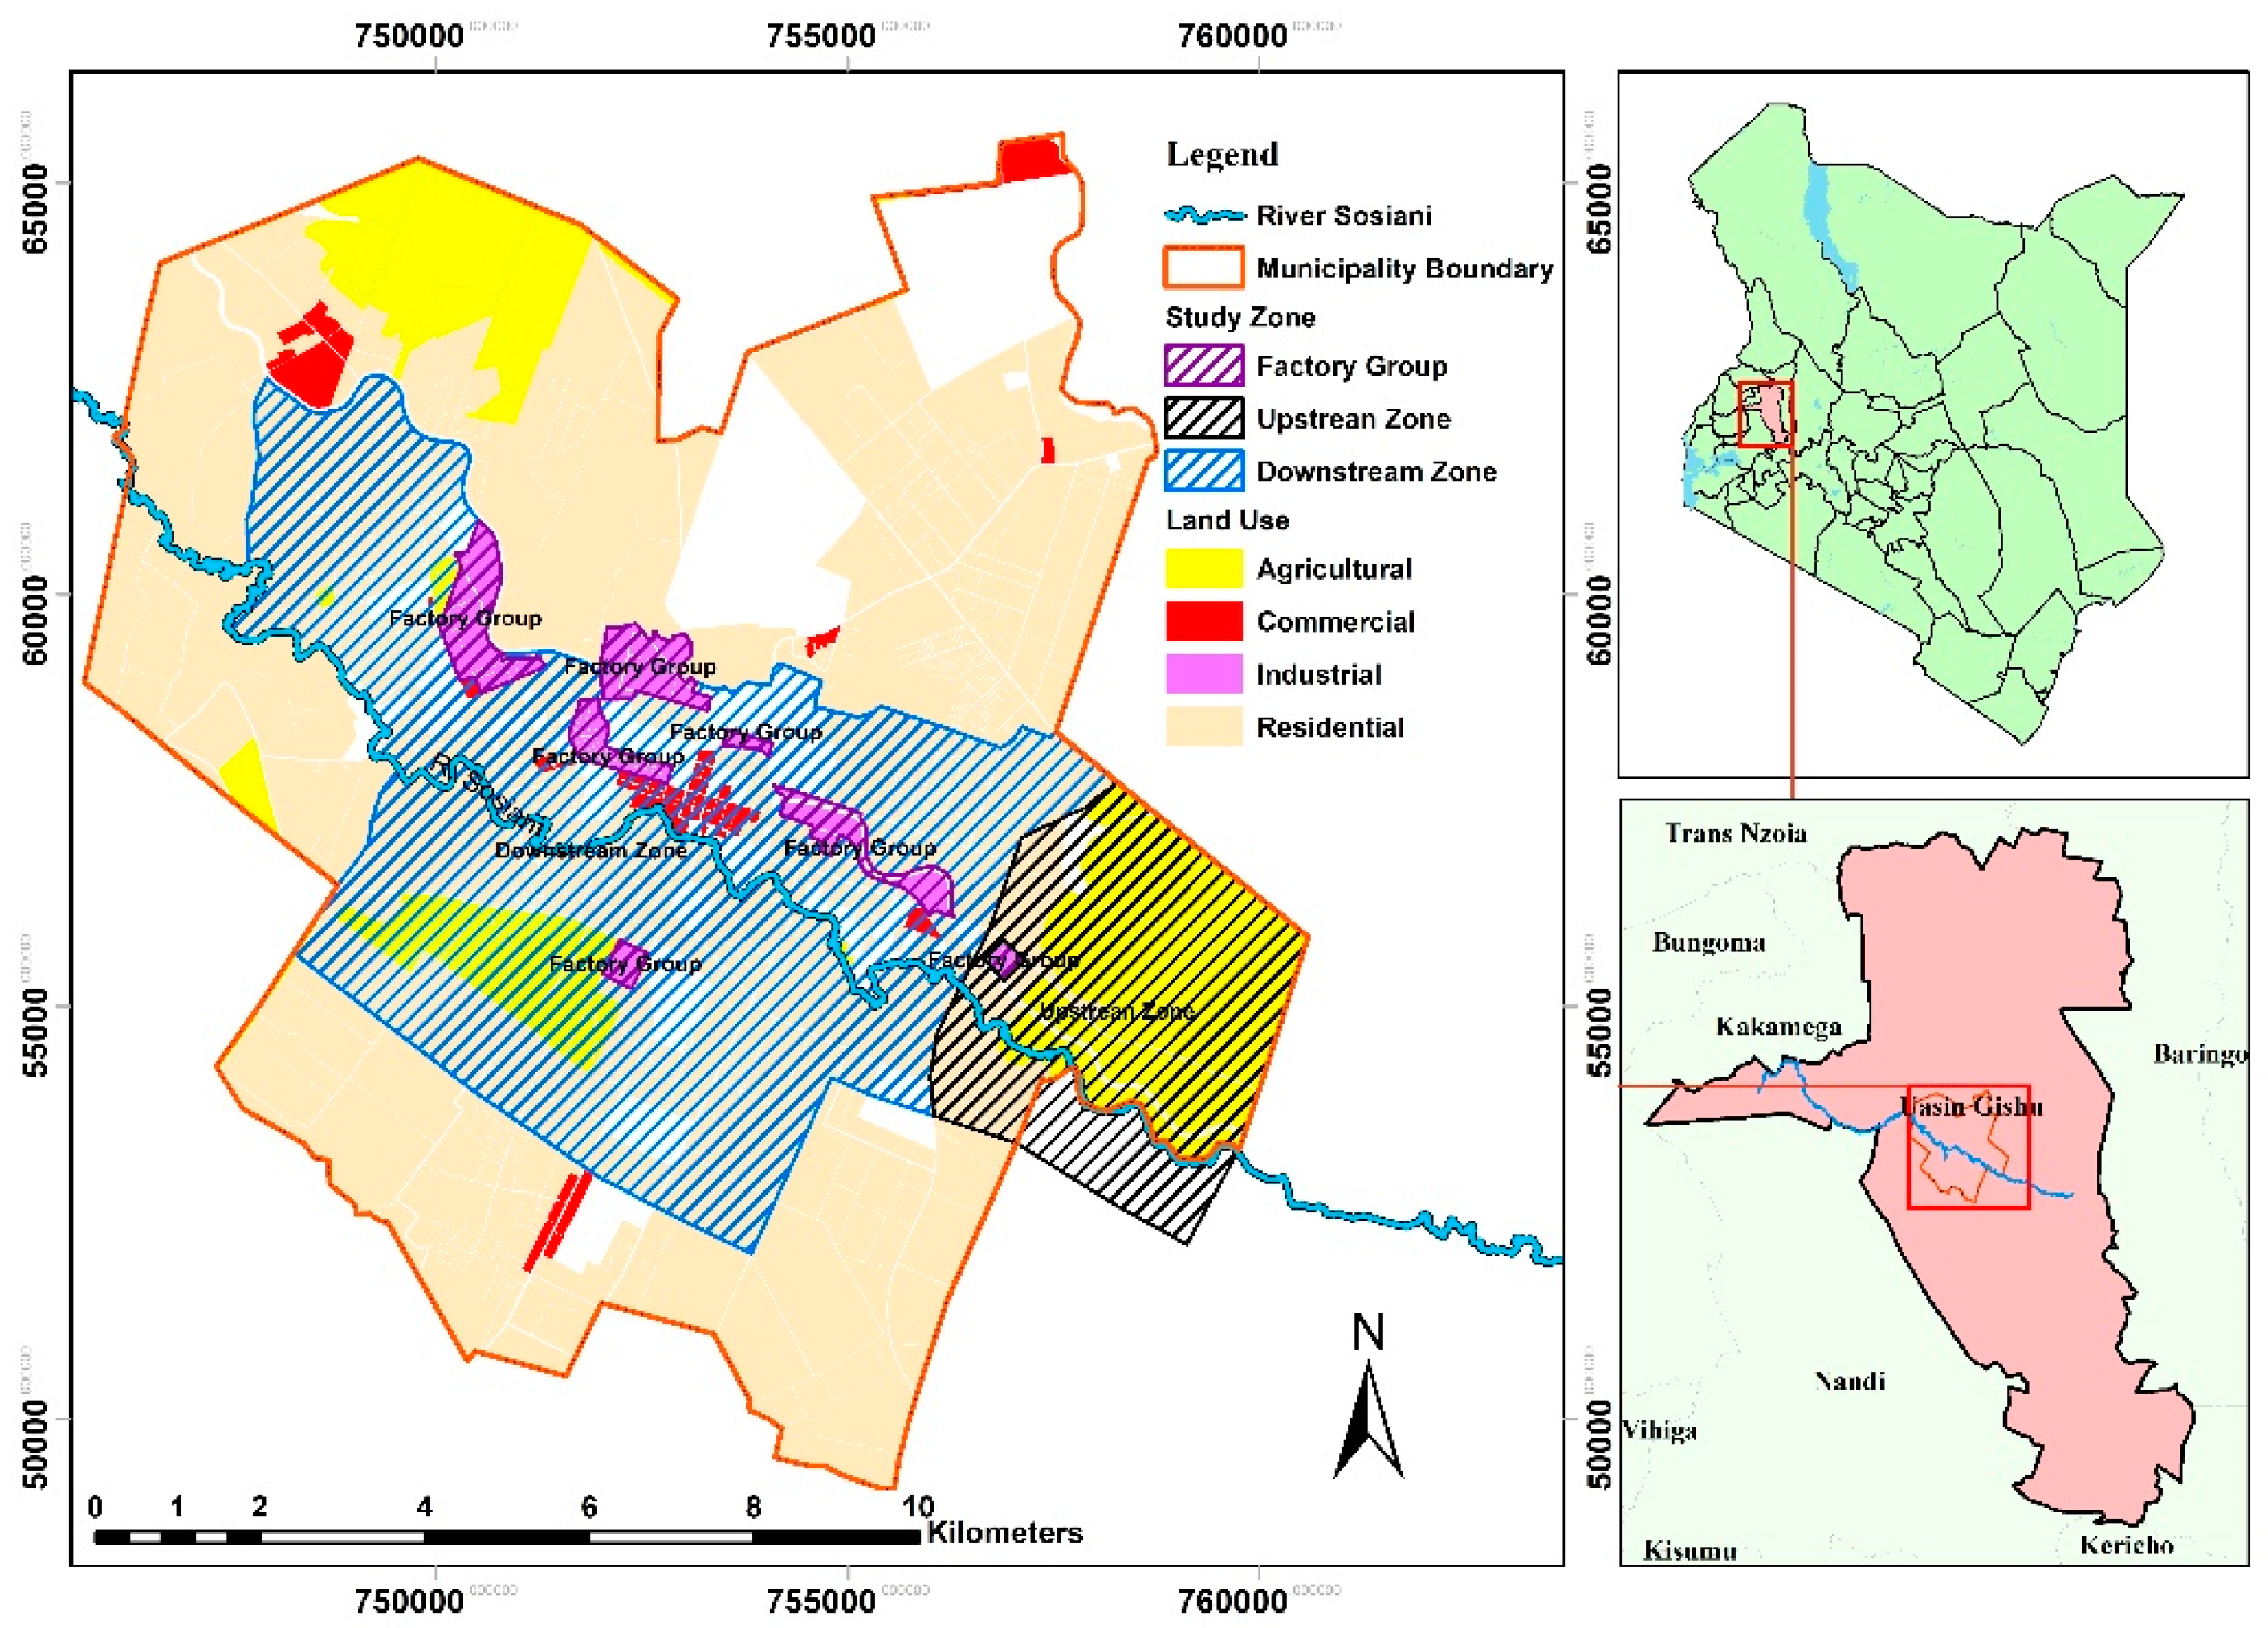
3.1. Study Area
3.2. Methods Used for Data Collection
3.3. The Questionnaire Design
3.4. Statistical Analysis
4. Results and Discussion
4.1. Descriptive Statistics of the Respondents
4.2. Characteristics of the Different Groups of Respondents: Mean Scores Analysis
4.3. Risk Perceptions amongst the Groups
4.4. Multiple Regression Analysis and Correlation Analysis
5. Implications for Promoting Public Participation
6. Conclusions
Author Contributions
Funding
Acknowledgments
Conflicts of Interest
References
- Achieng, A.O.; Raburu, P.O.; Kipkorir, E.C.; Ngodhe, S.O.; Obiero, K.O.; Ani-Sabwa, J. Assessment of water quality using multivariate techniques in river sosiani, Kenya. Env. Monit Assess 2017, 189, 280. [Google Scholar] [CrossRef] [PubMed]
- WWAP (World Water Assessment Programme) UN-Water. The United Nations World Water Development Report 2018: Nature-Based Solutions for Water; UNESCO Publishing: Paris, France, 2018. [Google Scholar]
- Afanga, H.; Zazou, H.; Titchou, F.E.; Rakhila, Y.; Akbour, R.A.; Elmchaouri, A.; Ghanbaja, J.; Hamdani, M. Integrated electrochemical processes for textile industry wastewater treatment: System performances and sludge settling characteristics. Sustain. Environ. Res. 2020, 30, 2. [Google Scholar] [CrossRef] [Green Version]
- Imandoust, S.B.; Gadam, S.N. Are people willing to pay for river water quality, contingent valuation. Int. J. Environ. Sci. Technol. 2007, 4, 401–408. [Google Scholar] [CrossRef] [Green Version]
- Sharma, P.; Kansal, A.; Tarannum, F. Understanding public perception, knowledge and behaviour for water quality management of the river yamuna in India. Water Policy 2018, 20, 266–281. [Google Scholar] [CrossRef]
- Ochoo, B.; Valcour, J.; Sarkar, A. Association between perceptions of public drinking water quality and actual drinking water quality: A community-based exploratory study in newfoundland (Canada). Environ. Res. 2017, 159, 435–443. [Google Scholar] [CrossRef]
- Fischhoff, B.; Bostrom, A.; Quadrel, M.J. Risk perception and communication. Annu. Rev. Public Health 1993, 14, 183–203. [Google Scholar] [CrossRef]
- Slovic, P. Perception of risk. Sci. Total Environ. 1987, 236, 280–285. [Google Scholar] [CrossRef]
- Frewer, L. Risk perception, social trust, and public participation in strategic decision making: Implications for emerging technologies. Ambio 1999, 28, 569–574. [Google Scholar]
- Janmaimool, P.; Watanabe, T. Evaluating determinants of environmental risk perception for risk management in contaminated sites. Int. J. Environ. Res. Public Health 2014, 11, 6291–6313. [Google Scholar] [CrossRef] [Green Version]
- Withanachchi, S.; Kunchulia, I.; Ghambashidze, G.; Al Sidawi, R.; Urushadze, T.; Ploeger, A. Farmers’ perception of water quality and risks in the mashavera river basin, georgia: Analyzing the vulnerability of the social-ecological system through community perceptions. Sustainability 2018, 10, 3062. [Google Scholar] [CrossRef] [Green Version]
- Hu, Z.; Morton, L.W. US midwestern residents perceptions of water quality. Water 2011, 3, 217–234. [Google Scholar] [CrossRef]
- Larson, S.; Stoeckl, N.; Neil, B.; Welters, R. Using resident perceptions of values associated with the Australian tropical rivers to identify policy and management priorities. Ecol. Econ. 2013, 94, 9–18. [Google Scholar] [CrossRef]
- Fischhoff, B.; Slovic, P.; Lichtenstein, S. Lay foibles and expert fables in judgments about risk. Am. Stat. 1982, 36, 240–255. [Google Scholar]
- Flynn, J.; Burns, W.; Mertz, C.; Slovic, P. Trust as a determinant of opposition to a high-level radioactive waste repository: Analysis of a structural model. Risk Anal. 1992, 12, 417–429. [Google Scholar] [CrossRef]
- Savadori, L.; Savio, S.; Nicotra, E.; Rumiati, R.; Finucane, M.; Slovic, P. Expert and public perception of risk from biotechnology. Risk Anal. Int. J. 2004, 24, 1289–1299. [Google Scholar] [CrossRef] [PubMed]
- Slovic, P.; Fischhoff, B.; Lichtenstein, S. Facts and Fears: Understanding Perceived Risk. Societal Risk Assessment; Springer: Berlin/Heidelberg, Germany, 1980; pp. 181–216. [Google Scholar]
- Slovic, P.; Malmfors, T.; Krewski, D.; Mertz, C.; Neil, N.; Bartlett, S. Intuitive toxicology. II. Expert and lay judgments of chemical risks in Canada. Risk Anal. 1995, 15, 661–675. [Google Scholar] [CrossRef] [Green Version]
- Morgan, M.G. Choosing and managing technology-induced risk. In Readings in Risk; Glickman, T.S., Gough, M., Eds.; Resources for the Future: Washington, DC, USA, 1990; Volume 17–28, pp. 17–28. [Google Scholar] [CrossRef]
- Slovic, P.E. The Perception of Risk; Earthscan Publications: London, UK, 2000. [Google Scholar]
- Kanda, R.; Tsuji, S.; Yonehar, H. Perceived risk of nuclear power and other risks during the last 25 years in Japan. Health Phys. Soc. 2012, 102, 384–390. [Google Scholar] [CrossRef]
- Siegrist, M.; Keller, C.; Kastenholz, H.; Frey, S.; Wiek, A. Laypeople’s and experts’ perception of nanotechnology hazards. Risk Anal. 2007, 27, 59–69. [Google Scholar] [CrossRef]
- Perko, T. Radiation risk perception: A discrepancy between the experts and the general population. J. Env. Radioact. 2014, 133, 86–91. [Google Scholar] [CrossRef]
- Leiter, M.P.; Zanaletti, W.; Argentero, P. Occupational risk perception, safety training, and injury prevention: Testing a model in the Italian printing industry. J. Occup. Health Psychol. 2009, 14, 1. [Google Scholar] [CrossRef] [Green Version]
- Kakaei, H.; Mirzaei Alavijeh, M.; Mahboubi, M.; Maghsodi Moghadam, R.; Zinat Motlagh, F.; Farasaty, F. Factors related to personal protective equipment use between factory cement employ in Ilam, the west of Iran: Application of BASNEF model. Sci. Todays World 2014, 3, 56–59. [Google Scholar]
- Ellaban, M.; Rady, M.; Hebat Allah, G.; Mostafa, N. Risk perception and occupational accidents among a group of egyptian construction workers in a construction company in cairo. Med. Integr. Stud. Res. J. 2018, 1, 9–18. [Google Scholar] [CrossRef]
- West, P.; Locke, R. Occupational risks from infectious diseases in the water industry. Water Environ. J. 1990, 4, 520–523. [Google Scholar] [CrossRef]
- Sjöberg, L.; Drottz-Sjöberg, B.M. Knowledge and risk perception among nuclear power plant employees. Risk Anal. 1991, 11, 607–618. [Google Scholar] [CrossRef] [PubMed]
- Dobbie, M.F.; Brown, R.R. A framework for understanding risk perception, explored from the perspective of the water practitioner. Risk Anal. 2014, 34, 294–308. [Google Scholar] [CrossRef]
- Amadi, E.K. Nutrient loads and heavy metals assessment along sosiani river, Kenya. Chem. Mater. Res. 2013, 3, 14–20. [Google Scholar]
- Ontumbi, G.; Nyabero, C.; Sang, C.C. An assessment of water quality variation on human health in the river sosiani catchment, Kenya. Int. J. Innov. Res. Educ. Sci. 2015, 2, 63–68. [Google Scholar]
- Chibole, O. Lead Levels in the Sosiani. In Proceedings of the International Conference on Advances in Engineering and Technology; Elsevier Science Ltd: Amsterdam, The Netherlands, 2006; pp. 722–729. [Google Scholar] [CrossRef]
- Ogindo, B.A. Heavy metal pollutants and their concentrations in fish (barbus species) in sosiani river, Kenya. Discov. Innov. 2001, 13, 178–183. [Google Scholar] [CrossRef]
- Ontumbi, G.; Obando, J.; Ondieki, C. The influence of agricultural activities on the water quality of the river sosiani in uasin gishu county, Kenya. Int. J. Res. Agric. Sci. 2015, 2, 2348–3997. [Google Scholar]
- Kipyego, S.; Ouma, Y. Analysis of nonpoint source pollution loading on water quality in an urban-rural river catchment using GIS-PLOAD model: Case study of sosiani river watershed. J. Civ. Environ. Res. 2018, 10, 70–84. [Google Scholar]
- Semião, M.A.; Haminiuk, C.W.I.; Maciel, G.M. Residual diatomaceous earth as a potential and cost effective biosorbent of the azo textile dye reactive blue 160. J. Environ. Chem. Eng. 2020, 8, 103617. [Google Scholar] [CrossRef]
- Vijayaraghavan, G.; Sivakumar, T.; Kumar, A.V. Application of plant based coagulants for waste water treatment. Int. J. Adv. Eng. Res. Stud. 2011, 1, 88–92. [Google Scholar]
- Al-Ghouti, M.; Khraisheh, M.; Allen, S.; Ahmad, M. The removal of dyes from textile wastewater: A study of the physical characteristics and adsorption mechanisms of diatomaceous earth. J. Environ. Manag. 2003, 69, 229–238. [Google Scholar] [CrossRef]
- Zhi-qiang, C.; Chang-yong, W.; Fang, L.; Su-hua, W. Study on the technology of treating municipal sewage with diatomaceous earth. Water Wastewater Eng. 2006, 32, 66–68. [Google Scholar]
- Clay, D.; Ren, C.; Reese, C.; Waskom, R.; Bauder, J.; Mesner, N.; Paige, G.; Reddy, K.; Neibauer, M.; Mahler, R. Linking public attitudes with perceptions of factors impacting water quality and attending learning activities. J. Nat. Resour. Life Sci. Educ. 2007, 36, 36–44. [Google Scholar] [CrossRef]
- Dobbie, M.; Green, R. Public perceptions of freshwater wetlands in Victoria, Australia. Landsc. Urban Plan. 2013, 110, 143–154. [Google Scholar] [CrossRef]
- Tran, K. Public perception of development issues: Public awareness can contribute to sustainable development of a small island. Ocean Coast. Manag. 2006, 49, 367–383. [Google Scholar] [CrossRef]
- Canter, L.W.; Nelson, D.I.; Everett, J.W. Public perception of water quality risks-influencing factors and enhancement opportunities. J. Environ. Syst. 1992, 22, 163–187. [Google Scholar] [CrossRef]
- De França Doria, M. Factors influencing public perception of drinking water quality. Water Policy 2010, 12, 1–19. [Google Scholar] [CrossRef]
- Levallois, P.; Grondin, J.; Gingras, S. Evaluation of consumer attitudes on taste and tap water alternatives in Quebec. Water Sci. Technol. 1999, 40, 135–139. [Google Scholar] [CrossRef]
- Le Lay, Y.-F.; Piégay, H.; Rivière-Honegger, A. Perception of braided river landscapes: Implications for public participation and sustainable management. J. Environ. Manag. 2013, 119, 1–12. [Google Scholar] [CrossRef]
- Lepesteur, M.; Wegner, A.; Moore, S.A.; McComb, A. Importance of public information and perception for managing recreational activities in the peel-harvey estuary, western Australia. J. Environ. Manag. 2008, 87, 389–395. [Google Scholar] [CrossRef]
- Tunstall, S. Public perceptions of the environmental changes to the thames estuary in London, UK. J. Coast. Res. 2000, 16, 269–277. [Google Scholar]
- Buijs, A.E. Public support for river restoration. A mixed-method study into local residents’ support for and framing of river management and ecological restoration in the Dutch floodplains. J. Environ. Manag. 2009, 90, 2680–2689. [Google Scholar] [CrossRef] [PubMed]
- Renn, O. The role of risk perception for risk management. Reliab. Eng. Syst. Saf. 1998, 59, 49–62. [Google Scholar] [CrossRef]
- Whyte, A.V.; Burton, I. Environmental risk assessment. 1980. Available online: https://scholar.google.com (accessed on 7 August 2020).
- Efron, R. What is perception? In Proceedings of the Boston Colloquium for the Philosophy of Science 1966/1968; Cohen, R.S., Wartofsky, M.W., Eds.; Springer: Dordrecht, The Netherlands, 2012; Volume 4, pp. 137–173, December 6. [Google Scholar]
- Larson, K.L.; White, D.D.; Gober, P.; Harlan, S.; Wutich, A. Divergent perspectives on water resource sustainability in a public-policy-science context. Environ. Sci. Policy 2009, 12, 1012–1023. [Google Scholar] [CrossRef]
- Williamson, J.; Weyman, A. Review of the public perception of risk, and stakeholder engagement HSL/2005/16. In Health Saf. Lab.; 2005. Available online: https://www.hse.gov.uk/Research/hsl_pdf/2005/hsl0516.pdf (accessed on 7 August 2020).
- Hilgartner, S. The dominant view of popularization: Conceptual problems, political uses. Soc. Stud. Sci. 1990, 20, 519–539. [Google Scholar] [CrossRef]
- Irwin, A.; Wynne, B. Misunderstanding Science? The Public Reconstruction of Science and Technology; Cambridge University Press: Cambridge, UK; New York, NY, USA, 2003. [Google Scholar]
- Hansen, J.; Holm, L.; Frewer, L.; Robinson, P.; Sandøe, P. Beyond the knowledge deficit: Recent research into lay and expert attitudes to food risks. Appetite 2003, 41, 111–121. [Google Scholar] [CrossRef]
- Kane, I.O.; Vanderlinden, J.-P.; Baztan, J.; Touili, N.; Claus, S. Communicating risk through a DSS: A coastal risk centred empirical analysis. Coast. Eng. 2014, 87, 240–248. [Google Scholar] [CrossRef]
- Touili, N.; Baztan, J.; Vanderlinden, J.-P.; Kane, I.O.; Diaz-Simal, P.; Pietrantoni, L. Public perception of engineering-based coastal flooding and erosion risk mitigation options: Lessons from three European coastal settings. Coast. Eng. 2014, 87, 205–209. [Google Scholar] [CrossRef]
- Pidgeon, N. Risk assessment, risk values and the social science programme: Why we do need risk perception research. Reliab. Eng. Syst. Saf. 1998, 59, 5–15. [Google Scholar] [CrossRef]
- Fessenden-Raden, J.; Fitchen, J.M.; Heath, J. Providing risk information in communities: Factors influencing what is heard and accepted. Sci. Technol. Hum. Values 1987, 12, 94–101. [Google Scholar]
- Sjöberg, L. Factors in risk perception. Risk Anal. 2000, 20, 1–12. [Google Scholar] [CrossRef] [PubMed]
- Gachango, F.G.; Andersen, L.M.; Pedersen, S.M. Danish farmers’ perception of water quality, nutrient reduction measures and their implementation strategy. In Proceedings of the International Conference on Sustainable Water Resources Management, Coruña, Spain, 15–17 June 2015; WIT Press: Southampton, UK, 2015; pp. 435–446. [Google Scholar]
- Hodge, I.; Reader, M. The introduction of entry level stewardship in England: Extension or dilution in agri-environment policy? Land Use Policy 2010, 27, 270–282. [Google Scholar] [CrossRef]
- Giovanopoulou, E.; Nastis, S.A.; Papanagiotou, E. Modeling farmer participation in agri-environmental nitrate pollution reducing schemes. Ecol. Econ. 2011, 70, 2175–2180. [Google Scholar] [CrossRef]
- Carlton, S.J.; Jacobson, S.K. Climate change and coastal environmental risk perceptions in Florida. J. Env. Manag. 2013, 130, 32–39. [Google Scholar] [CrossRef]
- Karki, S.; Niraula, S.R.; Yadav, D.K.; Chakravartty, A.; Karki, S. Risk perception towards healthcare waste among community people in Kathmandu, Nepal. PLoS ONE 2020, 15, e0230960. [Google Scholar] [CrossRef]
- Wang, L.; Watanabe, T. Factors affecting farmers’ risk perceptions regarding biomass supply: A case study of the national bioenergy industry in northeast China. J. Clean. Prod. 2016, 139, 517–526. [Google Scholar] [CrossRef]
- Jingchao, Z.; Kotani, K.; Saijo, T. Public acceptance of environmentally friendly heating in Beijing: A case of a low temperature air source heat pump. Energy Policy 2018, 117, 75–85. [Google Scholar] [CrossRef]
- Poortinga, W.; Pidgeon, N.F. Exploring the dimensionality of trust in risk regulation. Risk Anal. Int. J. 2003, 23, 961–972. [Google Scholar] [CrossRef]
- Löfstedt, R.; Cvetkovich, G. Social Trust and the Management of Risk; Routledge: Abingdon, UK, 1999. [Google Scholar]
- Siegrist, M.; Cvetkovich, G. Perception of hazards: The role of social trust and knowledge. Risk Anal. 2000, 20, 713–720. [Google Scholar] [CrossRef] [PubMed]
- Viklund, M. Trust and risk perception in western Europe: A cross-national study. Risk Anal. 2003, 23, 727–738. [Google Scholar] [CrossRef] [PubMed]
- de Franca Doria, M.; Pidgeon, N.; Hunter, P. Perception of tap water risks and quality: A structural equation model approach. Water Sci. Technol. A J. Int. Assoc. Water Pollut. Res. 2005, 52, 143–149. [Google Scholar] [CrossRef]
- Larkin, C.; Lucey, B.M.; Mulholland, M. Risk tolerance and demographic characteristics: Preliminary Irish evidence. J. Financ. Serv. Rev. 2013, 22, 77–91. [Google Scholar]
- Sung, J.; Hanna, S.D. Factors related to risk tolerance. Financ. Couns. Plan. 1996, 7, 11–20. [Google Scholar] [CrossRef] [Green Version]
- Liu, A.H.; Bui, M.; Leach, M. Considering technological impacts when selecting food suppliers: Comparing retailers’ buying behavior in the United States and Europe. J. Bus. Bus. Mark. 2013, 20, 81–98. [Google Scholar] [CrossRef]
- Yang, X.; Wang, F.; Bento, C.P.; Meng, L.; van Dam, R.; Mol, H.; Liu, G.; Ritsema, C.J.; Geissen, V. Decay characteristics and erosion-related transport of glyphosate in Chinese loess soil under field conditions. Sci. Total Environ. 2015, 530, 87–95. [Google Scholar] [CrossRef]
- Siegrist, M. The influence of trust and perceptions of risks and benefits on the acceptance of gene technology. Risk Anal. 2000, 20, 195–204. [Google Scholar] [CrossRef]
- Georgiou, S.; Langford, I.H.; Bateman, I.J.; Turner, R.K. Determinants of individuals’ willingness to pay for perceived reductions in environmental health risks: A case study of bathing water quality. Environ. Plan. A 1998, 30, 577–594. [Google Scholar] [CrossRef]
- Keraita, B.; Drechsel, P.; Konradsen, F. Perceptions of farmers on health risks and risk reduction measures in wastewater-irrigated urban vegetable farming in Ghana. J. Risk Res. 2008, 11, 1047–1061. [Google Scholar] [CrossRef]
- Toze, S. Reuse of effluent water—Benefits and risks. Agric. Water Manag. 2006, 80, 147–159. [Google Scholar] [CrossRef] [Green Version]
- Sparks, P.; Shepherd, R.; Frewer, L. Gene technology, food production, and public opinion: A UK study. Agric. Hum. Values 1994, 11, 19–28. [Google Scholar] [CrossRef]
- Park, E.; Ohm, J.Y. Factors influencing the public intention to use renewable energy technologies in south Korea: Effects of the Fukushima nuclear accident. Energy Policy 2014, 65, 198–211. [Google Scholar] [CrossRef]
- Chen, M.-F.; Lin, Y.-P.; Cheng, T.-J. Public attitudes toward nanotechnology applications in Taiwan. Technovation 2013, 33, 88–96. [Google Scholar] [CrossRef]
- Khan, M.; Mahmood, H.Z.; Damalas, C.A. Pesticide use and risk perceptions among farmers in the cotton belt of Punjab, Pakistan. Crop Prot. 2015, 67, 184–190. [Google Scholar] [CrossRef]
- Reid, S.G. Perception and communication of risk, and the importance of dependability. Tructural Saf. 1999, 21, 373–384. [Google Scholar] [CrossRef]
- De França Doria, M.; Pidgeon, N.; Hunter, P.R. Perceptions of drinking water quality and risk and its effect on behaviour: A cross-national study. Sci. Total Environ. 2009, 407, 5455–5464. [Google Scholar] [CrossRef]
- Kenya National Bureau of Statistics. 2019 Kenya Population and Housing Census. November 2019. Available online: http://housingfinanceafrica.org/documents/2019-kenya-population-andhousing-census-reports (accessed on 7 August 2020).
- Ontumbi, G.M. The Influence of Landuse Activities on Water Quality. Master’s Thesis, Kenyatta Univeristy, Kiambu county, Kenya, July 2015. [Google Scholar]
- Chibole, O.K. Modeling river sosiani’s water quality to assess human impact on water resources at the catchment scale. Ecohydrol. Hydrobiol. 2013, 13, 241–245. [Google Scholar] [CrossRef]
- Masakha, E.J. Longitudinal and seasonal variations in physicochemical and microbiological properties of water quality of sosiani river, Uasin Gishu County, Kenya. Ph.D. Thesis, Egerton Univeristy, Nakuru county, Kenya, 2019. [Google Scholar]
- Sharon, C.W. Impact of Urban waste on seasonal water quality of Sosiani River, Eldoret municipality, Uasin-Gishu County. Bachelor’s Thesis, Kenyatta University, Kiambu county, Kenya, 2014. [Google Scholar]
- Correspondent, N. Pollution threatens river sosiani, experts warn. Daily Nation. 2014. Available online: https://www.nation.co.ke/counties/eldoret/Pollution-River-Sosiani/1954186-2330416-10b9t81z/index.html (accessed on 7 August 2020).
- Andy, F. Discovering Statistics Using Spss for Windows: Advanced Techniques for the Beginner; Sage: Newcastle upon Tyne, UK, 2000. [Google Scholar]
- Pallant, J. SPSS Survival Manual; McGraw-Hill Education: Berkshire, England, 2013. [Google Scholar]
- Hair, J.F.; Black, W.C.; Babin, B.J.; Anderson, R.E.; Tatham, R.L. Multivariate Data Analysis; Prentice Hall: Upper Saddle River, NJ, USA, 1998; Volume 5. [Google Scholar]
- Anadu, E.C.; Harding, A.K. Risk perception and bottled water use. J. AWWA 2000, 92, 82–92. [Google Scholar] [CrossRef]
- Barseghyan, L.; Molinari, F.; O′Donoghue, T.; Teitelbaum, J.C. The nature of risk preferences: Evidence from insurance choices. Am. Econ. Rev. 2013, 103, 2499–2529. [Google Scholar] [CrossRef] [Green Version]
- Scherer, C.W. Communicating water quality risk. J. Soil Water Conserv. 1990, 45, 198–200. [Google Scholar]
- Gregory, R.; Mendelsohn, R. Perceived risk, dread, and benefits. Risk Anal. 1993, 13, 259–264. [Google Scholar] [CrossRef]
- McDaniels, T.L.; Axelrod, L.J.; Cavanagh, N.S.; Slovic, P. Perception of ecological risk to water environments. Risk Anal. 1997, 17, 341–352. [Google Scholar] [CrossRef] [PubMed]
- Ross, V.L.; Fielding, K.S.; Louis, W.R. Social trust, risk perceptions and public acceptance of recycled water: Testing a social-psychological model. J. Environ. Manag. 2014, 137, 61–68. [Google Scholar] [CrossRef]
- Bronfman, N.C.; Vázquez, E.L.; Gutiérrez, V.V.; Cifuentes, L.A. Trust, acceptance and knowledge of technological and environmental hazards in Chile. J. Risk Res. 2008, 11, 755–773. [Google Scholar] [CrossRef]
- Irwin, K. Prosocial behavior across cultures: The effects of institutional versus generalized trust. J. Adv. Group Process. 2009, 26, 165–198. [Google Scholar]
- Ormerod, K.J.; Scott, C.A. Drinking wastewater: Public trust in potable reuse. J. Sci. Technol. Hum. Values 2013, 38, 351–373. [Google Scholar] [CrossRef] [Green Version]
- Aziz, S.N.; Boyle, K.J.; Rahman, M. Knowledge of arsenic in drinking-water: Risks and avoidance in Matlab, Bangladesh. J. Health Popul. Nutr. 2006, 24, 327. [Google Scholar]
- Dosman, D.M.; Adamowicz, W.L.; Hrudey, S.E. Socioeconomic determinants of health-and food safety-related risk perceptions. Risk Anal. 2001, 21, 307–318. [Google Scholar] [CrossRef]
- Slovic, P. Public perception of risk. J. Environ. Health 1997, 59, 22–25. [Google Scholar]
- Baggett, S.; Jeffrey, P.; Jefferson, B. Risk perception in participatory planning for water reuse. Desalination 2006, 187, 149–158. [Google Scholar] [CrossRef]


| Factory Group | Upstream Inhabitants | Downstream Inhabitants | ||||
|---|---|---|---|---|---|---|
| Count | % | Count | % | Count | % | |
| Female | 46 | 51.7 | 30 | 42.3 | 46 | 53.5 |
| Male | 43 | 48.3 | 41 | 57.7 | 40 | 46.5 |
| Education: | ||||||
| No education | 0 | 0 | 1 | 1.4 | 3 | 3.5 |
| Primary school | 7 | 7.9 | 8 | 11.3 | 18 | 20.9 |
| Secondary school | 37 | 41.6 | 37 | 52.1 | 35 | 40.7 |
| Tertiary Level | 45 | 50.6 | 25 | 35.2 | 30 | 34.9 |
| Age | ||||||
| (20–29) | 43 | 48.3 | 31 | 43.7 | 26 | 30.2 |
| (30–39) | 35 | 39.3 | 33 | 46.5 | 41 | 52.3 |
| (40–49) | 7 | 7.9 | 5 | 7.0 | 12 | 9.3 |
| (50–59) | 2 | 2.2 | 0 | 0 | 3 | 3.5 |
| (60+) | 2 | 2.2 | 2 | 2.8 | 4 | 4.7 |
| Income in Ksh 1 | ||||||
| (No income) | 2 | 2.2 | 17 | 23.9 | 25 | 29.1 |
| 1–20,000 | 59 | 66.3 | 42 | 59.2 | 35 | 40.7 |
| 20,001–40,000 | 17 | 19.1 | 8 | 11.3 | 16 | 18.6 |
| 40,001–60,000 | 6 | 6.7 | 2 | 2.8 | 5 | 5.8 |
| 60,001–80,000 | 2 | 2.2 | 1 | 1.4 | 0 | 0 |
| 80K+ | 3 | 3.4 | 1 | 1.4 | 5 | 5.8 |
| Observations | 89 | 71 | 86 | |||
| Number of Family Members Working for Local Industries | ||||||||
|---|---|---|---|---|---|---|---|---|
| Count | 0 | 1 | 2 | 3 | 4 | 5 | 6 | Total (N) |
| Group | ||||||||
| Factory | 0 | 71 | 11 | 5 | 1 | 1 | 0 | 89 |
| Downstream | 35 | 23 | 16 | 9 | 2 | 0 | 1 | 86 |
| Upstream | 55 | 7 | 5 | 3 | 1 | 0 | 0 | 71 |
| Total | 90 | 101 | 32 | 17 | 4 | 1 | 1 | 246 |
| Factory Group N = 89 | Downstream Inhabitants N = 86 | Upstream Inhabitants N = 71 | Overall N = 246 | |||||
|---|---|---|---|---|---|---|---|---|
| Variables | Mean | SD | Mean | SD | Mean | SD | Mean | SD |
| Risk perception | 4.354 | 0.365 | 4.606 | 0.371 | 4.039 | 0.389 | 4.351 | 0.436 |
| Gender 1 | 1.48 | 0.503 | 1.47 | 0.502 | 1.577 | 0.497 | 1.500 | 0.501 |
| Age | 31.22 | 8.602 | 34.21 | 10.011 | 32.056 | 9.339 | 32.510 | 9.378 |
| Income | 22000 | 23400 | 21700 | 35900 | 13100 | 16400 | 19300 | 27200 |
| Education 2 | 3.427 | 0.638 | 3.070 | 0.837 | 3.211 | 0.695 | 3.240 | 0.742 |
| Sensorial factors | 4.581 | 0.508 | 4.314 | 0.840 | 4.394 | 0.677 | 4.434 | 0.694 |
| Contextual factors | 3.966 | 0.641 | 3.616 | 1.070 | 3.662 | 1.133 | 3.756 | 0.968 |
| Scientific factors | 3.772 | 0.961 | 3.597 | 1.261 | 3.923 | 0.607 | 3.754 | 1.003 |
| Speculative factors | 4.266 | 0.493 | 3.837 | 0.987 | 4.042 | 0.662 | 4.052 | 0.764 |
| Trust in the government | 4.247 | 1.376 | 4.163 | 0.824 | 3.817 | 1.324 | 4.090 | 1.203 |
| Trust in the industries | 4.169 | 1.236 | 4.326 | 0.789 | 3.887 | 1.076 | 4.140 | 1.061 |
| Trust in the local people | 3.573 | 1.658 | 3.558 | 1.369 | 3.451 | 1.556 | 3.530 | 1.527 |
| Possibility of industries generating water pollution | 3.966 | 1.283 | 4.279 | 0.929 | 3.056 | 1.698 | 3.810 | 1.402 |
| Possibility of being impacted by water pollution | 3.112 | 1.172 | 4.395 | 0.858 | 2.958 | 1.292 | 3.520 | 1.283 |
| Impact of water pollution on human health | 3.483 | 1.407 | 4.407 | 0.742 | 3.789 | 1.158 | 3.890 | 1.201 |
| Experiences with water pollution | 3.966 | 0.804 | 3.884 | 1.522 | 4.085 | 1.432 | 3.972 | 1.276 |
| Perceived benefits from industries | 3.910 | 1.379 | 3.756 | 1.564 | 3.634 | 1.376 | 3.780 | 1.444 |
| Mean Difference (Comparison within the Groups) | ||||||
|---|---|---|---|---|---|---|
| Group | N | Mean | SD | Factory | Downstream Inhabitants | Upstream Inhabitants |
| Factory group | 89 | 4.3539 | 0.36504 | - | 0.25217 * | −0.31520 * |
| Downstream inhabitants | 86 | 4.6061 | 0.37107 | −0.25217* | - | −0.56737 * |
| Upstream inhabitants | 71 | 4.0387 | 0.38936 | 0.31520* | 0.56737 * | - |
| Variable | 1 | 2 | 3 | 4 | 5 | 6 | 7 | 8 | |
|---|---|---|---|---|---|---|---|---|---|
| 1 | What is the perceived level of risk to your life, based on the water quality in the area? | 1 | |||||||
| 2 | Have industrial activity in the area impacted your career in anyway? | 0.017 | 1 | ||||||
| 3 | As a result of industrial development do you feel worried about our health? | 0.015 | 0.565 ** | 1 | |||||
| 4 | As a result of industrial development do you feel worried about your future life in the area? | 0.254 ** | 0.162 * | 0.018 | 1 | ||||
| 5 | Has water quality in the area led to water related diseases amongst the residents? | 0.042 | 0.336 ** | 0.314** | 0.12 | 1 | |||
| 6 | Has water quality caused several kinds of cancer amongst the residents? | 0.02 | 0.094 | −0.043 | 0.009 | 0.171 ** | 1 | ||
| 7 | Have industrial activities in the area led to nuisances such as noise, smell, etc.? | −0.022 | 0.154 * | 0.007 | 0.084 | 0.356 ** | 0.360 ** | 1 | |
| 8 | Has the current condition of the community caused nuisances, such as traffic jam, congestion, etc.? | −0.151 * | 0.306 ** | 0.468 ** | −0.043 | 0.306 ** | −0.022 | 0.077 | 1 |
| Bivariate Correlation | Partial Correlation | Bivariate Correlation | Partial Correlation | Bivariate Correlation | Partial Correlation | |
|---|---|---|---|---|---|---|
| Factory | Downstream inhabitants | Upstream inhabitants | ||||
| Risk perception | 1 | 1.000 | 1 | 1.000 | 1 | 1.000 |
| Gender | 0.017 | 0.022 | 0.103 | 0.078 | −0.016 | −0.020 |
| Age | 0.011 | −0.049 | 0.006 | 0.021 | −0.259 * | −0.254 |
| Income | −0.175 | 0.077 | −0.124 | −0.101 | −0.149 | −0.121 |
| Education | 0.167 | −0.086 | −0.066 | −0.176 | −0.128 | −0.130 |
| Contextual factors | 0.149 | 0.061 | 0.079 | 0.026 | 0.01 | 0.025 |
| Scientific factors | −0.018 | −0.114 | −0.113 | −0.322 | −0.076 | −0.124 |
| Speculative factors | 0.292 ** | 0.083 | 0.031 | −0.198 | 0.16 | 0.091 |
| Trust in the government | −0.199 | −0.355 | −0.043 | −0.062 | −0.156 | −0.357 |
| Trust in the industries | −0.134 | −0.147 | −0.416 ** | −0.325 | −0.028 | −0.011 |
| Trust in the local people | −0.085 | −0.245 | 0.111 | 0.152 | −0.003 | −0.007 |
| Possibility of industries generating water pollution | −0.017 | −0.250 | 0.208 | 0.267 | 0.167 | 0.152 |
| Possibility of being impacted by water pollution | −0.097 | −0.099 | 0.213 * | 0.291 | 0.085 | 0.088 |
| Impact of water pollution on human health | 0.366 ** | 0.314 | 0.05 | 0.070 | 0.046 | 0.042 |
| Experiences with water pollution | −0.273 ** | −0.118 | 0.048 | 0.158 | 0.18 | 0.178 |
| Perceived benefits from industries | −0.148 | −0.226 | 0.081 | −0.016 | 0.027 | 0.011 |
| Sensorial factors | 0.599 ** | 0.704 ** | 0.146 | |||
| Factory Group | Downstream Inhabitants | Upstream Inhabitants | |||||||
|---|---|---|---|---|---|---|---|---|---|
| Independent Variable | Beta | Std. Error | VIF | Beta | Std. Error | VIF | Beta | Std. Error | VIF |
| Gender | 0.028 | 0.067 | 1.385 | 0.058 | 0.059 | 1.295 | 0.021 | 0.096 | 1.301 |
| Age | −0.077 | 0.004 | 1.318 | 0.003 | 0.003 | 1.318 | −0.298 * | 0.005 | 1.185 |
| Income | 0.127 | 0 | 1.243 | −0.057 | 0 | 1.319 | −0.199 | 0 | 1.679 |
| Education | −0.062 | 0.051 | 1.287 | −0.128 | 0.036 | 1.317 | −0.058 | 0.079 | 1.713 |
| Sensorial factors | 0.554 ** | 0.081 | 2.104 | 0.692 ** | 0.036 | 1.323 | 0.566 * | 0.136 | 4.811 |
| Contextual factors | 0.166 | 0.078 | 3.073 | 0.082 | 0.03 | 1.499 | 0.256 | 0.066 | 3.178 |
| Scientific factors | −0.197 | 0.064 | 4.693 | −0.109 | 0.032 | 2.369 | −0.076 | 0.107 | 2.407 |
| Speculative factors | 0.116 | 0.101 | 3.042 | −0.094 | 0.034 | 1.7 | −0.125 | 0.118 | 3.433 |
| Trust in the government | −0.224 * | 0.024 | 1.325 | −0.003 | 0.047 | 2.204 | −0.538 ** | 0.046 | 2.108 |
| Trust in the industries | −0.108 | 0.025 | 1.19 | −0.174 | 0.046 | 1.955 | −0.065 | 0.044 | 1.289 |
| Trust in the local people | −0.058 | 0.037 | 4.532 | −0.073 | 0.026 | 1.88 | −0.296 | 0.069 | 6.443 |
| Possibility of industries generating water pollution | −0.176 | 0.046 | 4.243 | 0.207 * | 0.033 | 1.419 | 0.169 | 0.028 | 1.27 |
| Possibility of being impacted by water pollution | 0.206 | 0.024 | 1.359 | 0.048 | 0.039 | 1.665 | 0.256 * | 0.037 | 1.269 |
| Impact of water pollution on human health | 0.037 * | 0.028 | 1.37 | 0.041 | 0.049 | 1.935 | 0.227 | 0.093 | 6.616 |
| Experiences with water pollution | −0.045 | 0.044 | 1.568 | 0.174 * | 0.02 | 1.412 | 0.217 | 0.038 | 1.691 |
| Perceived benefits from industries | 0.105 | 0.045 | 4.669 | 0.03 | 0.018 | 1.171 | 0.06 | 0.063 | 4.313 |
| R2 | 0.561 | 0.659 | 0.37 | ||||||
| F | 5.745 | 8.346 | 1.98 | ||||||
© 2020 by the authors. Licensee MDPI, Basel, Switzerland. This article is an open access article distributed under the terms and conditions of the Creative Commons Attribution (CC BY) license (http://creativecommons.org/licenses/by/4.0/).
Share and Cite
Mumbi, A.W.; Watanabe, T. Differences in Risk Perception of Water Quality and Its Influencing Factors between Lay People and Factory Workers for Water Management in River Sosiani, Eldoret Municipality Kenya. Water 2020, 12, 2248. https://0-doi-org.brum.beds.ac.uk/10.3390/w12082248
Mumbi AW, Watanabe T. Differences in Risk Perception of Water Quality and Its Influencing Factors between Lay People and Factory Workers for Water Management in River Sosiani, Eldoret Municipality Kenya. Water. 2020; 12(8):2248. https://0-doi-org.brum.beds.ac.uk/10.3390/w12082248
Chicago/Turabian StyleMumbi, Anne Wambui, and Tsunemi Watanabe. 2020. "Differences in Risk Perception of Water Quality and Its Influencing Factors between Lay People and Factory Workers for Water Management in River Sosiani, Eldoret Municipality Kenya" Water 12, no. 8: 2248. https://0-doi-org.brum.beds.ac.uk/10.3390/w12082248