Article

Research on Biological Fluidized Bed System Treatment Performance and Nitrogen Removal Process for Seafood Processing Wastewater with Different Operation Conditions

1
Marine College, Shandong University, Weihai 264209, China
2
State Key Laboratory of Urban Water Resources and Water Environment, School of Marine Science and Technology, Harbin Institute of Technology at Weihai, Weihai 264200, China
3
Shandong Provincial Eco-Environment Monitoring Center, Jinan 250101, China
*
Author to whom correspondence should be addressed.
Submission received: 31 August 2021 / Revised: 22 September 2021 / Accepted: 22 September 2021 / Published: 24 September 2021

Abstract

:
In this study, the biological fluidized bed system was used to treat seafood processing wastewater. The sludge was collected from the secondary sedimentation tank of a municipal wastewater treatment plant and acclimated for 200 days before the experiment. The treatment efficiencies of simulated seafood processing wastewater by biological fluidized bed system with different sludge concentrations, different hydraulic retention times (HRTs) and different bio-carriers were studied. The results showed that the removal efficiency of nitrogen and phosphorus increased with the increasing sludge concentration and by extending hydraulic retention time, and the higher removal efficiency of nitrogen and phosphorus could be obtained with the higher specific surface area of the bio-carrier. The nitrogen removal process analysis showed that the nitrification and denitrification activity of sludge could be changed with different operation conditions resulting in different nitrogen removal efficiency in the biological fluidized bed system. This was mainly because the change tendency of the ammonia nitrogen oxidizing process, nitrite oxidizing process, nitrite reduction process and nitrate reduction process was different with different operation conditions in a high salinity environment. Theoretically, the difference of the inhibitory effect of a high-salt environment on different nitrification and denitrification processes could be used to realize shortcut nitrification denitrification by controlling a certain operation condition.

1. Introduction

Compared with general industrial wastewater treatment, there are some differences in the composition and properties of pollutants in seafood processing wastewater: High-salt wastewater is produced by processing dried, preserved and fermented seafood, accompanied by deep watercolor and high concentration of organic matter. The addition of phosphate and nitrogen to fresh seafood promotes higher phosphate and nitrogen content in the wastewater [1,2,3]. The presence of proteins, oil, minerals and other compounds in the effluents are responsible for significant environmental hazards [4,5,6]. Recently, the treatment of saline seafood processing wastewater has drawn great attention for researchers.
Several biological treatment processes have been applied to treat seafood processing wastewater. The wetland system is usually applied as the tertiary treatment due to the high solids content and organic matter concentration of the raw wastewater, and the highest treatment performances were found at five days hydraulic retention time (HRT) with average removal efficiencies of 91–99% for BOD5, 52–90% for SS, 72–92% for total nitrogen and 72–77% for total phosphorus [7]. Jamal et al. used air cathode microbial fuel cell (ACMFC) reactors to study the wastewater treatment efficacy of halophiles under high saline conditions, and the study revealed the optimized organic load was 1.25 g COD/L for potential treatment of seafood industrial wastewater and energy production [8]. In terms of organic removal and membrane performance, the membrane technology had a good efficiency to treat high strengths, with an organic loading variation characteristic of real seafood processing wastewater [9,10]. However, problems associated with membrane fouling and high cost may hamper widespread applications.
Thus, exploring technologically and economically feasible approaches to efficiently treat seafood processing wastewater will continue to be a challenge facing environmental scientists and engineers. Activated sludge and jute fiber in the sequencing batch reactor (JF-SBR) was used for the seafood processing wastewater treatment in one study, and the results revealed that the JF-SBR has higher efficiency compared to the conventional SBR [11]. The biofilm-enhanced high-salt wastewater treatment reactor used to remove nitrogen and organics simultaneously, using sulfate reduction as an intermediate reaction, promoted the gradual degradation of various pollutants and the spatial distribution of various functional bacteria, which ensured the stable and efficient operation of the biofilm-enhanced seawater wastewater treatment system [12].
A biological fluidized bed reactor was used in treating high-salt wastewater. A laboratory down-flow anaerobic fixed bed reactor (DFAFBR) has been used for treating saline wastewater, and organic nitrogen and phosphorus concentration reduction efficiencies were higher than 51% and 39%, respectively [13]. Liu et al. verified the faster start-up of a trickling filter (TF) compared to a moving bed bioreactor (MBBR) treating synthetic mariculture wastewater [14]. A hybrid treatment system (fluidized bed positioned in a biological reactor of an activated sludge process) was used to treat saline domestic wastewater, and the hybrid system had a significantly higher efficiency than a conventional reactor to treat saline domestic wastewater [15]. These findings demonstrate that the biological fluidized bed reactor is a viable option to treat seafood wastewater for safe disposal.
For the biological treatment system, the operation parameters (sludge concentrations, HRT, bio-carriers, etc.) could directly affect the operation performance of the system. It had been reported that large biomass might decrease the biofilm activity [16]. It has been shown that HRT is directly related to ammonia nitrogen removal rate [17]. Bio-carriers immobilize microorganisms on their surfaces and inside the internal pores, which contribute to stabilizing the reactor performance [18]. Some studies have focused primarily on using large surface area carriers [19,20]. The effect of operation parameters on the biological fluidized bed system treatment efficiency has rarely been studied for high salinity seafood processing wastewater.
In this study, a biological fluidized bed system was used to treat seafood processing wastewater to investigate the treatment performance and the nitrogen removal process under the conditions of different bio-carriers, different hydraulic retention times and different sludge concentrations. This study on the treatment performance and the nitrogen removal process in a biological fluidized bed system for seafood processing wastewater treatment can provide a theoretical basis for the subsequent application of biological fluidized bed systems in the treatment of salty wastewater.

2. Materials and Methods

2.1. Biological Fluidized Bed Setup

In this experiment, the biological fluidized bed reactor was made of Plexiglass and included a biological fluidized bed reactor and a sedimentation tank, as shown in Figure 1. The working volume of the biological fluidized bed reactor was 10 L, and it was designed as a cylinder. Polyurethane material bio-carrier was added in the biological fluidized bed system, and an aeration pipe was set at the bottom. The suspended bio-carriers have fluidized movement with gas-liquid flow. The effluent from the biological fluidized bed system flowed through the overflow pipe to the sedimentation tank for solid-liquid separation. The working volume of the sedimentation tank was 10 L. The effluent from the sedimentation tank overflowed and the sediment from the sedimentation tank was flowed back to the biological fluidized bed reactor every 24 h to maintain the sludge concentration of the biological fluidized bed reactor.
Two kinds of cubic sponge bio-carriers (1 × 1 × 1 cm) made of polyurethane foam (Nantai Environmental Protection Packing Co., Ltd., Yixing, China) were respectively added to build up the biological fluidized bed system. The two kinds of sponge bio-carriers with the specific surface area of 550 m2/m3 and 300 m2/m3, respectively, were denoted as K3 bio-carrier and K1 bio-carrier, respectively. The bio-carriers’ filling ratio (Vcarrier/Vreactor) was 15% in the biological fluidized bed system.

2.2. Operation of Biological Fluidized Bed System

In this experiment, five biological fluidized bed reactors were used to investigate treatment performance and the nitrogen removal process with different operation conditions. The influent of the biological fluidized bed reactor was simulated seafood processing wastewater. Crude starch was used as the organic carbon source; ammonium chloride, sodium dihydrogen phosphate and disodium hydrogen phosphate were used as nutrients. The seawater collected from Huang Hai (Shidao, Weihai, China) was used to synthetize the seafood processing wastewater, and the seawater contained a certain concentration of nitrogen and phosphorus elements. The seawater used for the preparation of seafood processing wastewater was collected from the place located near the aquaculture pond. There were various pollutants in the seawater, which was discharged by aquaculture organisms in the aquaculture pond. The concentration of the pollutants in the seawater was changed with the time. Therefore, the pollutant concentrations were not stable in the synthetic seafood processing wastewater. Meanwhile, the seawater contained some trace elements such as calcium, potassium, cesium, beryllium, magnesium, sulfur, tin and fluorine, etc. These trace elements were no longer added to the prepared seafood processing wastewater.
The inoculated sludge was collected from the secondary sedimentation tank of a municipal wastewater treatment plant in Weihai (Shandong Province, China). Because the high salinity of seafood processing wastewater can inhibit microorganism growth, the method of gradually increasing the proportions (seawater: fresh water) was used to acclimate the activated sludge before the experiment. Prior to the experiments, the biological fluidized bed reactors were operated at a steady state for 200 days.
According to the experimental design of hydraulic retention time, the time relay switch was set, and the inflow velocity was adjusted. The biological reaction tank was aerated with oxygen to maintain a suitable living environment for aerobic bacteria in sludge.
The biological fluidized bed system treatment performance and the nitrogen removal process were investigated under different (i) sludge concentrations (4000 mg/L and 8000 mg/L), (ii) HRTs (20 h, 10 h and 5 h) and (iii) bio-carriers (K3 and K1).

2.3. Analytical Methods

The water sample was taken from the influent and effluent of the biological fluidized bed reactor, respectively. The water sample was centrifuged at 5000 rpm for 5 min. After centrifugation, the supernatant was filtered by 0.45 μm filter membrane and the filtrate was measured.
In this study, the sludge concentration (MLSS), the nitrogen concentration and the phosphorus concentration were determined according to water and wastewater monitoring for water quality determination method [21]. Before the determination of nitrogen and phosphorus, the standard curve equation was obtained. The concentration of ammonia nitrogen (NH4+-N), nitrite nitrogen (NO2-N), nitrate nitrogen (NO3-N) and phosphorus in each sample can be calculated by the fitting equation. The detection limits for NH4+-N, NO2-N, NO3-N and phosphorus were 0.025 mg/L, 0.003 mg/L, 0.08 mg/L and 0.01 mg/L, respectively. All the above analyses were performed in triplicate, and their average values were listed.

2.4. Nitrification Activity Determination Method

A quantitative amount of sludge was taken from the reactor and placed in a 250 mL conical flask. The sludge sample was fully aerated for 15 min and then centrifuged. The sludge sample was washed with clean seawater three times to remove the inorganic nitrogen contained in the sludge sample and re-suspended in 200 mL clean seawater after centrifugation. The NH4+-N and other trace elements were added, and the reaction flask was placed in a constant temperature shaker at 30 °C and 100 rpm for shaking culture. The concentration of NH4+-N and NO2-N was regularly measured. The relationship between NH4+-N and NO2-N concentration and time was plotted, and the calculated slope was the oxidation rate of NH4+-N or NO2-N, and the ratio of the slope and sludge concentration was the oxidation activity of NH4+-N or NO2-N.

2.5. Denitrification Activity Determination Method

A quantitative amount of sludge was taken from the reactor and placed in a 250 mL conical flask. The sludge sample was washed with clean seawater and re-suspended in 200 mL clean seawater. The NO2-N, NO3-N and other trace elements were added. The sludge sample was filled in nitrogen for 15 min to remove oxygen. The bottle mouth was plugged with a rubber stopper to ensure the bottle had anaerobic reaction conditions. The reaction flask was placed in a constant temperature shaker at 30 °C and 100 rpm for shaking culture. The concentration of NO2-N and NO3-N was regularly measured. The relationship between NH4+-N and NO2-N concentration and time was plotted, and the calculated slope was the nitrate or the nitrite reduction rate, and the ratio of the slope and sludge concentration was the denitrification activity of nitrate or nitrite.

3. Results

3.1. Effect of Different Sludge Concentrations on Biological Fluidized Bed System Treatment Performance

The biological fluidized bed system treatment performance and the nitrogen removal process are investigated with different sludge concentrations in this section.

3.1.1. Effect of Sludge Concentration on Phosphorus Removal Performance

The measured phosphate concentration and removal efficiency are shown in Figure 2. From Figure 2a,b, it is not difficult to find that sludge concentration had a great influence on phosphorus removal. The average influent concentration of phosphate was 7.67 mg/L. During the operation of the reactor with the sludge concentration of 4000 mg/L, the average effluent concentration of phosphate was 4.94 mg/L with the average removal efficiency of 35%. For the reactor with the sludge concentration of 8000 mg/L, during the first five days of operation the effluent concentration of phosphate showed a decreasing trend, and after that, the effluent phosphate concentrations were always lower than 4.40 mg/L. The average effluent concentration of phosphate was 3.67 mg/L with the average removal efficiency of 53%. When the sludge concentration was higher, the phosphorus concentration in the effluent was lower and the phosphate removal efficiency was higher. The principle of using microorganisms to remove phosphate in wastewater was due to the function of phosphorus accumulating bacteria, and then a large amount of phosphorus-rich sludge was discharged to remove phosphorus from the wastewater [22,23]. Therefore, the sludge with higher concentration might contain much more phosphorus accumulating bacteria which could absorb and utilize phosphorus and reduce the phosphorus concentration in the effluent.

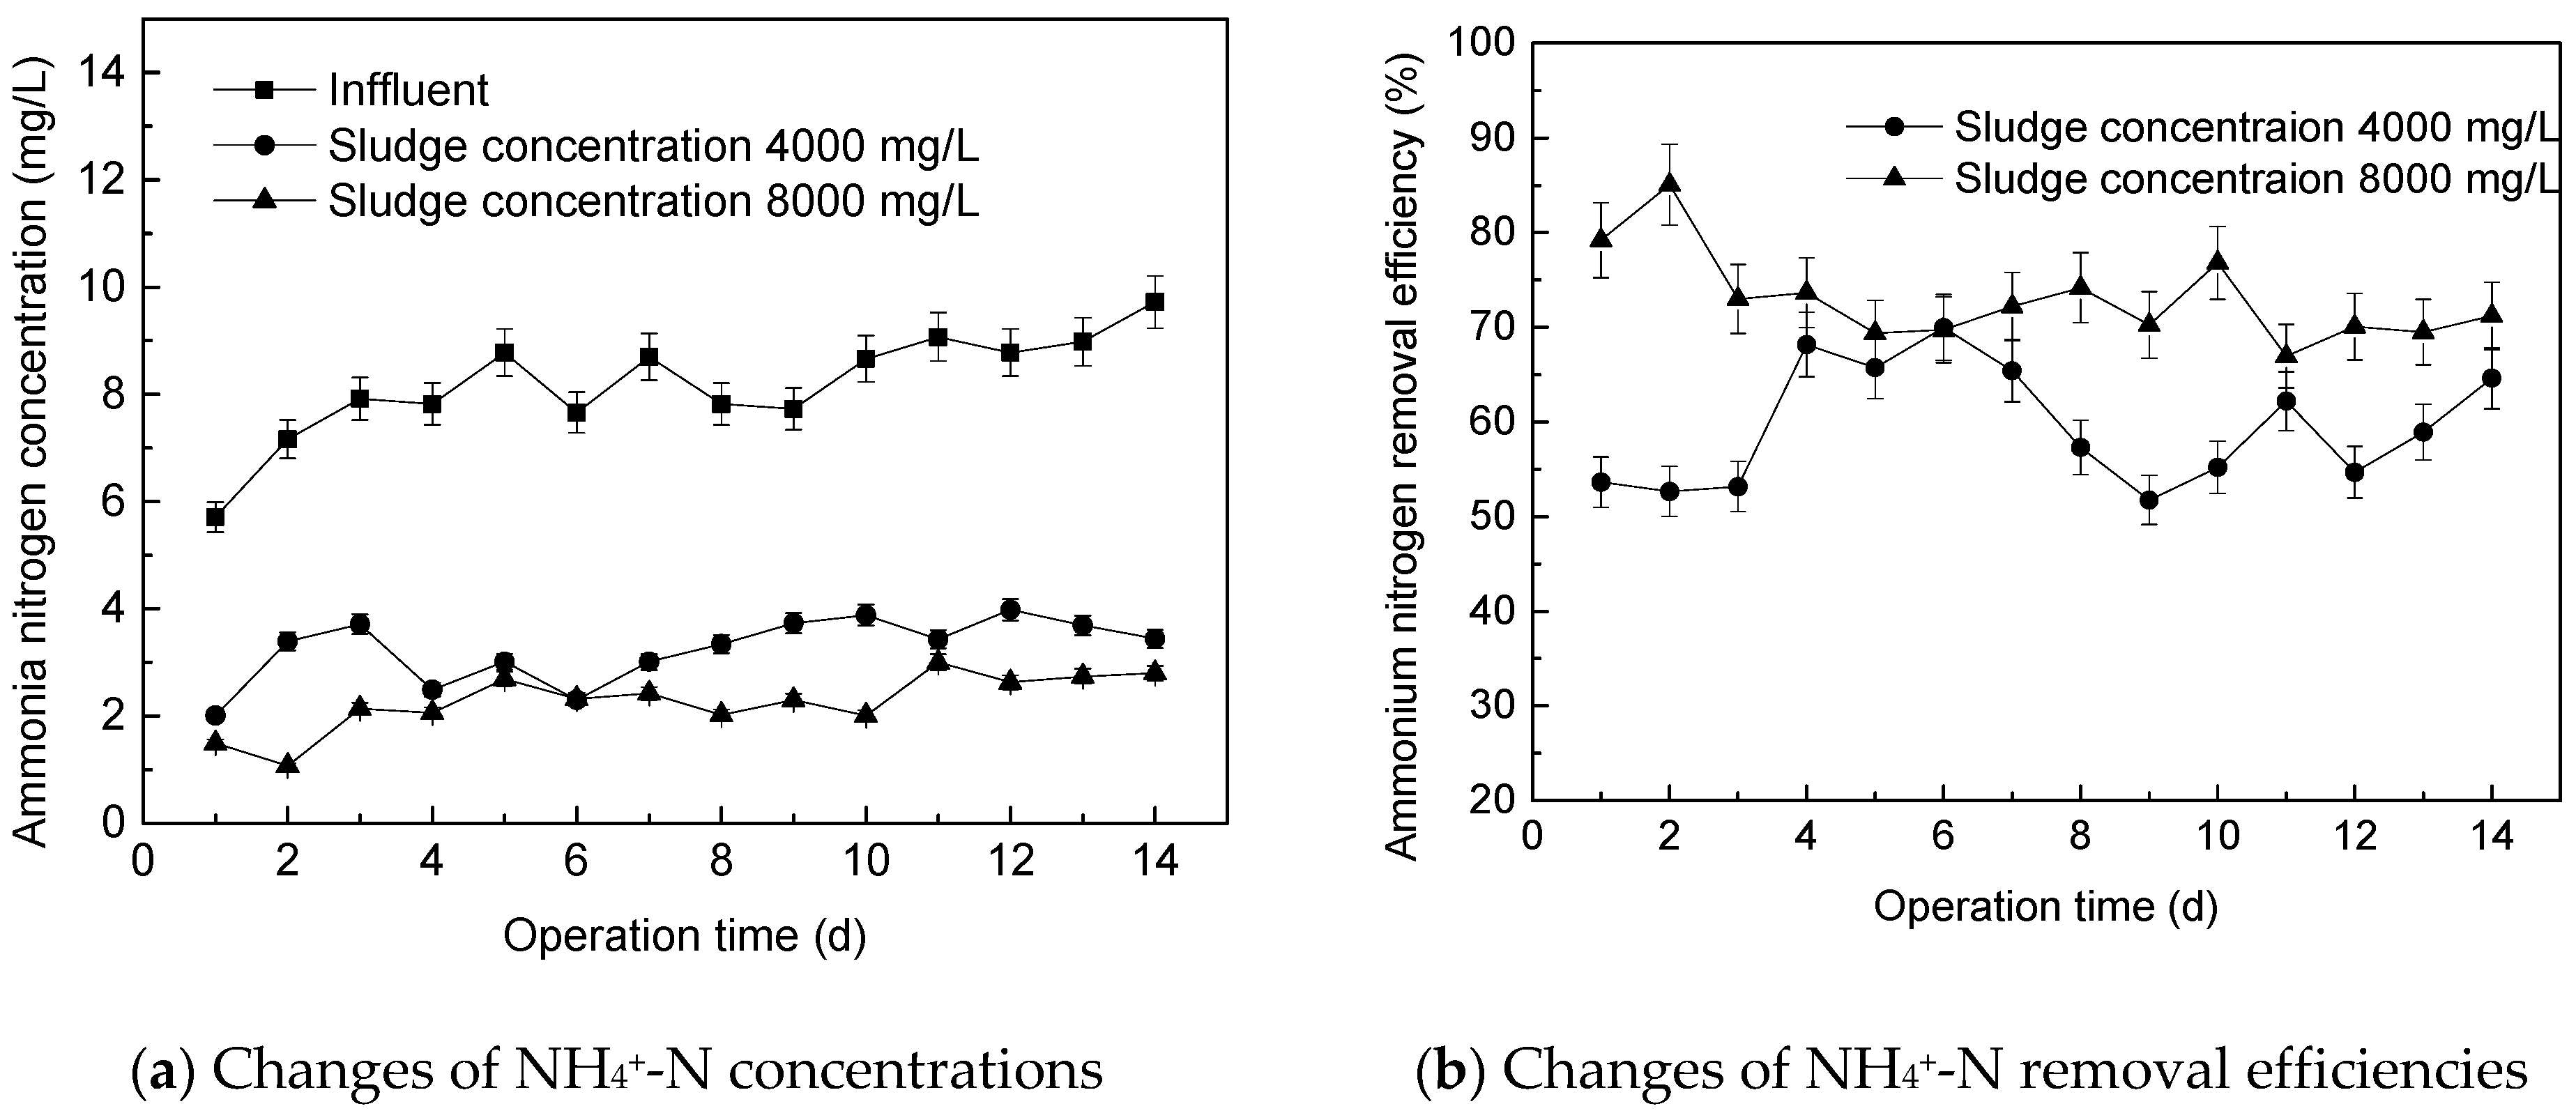
3.1.2. Effect of Sludge Concentration on Ammonia Nitrogen Removal Performance

The NH4+-N concentration and removal efficiency measured with different sludge concentrations are shown in Figure 3a,b.
As shown in Figure 3a,b, the influent NH4+-N concentration varied from 7.16 mg/L to 9.72 mg/L, and the average influent NH4+-N concentration was 8.28 mg/L. With the sludge concentration of 4000 mg/L, the average effluent NH4+-N concentration in the biological fluidized bed system was 3.34 mg/L with the average removal efficiency of 60%. During the operation of the reactor with the sludge concentration of 8000 mg/L, the average effluent NH4+-N concentration was 2.26 mg/L, and the average removal efficiency of NH4+-N could reach 73%. Comparing the effects of different sludge concentrations on the treatment efficiency of NH4+-N, it was not difficult to find that the removal efficiency of NH4+-N was higher in the reactor with the sludge concentration of 8000 mg/L compared to that with the sludge concentration of 4000 mg/L. Ammonia can be oxidized by ammonia-oxidized bacteria [24]. The percentage of ammonia-oxidized bacteria increased and might be responsible for the effective removal of NH4+-N [25]. Therefore, there were more ammonia-oxidized bacteria in the sludge with higher concentration and may have resulted in the improved oxidation ability of NH4+-N.

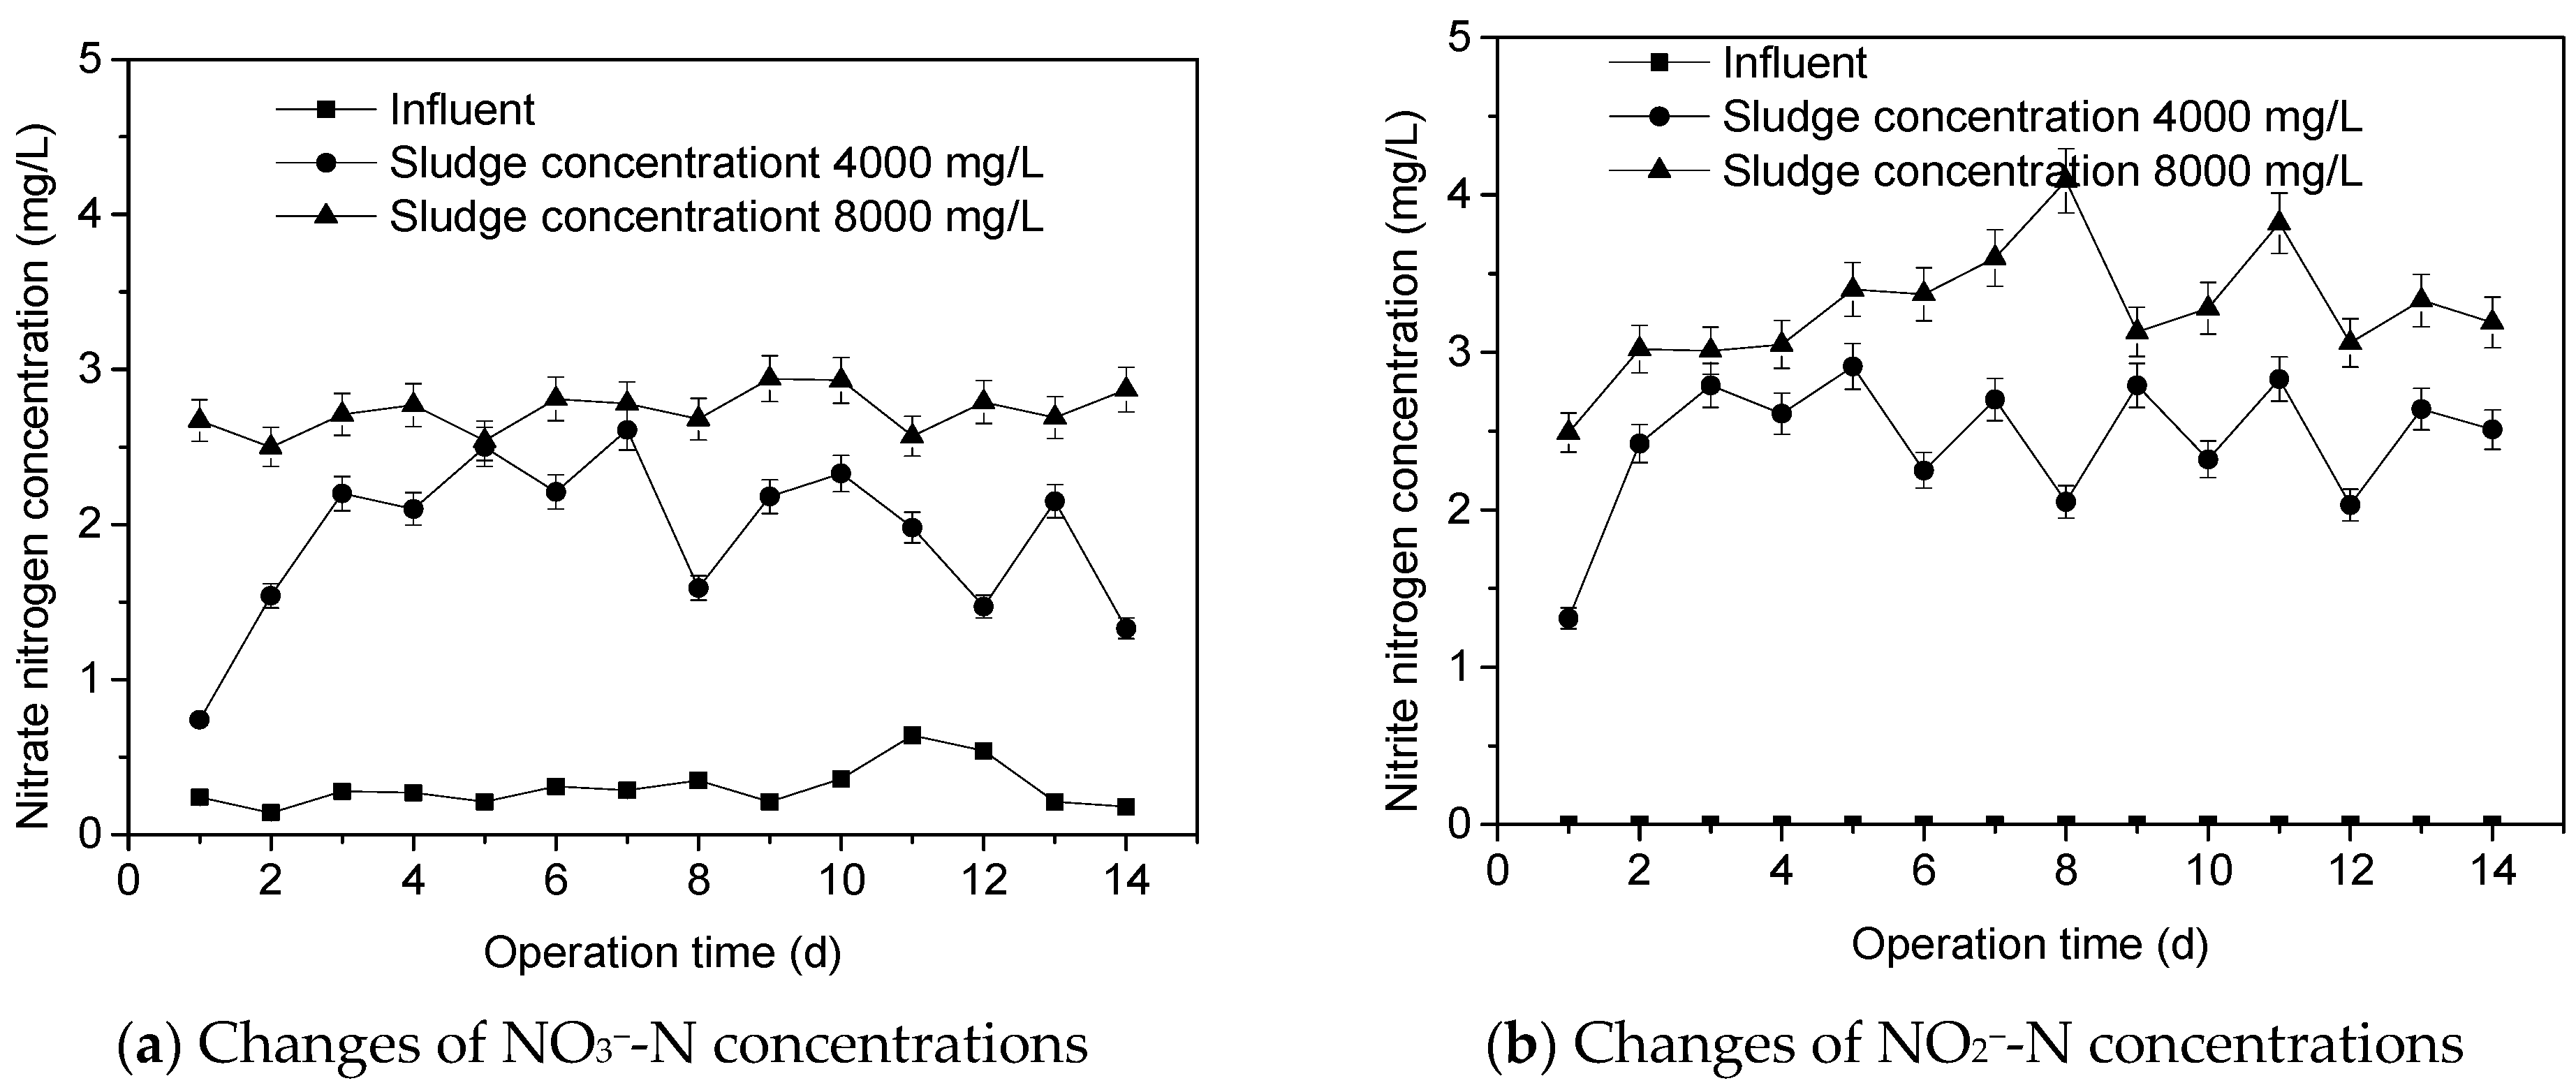
3.1.3. Variation of Nitrate Nitrogen and Nitrite Nitrogen Concentration

Under aerobic conditions, NH4+-N was oxidized to NO2-N and NO3-N through the nitrite-oxidized bacteria and ammonia-oxidized bacteria in the biological fluidized bed reactor. The changes of NO3-N and NO2-N concentration are shown in Figure 4.
As shown in Figure 4a, the average influent concentration of NO3-N was 0.30 mg/L. For the reactor with the sludge concentration of 4000 mg/L, the average concentration of NO3-N in the effluent was 1.92 mg/L. During the first three days of operation, the NO3-N concentration was not stable. From the fourth day onwards, the concentration of NO3-N in the effluent was relatively stable. With respect to the reactor with the sludge concentration of 8000 mg/L, the effluent NO3-N concentration was in the range from 2.50 mg/L to 2.94 mg/L. The higher sludge concentration might increase the quantity of nitrite-oxidization bacteria. The increased abundance of nitrite-oxidization bacteria could improve the adaption of nitrite-oxidization bacteria to the operation environment [25], making it effective to convert NO2-N into NO3-N for the reactor. Hence, the nitrite oxidation in the reactor was enhanced with the increase of sludge concentration.
As shown in Figure 4b, there was no NO2-N in the influent. The reactor was always able to resume its ammonia oxidization process in a two short days, suggesting that it was irrespective of sludge concentration. After that, the average NO2-N concentration in effluent was 2.53 mg/L to 3.36 mg/L for the reactor with the sludge concentration of 4000 mg/L and 8000 mg/L, respectively. The ammonia nitrogen oxidation in the reactor was enhanced with the increase of sludge concentration. It has been reported that the biofilter reactor with greater amount of biomass showed better NH4+-N removal and nitrification effects [16].

3.1.4. Variation of Nitrification and Denitrification Activity

Activated sludge is responsible for the main function of nitrogen removal in the reactor. The nitrification and denitrification activity of sludge is the basis for determining the nitrogen removal efficiency of the rector. The application of a biological carrier completely changed the growth state of activated sludge in the reactor. Therefore, this section discusses the mechanism of the increased activated sludge concentration to strengthen the nitrogen removal of the reactor by analyzing the changes of nitrification activity and denitrification activity during the stable operation of the reactor.
The ammonia oxidation and nitrite oxidation activities are shown in Table 1. It can be seen from Table 1 that after the increased activated sludge concentration, the nitrification activity of sludge improved to a certain extent. The ammonia oxidation activity increased from 8.1 mg N/g MLSS h to 10.5 mg N/g MLSS h, and the nitrite oxidation activity also slightly increased from 2.9 mg N/g MLSS h to 4.4 mg N/g MLSS h. This was because the increased activated sludge concentration promoted the enrichment of nitrifying bacteria in the system, and then improve the nitrification activity of the system. At the same time, the stable structure of the biological carrier and the porous internal space provided a stable growth space for the environment-sensitive nitrification bacteria (sensitive to a high-salt environment).
More importantly, in the reactor with different activated sludge concentrations, the ammonia nitrogen oxidation rate of activated sludge was significantly higher than that of nitrite. The oxidation of NH4+-N by activated sludge could be completed in a short time, while the oxidation of NO2-N needed a long time. This result showed that in the high-salt environment, the nitrification process in the system was mainly the oxidation of NH4+-N to NO2-N, and the oxidation process from NO2-N to NO3-N was obviously inhibited. This was mainly due to the inconsistent sensitivity of ammonia nitrogen-oxidizing bacteria and nitrite-oxidizing bacteria to high salinity. It was reported that nitrite-oxidizing bacteria were more significantly inhibited by salinity than ammonia nitrogen-oxidizing bacteria [26,27]. Theoretically, the difference of inhibitory effect of high-salt environment on different nitrification processes could be used to realize shortcut nitrification denitrification by controlling a certain biomass, and then realizing a low-cost and efficient shortcut nitrification denitrification nitrogen removal pathway in the reactor.
It can be seen from Table 1 that with the different sludge concentrations, the nitrite reduction activity and nitrate reduction activity were not high, and the denitrifying bacteria themselves grew and enriched slowly in the high-salt environment. As a result, denitrifying bacteria were difficult to enrich in the bio-carrier and the denitrification efficiency was low. After the increase of sludge concentration, the denitrification activity of sludge was significantly improved because the application of the bio-carrier fixed microorganisms in an anoxic environment to avoid the impact of aerobic on the enrichment of denitrifying bacteria. The bio-carrier provided a stable environment for microbial growth and the denitrifying bacteria grew slowly under high-salt stress, which were gradually enriched in the system, and then the denitrifying activity of sludge improved.

3.2. Effect of Different Hydraulic Retention Times on Biological Fluidized Bed System Treatment Performance

The biological fluidized bed system treatment performance and the nitrogen removal process are investigated under different HRTs in this section.

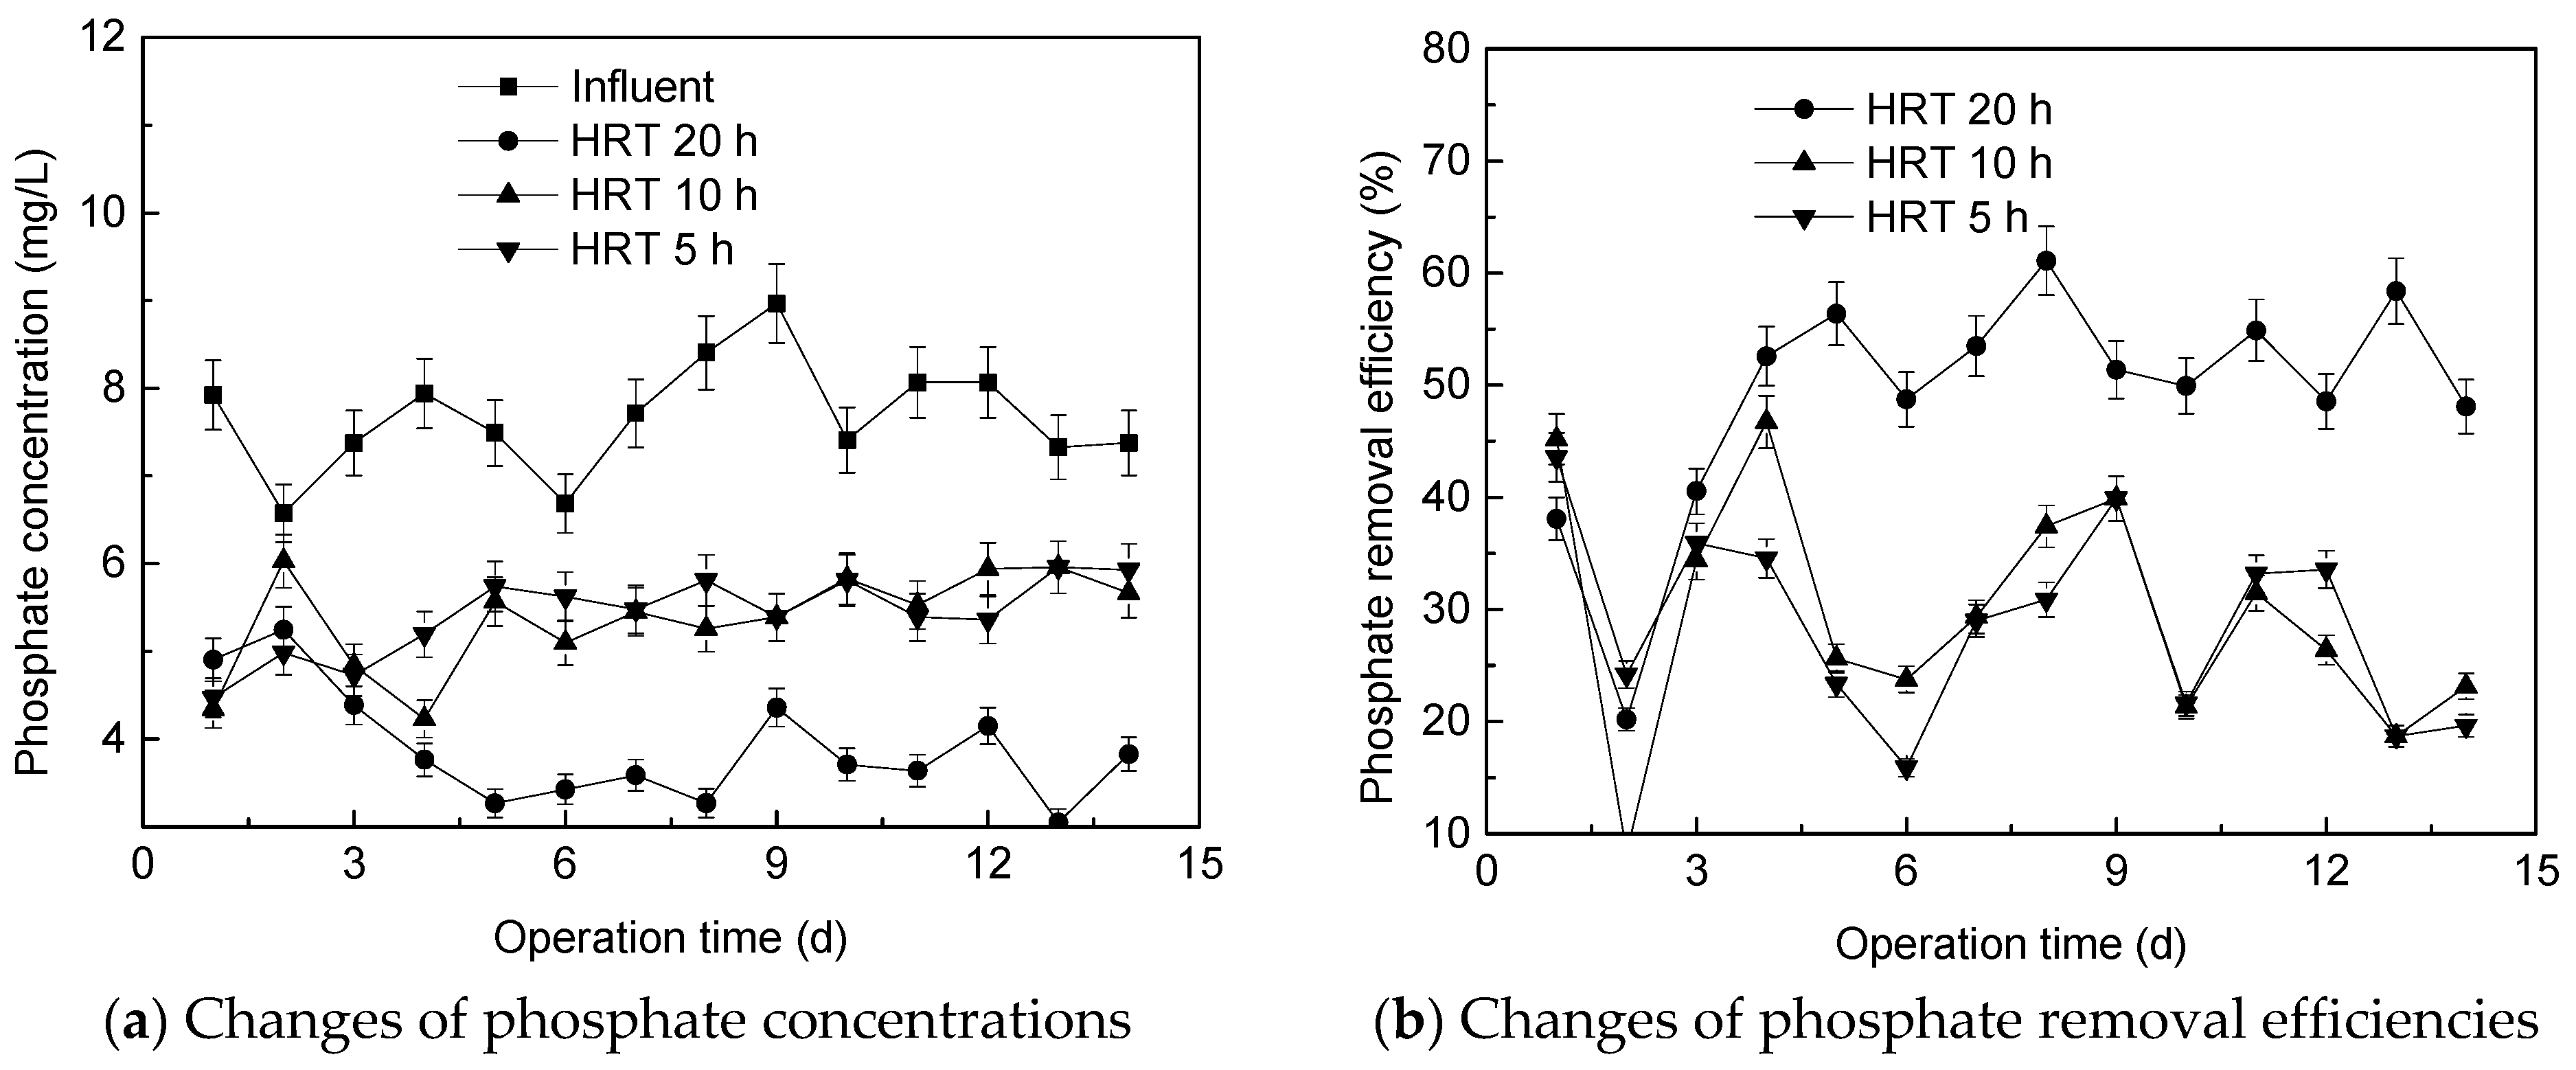
3.2.1. Effect of Hydraulic Retention Time on Phosphorus Removal Performance

The phosphorus concentration and phosphate removal efficiency curves with different HRTs are shown in Figure 5a,b.
It can be seen from Figure 5a that at the HRT 20 h, the phosphate concentration in the effluent of the biological fluidized bed system was between 3.05 mg/L to 5.25 mg/L with an average value of 3.90 mg/L. At the HRT of 10 h, the lowest phosphate concentration in the effluent was 4.23 mg/L and the highest phosphate concentration was 6.03 mg/L, and the average phosphate concentration was 5.37 mg/L. At the HRT of 5 h, the lowest phosphate concentration in the supernatant was 4.47 mg/L, and the highest phosphate concentration in the supernatant was 5.96 mg/L, and the average phosphate concentration was 5.42 mg/L. It was found that with the decrease of HRT from HRT 20 h to HRT 10 h, the phosphate concentration in the effluent of the biological fluidized bed system increased. When the HRT decreased from HRT 10 h to HRT 5 h, the phosphate concentration in the effluent of the biological fluidized bed system changed very little. The reason might be that the aerobic phosphorus-accumulating bacteria had enough time to absorb the phosphate in the wastewater under a longer HRT.
It can be seen from Figure 5b that the average removal efficiencies of phosphate were 49%, 29% and 29% for the reactor at HRT 20 h, 10 h and 5 h, respectively. With different HRTs, the phosphate removal efficiencies were relatively low in the biological fluidized bed system. The reason might be that the growth rate of the microorganism was slow under high-salt conditions and the phosphate removal was mainly attributed to the sludge wasting [28].

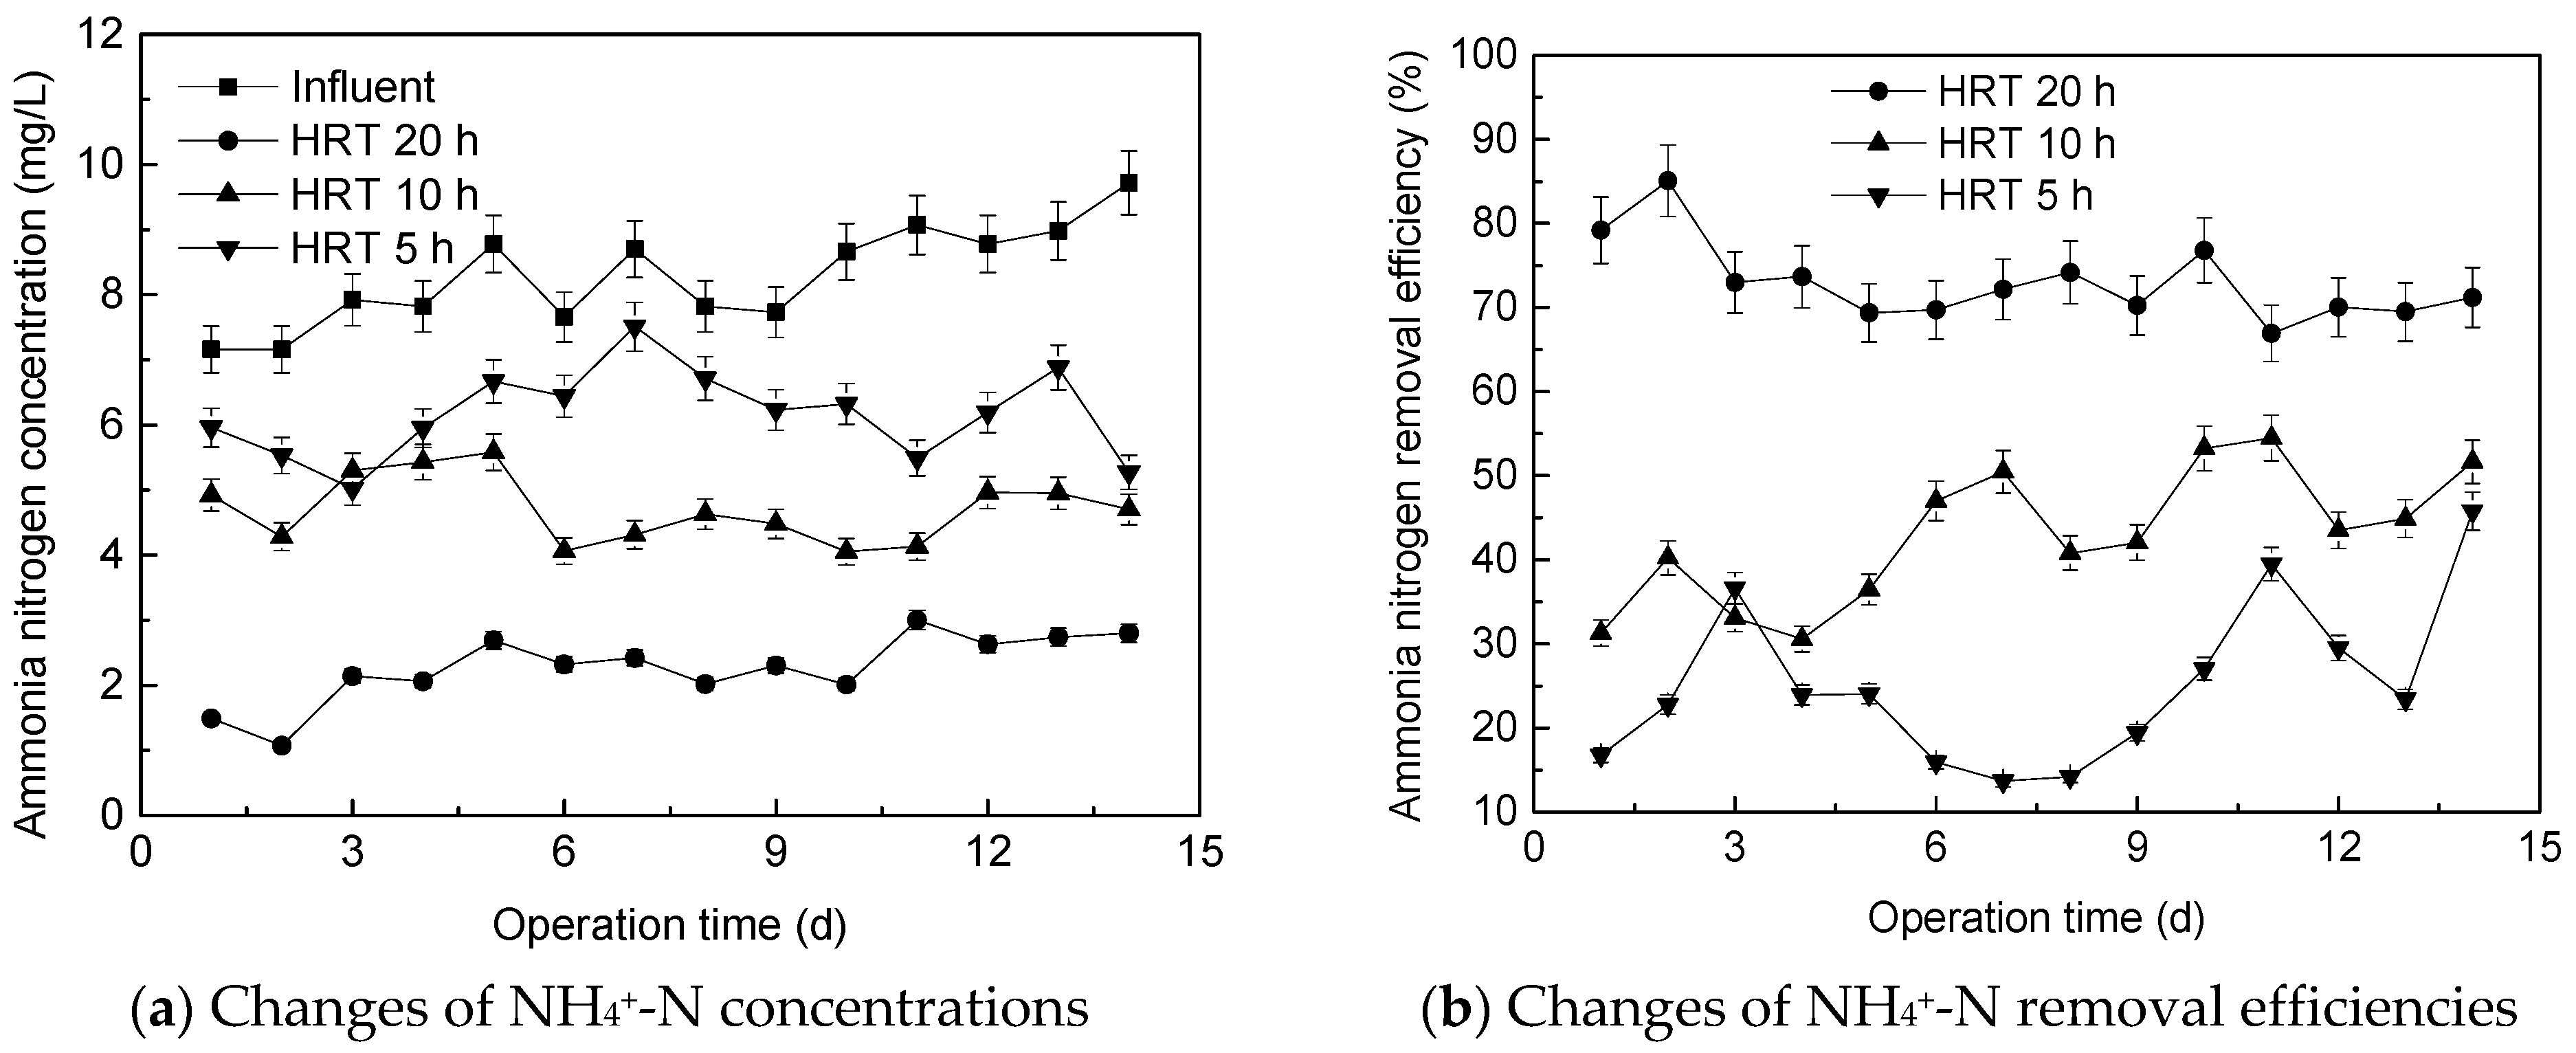
3.2.2. Effect of Hydraulic Retention Time on Ammonia Nitrogen Removal Performance

The changes of NH4+-N concentration and removal efficiency are shown in Figure 6. As shown in Figure 6a,b, at the HRT of 20 h, the NH4+-N removal efficiency reached 87%. At the HRT of 10 h, the average concentration of NH4+-N in biological fluidized bed system effluent was 4.70 mg/L, and the average removal efficiency of NH4+-N was 43%. At the HRT of 5 h, the average concentration of NH4+-N in biological fluidized bed system effluent was 6.16 mg/L, and the average removal efficiency of NH4+-N was 25%. It can be seen that with the increase of HRT, the removal efficiency of NH4+-N increased gradually. This could be because the doubling time for ammonia-oxidized bacteria was 7–8 h [29]. Due to the characteristics of ammonia-oxidized bacteria, the concentrations of the ammonia-oxidized bacteria might be higher with longer HRT. Therefore, the rector with longer HRT may be an effective ammonia nitrogen removal process.

3.2.3. Variation of Nitrate Nitrogen and Nitrite Nitrogen Concentration

The average concentrations of NO3-N and NO2-N are shown in Figure 7a,b with different HRTs.
As shown in Figure 7a,b, the NO3-N and NO2-N concentrations of the effluent increased due to nitrification in the biological fluidized bed reactor. At the HRT of 20 h, the average NO3-N concentration in the effluent was 2.73 mg/L, and the average concentration in the effluent was 3.27 mg/L. At the HRT of 10 h, the average NO3-N concentration in the effluent was 3.44 mg/L. The concentration of NO2-N in the effluent was 3.81 mg/L. At the HRT of 5 h, the average NO3-N concentration was 0.47 mg/L and in the effluent was 3.17 mg/L. The NO2-N concentration in the effluent was 0.49 mg/L. At the HRT of 20 h, the NO3-N and NO2-N concentrations in the biological fluidized bed reactor effluent both were lower than those for the HRT of 10 h but were significantly higher than those for the HRT of 5 h. It had been reported that high values of HRT allow adsorption and biodegradation processes to be carried out more easily [30]. Therefore, when the HRT was relatively long, microorganisms in the biological fluidized bed reactor had enough time for nitrification and denitrification processes. The HRT might have a profound effect on the activity of microorganisms in the biological fluidized bed reactor, and the time for microorganisms to participate in nitrification and denitrification may result in different nitrification and denitrification efficiency.

3.2.4. Variation of Nitrification and Denitrification Activity

The nitrification and denitrification activity of the reactor with different HRTs is shown in Table 2. In theory, the biological nitrification process was divided into two stages. Firstly, NH4+-N was oxidized by ammonia nitrogen-oxidizing bacteria to NO2-N, and then oxidized by nitrite-oxidizing bacteria to nitrate. It can be seen from the Table 2 that when the HRT was reduced from 20 h to 10 h, the ammonia and nitrite oxidation rate of activated sludge only decreased by 9.52% and 9.09%, respectively, meanwhile, the nitrite reduction activity and nitrate reduction activity significantly decreased by 43.4% and 27.8%, respectively. During the experiment, the contents of NH4+-N, NO3-N and NO2-N in the reactor at the HRT of 10 h gradually increased compared to those at the HRT of 20 h, and higher nitrite accumulation and NO3-N content were found.
When the HRT was reduced from 10 h to 5 h, the ammonia nitrogen oxidation and nitrite oxidation process deteriorated significantly. The nitrite reduction activity slightly decreased, but the nitrate reduction activity significantly decreased. Therefore, the NO2-N concentration was low, but there was some NO3-N in the effluent.
This result showed that although the HRT could change the nitrification and denitrification activity of sludge, the nitrification and denitrification activity could not achieve the synchronous recovery. This was mainly because the sensitivity of ammonia nitrogen-oxidizing bacteria, nitrite-oxidizing bacteria, nitrite-reduction bacteria and nitrate-reduction bacteria to high salinity was different [26]. Therefore, the enrichment and activity for these bacteria in high-salt environments were different.

3.3. Effect of Different Bio-Carriers on Biological Fluidized Bed System Treatment Performance

The biological fluidized bed system treatment performance and the nitrogen removal process are investigated with different specific surface area bio-carriers in this section.

3.3.1. Effect of Different Bio-Carriers on Phosphate Removal Performance

The curve of phosphorus concentration during the experiment is shown in Figure 8. As shown in Figure 8, the average concentration of phosphate in effluent was 3.90 mg/L with the average removal efficiency of 49% when the K3 bio-carrier was added into the reactor. When the K1 bio-carrier was added into the reactor, the effluent concentration of phosphate ranged from 3.36 mg/L to 5.75 mg/L with the average concentration of 4.41 mg/L, and the average removal efficiency of phosphate was 42%. It can be seen that the phosphorus removal efficiency was higher in the biological fluidized bed system for seafood processing wastewater treatment with the larger specific surface area of the K3 bio-carrier compared to that of the K1 bio-carrier. This may be due to the fact that the bio-carrier with large specific surface area created more suitable living conditions for microorganisms, which can improve the pollutants removal by having high biomass density and a rich biological phase [31].

3.3.2. Effect of Different Bio-Carriers on Ammonia Nitrogen Treatment Performance

The changes of NH4+-N concentration and removal efficiency obtained in the experiment are shown in Figure 9.
As shown in Figure 9, when the K3 type bio-carrier was added into the reactor, the average removal efficiency of NH4+-N was 73%. With addition of the K1 type bio-carrier into the reactor, the average NH4+-N removal efficiency was 64%. Similar to the phosphorus removal efficiency for different bio-carriers, with the larger specific surface area of K3 bio-carrier, the removal efficiency of NH4+-N in biological fluidized bed system for seafood processing wastewater treatment was higher than that of the K1 bio-carrier. It is likely that the bio-carrier with large specific surface area created more suitable living conditions for microorganisms. For wastewater treatment, biofilm carriers’ common characteristics were the high specific surface area and surface roughness [32]. Microbial communities in biofilms tended to be more diverse than those in the activated sludge system, which allowed the degrading of a wide range of organic pollutants [33].The high performance of the biofilm reactor was presumed to result from the high concentration of microorganisms attached to fluidized-carriers with high surface area [34].

3.3.3. Variation of Nitrite Nitrogen and Nitrate Nitrogen Concentration

The specific surface area of different bio-carriers was different which affected the attachment of microorganisms, and then affected the microbial efficiency in the biological fluidized bed reactor. The NO3-N and NO2-N concentrations under different bio-carrier conditions are shown in Figure 10.
As shown in Figure 10, compared with the effluent NO3-N concentration of the K1 bio-carrier reactor, the NO3-N concentration of the K3 bio-carrier reactor was higher. Compared with the NO2-N concentration in the two reactors, the NO2-N concentration in the effluent of K3 bio-carrier reactor was 3.27 mg/L, while the NO2-N concentration in the effluent of K1 bio-carrier reactor was 3.79 mg/L. That is to say, with the change of specific surface area of the bio-carrier, the ammonia nitrogen oxidizing activity, nitrite oxidizing activity, nitrite reduction activity and nitrate reduction activity also changed.

3.3.4. Variation of Nitrification and Denitrification Activity

The nitrification and denitrification activity of the reactor with different bio-carriers is shown in Table 3. It can be seen from the Table 3 that for the K1 bio-carrier reactor, the ammonia and nitrite oxidation rate of activated sludge only decreased by 8.57% and 2.27%, respectively, compared to that for the K3 bio-carrier reactor, indicating that the nitrification capacity was slightly affected by the bio-carrier characteristics.
However, for the denitrification in the K1 bio-carrier reactor, the nitrite reduction activity and nitrate reduction activity significantly decreased by 30.3% and 27.8%, respectively, compared to that for the K3 bio-carrier reactor. It was indicated that the denitrification ability was significantly affected by the bio-carrier characteristics.
Based on the above findings, in future studies the selective inhibition of a high-salt environment on two nitrifying bacteria should be used to make the nitrification process stay in the nitrosation stage to simply realize half nitrification. More importantly, the accumulation of nitrite caused by half nitrification indicated the possibility of nitrogen removal through a more cost-effective shortcut nitrification and denitrification process.

4. Conclusions

In this study, the effects of different sludge concentrations, hydraulic retention times (HRTs) and bio-carriers on the seafood processing wastewater treatment by biological fluidized bed system were investigated. It was observed that when the activated sludge concentration increased, the removal efficiency of nitrogen and phosphate was better in the biological fluidized bed system. With the extending HRT, the biological fluidized bed system could reach the higher nitrogen and phosphorus removal efficiency. The larger surface area bio-carrier was beneficial to the attachment and growth of microorganisms, resulting in higher nitrogen and phosphorus removal efficiencies. The change tendency of the ammonia nitrogen oxidizing process, nitrite oxidizing process, nitrite reduction process and nitrate reduction process was different with different operation conditions in the high salinity environment. Therefore, the nitrification and denitrification activity of sludge could be changed with different operation conditions, which had an obvious effect on the nitrogen removal efficiency in the biological fluidized bed system. The difference of inhibitory effect of a high-salt environment on different nitrification and denitrification processes could be used to realize shortcut nitrification denitrification by controlling a certain operation condition.

Author Contributions

Data curation, Z.G.; formal analysis, J.M.; investigation, Y.D., H.Y., W.S. and Z.L. (Zhenlin Liang); writing—original draft, Z.L. (Zhipeng Li); writing—review & editing, X.H. All authors have read and agreed to the published version of the manuscript.

Funding

This study was supported by the National Natural Science Fund of China (No. 51408158), the Supported by Open Project of State Key Laboratory of Urban Water Resource and Environment, Harbin Institute of Technology (No. QA201940), the Natural Science Foundation of Shandong Province of China (No. ZR2020QE232, No. ZR2019QEE012), and the Fundamental Research Funds for the Central Universities (No. HIT.NSRIF.2016098).

Institutional Review Board Statement

Not applicable.

Informed Consent Statement

Not applicable.

Data Availability Statement

Data presented in this study is contained within the article.

Acknowledgments

The authors are grateful to the editors and three anonymous reviewers for their constructive comments.

Conflicts of Interest

The authors declare that they have no conflict of interest.

References

  1. Jayashree, C.; Tamilarasan, K.; Rajkumar, M.; Arulazhagan, P.; Yogalakshmi, K.; Srikanth, M.; Banu, J.R. Treatment of seafood processing wastewater using upflow microbial fuel cell for power generation and identification of bacterial community in anodic biofilm. J. Environ. Manag. 2016, 180, 351–358. [Google Scholar] [CrossRef] [PubMed]
  2. Anh, H.T.H.; Shahsavari, E.; Bott, N.J.; Ball, A.S. The application of Marinobacter hydrocarbonoclasticus as a bioaugmentation agent for the enhanced treatment of non-sterile fish wastewater. J. Environ. Manag. 2021, 291, 112658. [Google Scholar] [CrossRef]
  3. Show, K.Y. 28—Seafood wastewater treatment. In Handbook of Water and Energy Management in Food Processing; Klemeš, J., Smith, R., Kim, J.K., Eds.; Woodhead Publishing: Sawston, UK, 2008; pp. 776–801. [Google Scholar]
  4. Venugopal, V.; Sasidharan, A. Seafood industry effluents: Environmental hazards, treatment and resource recovery. J. Environ. Chem. Eng. 2021, 9, 104758. [Google Scholar] [CrossRef]
  5. Anh, H.T.H.; Shahsavari, E.; Bott, N.J.; Ball, A.S. Bioaugmentation of seafood processing wastewater enhances the removal of inorganic nitrogen and chemical oxygen demand. Aquaculture 2021, 542, 736818. [Google Scholar] [CrossRef]
  6. Jamieson, B.L.; Gagnon, G.A.; Gonçalves, A.A. Physicochemical characterization of Atlantic Canadian seafood processing plant effluent. Mar. Pollut. Bull. 2017, 116, 137–142. [Google Scholar] [CrossRef]
  7. Sohsalam, P.; Englande, A.J.; Sirianuntapiboon, S. Seafood wastewater treatment in constructed wetland: Tropical case. Bioresour. Technol. 2008, 99, 1218–1224. [Google Scholar] [CrossRef]
  8. Jamal, M.T.; Pugazhendi, A.; Jeyakumar, R.B. Application of halophiles in air cathode MFC for seafood industrial wastewater treatment and energy production under high saline condition. Environ. Technol. Innov. 2020, 20, 101119. [Google Scholar] [CrossRef]
  9. Sridang, P.; Pottier, A.; Wisniewski, C.; Grasmick, A. Performance and microbial surveying in submerged membrane bioreactor for seafood processing wastewater treatment. J. Membr. Sci. 2008, 317, 43–49. [Google Scholar] [CrossRef]
  10. Sridang, P.C.; Kaiman, J.; Pottier, A.; Wisniewski, C. Benefits of MBR in seafood wastewater treatment and water reuse: Study case in Southern part of Thailand. Desalination 2006, 200, 712–714. [Google Scholar] [CrossRef]
  11. Zulkipli, M.A.; Bakar, J.A.; Bakar, M.; Mohamed, R.; Al-Gheethi, A. Optimization of Fixed-Bed Sequencing Bio-Reactors Using Jute Fibre for Seafood Processing Wastewater Treatment. Int. J. Integr. Eng. 2021, 13, 321–328. [Google Scholar]
  12. Li, W.; Liu, J.; Zhen, Y.; Lin, M.; Sui, X.; Zhao, W.; Bing, X.; Lin, J.; Zhai, L. Simultaneous removal of nitrite and organics in a biofilm-enhanced high-salt wastewater treatment system via mixotrophic denitrification coupled with sulfate reduction. J. Water Process. Eng. 2021, 40, 101976. [Google Scholar] [CrossRef]
  13. Rovirosa, N.; Sánchez, E.; Cruz, M.; Veiga, M.C.; Borja, R. Coliform concentration reduction and related performance evaluation of a down-flow anaerobic fixed bed reactor treating low-strength saline wastewater. Bioresour. Technol. 2004, 94, 119–127. [Google Scholar] [CrossRef]
  14. Liu, D.; Li, C.; Guo, H.; Kong, X.; Lan, L.; Xu, H.; Zhu, S.; Ye, Z. Start-up evaluations and biocarriers transfer from a trickling filter to a moving bed bioreactor for synthetic mariculture wastewater treatment. Chemosphere 2019, 218, 696–704. [Google Scholar] [CrossRef] [PubMed]
  15. Salmanikhas, N.; Tizghadam, M.; Mehrabadi, A.R. Treatment of saline municipal wastewater using hybrid growth system. J. Biol. Eng. 2016, 10, 9. [Google Scholar] [CrossRef] [PubMed] [Green Version]
  16. Zhang, X.; Li, J.; Yu, Y.; Xu, R.; Wu, Z. Biofilm characteristics in natural ventilation trickling filters (NVTFs) for municipal wastewater treatment: Comparison of three kinds of biofilm carriers. Biochem. Eng. J. 2016, 106, 87–96. [Google Scholar] [CrossRef]
  17. Johir, M.; Shanmuganathan, S.; Vigneswaran, S.; Kandasamy, J. Performance of submerged membrane bioreactor (SMBR) with and without the addition of the different particle sizes of GAC as suspended medium. Bioresour. Technol. 2013, 141, 13–18. [Google Scholar] [CrossRef]
  18. Al-Amshawee, S.; Yunus, M.Y.B.M.; Lynam, J.G.; Lee, W.H.; Dai, F.; Dakhil, I.H. Roughness and wettability of biofilm carriers: A systematic review. Environ. Technol. Innov. 2021, 21, 101233. [Google Scholar] [CrossRef]
  19. Klimenko, N.A.; Savchina, L.A.; Kozyatnik, I.P.; Goncharuk, V.V.; Samsoni-Todorov, A.O. The effect of preliminary ozonization on the bioregeneration of activated carbon during its long-term service. J. Water Chem. Technol. 2009, 31, 220–226. [Google Scholar] [CrossRef]
  20. Goncharuk, V.V.; Kozyatnik, I.P.; Klimenko, N.A.; Savchina, L.A. Natural bioregeneration of activated carbons in filters for add-on treatment of drinking water during their continuous operation. J. Water Chem. Technol. 2007, 29, 300–306. [Google Scholar] [CrossRef]
  21. CEPB. Standard Methods for Examination of Water and Wastewater, 4th ed.; Chinese Environmental Science Press: Beijing, China, 2002. [Google Scholar]
  22. Dorofeev, A.G.; Nikolaev, Y.A.; Mardanov, A.V.; Pimenov, N.V. Role of Phosphate-Accumulating Bacteria in Biological Phosphorus Removal from Wastewater. Appl. Biochem. Microbiol. 2020, 56, 1–14. [Google Scholar] [CrossRef]
  23. Barbosa, R.; Sleutels, T.; Verstraete, W.; Boon, N. Hydrogen oxidizing bacteria are capable of removing orthophosphate to ultra-low concentrations in a fed batch reactor configuration. Bioresour. Technol. 2020, 311, 123494. [Google Scholar] [CrossRef] [PubMed]
  24. Fu, Z.; Yang, F.; Zhou, F.; Xue, Y. Control of COD/N ratio for nutrient removal in a modified membrane bioreactor (MBR) treating high strength wastewater. Bioresour. Technol. 2009, 100, 136–141. [Google Scholar] [CrossRef] [PubMed]
  25. Wang, Z.; Luo, G.; Li, J.; Chen, S.-Y.; Li, Y.; Li, W.-T.; Li, A.-M. Response of performance and ammonia oxidizing bacteria community to high salinity stress in membrane bioreactor with elevated ammonia loading. Bioresour. Technol. 2016, 216, 714–721. [Google Scholar] [CrossRef]
  26. Jeong, D.; Cho, K.; Lee, C.-H.; Lee, S.; Bae, H. Effects of salinity on nitrification efficiency and bacterial community structure in a nitrifying osmotic membrane bioreactor. Process. Biochem. 2018, 73, 132–141. [Google Scholar] [CrossRef]
  27. Moussa, M.; Sumanasekera, D.; Ibrahim, S.; Lubberding, H.; Hooijmans, C.; Gijzen, H.; van Loosdrecht, M. Long term effects of salt on activity, population structure and floc characteristics in enriched bacterial cultures of nitrifiers. Water Res. 2006, 40, 1377–1388. [Google Scholar] [CrossRef]
  28. Xu, S.; Wu, D.; Hu, Z. Impact of hydraulic retention time on organic and nutrient removal in a membrane coupled sequencing batch reactor. Water Res. 2014, 55, 12–20. [Google Scholar] [CrossRef]
  29. Bock, E.; Koops, H.P.; Harms, H. Cell biology of nitrifying bacteria. In Nitrification; Prosser, J.I., Ed.; IRL: Oxford, UK, 1986; pp. 17–38. [Google Scholar]
  30. Estrada-Arriaga, E.B.; Mijaylova, P.N. Influence of operational parameters (sludge retention time and hydraulic residence time) on the removal of estrogens by membrane bioreactor. Environ. Sci. Pollut. Res. 2011, 18, 1121–1128. [Google Scholar] [CrossRef]
  31. Feng, Z.J.; Wu, M.; Sun, M.X.; Liu, H.Y.; Zhang, Y.Z.; Dai, J. The effects of different carriers on removal performance and membrane fouling by HMBR in treating sewage with low carbon-to-nitrogen ratio. Process. Saf. Environ. Prot. 2016, 102, 768–776. [Google Scholar] [CrossRef]
  32. Jurecska, L.; Barkács, K.; Kiss, É.; Gyulai, G.; Felföldi, T.; Törő, B.; Kovács, R.; Záray, G. Intensification of wastewater treatment with polymer fiber-based biofilm carriers. Microchem. J. 2013, 107, 108–114. [Google Scholar] [CrossRef]
  33. Zhao, Y.; Liu, D.; Huang, W.; Yang, Y.; Ji, M.; Nghiem, L.D.; Trinh, Q.T.; Tran, N.H. Insights into biofilm carriers for biological wastewater treatment processes: Current state-of-the-art, challenges, and opportunities. Bioresour. Technol. 2019, 288, 121619. [Google Scholar] [CrossRef]
  34. Jeong, Y.S.; Chung, J.S. Biodegradation of thiocyanate in biofilm reactor using fluidized-carriers. Process. Biochem. 2006, 41, 701–707. [Google Scholar] [CrossRef]
Figure 1. Biological fluidized bed system used in the experiment.
Water 13 02630 g001
Figure 2. Changes of phosphate concentrations (a) and phosphate removal efficiencies (b) under different sludge concentrations.
Water 13 02630 g002
Figure 3. Changes of NH4+-N concentrations (a) and NH4+-N removal efficiencies (b) under different sludge concentrations.
Water 13 02630 g003
Figure 4. Changes of NO3-N (a) and NO2-N (b) concentrations under different sludge concentrations.
Water 13 02630 g004
Figure 5. Changes of phosphate concentrations (a) and phosphate removal efficiencies (b) under different hydraulic retention times.
Water 13 02630 g005
Figure 6. Changes of NH4+-N concentrations (a) and NH4+-N removal efficiencies (b) under different hydraulic retention times.
Water 13 02630 g006
Figure 7. Changes of NO3-N (a) and NO2-N (b) concentrations under different hydraulic retention times.
Water 13 02630 g007
Figure 8. Changes of phosphate concentration under different bio-carrier conditions.
Water 13 02630 g008
Figure 9. Changes of NH4+-N concentrations (a) and NH4+-N removal efficiencies (b) under different bio-carrier conditions.
Water 13 02630 g009
Figure 10. Changes of NO3-N (a) and NO2-N (b) concentrations under different sludge concentrations.
Water 13 02630 g010
Table 1. Nitrification and denitrification activities in biological fluidized bed reactor with different sludge concentrations.
Sludge Concentraion
(mg/L)
Ammonia Nitrogen Oxidation Activity
(mg N/g MLSS h)
Nitrite Nitrogen Oxidation Activity
(mg N/g MLSS h)
Nitrite Reduction Activity
(mg N/g MLSS h)
Nitrate Reduction Activity
(mg N/g MLSS h)
40008.12.95.22.4
800010.54.47.63.6
Table 2. Nitrification and denitrification activities in biological fluidized bed reactor with different sludge concentrations.
HRT (h)Ammonia Nitrogen Oxidation Activity
(mg N/g MLSS h)
Nitrite Nitrogen Oxidation Activity
(mg N/g MLSS h)
Nitrite Reduction Activity
(mg N/g MLSS h)
Nitrate Reduction Activity
(mg N/g MLSS h)
2010.54.47.63.6
109.54.04.32.6
54.52.53.81.2
Table 3. Nitrification and denitrification activities in biological fluidized bed reactor with different sludge concentraion.
Bio-CarrierAmmonia Nitrogen Oxidation Activity
(mg N/g MLSS h)
Nitrite Nitrogen Oxidation Activity
(mg N/g MLSS h)
Nitrite Reduction Activity
(mg N/g MLSS h)
Nitrate Reduction Activity
(mg N/g MLSS h)
K310.54.47.63.6
K19.64.35.33.2
Publisher’s Note: MDPI stays neutral with regard to jurisdictional claims in published maps and institutional affiliations.

