
Climate Change and Water Exploitation as Co-Impact Sources on River Benthic Macroinvertebrates


1
Department of Theoretical and Applied Sciences, University of Insubria, 21100 Varese, Italy
2
Department of Science and High Technology, University of Insubria, 21100 Varese, Italy
*
Authors to whom correspondence should be addressed.
Water 2021, 13(19), 2778; https://0-doi-org.brum.beds.ac.uk/10.3390/w13192778
Submission received: 17 September 2021
/
Revised: 3 October 2021
/
Accepted: 5 October 2021
/
Published: 7 October 2021
(This article belongs to the Special Issue Effects of Climate Change on Freshwater Biodiversity)
Abstract
:Climate change can affect freshwater communities superimposing on other major stressors, such as water exploitation, with effects still poorly understood. The exacerbation of naturally-occurring periods of low flows has been reported as a major hydrological effect of water diversions, with severe impacts on river benthic macroinvertebrate communities. This study aimed at assessing long-term modifications of low-flow events in a large lowland Italian river possibly associated to climate change and the effects of these events, intensified by water withdrawals, on benthic macroinvertebrates. A 77-year dataset on daily discharge was thus analyzed through Mann-Kendall test and Sen’s method to investigate modifications of the main hydrological parameters. Moreover, macroinvertebrates were collected during the low-flow periods that occurred from 2010 to 2015 at three sites downstream of water withdrawals, representing three different conditions of hydrological impairment. After assessing possible differences in taxonomical and functional composition between sites and impairment conditions, redundancy analysis and ordinary least squares regression were performed to link benthos metrics to environmental (hydrological and physico-chemical) characteristics. An increase in the duration of the low-flow periods and reduced summer flows were detected on the long term, and the magnitude of low flows was significantly altered by water withdrawals. These hydrological features shaped both structural and functional characteristics of benthic assemblages, highlighting the need for a more environmentally-sustainable water resource management in the current context of climate change.
1. Introduction
Biological communities of lotic ecosystems are subjected to numerous anthropogenic pressures, including pollution, introduction of invasive alien species, morphological and hydrological alterations, and climate change. Particularly, the last two are strictly interconnected, since modification of temperatures, precipitations, and flow regimes induced by climate change can affect both water availability and freshwater demand for human activities [1]. Low flows are one main hydrological components that can be significantly influenced by both water exploitation and climate change. Low-flow periods, which naturally occur in flow regimes, are magnified by off-stream water diversion, particularly in irrigated areas where low flows naturally take place in summer, as it commonly occurs in the Mediterranean region [2]. Despite modelling uncertainty in hydro-climatic scenarios, there is general consensus about expected exacerbation of low-flow periods over the next decades in central and southern Europe, e.g., [3,4,5,6,7,8].
From an ecological point of view, naturally occurring low flows act as an environmental filter by selecting species owing traits that make them able to survive to such extreme conditions [9]; moreover, they provide physical conditions essential for maintaining phenological cycles [10]. However, exacerbated low flows (in terms of duration, frequency, or magnitude) can induce several detrimental effects on riverine communities [11,12,13].
In order to mitigate the detrimental effects of reducing (or even eliminating) the streamflow below water intakes, minimum flows (MFs) are currently implemented in many European countries [14]. The quantification of MFs is often based on simple hydrologic rules, typically fixed percentages of the mean annual natural flow (MANF) estimated at the intake section [15,16,17,18]. Though the adequacy of “static” MFs as a restoration measure is questionable, since MFs do not account for the intrinsic variability of natural flow regimes [19], the implementation of naturally-shaped releases downstream of water withdrawals (i.e., environmental flows) remains a major issue [10,20]. In fact, the ecological evidence of MFs suitability to effectively protect river ecosystems is poor, highlighting the need for a deeper understanding of the link between specific flow metrics and biotic response [21].
In this study we analyzed a 77-year (from 1943 to 2019) time series of daily flows in the Ticino River (i.e., one of the major Italian rivers) to identify temporal modifications in key hydrological indicators. This analysis was carried out in the uppermost section of the lowland course of the river, i.e., the Lake Maggiore outlet. Moreover, an analysis of the ecological effects of low-flow periods on benthic macroinvertebrates was conducted in a river section subjected to significant water withdrawals, located a few kilometers downstream from the lake outlet.
Our aims were to: (i) identify long-term modifications of the streamflow pattern with specific reference to the expected exacerbation of low-flow conditions due to climate change; (ii) explore relationships between the characteristics of low flows shaped by water withdrawals and the macroinvertebrate community, in terms of composition and ecological functionality. The effects of different management practices (i.e., different MF values) and the season of occurrence of the low flows (i.e., the warm irrigation period or the cold non-irrigation period) were taken into account. Specifically, we hypothesized that the benthic macroinvertebrate community is poorer and less diverse at sites characterized by lower MF values with a consequent loss of functional components, and that these differences are more evident during the warm irrigation period, due to larger water withdrawal.
This study could support the implementation of improved withdrawal schemes, incorporating global change effects in long-term planning of water resource management [22,23,24]. Additionally, thanks to the long and continuous time series of river discharge with daily resolution, this paper provides one of the few assessments of long-term modification in hydrological pattern for Italian watercourses [25].
2. Materials and Methods
2.1. Study Area
The Ticino River is the main tributary of the Po River (northern Italy) in terms of flow rate (MANF at Po confluence: 348 m3 s−1). It flows from the Swiss Alps to Lake Maggiore for ~90 km and then from the lake to the Po River for ~110 km (Figure 1). Its watershed area is 8172 km2, including mountainous areas from the source to the lake outlet and lowland agricultural areas. Urbanized areas are mainly located near the lake and on the east side of the lowland course. Climate in the Ticino River watershed ranges from cold (Df, in the upland catchment) to temperate (Cf, in the lowland catchment, including the study reach), based on Köppen climate classification [26].
Since 1943, the lake outflow is regulated by the Miorina Dam (Figure 1) to optimize the water use in the downstream section of the river; no water diversion takes place at this dam. Water releases through the dam depend on the water level of the lake, according to limits established by laws. Discharge is controlled through movable gates that are fully opened during floods. The mean annual lake outflow is 280 m3 s−1.
In the lowland course (i.e., downstream of Lake Maggiore), the authorized maximum cumulative water diversion approximately equals the mean annual outflow of the lake. Specifically, about 4 km below the Miorina Dam water is diverted to the western side of Ticino River (max. 70 m3 s−1) through the intake of the Regina Elena Canal, mostly for irrigated agriculture. About 3 km downstream, the largest off-stream diversion takes place at the Panperduto Dam (Figure 1), which has been active since 1884, and currently allows for a maximum diversion to the eastern side of Ticino River of approximately 60% of the river mean annual discharge (i.e., 170 m3 s−1), for agriculture and hydropower. A further relevant diversion (maximum 44 m3 s−1 for mixed irrigation and hydropower use) occurs 22 km downstream of the Panperduto Dam, by the Langosco Canal intake (active since 1665; Figure 1). Mandatory monthly-modulated MFs are currently released below both the Panperduto Dam and the Langosco Canal intake. However, streamflow generally exceeds MFs during the periods of high water availability, i.e., mainly in spring due to snowmelt and in autumn due to rainfall. Conversely, two periods of low flows usually occur in winter and in summer.
We selected three sampling sites (Figure 1) that differed for the magnitude of MFs:
- MF1 (Minimum Flow 1), located immediately (i.e., 3 km) below the Panperduto Dam; at this site, MF varies from 4% to 11% of the MANF;
- IF1 (Increased Flow 1, compared to MF1), located 15 km downstream of the Panperduto Dam. Flows at this site are influenced by the contribution of the residual basin (the basin area increase between MF1 and IF1 is 52 km2) and of groundwater exchange; MFs released at the Panperduto Dam are thus increased by 7 m3 s−1 on average compared to MF1, reaching 7–13% of the MANF;
- MF2 (Minimum Flow 2), located 23.5 km downstream from the Panperduto Dam, and short distance (i.e., 1.5 km) below the intake of the Langosco Canal. At this site, a MF amounting to 2–4% of the MANF is released, which is gradually increased through further downstream contributions, reaching the same MF values as in MF1 in a few km.
River morphology was instead comparable among sites. Except for the presence of minor riprap areas, the riverbed morphology is predominantly natural in all sites, with alternation of riffles, runs, and pools, and the substrate is mainly composed of cobbles (6–20 cm diameter).
2.2. Data Collection
At the three study sites, benthic macroinvertebrate sampling was carried out during low-flow periods, on one to three occasions according to the length of the period, from 2010 to 2015 (N = 20 samples per site, see Table S1). Benthic macroinvertebrates were collected with a Surber sampler of 0.05 m2 area and 500 µm mesh, following a quantitative multi-habitat protocol [27]. The adopted sampling method requires three steps: (1) visual quantification of the different substrates within a representative river reach, (2) proportional assignments of ten subsamples according to the areal distribution of the substrates, and (3) integration of the ten subsamples into a single sample, corresponding to a 0.5 m2 total sampled area. The samples were preserved in formalin (4%) and analyzed in the laboratory. Individuals belonging to Plecoptera, Ephemeroptera, Turbellaria, and Hirudinea were identified to the genus level and the others to the family level using dichotomous keys [28] and photographic atlas [29].
On each benthos sampling date, temperature (T), dissolved oxygen (DO) concentration and saturation, pH, and electrical conductivity (EC) were measured in situ (at a single point per sampling site) using the YSI Professional Plus portable multiparameter probe (YSI, Yellow Springs, USA). Additionally, water samples were collected and analyzed in the lab according to standard methods [30] to measure the concentration of ammonia nitrogen (NH4+-N), nitrate nitrogen (NO3−−N), total nitrogen (TN), total phosphorus (TP), chemical oxygen demand (COD), and biochemical oxygen demand in five days (BOD5).
Mean daily streamflow downstream of the Miorina Dam (i.e., the lake outflow, Figure 1) and at the three sampling sites were kindly provided by the Ticino Consortium for the periods 1943–2019 and 2010–2015, respectively. Specifically, the lake outflow and the discharge in the mentioned diversion canals were measured by stage gauging, starting in the 1940s. An additional gauging station located close to IF1 (Figure 1) was active during 2010–2015. Flows at the sampling sites MF1 and MF2 were then calculated by continuity.
2.3. Data Analysis
The streamflow time series (from 1943 to 2019) at the Miorina Dam was processed to detect temporal changes in the main hydrological parameters by using the software developed by The Nature Conservancy, which allows for the calculation of the indicators of hydrologic alteration (IHA, [31]). A preliminary check to detecting autocorrelation was performed by Ljung–Box test. Then, the Mann-Kendall test (or its modified version for significantly autocorrelated parameters [32]) and Sen’s method were applied to test for significant temporal trends in the values of 47 hydrological metrics, i.e., the 33 IHA, the average monthly flows normalized by the average annual flow, and the frequency and duration of extreme low-flow periods (i.e., periods with flow values lower than the 10th percentile).
The IHA parameters were also calculated for the streamflows of the three sampling sites, for the six years of the macroinvertebrate study (from 2010 to 2015). A discriminant analysis (DA) of the calculated hydrological parameters was performed to assess possible differences between streamflow patterns in the three sampling sites. Moreover, possible differences of the water physico-chemical parameters measured concurrently to benthos sampling at the three study sites were evaluated using the Kruskal–Wallis test, followed by the Dunn test for pairwise comparisons.
The structure of the zoobenthic communities was described through standard metrics, i.e., total density (N), family richness (S), and Shannon-Wiener diversity (H). We also considered the richness of families belonging to the orders Ephemeroptera, Plecoptera, and Trichoptera (EPT), the relative abundance of EPT taxa (%EPT), and the ratio of Chironomidae/Diptera individuals (C/D). The functional analysis was conducted by calculating the abundance of each functional feeding group (FFG) in the macroinvertebrate assemblages (active and passive filter feeders = AFF and PFF, gatherers-collectors = GAT, grazers-scrapers = GRA, miners = MIN, predators = PRE, parasites = PAR, shredders = SHR, and xylophagous taxa = XYL), based on the information available in the freshwaterecology.info database v. 7.0-10/2016 [33]. Specifically, a fuzzy data coding was used, i.e., each family/genus in the database was associated to each of ten feeding types with a value ranging from 0 (no preference) to 10 (complete selectivity for one feeding type). Per each taxon, we multiplied this value by the number of individuals counted. The total number of individuals belonging to each feeding group was finally calculated summing up and dividing by 10 all the values referring to each feeding type. From the same database, information about voltinism was extracted to calculate the relative abundance of taxa with one or less generation cycle per year (i.e., semivoltines and univoltines) and that of taxa with more than one generation cycle per year (i.e., multivoltines). Moreover, based on the values of the above-mentioned functional groups, the following metrics proposed by Merritt et al. [34] were calculated: the ratio between primary consumers feeding on autochthonous primary producers and those feeding on allochthonous biomass, indicating the degree of autotrophy of the system (auto/heterotrophy—A/H); the ratio between secondary consumers and primary consumers, indicating control of predators on prey (top-down control—TDc); and the ratio between the relative abundance of multivoltine organisms and that of semivoltines and univoltines, indicating the pioneering degree of the community (life cycle—LC).
In order to account for the variability due to sampling season and for seasonal differences in water uses, all samples were categorized into two sampling periods, as follows: samples collected from November to April, i.e., during cold months, when streamflow is mostly affected by withdrawals for hydropower (indicated as Non-Irrigation cold—NI-cold-samples), and samples collected from May to October, i.e., during warm months, when large water withdrawals for irrigation take place (indicated as Irrigation warm—I-warm-samples).
Compositional dissimilarity (both taxonomical and in FFGs) between macroinvertebrate samples was quantified using the Bray–Curtis index. This index ranges from 0 (indicating complete similarity) to 1 (indicating complete dissimilarity). Bray–Curtis distances were visually displayed in a two-dimensional ordination space using a non-metric multidimensional scaling (NMDS). Two-way analysis of similarities (ANOSIM) was performed to test the macroinvertebrate assemblages for significant differences in taxonomical and functional composition accounting for “site” and “period” factors. Similarity of percentages (SIMPER) was used to identify the taxa responsible for significant differences in the community structure.
Differences of the benthos metrics between sample groups (site*period) were analyzed by the Kruskal-Wallis test, followed by the Dunn test for pairwise comparisons.
For all the above-mentioned tests, significance level was set at p < 0.05 and Bonferroni correction of the p values was applied.
Environment-ecology relationships were investigated by redundancy analysis (RDA) and ordinary least squares (OLS) regression between benthos metrics and both hydrological and physico-chemical parameters. The latter comprised the above-mentioned spot measurements, carried out concurrently to benthos sampling. In the case of hydrological variables, twenty metrics (selected and modified from Schneider et al. [35]) were computed over the 90-days time-span before macroinvertebrate sampling, an adequate time interval for the detection of the effects of water diversion on macroinvertebrate assemblages [36]. Sorted by the five major categories of the hydrological regime (magnitude, rate of change, frequency, duration, and timing, [11]), the adopted flow metrics were:
- Magnitude: mean flow (QM), coefficient of variation (QCV), minimum (Qmin), maximum (Qmax), 25th (QP25), 50th (QP50), and 75th (QP75) flow percentiles, difference between maximum and minimum (ΔQ), and mean flow of the sampling date (QS);
- Rate of Change: mean and maximum increase (INCM and INCMax) and decrease (DECM and DECMax), and last increase (INCL) and decrease (DECL) of flows between two consecutive days;
- Frequency: number of low-flow days (FRELF), here defined as days with a flow lower than 10% of the MANF, and number of high-flow days (FREHF), defined as days with discharges at least three times larger than the median flow [37];
- Duration: maximum duration (number of days) of low flows (DURLF-max) and duration of the low-flow period immediately before the sampling (DURLF-last);
- Timing: number of days from the last high-pulse (TIMHF) day (this metric was not calculated over the previous 90 days but considering the whole dataset before each sampling date).
For the RDA, only two hydrological variables were selected, based on the related contribution to the two main axis of the principal component analysis (PCA—carried out with all the parameters) and the correlation with the other variables. Before RDA, all the variables were standardized.
For OLS regression, the best model approach according to Akaike information criterion was used. Unstandardized and untransformed data were used to estimate the coefficients directly in the original data units, and the model result was constrained to only one independent variable in order to find simple associations potentially informative for water resources managers and environmental protection authorities.
The statistical analyses were carried out using MAKESENS (Mann-Kendall test and Sen’s method) [38], the R 3.5.2 package “portes” (Ljung-Box test) [39], the R 3.5.2 package “modifiedmk” (modified Mann-Kendall test [32]) [40], PAST 3.09 (NMDS, ANOSIM, SIMPER) [41], and XLSTAT2014 (for all the other analyses) [42] software.
3. Results
3.1. Long-term Analysis of Lake Maggiore Outflows
Considering the 77-year time series (1943–2019) of the Lake Maggiore outflows, seven out of the considered 47 hydrological metrics showed a significant (p < 0.05) monotonic trend (Table 1 and Figure 2).
Only two metrics (i.e., Lo pulse # and reversals) were significantly autocorrelated according to Ljung–Box test (Table 1).
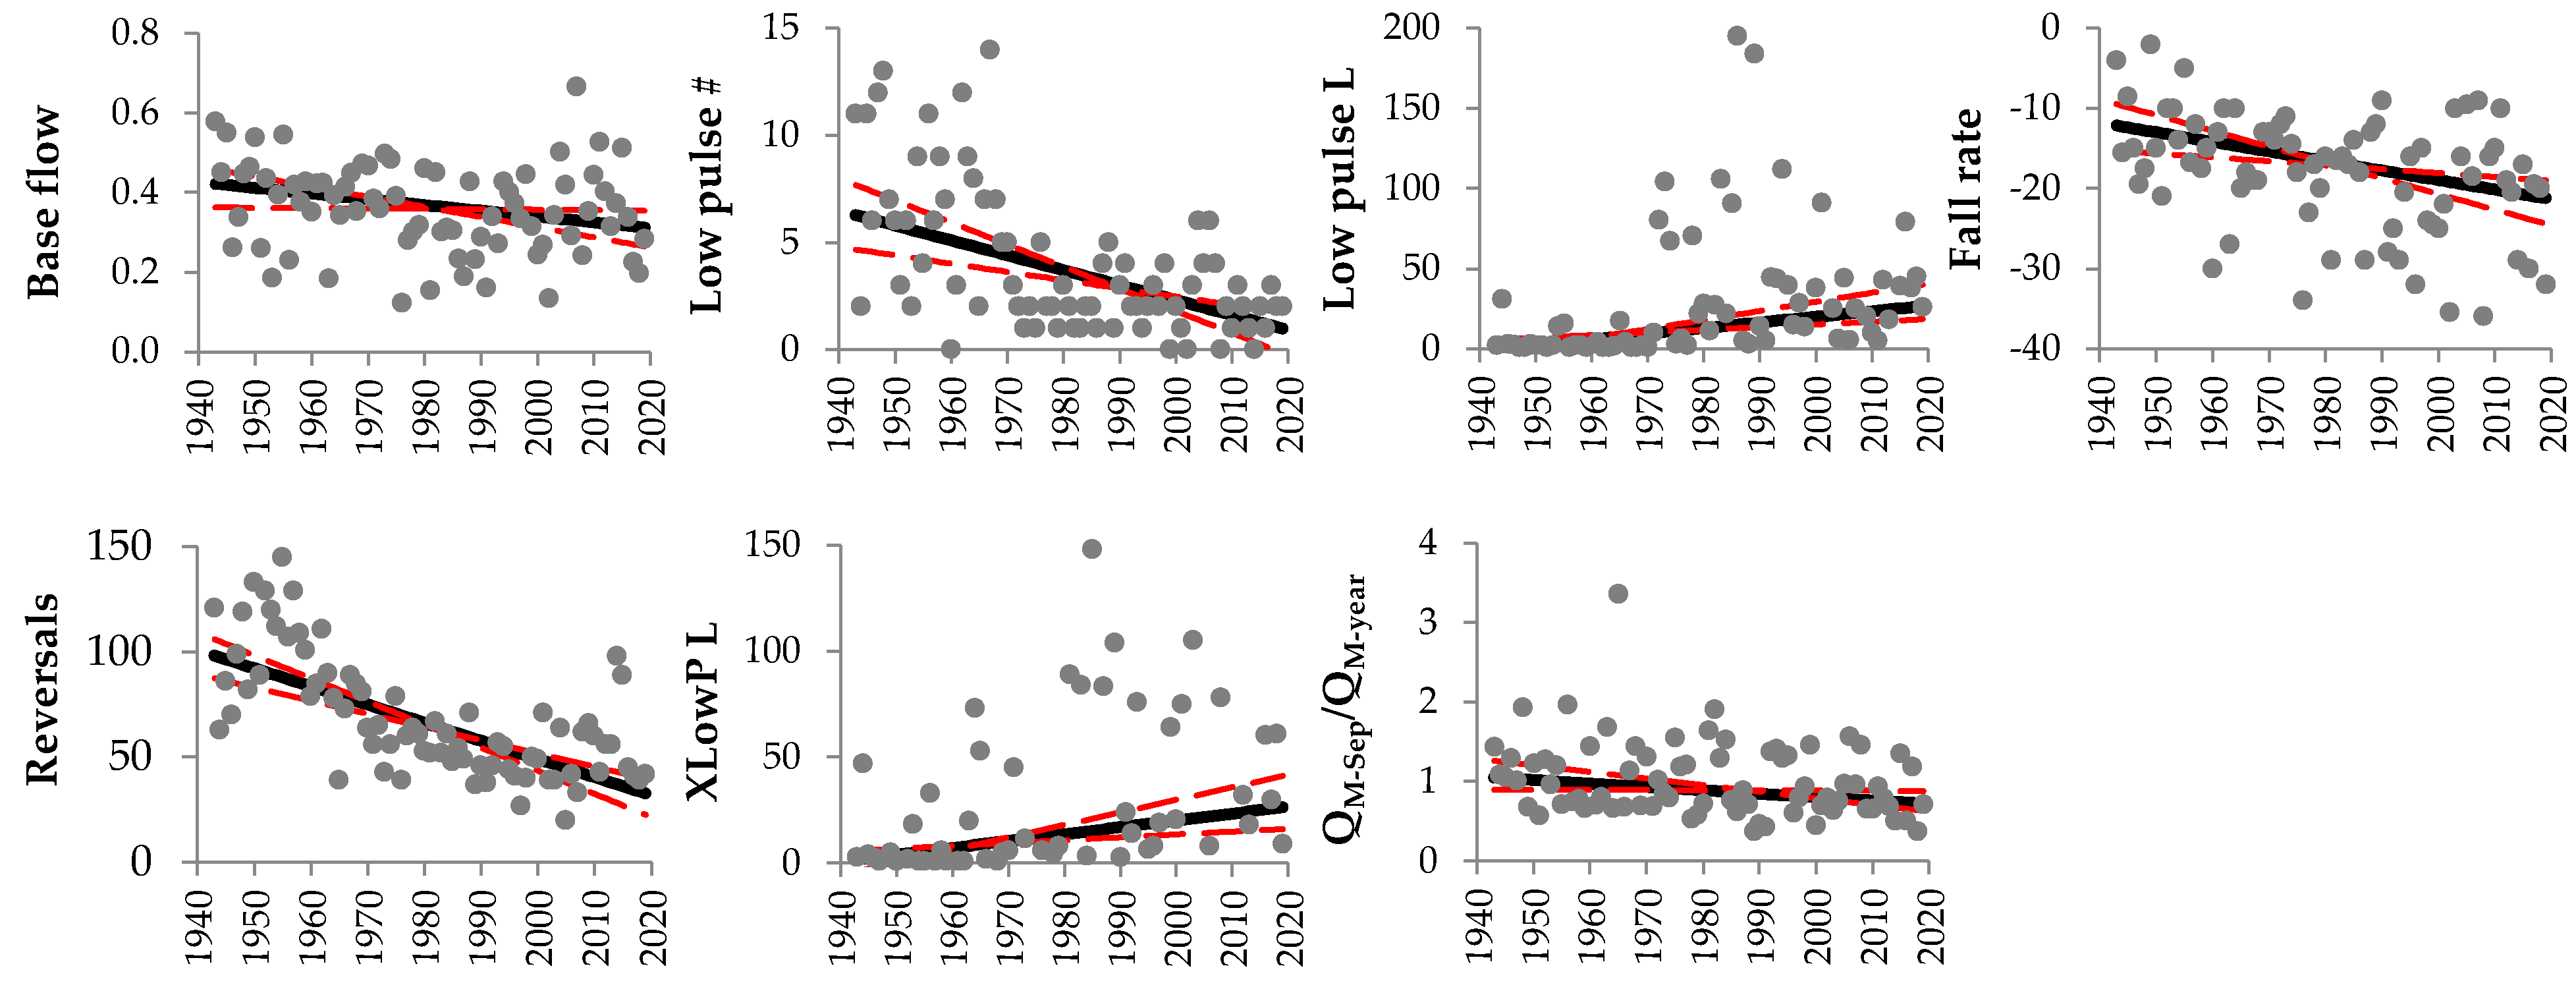
The base flow index (i.e., the 7-day minimum flow divided by the mean annual flow) decreased from 0.42 to 0.31 according to the Sen’s estimate. A significant decrease (from 6.28 to 0.98) in the frequency of low-flow periods (i.e., periods with discharge lower than the 25th percentile) was detected, along with an increase of the median duration of low flows (by 26 days in 77 years). Accordingly, also the median duration of the extreme low-flow periods increased from 2 days in 1943 to 26 days in 2019. Moreover, a decrease of the mean monthly flow normalized by the annual mean was detected for September, when the monthly flow decreased on average from above to below the annual mean. The flow difference between consecutive days during flow decreases (fall rate) showed an increase from 12 to 21 m3 s−1, and the number of reversals decreased significantly from 98 in 1943 to 33 in 2019.
3.2. Analysis of Low-Flow Periods Downstream of Water Withdrawals in the Ticino River
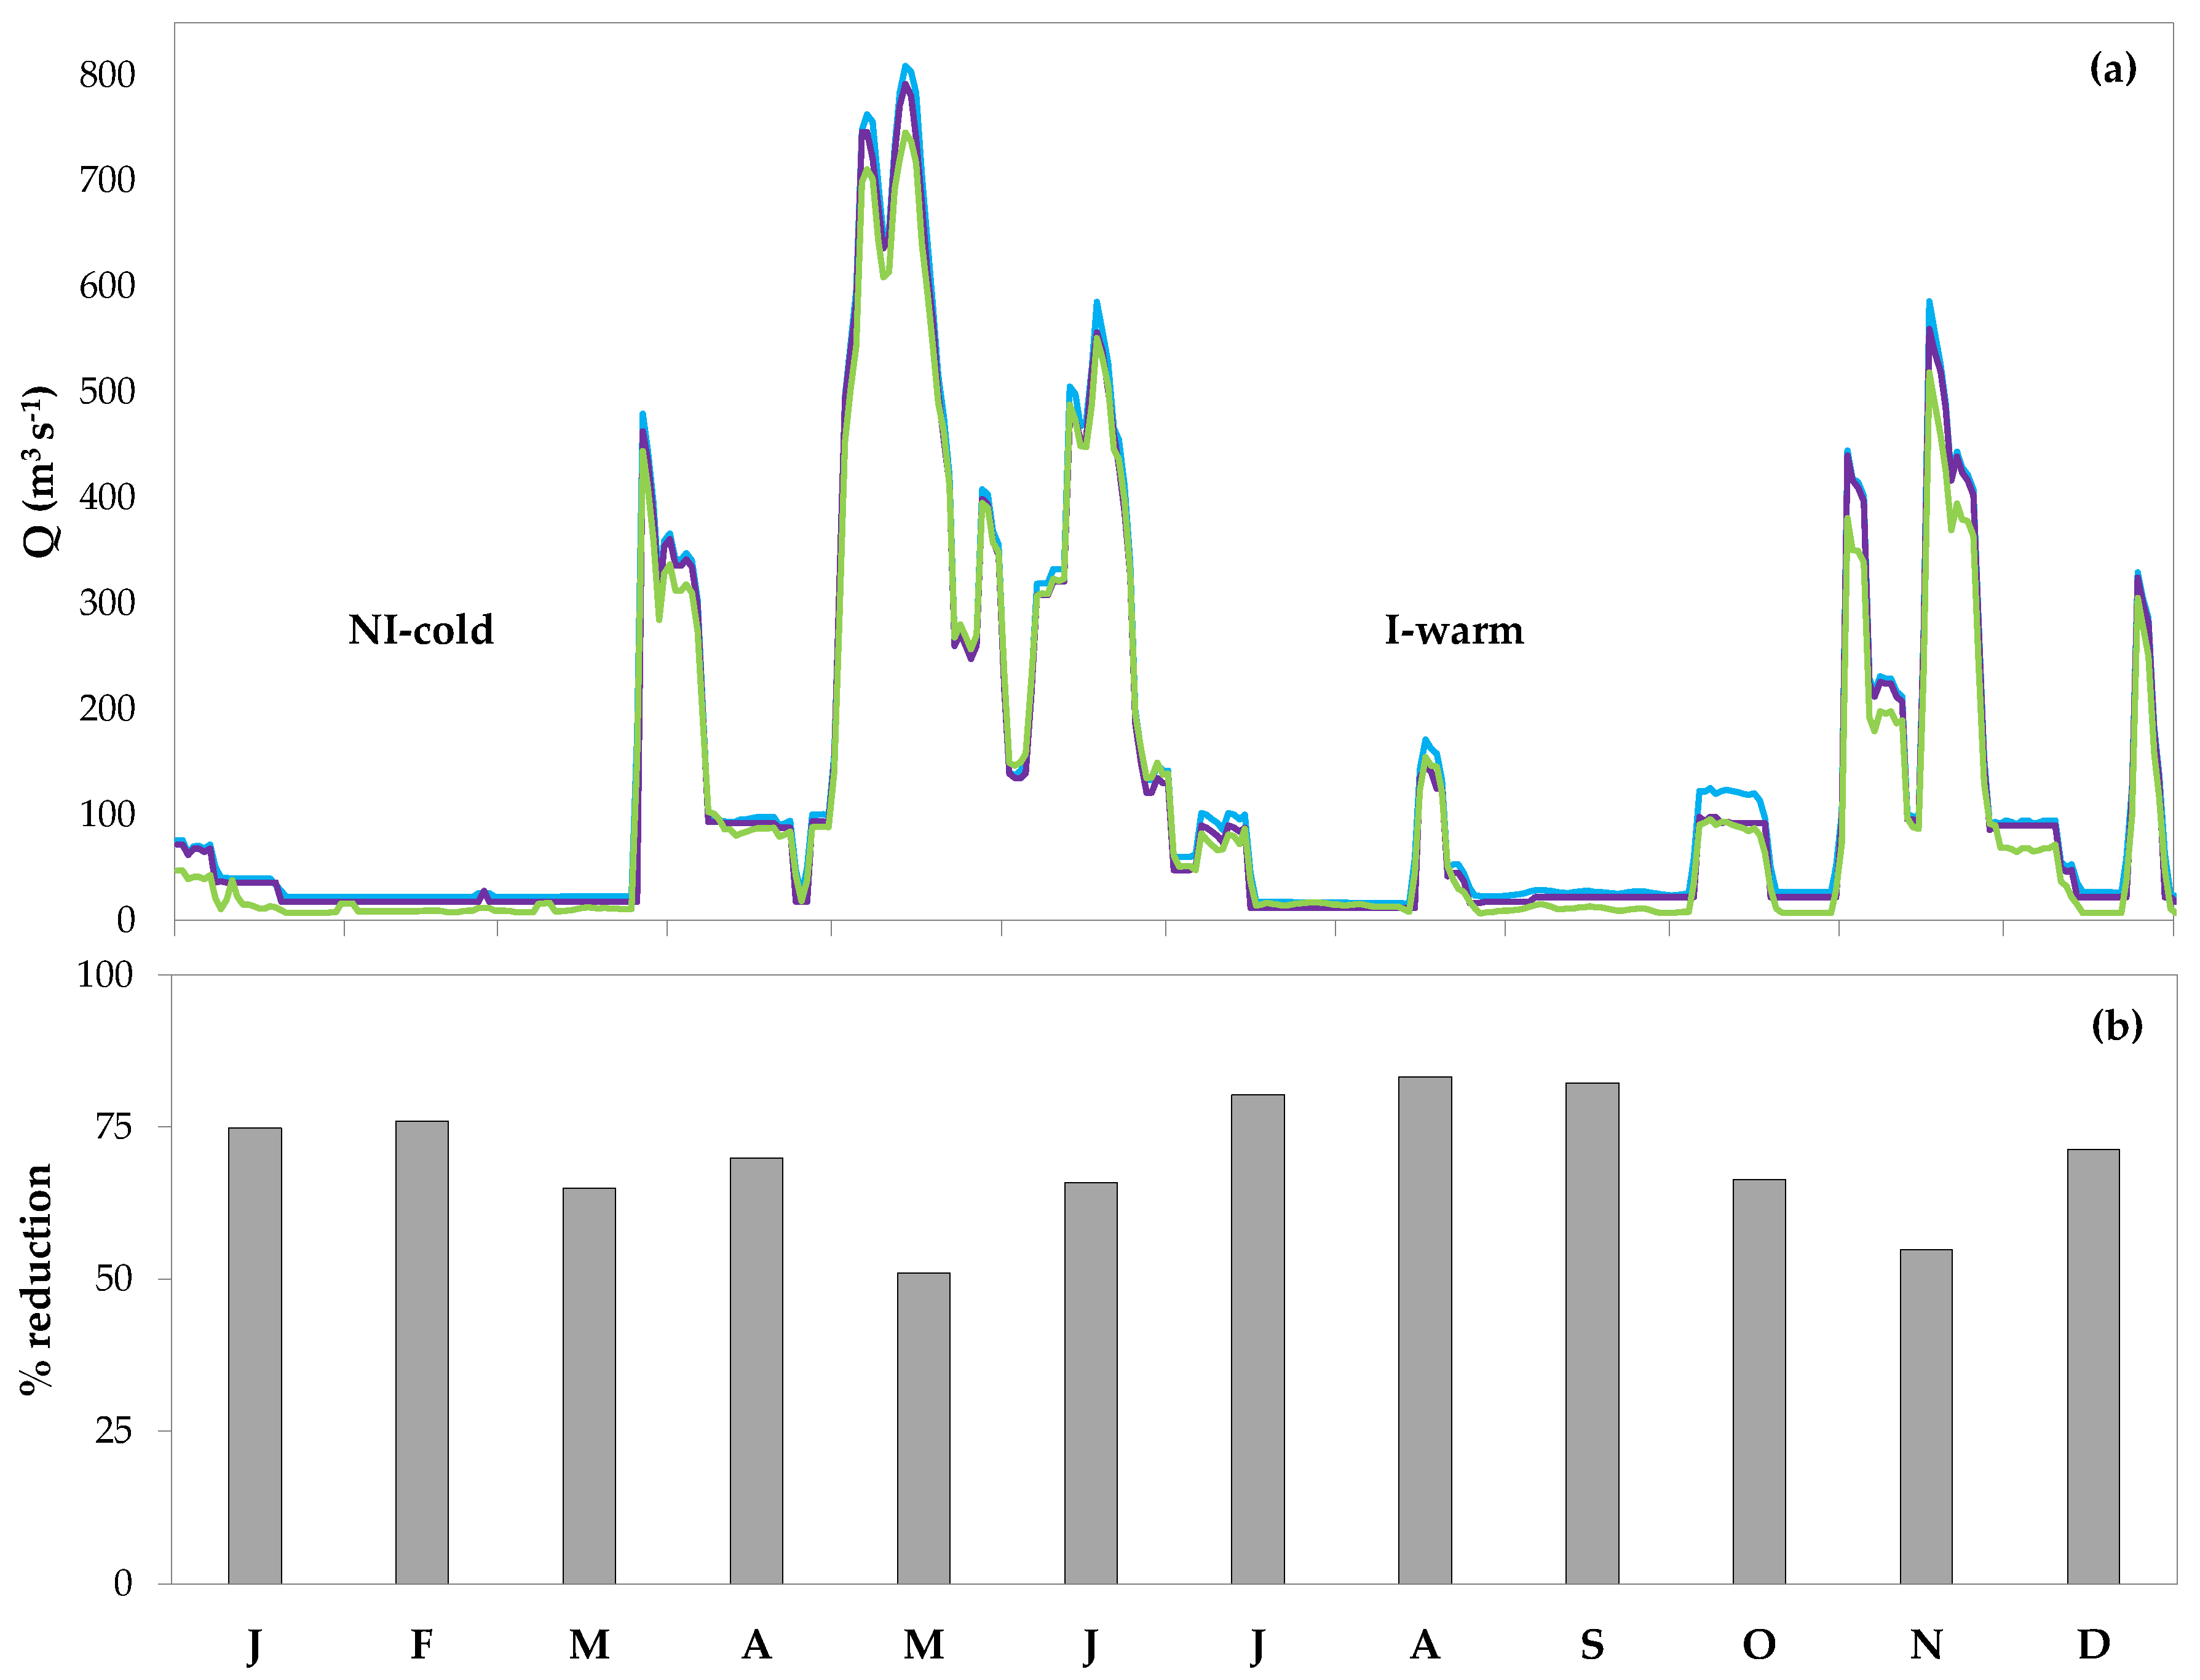
During the six investigated years (2010–2015), low flows in the Ticino River downstream of water withdrawals were mainly observed from January to April (winter-early spring) and from mid-July to October (summer-early autumn), consistently at the three study sites (Figure 3a). This pattern reflected that of natural flow variability but was sharpened in warm months due to maximum off-stream diversion, especially for irrigation (Figure 3b).
The DA of the IHA confirmed the expected differences between the three sampling sites. Indicators related to the magnitude of low flows (particularly 3-day min and 1-day min) were the most important parameters differentiating IF1 from the other two sites. In fact, at IF1, these variables were higher than at MF1 and MF2 (i.e., on average, 18, 13, and 6 m3 s−1 for 3-day min, and 17, 13, and 5 m3 s−1 for 1-day min, respectively). In contrast, MF1 and MF2 were poorly discriminated, though at MF2 compared to MF1 (see Table S2) we detected higher values of low-flow pulses frequency and number of reversals (on average, 14 vs. 4, and 118 vs. 63, respectively) and lower values of September mean flow, 1-day min, and rise and fall rates (on average, 10 vs. 25 m3 s−1 for September mean flow, 7 vs. 25 m3 s−1, and 12 vs. 28 m3 s−1 for rise and fall rates, respectively).
Differently from the IHA, most of the water physico-chemical parameters measured concurrently to benthos sampling during low-flow periods were not significantly different among the three study sites (Table S3). Only NO3−−N was significantly lower at MF1 compared to the two downstream sites, and pH and % DO were significantly higher at MF2 than at IF1 (Kruskal–Wallis and Dunn test, p < 0.05).
3.3. Analysis of Benthic Macroinvertebrate Communities during the Low-Flow Periods
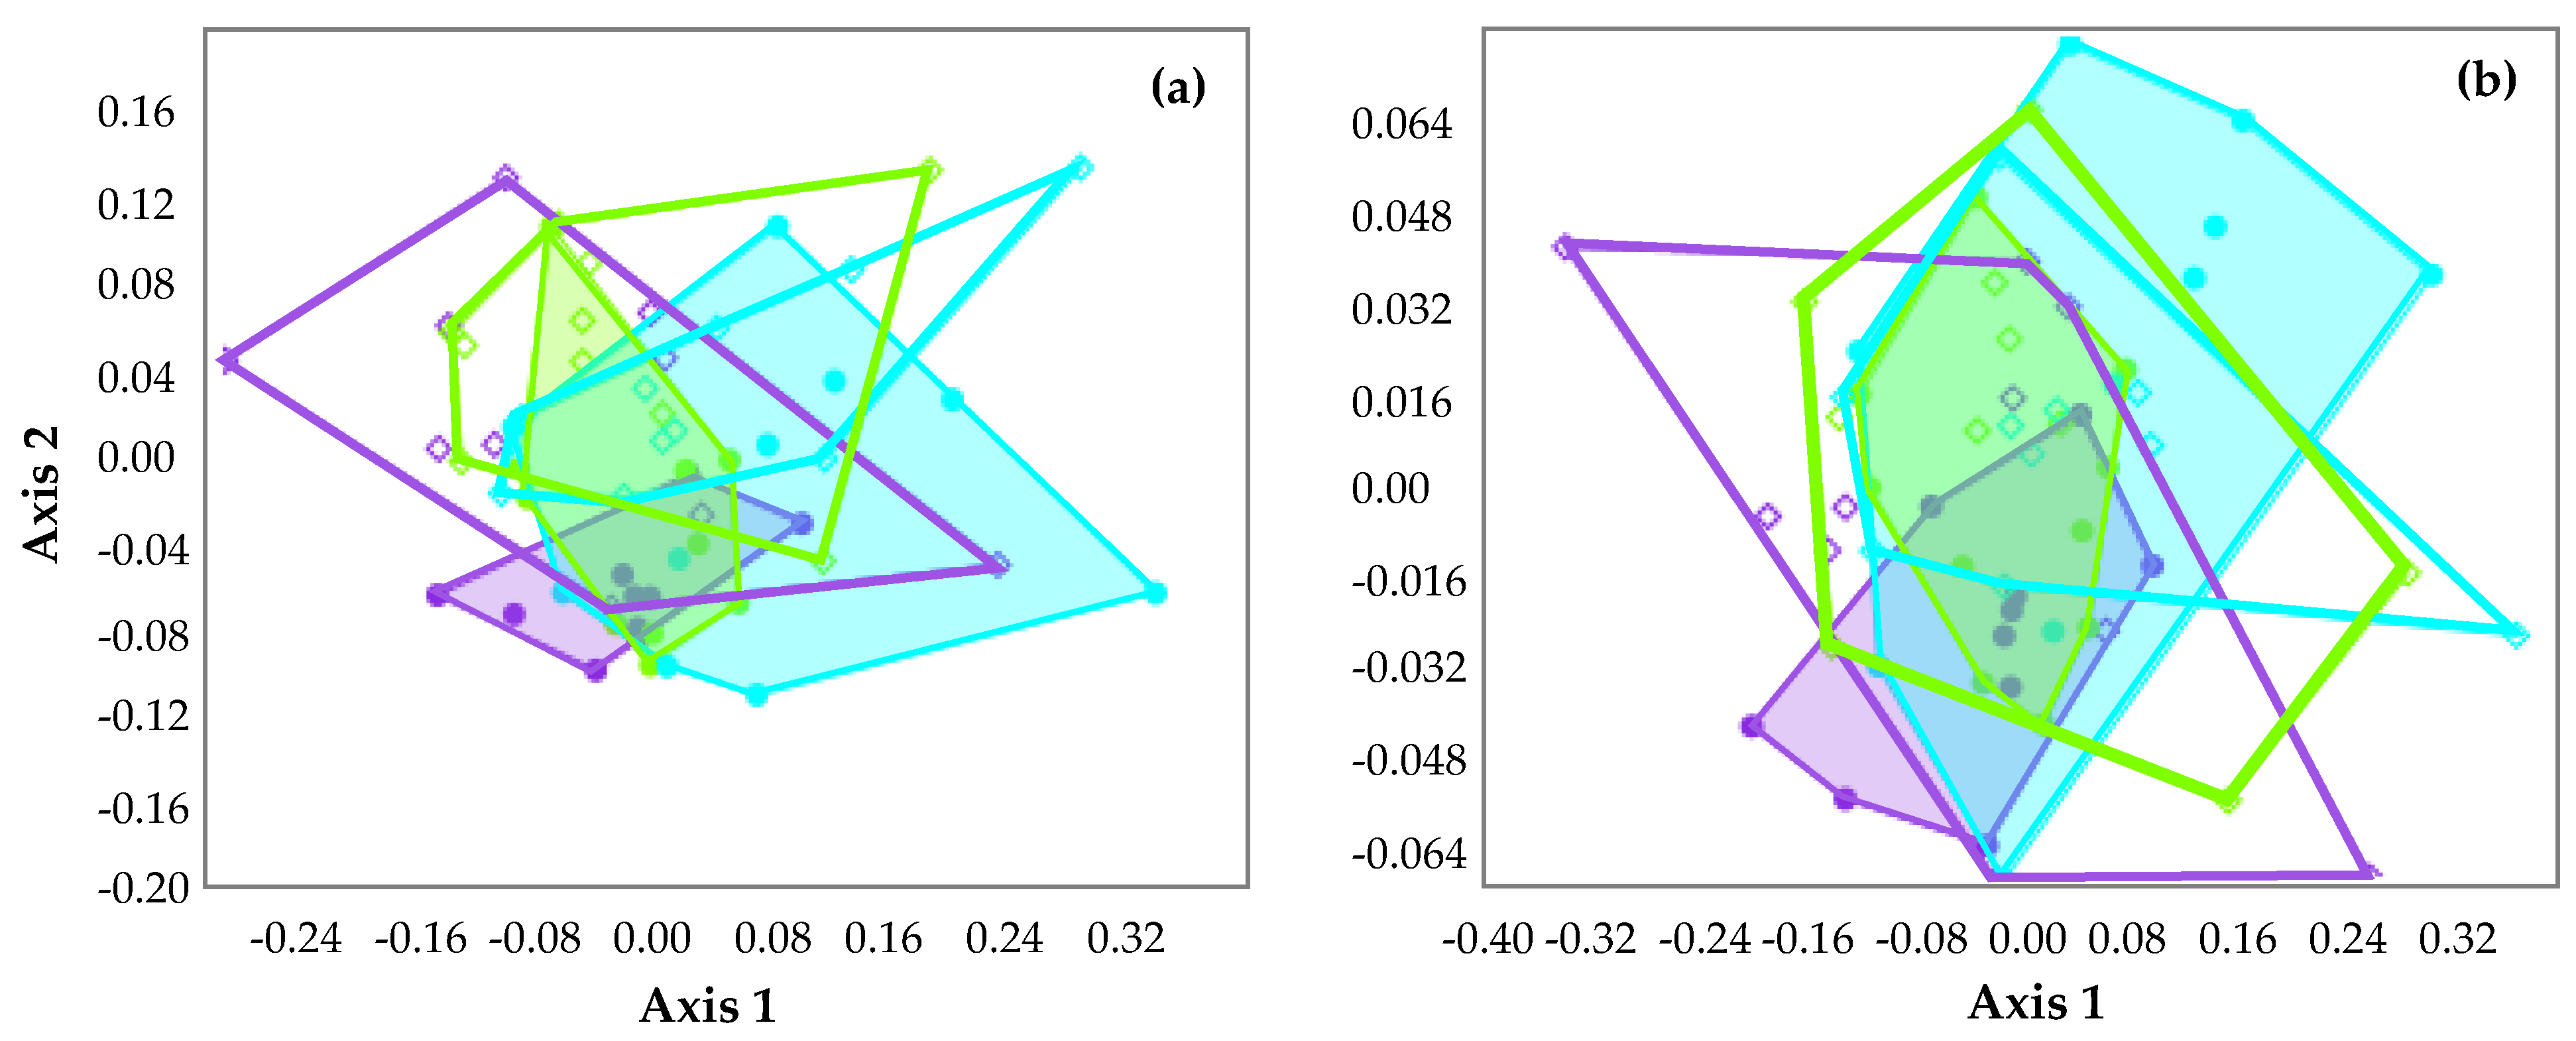
NMDS did not reveal evident differences in taxonomical (Figure 4a) and FFGs (Figure 4b) composition among the three sampling sites. However, benthic assemblages sampled during the irrigation period (i.e., from May to October, I-warm) showed a poorer variability compared to those sampled during the non-irrigation period (i.e., from November to April, NI-cold), both considering taxonomical and FFG composition; this occurred particularly at MF1, and, to a lesser extent, at MF2.
The two-way ANOSIM of taxonomical composition confirmed these patterns, indicating significant differences (R = 0.19, p = 0.0005) between sampling periods but not between sampling sites (R = 0.04, p = 0.07). This difference was mostly (>95%) related to the 20 most common families detected at the three sampling sites, as indicated by the SIMPER analysis (Table 2). Among these, some taxa (e.g., the Diptera Chironomidae and the Ephemeroptera Ephemerella) were more common in the NI-cold period, while others (e.g., the Ephemeroptera Baetis and the Plecoptera Leuctra) were more abundant during the I-warm period.
Considering FFG composition, the two-way ANOSIM did not evidence significant difference both between sampling sites (R = 0.006, p = 0.37) and periods (R = 0.01, p = 0.32).
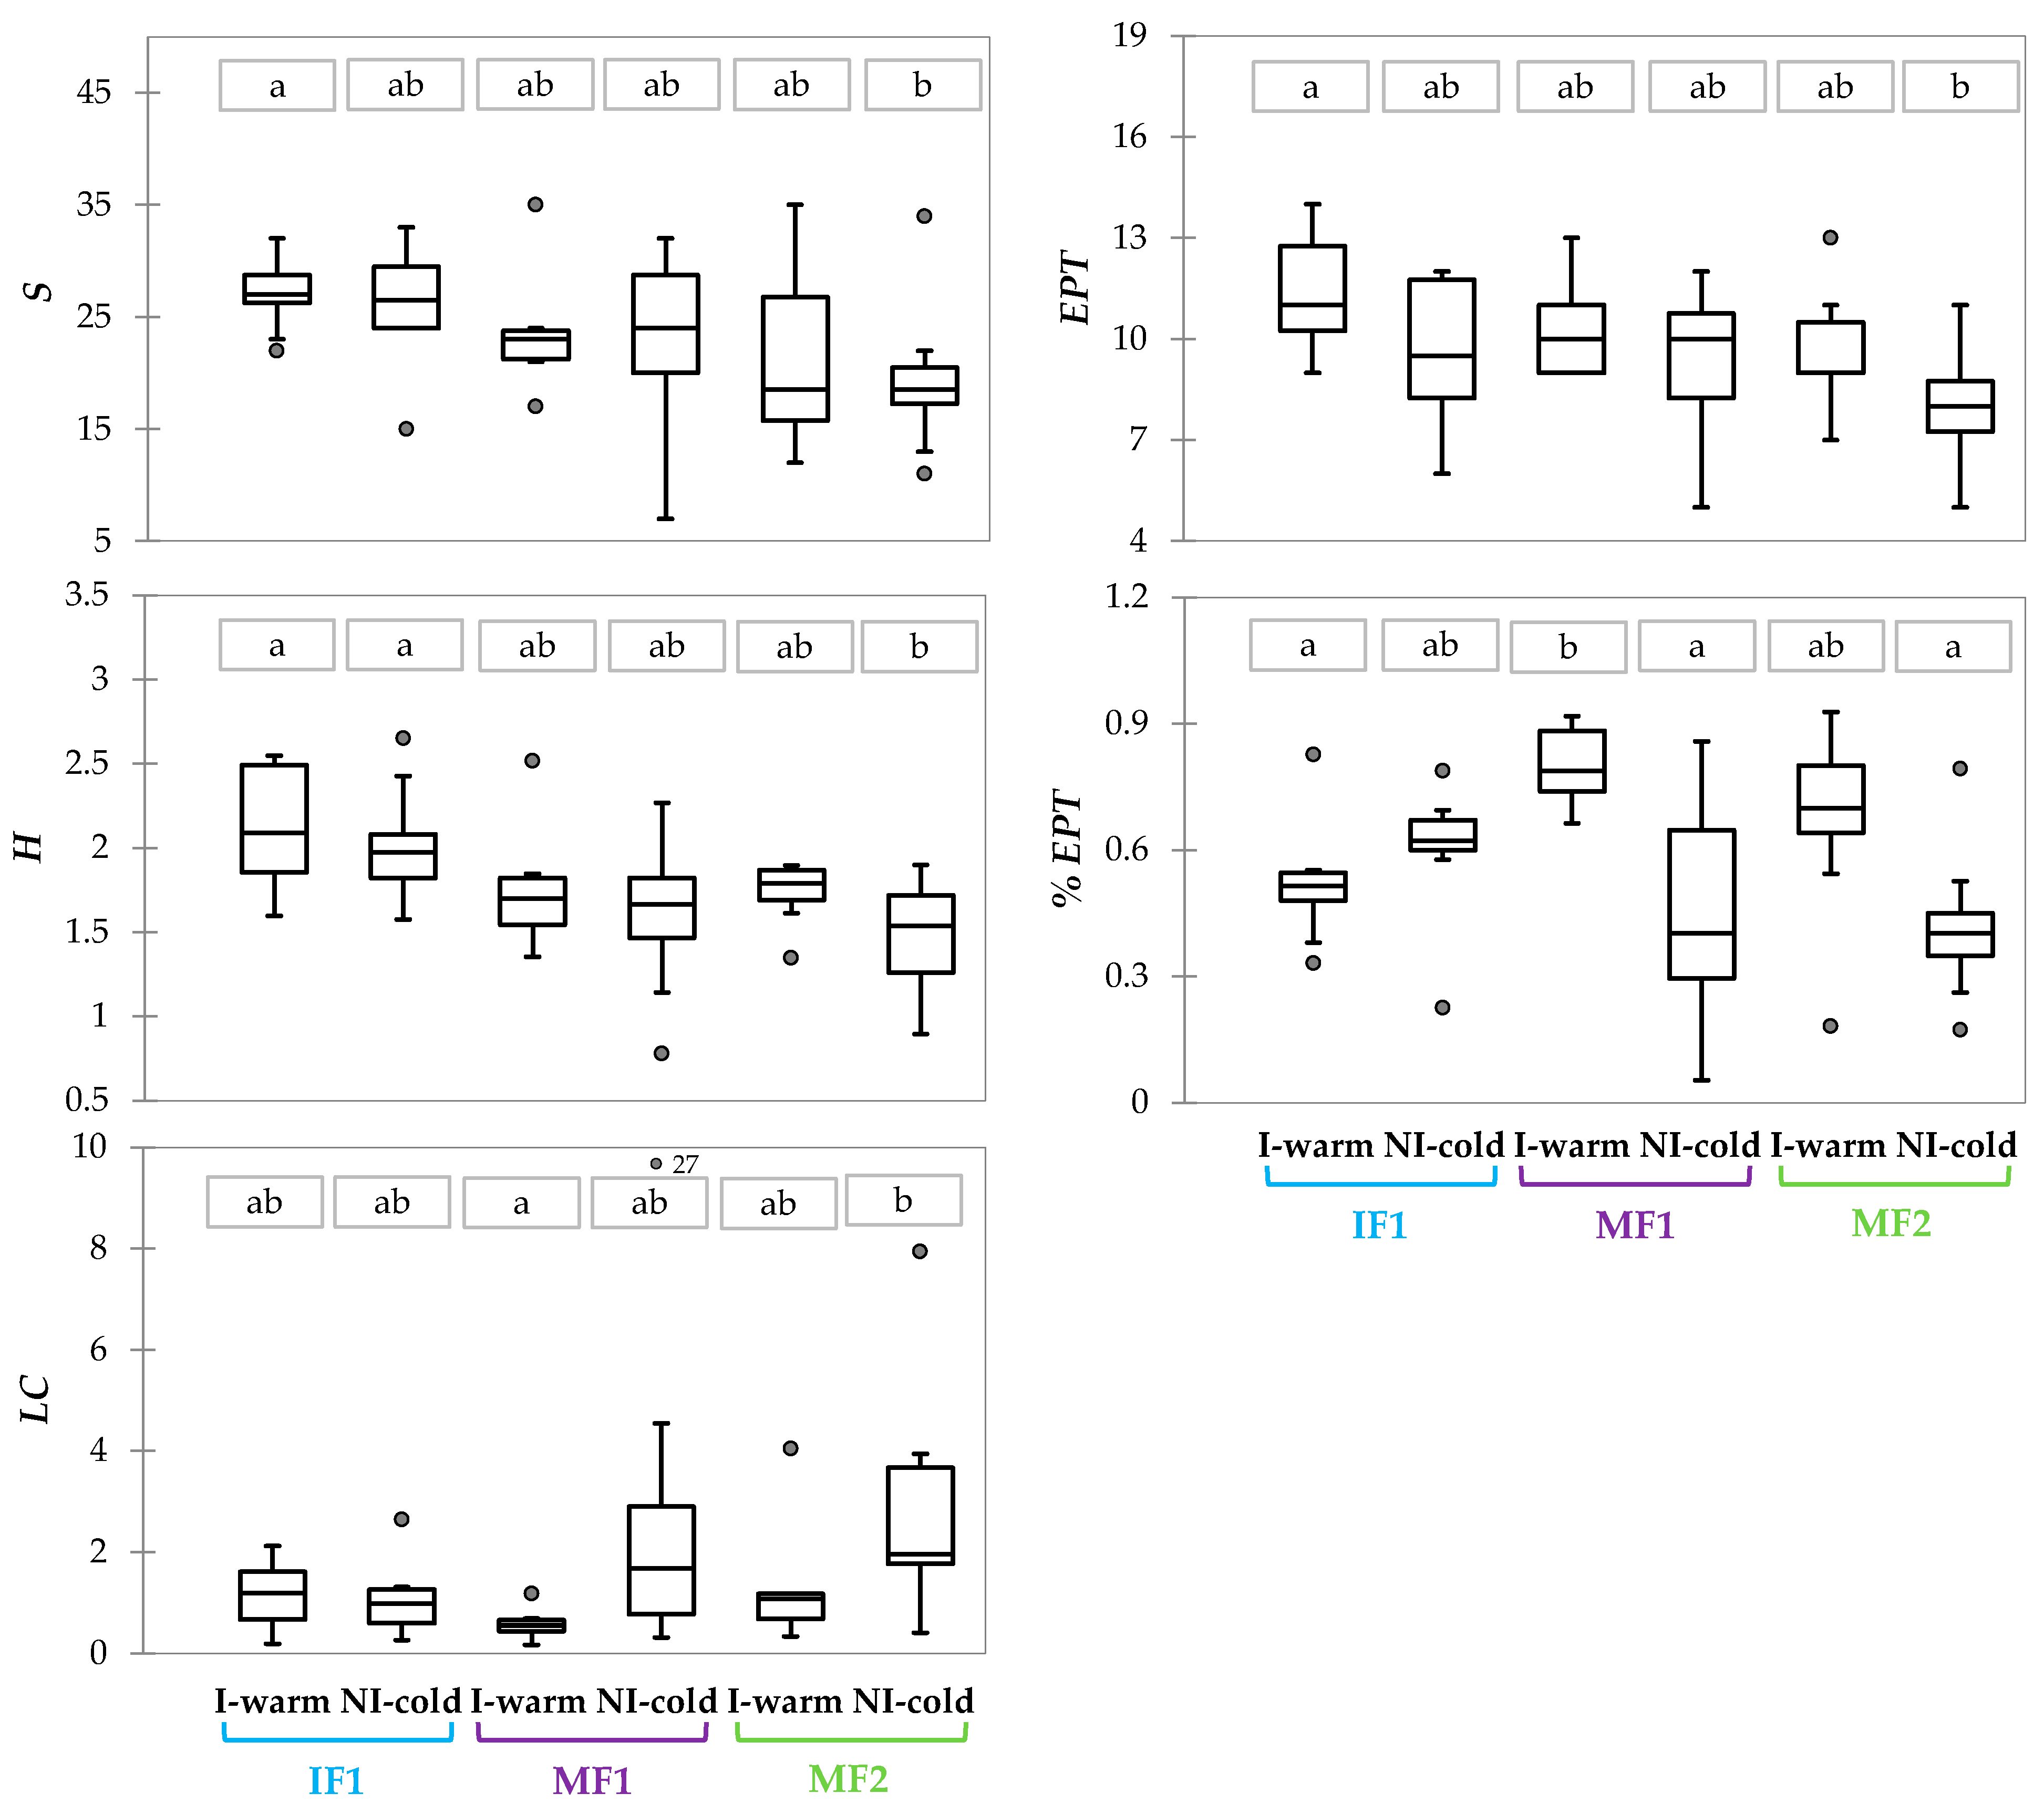
Among the biological metrics, the median values of S, H, and EPT decreased from IF1 (i.e., the river reach subjected to comparatively minor hydrological alteration) to MF2 (i.e., the river reach with the lowest MF values). Moreover, higher values of the mentioned metrics were observed in the I-warm period compared to the NI-cold one; however, these differences were not significant between sampling periods of fixed sites (Figure 5).
% EPT in the I-warm period was higher than in the NI-cold period at MF1 and MF2 (with significant difference only for MF1, Kruskal–Wallis and Dunn test, p < 0.05), while a reversed pattern was detected at IF1. Conversely, LC was higher in the NI-cold than in the I-warm period at MF1 and MF2, and again the opposite was true for IF1, even if these differences were not significant (Figure 5).
From the comparison of sites within the same sampling period, only H was significantly different (Kruskal–Wallis and Dunn test, p < 0.05) between IF1 and MF2 during the NI-cold period, and %EPT between IF1 and MF1 during the I-warm period (Figure 5).
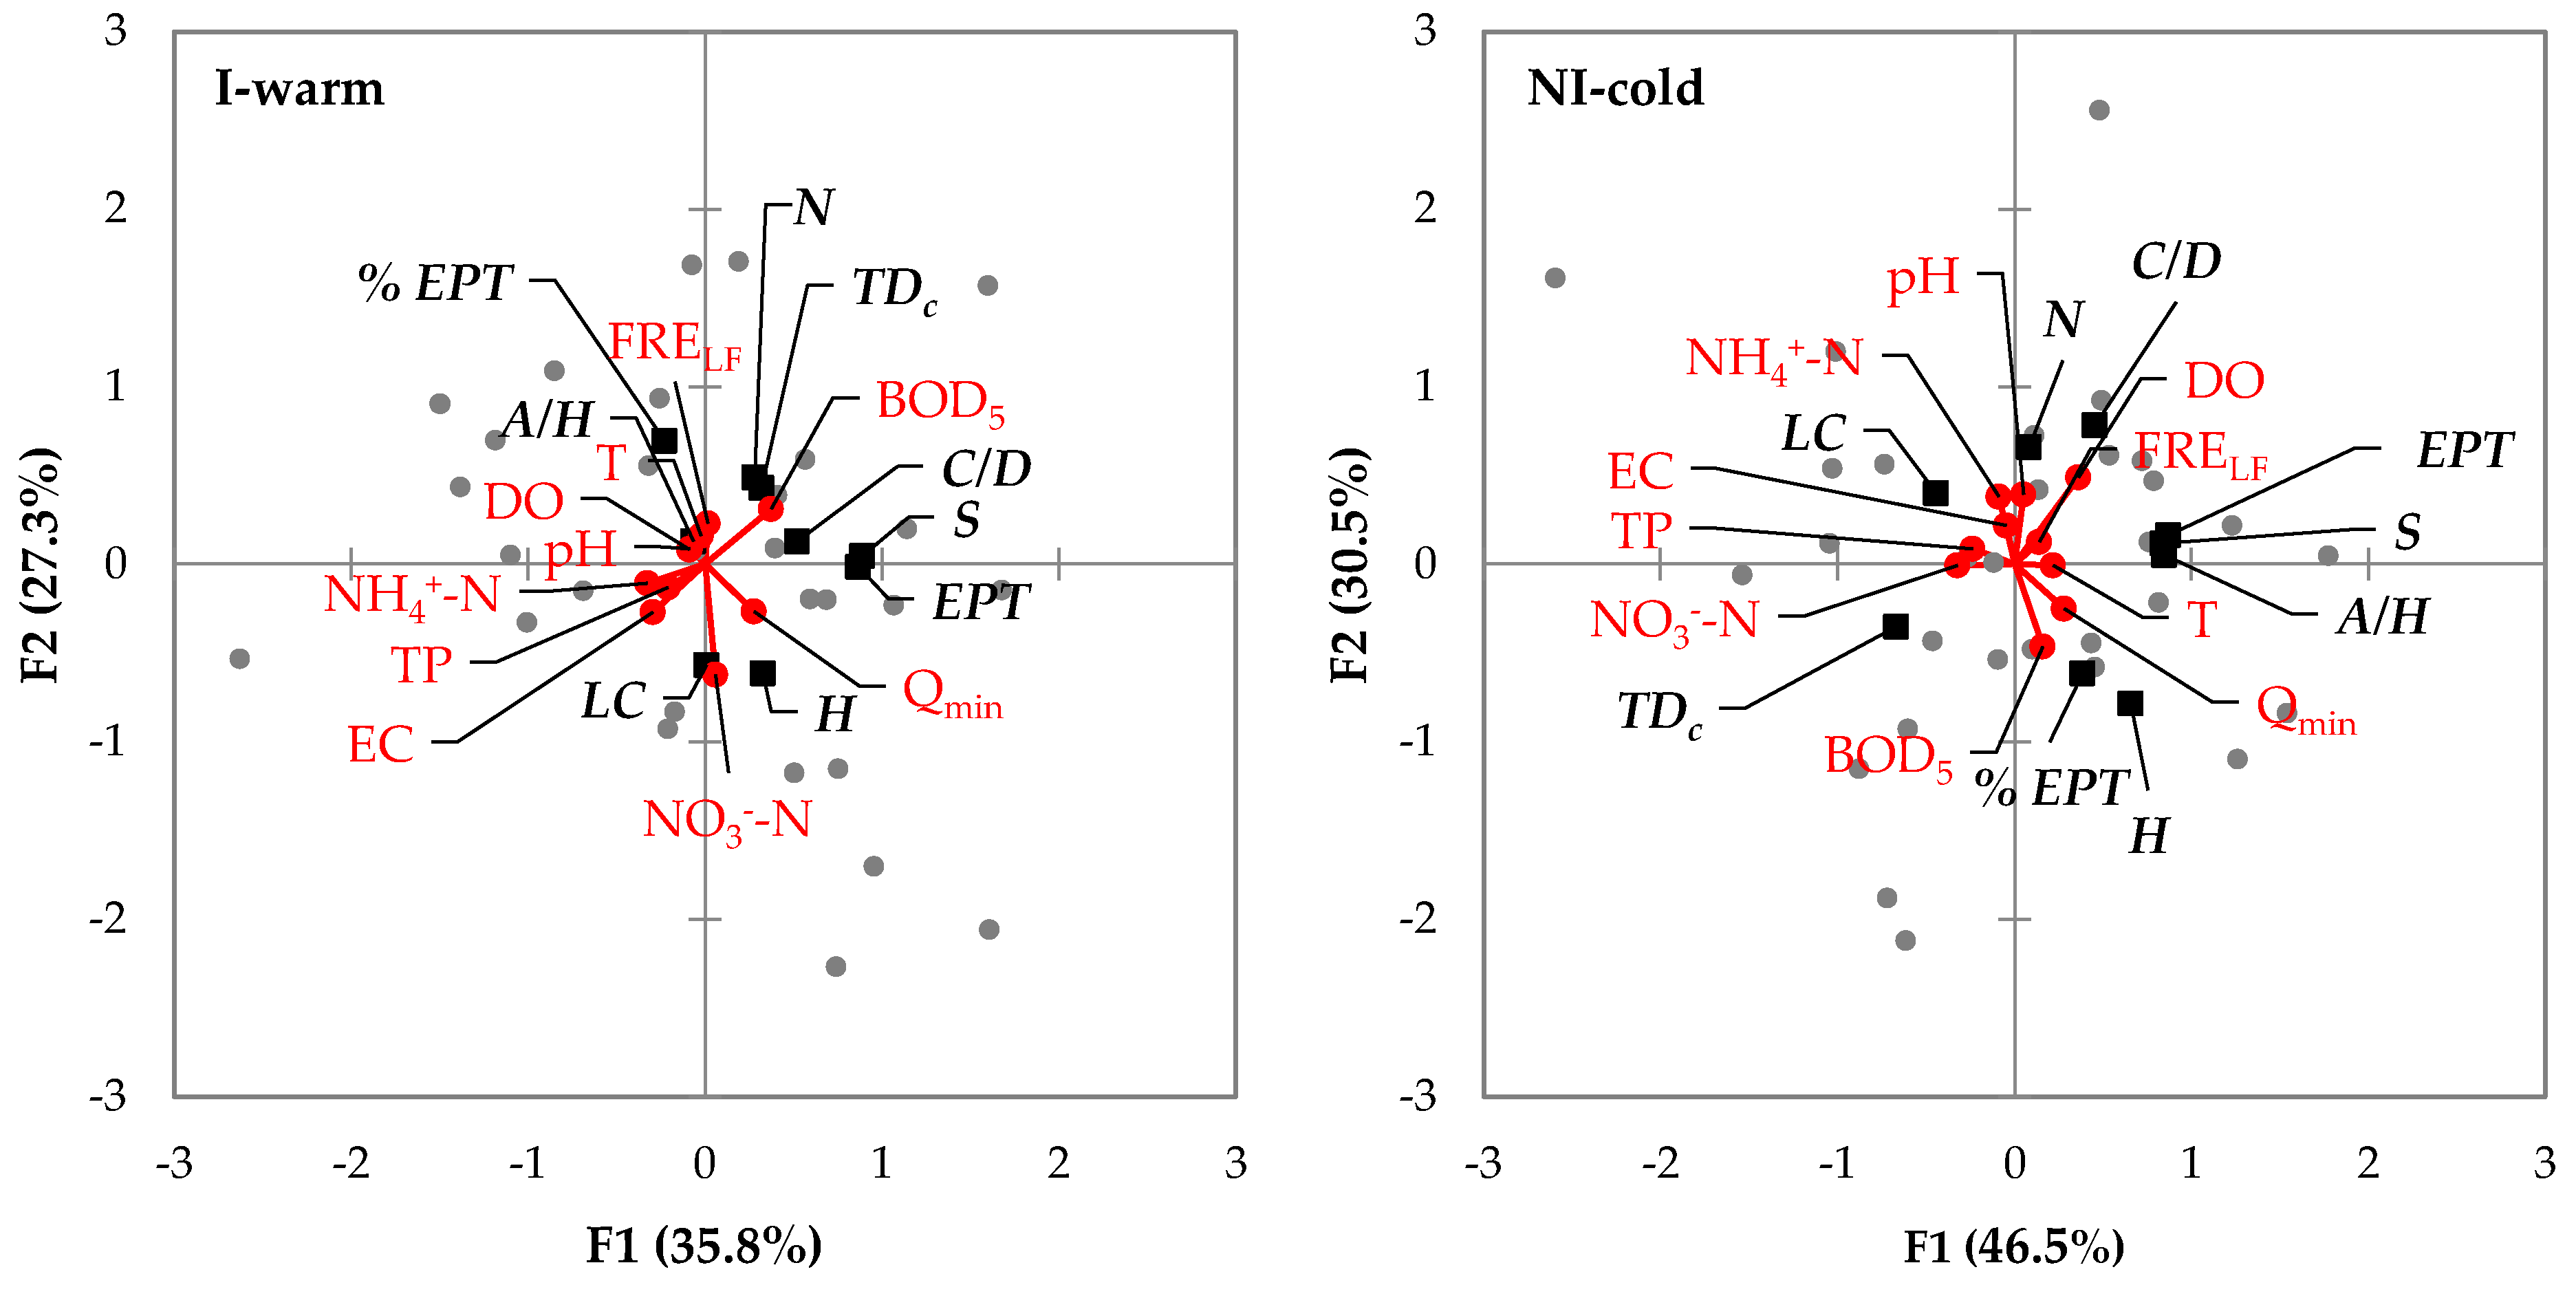
The PCA of the hydrological variables computed over the 90 days before benthos sampling and carried out separately for the two sampling periods, explained 65.7% of the overall variability in the datasets (see Table S4 and Figure S1). Since many variables were significantly correlated, only two parameters were selected for the RDA. Specifically, FRELF (i.e., the number of low-flow days) considerably contributed to PC1 and was significantly correlated to most of the other variables, and Qmin (i.e., the minimum flow value) considerably contributed to PC2. Both parameters characterized low flows at the study sites.
The RDA demonstrated that the variation of benthos metrics can be explained by physico-chemical parameters and by the considered hydrological variables in both sampling periods (I-warm = 63%, and NI-cold = 77%, Figure 6). A positive correlation between Qmin and H was detected as well as between nutrient load (mainly NO3−−N) and LC and between the organic load expressed by BOD5 and TDc. Some differences between the two sampling periods could also be observed. For instance, in the I-warm period, %EPT was negatively correlated with NO3−−N while in the NI-cold period it was positively correlated with BOD5 and Qmin.
Overall, the outputs of the regression models were consistent with the RDA results (Table 3). Particularly, the link between Qmin and H was confirmed, and the association between a benthos metric and a hydrological variable emerged. Specifically, in the I-warm period, N was positively correlated to DURLFmax, and TDc to INCL. Moreover, in the NI-cold period, S was negatively correlated to QP75, EPT and %EPT to ΔQ, and C/D to INCL, while LC and TDc were positively correlated to ΔQ and INCMax, respectively. Nevertheless, correlations between NO3−−N and %EPT (negative) and LC (positive), between A/H and T (negative) in the I-warm period, and between pH and N (positive) in the NI-cold period were also detected.
4. Discussion
4.1. Effects of Climate Change on Low-Flow Periods
In the last eight decades, the Lake Maggiore outflows displayed significant variation regarding seven hydrological metrics considered of ecological interest [31]. Five out of these seven parameters are associated to low-flow periods and confirm the tendency towards more severe low flows highlighted by other authors. In particular, increasing duration of low-flow periods was also detected by Meaurio et al. [43] for the Nerbioi River (Spain), and, in general, for the southern Europe watercourses by Giuntoli et al. [4]. Moreover, the magnitude of late summer flows (i.e., September flows) in the Ticino River showed a temporal decrease, regardless of the general hydrologic conditions of the year (i.e., normalized by the annual mean), in accordance to what was already found by the European Environmental Agency [44] for European watercourses since the 1960s and to what was projected for future decades for some English [3], French [5,6,7], and Belgian [8,45] rivers.
In some instances, the time patterns of specific hydrologic parameters are clearly influenced also by the operation of the Miorina Dam. For example, the frequency of low-flow pulses, at a maximum during the 1960s, decreased in the following decades. This can be attributed to the streamflow diversion for hydropower, reduced at that time during the weekends, in periods of low water storage in Lake Maggiore. A further modification of previous management of Lake Maggiore outflows is related to the introduction of the mandatory release of MF in the Ticino River, started in 2009, and revised (i.e., MF was slightly increased) in 2015. Though this new allocation would have forced a general increase of regulated outflows during summer, the decrease of average normalized flows in September seems consistent with the mentioned climate modification. However, disentangling the effects of climate change from those of changing water management on long-term flow modifications is a challenging task, frequently requiring the reconstruction of natural (i.e., unaffected by regulation) streamflow time series [46,47]. Indeed, interannual changes in flow management by dams can occur in response to operational objectives, reservoir regulation rules, and hydro-meteorological conditions [48]. Additional change of river discharge may be determined by any increase in storage capacity in the regulated catchment as well as by land use modifications, especially in mountainous areas, due to the abandonment of traditional grazing practices [49,50].
4.2. Effects of Low Flows on Benthic Macroinvertebrates
Consistently with the long-term dataset, the analysis of the 6-year streamflow time series in the river reaches downstream of water withdrawals revealed major hydrologic alteration during the warm months. River discharge in the three study sites clearly differed for the magnitude of annual minima and for mean monthly flow in September, according to the expected gradient from the site with the largest flow reduction (MF2) to that with the smallest one (IF1). Apart from the released MF values, the two MF sites differed also for the variability of discharge during low-flow periods, lower at MF1 than at MF2, and the consequent higher values of parameters related to the rate of change, due to a flatter pattern of low flows between flow peaks. These hydrological differences did not determine relevant biological differences in overall structural and functional composition between sites. However, as expected, assemblages changed in relation to the sampling period (i.e., irrigation warm vs. non-irrigation cold period). In particular, sampling period acted as a key determinant of zoobenthic taxonomical composition but not of functional composition, due to the partial substitution by different taxa occupying the same feeding niche over the different sampling periods. Chironomidae and Ephemerella (mainly gatherers and grazers) had higher densities in the NI-cold than in the I-warm period, while Baetis and Leuctra (belonging to the same feeding groups) had opposite peaks in abundance. These patterns were related mainly to the phenology of the mentioned insect taxa. In fact, the period of maximum abundance of the aquatic life stages of insects is quite predictable, particularly for monovoltine taxa, since the occurrence of the main stages, such as emergence and eggs hatching, is determined primarily by temperature and photoperiod [51]. For the most common monovoltine taxa of the Ticino River (i.e., Hydropsychidae, Leuctra, and Ephemerella), this period is in accordance with that identified by Dolédec [52] in a study of the seasonality of benthic assemblages in the Ardeche River (France). Conversely, multivoltines have the opportunity to adapt to environmental modifications by frequent generations [53,54], so that yearly variations of abundance in non-pristine rivers are probably more linked to pressures like hydrological alteration, rather than to seasonality.
The highlighted differences in taxonomical composition between sampling periods include the poorer variability among samples in the I-warm, compared to the NI-cold period. Differences in taxonomical composition, as well as in variability among samples, were already described by Quadroni et al. [36], both at unperturbed sites and at sites characterized by mild hydrological impairment partly preserving the seasonal flow variability, and they were ascribed to natural seasonal dynamics in assemblages.
Sampling period also influenced the values of biological metrics, always consistently at the two sites located immediately below water withdrawals. Conversely, some metrics showed a different pattern between MF sites and the IF site. In particular, %EPT was significantly higher in the I-warm than in the NI-cold period at MF1 (and, to a lesser extent, at MF2), but not at IF1, and this is mainly attributable to the already mentioned seasonality in the abundance of the Trichoptera Hydropsychidae (i.e., the major component of EPT in the Ticino River), particularly visible at MF1. A decrease of %EPT was already reported in response to water diversion as an effect of the increase of less-sensitive non-EPT taxa [55]. However, Wills et al. [56], in a comparative study of different degrees of flow reduction, found that the density of EPT taxa in condition of mild diversion (50% flow reduction) was higher than at a reference unperturbed site, while it was lower when a flow reduction of 90% occurred. Indeed, in the Ticino River, we observed an average increase of the %EPT at MF sites compared to IF1 during the I-warm period and a decrease during the NI-cold period, when the low-flow duration was longer, while there was almost no variation at IF1. Even if to a lesser extent, the relative abundance of multivoltine organisms (i.e., LC) was lower during the NI-cold period at the two more hydrologically impacted sites, while only minor difference between sampling periods was observed at the site characterized by residual basin contribution.
Overall, diversity (i.e., H) and richness (i.e., S and EPT) metrics were higher on average during the I-warm compared to the NI-cold period and followed an increasing trend from the site with lower discharge minima to that with flow increased by the residual basin contribution. The increase in the abundance of multivoltine taxa and the decrease in Shannon-Wiener index, taxa richness, and EPT richness were already indicated among the effects of reduced discharge on benthic macroinvertebrates [36,55,56,57,58], although the response of taxa richness to hydrologic impairment reported in the literature is not univocal as an effect of other environmental factors affecting this community metric [59,60].
Although the degree of flow reduction was often indicated as a determinant of the studied benthos metrics, the benthos impairment in the Ticino River appeared particularly evident during NI-cold, though the MFs are slightly larger than in summer. Nevertheless, in the NI-cold period, the duration of low flows is significantly higher than during the I-warm, due to naturally lower water availability.
Redundancy analysis and regressions clarified the role of the different environmental (water physico-chemical and hydrological components) facets of low-flow periods on zoobenthic assemblages. In addition to decreasing available habitat, the reduced water availability can influence water temperature and chemistry [61,62]. Accordingly, previous studies [18,63,64] demonstrated that variations in macroinvertebrate communities cannot be explained uniquely by hydrology; other predictors require comparable attention.
Although in the investigated section the water quality of the Ticino River can be considered good, i.e., well-oxygenated water without relevant nutrient and organic pollution, our results confirmed the influence of water physico-chemical parameters on the benthos metrics during the low-flow periods. Particularly, in the I-warm period, relatively high nitrate nitrogen concentrations decrease the relative abundance of EPT, favoring at the same time multivoltine taxa such as Chironomidae, i.e., a family including species characterized by relatively high tolerance to pollution [65,66]. This may be partly linked to the increasing diffuse pollution related to irrigated agriculture, typical of the warm season [18,67]. Moreover, the degree of autotrophy of the investigated system is strictly related to the summer increase in water temperature that can be considered a proxy of the seasonal succession of instream primary producers. However, our results showed also significant correlation between benthos metrics and the hydrological conditions preceding benthos sampling. First and most importantly, the key role of the released MF in shaping the community was evidenced: A higher diversity of the community expressed by the Shannon-Wiener index was explained by higher Qmin (i.e., the MF). Moreover, the main hydrological determinants of zoobenthic assemblages were related to the variability/stability of low-flow periods, in terms of number of days of low flows, difference of flow magnitude, and rate of change of discharge between consecutive days. The total density was positively correlated to the duration of low flows. Similarly, in another Italian regulated lowland river, benthos sampled after periods of increasing duration of stable flows (equal to MFs) showed a strong increase in overall density [18]. Low flows can also sustain the development of richer assemblages, while flows of high magnitude can negatively affect family richness, partially in contrast to expectations [36,55]. Difference of flow magnitude controlled the relative abundance of EPT and multivoltine taxa during the NI-cold period, comparably to what was previously reported for increases of nitrate nitrogen in the I-warm period but in the opposite way. Finally, significant increase in top-down control took place when a relatively large increase in flow magnitude occurred shortly before sampling. Accordingly, Theodoropoulos et al. [68] found that predators are favored after flow peaks, due to high concentration of preys in the space between coarse grains, justified, in turn, by the high retention rates of organic matter at these microhabitats [69,70]. Although Chironomidae is a family that includes species of predators, they are generally disadvantaged by relatively high rates of flow change close to the sampling date.
4.3. Concluding Remarks
Low flows acted as key determinants in shaping structure and functions of macroinvertebrate communities in the investigated reaches of the Ticino River.
In particular, in river reaches downstream of water diversions subjected to MF release, we observed that a decrease in the lower streamflow explained assemblages with lower diversity and richness, mostly composed by tolerant taxa with short life cycles. The studied sites covered only a limited range of MF values (from 2% to 13% of the MANF), and this probably justifies the limited difference in assemblage composition between sites.
As suggested by other authors [71,72], high flows exert a significant control on benthic assemblages of regulated rivers and, also in our study, the presence of days with increased flow within long low-flow periods appeared to counterbalance some of the abovementioned effects of low flows.
Considering the tendency towards more severe low flows observed in the Ticino River in recent decades, and the projected future exacerbation reported by regional and global scale studies, a more sustainable water resource management that matches water use with environmental protection is urgently required.
In the specific case of regulated rivers outflowing from natural lakes, such as the Ticino River, streamflow management can also affect the lake ecosystem, mainly the lake shore zones [73], as changes in outflows determine fluctuation in lake water level. In this respect, a cooperation project is actually ongoing, aimed to define transboundary (Italy-Switzerland) shared rules for water and environmental management taking into account the complexity of the Lake Maggiore-Ticino River system (Interreg Project Parchi Verbano Ticino, https://progetti.interreg-italiasvizzera.eu, accessed on 15 January 2021), with possible interesting outcomes also for analogous lake-river systems.
Referring to the design of management measures capable to mitigate the impacts of low-flow periods on downstream benthic fauna, future development of the present study could include the possibility to release experimental flow peaks aimed at reducing the negative effects of extremely prolonged low flows (i.e., equal to MF) in the river, limiting at the same time drawbacks to the lake ecosystem. This does not substitute but should add to the already acknowledged need to reduce the extent of human water uses for irrigated agriculture and hydropower.
Moreover, possible modifications of insect life cycles and distributions due to climate change [74,75,76,77,78,79], and the previously reported effects of flow management and global changes on the Ticino River thermal regime [62], indicate the need to get deeper insight on the metabolic implications of long periods of stable low flows.
Supplementary Materials
The following are available online at https://0-www-mdpi-com.brum.beds.ac.uk/article/10.3390/w13192778/s1, Table S1: Sampling dates (day/month/year) of benthic macroinvertebrates at the three study sites (IF1, MF1, MF2) and in the two considered periods (I-warm = Irrigation warm period, NI-cold= Non-Irrigation cold period), Table S2: Values (average ± standard deviation) of the 33 Indicators of Hydrological Alteration (IHA, Richter et al., 1996) calculated on the Ticino River flows for the three sampling sites (IF1, MF1, MF2) for the period 2010–2015., Table S3: Values (average ± standard deviation) of the water physico-chemical parameters measured at the three study sites (IF1, MF1, MF2) on each benthos sampling date (see Table S1). T = temperature, DO = dissolved oxygen concentration (mg L−1) and saturation (%), EC = electrical conductivity, NH4+−N = concentration of ammonia nitrogen, NO3−−N = concentration of nitrate nitrogen, TN = concentration of total nitrogen, TP = concentration of total phosphorus, COD = chemical oxygen demand, BOD5 = biochemical oxygen demand in five days., Table S4: Average values of the hydrological variables calculated for the pre-sampling periods at the three sampling sites (IF1, MF1, MF2) during I-warm (irrigation and warm) and NI-cold (non-irrigation and cold) periods. QM: mean flow, QCV: coefficient of variation, Qmin: minimum flow, Qmax: maximum flow, QP25, QP50, and QP75: 25th, 50th and 75th flow percentiles, ΔQ: Qmax-Qmin, QS: mean flow of the sampling date; INCM and INCMax: mean and maximum increase of flows between two consecutive days; DECM and DECMax: mean and maximum decrease, INCL and DECL: last increase and decrease; FRELF: n. of low-flow days; FREHF: n. of high flow days; DURLF-max: maximum duration of low-flows; DURLF-last: duration of the low flow period immediately before the sampling; TIMHF: n. of days from the last high-pulse day., Figure S1: Principal component analysis (PCA) of the hydrological variables calculated for the pre-sampling periods at the three sampling sites (IF1, MF1, MF2) during I-warm (irrigation and warm) and NI-cold (non-irrigation and cold) periods. QM: mean flow, QCV: coefficient of variation, Qmin: minimum flow, Qmax: maximum flow, QP25, QP50, and QP75: 25th, 50th and 75th flow percentiles, ΔQ: Qmax-Qmin, QS: mean flow of the sampling date; INCM and INCMax: mean and maximum increase of flows between two consecutive days; DECM and DECMax: mean and maximum decrease, INCL and DECL: last increase and decrease; FRELF: n. of low-flow days; FREHF: n. of high flow days; DURLF-max: maximum duration of low-flows; DURLF-last: duration of the low flow period immediately before the sampling; TIMHP: n. of days from the last high-pulse day.
Author Contributions
Conceptualization, F.S. and S.Q.; formal analysis, F.S., S.Q., and P.E.; investigation, F.S.; data curation, F.S.; writing—original draft preparation, F.S. and S.Q.; writing—review and editing, F.S., S.Q, and P.E.; visualization, F.S. and S.Q.; supervision, G.C.; project administration, G.C.; funding acquisition, G.C. All authors have read and agreed to the published version of the manuscript.
Funding
This research was funded by University of Insubria with funds from the Cooperation Program V-A Italy-Switzerland 2014–2020 (481668) (two grants: F.S. and S.Q.).
Institutional Review Board Statement
Not applicable.
Informed Consent Statement
Not applicable.
Data Availability Statement
The data that support the findings of this study are available from the corresponding authors upon reasonable request.
Acknowledgments
Flow data were kindly provided by the Ticino Consortium.
Conflicts of Interest
The authors declare no conflict of interest. The funders had no role in the design of the study; in the collection, analyses, or interpretation of data; in the writing of the manuscript, or in the decision to publish the results.
References
- Pham, H.V.; Torresan, S.; Critto, A.; Marcomini, A. Alteration of freshwater ecosystem services under global change – A review focusing on the Po River basin (Italy) and the Red River basin (Vietnam). Sci. Total Environ. 2019, 652, 1347–1365. [Google Scholar] [CrossRef]
- Tramblay, Y.; Koutroulis, A.; Samaniego, L.; Vicente-Serrano, S.M.; Volaire, F.; Boone, A.; Le Page, M.; Llasat, M.C.; Albergel, C.; Burak, S.; et al. Challenges for drought assessment in the Mediterranean region under future climate scenarios. Earth-Sci. Rev. 2020, 210, 103348. [Google Scholar] [CrossRef]
- Wilby, R.L.; Harris, I. A framework for assessing uncertainties in climate change impacts: Low-flow scenarios for the River Thames, UK. Water Resour. Res. 2006, 42, 02419. [Google Scholar] [CrossRef]
- Giuntoli, I.; Vidal, J.-P.; Prudhomme, C.; Hannah, D.M. Future hydrological extremes: The uncertainty from multiple global climate and global hydrological models. Earth Syst. Dyn. 2015, 6, 267–285. [Google Scholar] [CrossRef] [Green Version]
- Vetter, T.; Huang, S.; Aich, V.; Yang, T.; Wang, X.; Krysanova, V.; Hattermann, F. Multi-model climate impact assessment and intercomparison for three large-scale river basins on three continents. Earth Syst. Dyn. 2015, 6, 17–43. [Google Scholar] [CrossRef] [Green Version]
- Vidal, J.-P.; Hingray, B.; Magand, C.; Sauquet, E.; Ducharne, A. Hierarchy of climate and hydrological uncertainties in transient low-flow projections. Hydrol. Earth Syst. Sci. 2016, 20, 3651–3672. [Google Scholar] [CrossRef] [Green Version]
- Amraoui, N.; Sbai, M.A.; Stollsteiner, P. Assessment of Climate Change Impacts on Water Resources in the Somme River Basin (France). Water Resour. Manag. 2019, 33, 2073–2092. [Google Scholar] [CrossRef]
- De Niel, J.; Van Uytven, E.; Willems, P. Uncertainty Analysis of Climate Change Impact on River Flow Extremes Based on a Large Multi-Model Ensemble. Water Resour. Manag. 2019, 33, 4319–4333. [Google Scholar] [CrossRef]
- Lytle, D.A.; Poff, N.L. Adaptation to natural flow regimes. Trends Ecol. Evol. 2004, 19, 94–100. [Google Scholar] [CrossRef]
- Acreman, M.C.; Ferguson, A.J.D. Environmental flows and the European Water Framework Directive. Freshw. Biol. 2010, 55, 32–48. [Google Scholar] [CrossRef]
- Poff, N.L.; Allan, J.D.; Bain, M.B.; Karr, J.R.; Prestegaard, K.L.; Richter, B.D.; Sparks, R.E.; Stromberg, J.C. The Natural Flow Regime. Bioscience 1997, 47, 769–784. [Google Scholar] [CrossRef]
- Bunn, S.E.; Arthington, A.H. Basic Principles and Ecological Consequences of Altered Flow Regimes for Aquatic Biodiversity. Environ. Manag. 2002, 30, 492–507. [Google Scholar] [CrossRef] [PubMed] [Green Version]
- Poff, N.L.; Zimmerman, J.K.H. Ecological responses to altered flow regimes: A literature review to inform the science and management of environmental flows. Freshw. Biol. 2010, 55, 194–205. [Google Scholar] [CrossRef]
- European Commission. Report from the Commission to the European Parliament and the Council on the implementation of the Water Framework Directive (2000/60/EC) and the Floods Directive (2007/60/EC), Second River Basin Management Plans, First Flood Risk Management Plans. COM(2019) 95 final. Belgium, 2019; p. 10. Available online: https://ec.europa.eu/info/sites/default/files/com_report_wfd_fd_2019_en_1.pdf (accessed on 15 January 2021).
- Acreman, M.C.; Dunbar, M.J. Defining environmental river flow requirements—A review. Hydrol. Earth Syst. Sci. 2004, 8, 861–876. [Google Scholar] [CrossRef]
- Bragg, O.M.; Black, A.; Duck, R.W.; Rowan, J. Approaching the physical-biological interface in rivers: A review of methods for ecological evaluation of flow regimes. Prog. Phys. Geogr. Earth Environ. 2005, 29, 506–531. [Google Scholar] [CrossRef]
- Quadroni, S.; Crosa, G.; Gentili, G.; Espa, P. Response of stream benthic macroinvertebrates to current water management in Alpine catchments massively developed for hydropower. Sci. Total Environ. 2017, 609, 484–496. [Google Scholar] [CrossRef]
- Salmaso, F.; Crosa, G.; Espa, P.; Gentili, G.; Quadroni, S.; Zaccara, S. Benthic macroinvertebrates response to water management in a lowland river: Effects of hydro-power vs irrigation off-stream diversions. Environ. Monit. Assess. 2017, 190, 33. [Google Scholar] [CrossRef] [PubMed]
- Poff, N.L. Beyond the natural flow regime? Broadening the hydro-ecological foundation to meet environmental flows challenges in a non-stationary world. Freshw. Biol. 2018, 63, 1011–1021. [Google Scholar] [CrossRef]
- Arthington, A.H.; Bhaduri, A.; Bunn, S.; Jackson, S.; Tharme, R.E.; Tickner, D.; Young, B.; Acreman, M.; Baker, N.; Capon, S.; et al. The Brisbane Declaration and Global Action Agenda on Environmental Flows (2018). Front. Environ. Sci. 2018, 6, 45. [Google Scholar] [CrossRef] [Green Version]
- Steel, A.E.; Peek, R.A.; Lusardi, R.A.; Yarnell, S.M. Associating metrics of hydrologic variability with benthic macroinvertebrate communities in regulated and unregulated snowmelt-dominated rivers. Freshw. Biol. 2017, 63, 844–858. [Google Scholar] [CrossRef]
- Wilby, R.; Orr, H.; Watts, G.; Battarbee, R.; Berry, P.; Chadd, R.; Dugdale, S.; Dunbar, M.; Elliott, J.; Extence, C. Evidence needed to manage freshwater ecosystems in a changing climate: Turning adaptation principles into practice. Sci. Total Environ. 2010, 408, 4150–4164. [Google Scholar] [CrossRef]
- Acreman, M.; Overton, I.; King, J.; Wood, P.; Cowx, I.; Dunbar, M.J.; Kendy, E.; Young, W. The changing role of ecohydrological science in guiding environmental flows. Hydrol. Sci. J. 2014, 59, 433–450. [Google Scholar] [CrossRef]
- Arthington, A.H.; Kennen, J.G.; Stein, E.D.; Webb, J.A. Recent advances in environmental flows science and water management—Innovation in the Anthropocene. Freshw. Biol. 2018, 63, 1022–1034. [Google Scholar] [CrossRef] [Green Version]
- Billi, P.; Fazzini, M. Global change and river flow in Italy. Glob. Planet. Chang. 2017, 155, 234–246. [Google Scholar] [CrossRef]
- Peel, M.C.; Finlayson, B.L.; McMahon, T.A. Updated world map of the Köppen-Geiger climate classification. Hydrol. Earth Syst. Sci. 2007, 11, 1633–1644. [Google Scholar] [CrossRef] [Green Version]
- Buffagni, A.; Erba, S.; Birk, S.; Cazzola, M.; Feld, C.; Ofenbock, T.; van de Bund, W. Towards European Inter-Calibration for the Water Framework Directive: Procedures and Examples for Different River Types from the EC Project Star: Contract N. EVK1-CT 2001-00089: Matrix of Possible Class Boundaries of Grades of" Ecological Status" Associated with Different Methods Stressors; Provincia Autonoma di Trento: Bari, Italy, 2005; p. 468. [Google Scholar]
- Campaioli, S.; Ghetti, P.F.; Minelli, A.; Ruffo, S. Manuale per il Riconoscimento dei Macroinvertebrati Delle Acque Dolci Italiane; Provincia Autonoma di Trento: Bari, Italy, 1994; p. 357. [Google Scholar]
- Sansoni, G. Atlante per il Riconoscimento dei Macroinvertebrati Bentonici dei Corsi d’acqua Italiani; Provincia Autonoma di Trento: Bari, Italy, 1988; p. 191. [Google Scholar]
- APHA; AWWA; WEF. Standard Methods for the Examination of Water and Wastewater; APHA: Washington, DC, USA, 1998. [Google Scholar]
- Richter, B.D.; Baumgartner, J.V.; Powell, J.; Braun, D.P. A Method for Assessing Hydrologic Alteration within Ecosystems. Conserv. Biol. 1996, 10, 1163–1174. [Google Scholar] [CrossRef] [Green Version]
- Hamed, K.; Rao, A.R. A modified Mann-Kendall trend test for autocorrelated data. J. Hydrol. 1998, 204, 182–196. [Google Scholar] [CrossRef]
- Schmidt-Kloiber, A.; Hering, D. www.freshwaterecology.info—An online tool that unifies, standardises and codifies more than 20,000 European freshwater organisms and their ecological preferences. Ecol. Indic. 2015, 53, 271–282. [Google Scholar] [CrossRef]
- Merritt, R.W.; Cummins, K.W.; Berg, M.B.; Novak, J.A.; Higgins, M.J.; Wessell, K.J.; Lessard, J.L. Development and application of a macroinvertebrate functional-group approach in the bioassessment of remnant river oxbows in southwest Florida. J. N. Am. Benthol. Soc. 2002, 21, 290–310. [Google Scholar] [CrossRef] [Green Version]
- Schneider, S.C.; Sample, J.E.; Moe, J.S.; Petrin, Z.; Meissner, T.; Hering, D. Unravelling the effect of flow regime on macroinvertebrates and benthic algae in regulated versus unregulated streams. Ecohydrology 2018, 11, e1996. [Google Scholar] [CrossRef]
- Quadroni, S.; Salmaso, F.; Gentili, G.; Crosa, G.; Espa, P. Response of benthic macroinvertebrates to different hydropower off-stream diversion schemes. Ecohydrology 2020, e2267. [Google Scholar] [CrossRef]
- Clausen, B.; Biggs, B.J.F. Relationships between benthic biota and hydrological indices in New Zealand streams. Freshw. Biol. 1997, 38, 327–342. [Google Scholar] [CrossRef]
- Salmi, T.; Määttä, A.; Anttila, P.; Ruoho-Airola, T.; Amnell, T. Detecting Trends of Annual Values of Atmospheric Pollutants by the Mann–Kendall Test and Sen’s Slope Estimates—the Excel Template Application MAKESENS; Ilmatieteen Laitos: Helsinki, Finland, 2002; p. 35. [Google Scholar]
- Mahdi, E.; McLeod, A.I. Package “portes”: Portmanteau Tests for Univariate and Multivariate Time Series Models. R package version 5.0. 2020. Available online: https://cran.r-project.org/web/packages/portes/portes.pdf (accessed on 30 September 2021).
- Patakamuri, S.K.; O’Brien, N. Package “modifiedmk”: Modified Versions of Mann Kendall and Spearman’s Rho Trend Tests. R package version 3.0. 2021. Available online: https://cran.r-project.org/web/packages/modifiedmk/modifiedmk.pdf (accessed on 30 September 2021).
- Hammer, Ø.; Harper, D.A.T.; Ryan, P.D. PAST: Paleontological statistics software package for education and data anal-ysis. Palaeontol. Electronics 2001, 4, 9. Available online: https://palaeo-electronica.org/2001_1/past/past.pdf (accessed on 13 January 2021).
- Addinsoft. XLSTAT, A Complete statistical Add-in for Microsoft Excel; Addinsoft: New York, NY, USA, 2014. [Google Scholar]
- Meaurio, M.; Zabaleta, A.; Boithias, L.; Epelde, A.M.; Sauvage, S.; Sánchez-Pérez, J.-M.; Srinivasan, R.; Antiguedad, I. Assessing the hydrological response from an ensemble of CMIP5 climate projections in the transition zone of the Atlantic region (Bay of Biscay). J. Hydrol. 2017, 548, 46–62. [Google Scholar] [CrossRef]
- EEA (European Environment Agency). Climate change impacts and vulnerability in Europe 2016. In EEA Report No 1/2017; EEA: Copenhagen, Denmark, 2017; p. 419. [Google Scholar]
- Vansteenkiste, T.; Tavakoli, M.; Ntegeka, V.; De Smedt, F.; Batelaan, O.; Pereira, F.; Willems, P. Intercomparison of hydrological model structures and calibration approaches in climate scenario impact projections. J. Hydrol. 2014, 519, 743–755. [Google Scholar] [CrossRef]
- Wang, X. Advances in separating effects of climate variability and human activity on stream discharge: An overview. Adv. Water Resour. 2014, 71, 209–218. [Google Scholar] [CrossRef]
- Cui, T.; Tian, F.; Yang, T.; Wen, J.; Khan, M.Y.A. Development of a comprehensive framework for assessing the impacts of climate change and dam construction on flow regimes. J. Hydrol. 2020, 590, 125358. [Google Scholar] [CrossRef]
- Zhang, Y.; Zhai, X.; Zhao, T. Annual shifts of flow regime alteration: New insights from the Chaishitan Reservoir in China. Sci. Rep. 2018, 8, 1–11. [Google Scholar] [CrossRef]
- Falcucci, A.; Maiorano, L.; Boitani, L. Changes in land-use/land-cover patterns in Italy and their implications for biodiversity conservation. Landsc. Ecol. 2007, 22, 617–631. [Google Scholar] [CrossRef]
- García-Ruiz, J.M.; Lana-Renault, N. Hydrological and erosive consequences of farmland abandonment in Europe, with special reference to the Mediterranean region – A review. Agric. Ecosyst. Environ. 2011, 140, 317–338. [Google Scholar] [CrossRef]
- Ward, J.V.; A Stanford, J. Thermal Responses in the Evolutionary Ecology of Aquatic Insects. Annu. Rev. EÈntomol. 1982, 27, 97–117. [Google Scholar] [CrossRef]
- Dolédec, S. Seasonal dynamics of benthic macroinvertebrate communities in the Lower Ardèche River (France). Hydrobiologia 1989, 182, 73–89. [Google Scholar] [CrossRef]
- Cortes, R.M.V.; Ferreira, M.T.; Oliveira, S.V.; Oliveira, D. Macroinvertebrate community structure in a regulated river segment with different flow conditions. River Res. Appl. 2002, 18, 367–382. [Google Scholar] [CrossRef]
- Bonada, N.; Rieradevall, M.; Prat, N. Macroinvertebrate community structure and biological traits related to flow permanence in a Mediterranean river network. Hydrobiologia 2007, 589, 91–106. [Google Scholar] [CrossRef]
- Krajenbrink, H.J.; Acreman, M.; Dunbar, M.J.; Hannah, D.; Laizé, C.L.; Wood, P.J. Macroinvertebrate community responses to river impoundment at multiple spatial scales. Sci. Total Environ. 2019, 650, 2648–2656. [Google Scholar] [CrossRef] [PubMed]
- Wills, T.C.; Baker, E.A.; Nuhfer, A.J.; Zorn, T.G. Response of the benthic macroinvertebrate community in a northern Michigan stream to reduced summer streamflows. River Res. Appl. 2006, 22, 819–836. [Google Scholar] [CrossRef] [Green Version]
- Rader, R.B.; Belish, T.A. Influence of mild to severe flow alterations on invertebrates in three mountain streams. Regul. Rivers: Res. Manag. 1999, 15, 353–363. [Google Scholar] [CrossRef]
- Dewson, Z.S.; James, A.B.W.; Death, R.G. A review of the consequences of decreased flow for instream habitat and macroinvertebrates. J. North Am. Benthol. Soc. 2007, 26, 401–415. [Google Scholar] [CrossRef]
- Chinnayakanahalli, K.J.; Hawkins, C.P.; Tarboton, D.; Hill, R.A. Natural flow regime, temperature and the composition and richness of invertebrate assemblages in streams of the western United States. Freshw. Biol. 2011, 56, 1248–1265. [Google Scholar] [CrossRef]
- Nukazawa, K.; Shirasaka, K.; Kajiwara, S.; Saito, T.; Irie, M.; Suzuki, Y. Gradients of flow regulation shape community structures of stream fishes and insects within a catchment subject to typhoon events. Sci. Total Environ. 2020, 748, 141398. [Google Scholar] [CrossRef]
- Wei, G.; Yang, Z.; Cui, B.; Li, B.; Chen, H.; Bai, J.; Dong, S. Impact of Dam Construction on Water Quality and Water Self-Purification Capacity of the Lancang River, China. Water Resour. Manag. 2009, 23, 1763–1780. [Google Scholar] [CrossRef]
- Salmaso, F.; Quadroni, S.; Gentili, G.; Crosa, G. Thermal regime of a highly regulated Italian river (Ticino River) and implications for aquatic communities. J. Limnol. 2016, 76. [Google Scholar] [CrossRef] [Green Version]
- Snelder, T.H.; Lamouroux, N. Co-variation of fish assemblages, flow regimes and other habitat factors in French rivers. Freshw. Biol. 2010, 55, 881–892. [Google Scholar] [CrossRef]
- Booker, D.J.; Snelder, T.H.; Greenwood, M.J.; Crow, S.K. Relationships between invertebrate communities and both hydrological regime and other environmental factors across New Zealand’s rivers. Ecohydrology 2015, 8, 13–32. [Google Scholar] [CrossRef]
- Camargo, J.A.; Alonso, Á.; De La Puente, M. Multimetric assessment of nutrient enrichment in impounded rivers based on benthic macroinvertebrates. Environ. Monit. Assess. 2004, 96, 233–249. [Google Scholar] [CrossRef]
- Miracle, M.R.; Moss, B.; Vicente, E.; Romo Pérez, S.; Rueda, J.; Bécares Mantecón, E.; Gyllström, M. Response of ma-croinvertebrates to experimental nutrient and fish additions in European localities at different latitudes. Limnetica 2006, 25, 585–612. [Google Scholar]
- Racchetti, E.; Salmaso, F.; Pinardi, M.; Quadroni, S.; Soana, E.; Sacchi, E.; Severini, E.; Celico, F.; Viaroli, P.; Bartoli, M. Is Flood Irrigation a Potential Driver of River-Groundwater Interactions and Diffuse Nitrate Pollution in Agricultural Watersheds? Water 2019, 11, 2304. [Google Scholar] [CrossRef] [Green Version]
- Theodoropoulos, C.; Vourka, A.; Stamou, A.; Rutschmann, P.; Skoulikidis, N. Response of freshwater macroinvertebrates to rainfall-induced high flows: A hydroecological approach. Ecol. Indic. 2017, 73, 432–442. [Google Scholar] [CrossRef]
- Basset, A.; Glazier, D.S. Resource limitation and intraspecific patterns of weight × length variation among spring detritivores. Hydrobiol. 1995, 316, 127–137. [Google Scholar] [CrossRef]
- Haapala, A.; Muotka, T.; Laasonen, P. Distribution of benthic macroinvertebrates and leaf litter in relation to streambed retentivity: Implications for headwater stream restoration. Boreal. Environ. Res. 2003, 8, 19–30. [Google Scholar]
- Robinson, C.T. Long-term changes in community assembly, resistance, and resilience following experimental floods. Ecol. Appl. 2012, 22, 1949–1961. [Google Scholar] [CrossRef] [PubMed] [Green Version]
- Fornaroli, R.; Calabrese, S.; Marazzi, F.; Zaupa, S.; Mezzanotte, V. The influence of multiple controls on structural and functional characteristics of macroinvertebrate community in a regulated Alpine river. Ecohydrology 2019, 12, e2069. [Google Scholar] [CrossRef]
- Wantzen, K.M.; Rothhaupt, K.-O.; Mörtl, M.; Cantonati, M.; Tóth, L.G.-; Fischer, P. Ecological effects of water-level fluctuations in lakes: An urgent issue. In Ecological Effects of Water-Level Fluctuations in Lakes; Springer: Dordrecht, The Netherlands, 2008; Volume 204, pp. 1–4. [Google Scholar]
- Jourdan, J.; O’Hara, R.B.; Bottarin, R.; Huttunen, K.-L.; Kuemmerlen, M.; Monteith, D.; Muotka, T.; Ozoliņš, D.; Paavola, R.; Pilotto, F.; et al. Effects of changing climate on European stream invertebrate communities: A long-term data analysis. Sci. Total Environ. 2018, 621, 588–599. [Google Scholar] [CrossRef]
- Mastore, M.; Rossetti, S.B.; Giovannardi, S.; Scari’, G.; Brivio, M.F. Inducible factors with antimicrobial activity after immune challenge in the haemolymph of Red Palm Weevil (Insecta). Innate Immun. 2015, 21, 392–405. [Google Scholar] [CrossRef] [Green Version]
- Barbaro, A.D.L.; Gariboldi, M.B.; Mastore, M.; Brivio, M.F.; Giovannardi, S. In Vivo Effects of A Pro-PO System Inhibitor on the Phagocytosis of Xenorhabdus Nematophila in Galleria Mellonella Larvae. Insects 2019, 10, 263. [Google Scholar] [CrossRef] [PubMed] [Green Version]
- Mastore, M.; Quadroni, S.; Toscano, A.; Mottadelli, N.; Brivio, M.F. Susceptibility to entomopathogens and modulation of basal immunity in two insect models at different temperatures. J. Therm. Biol. 2019, 79, 15–23. [Google Scholar] [CrossRef]
- Brivio, M.F.; Mastore, M. When Appearance Misleads: The Role of the Entomopathogen Surface in the Relationship with Its Host. Insects 2020, 11, 387. [Google Scholar] [CrossRef]
- Bruno, D.; Belmar, O.; Maire, A.; Morel, A.; Dumont, B.; Datry, T. Structural and functional responses of invertebrate communities to climate change and flow regulation in alpine catchments. Glob. Chang. Biol. 2019, 25, 1612–1628. [Google Scholar] [CrossRef] [Green Version]
Figure 1.
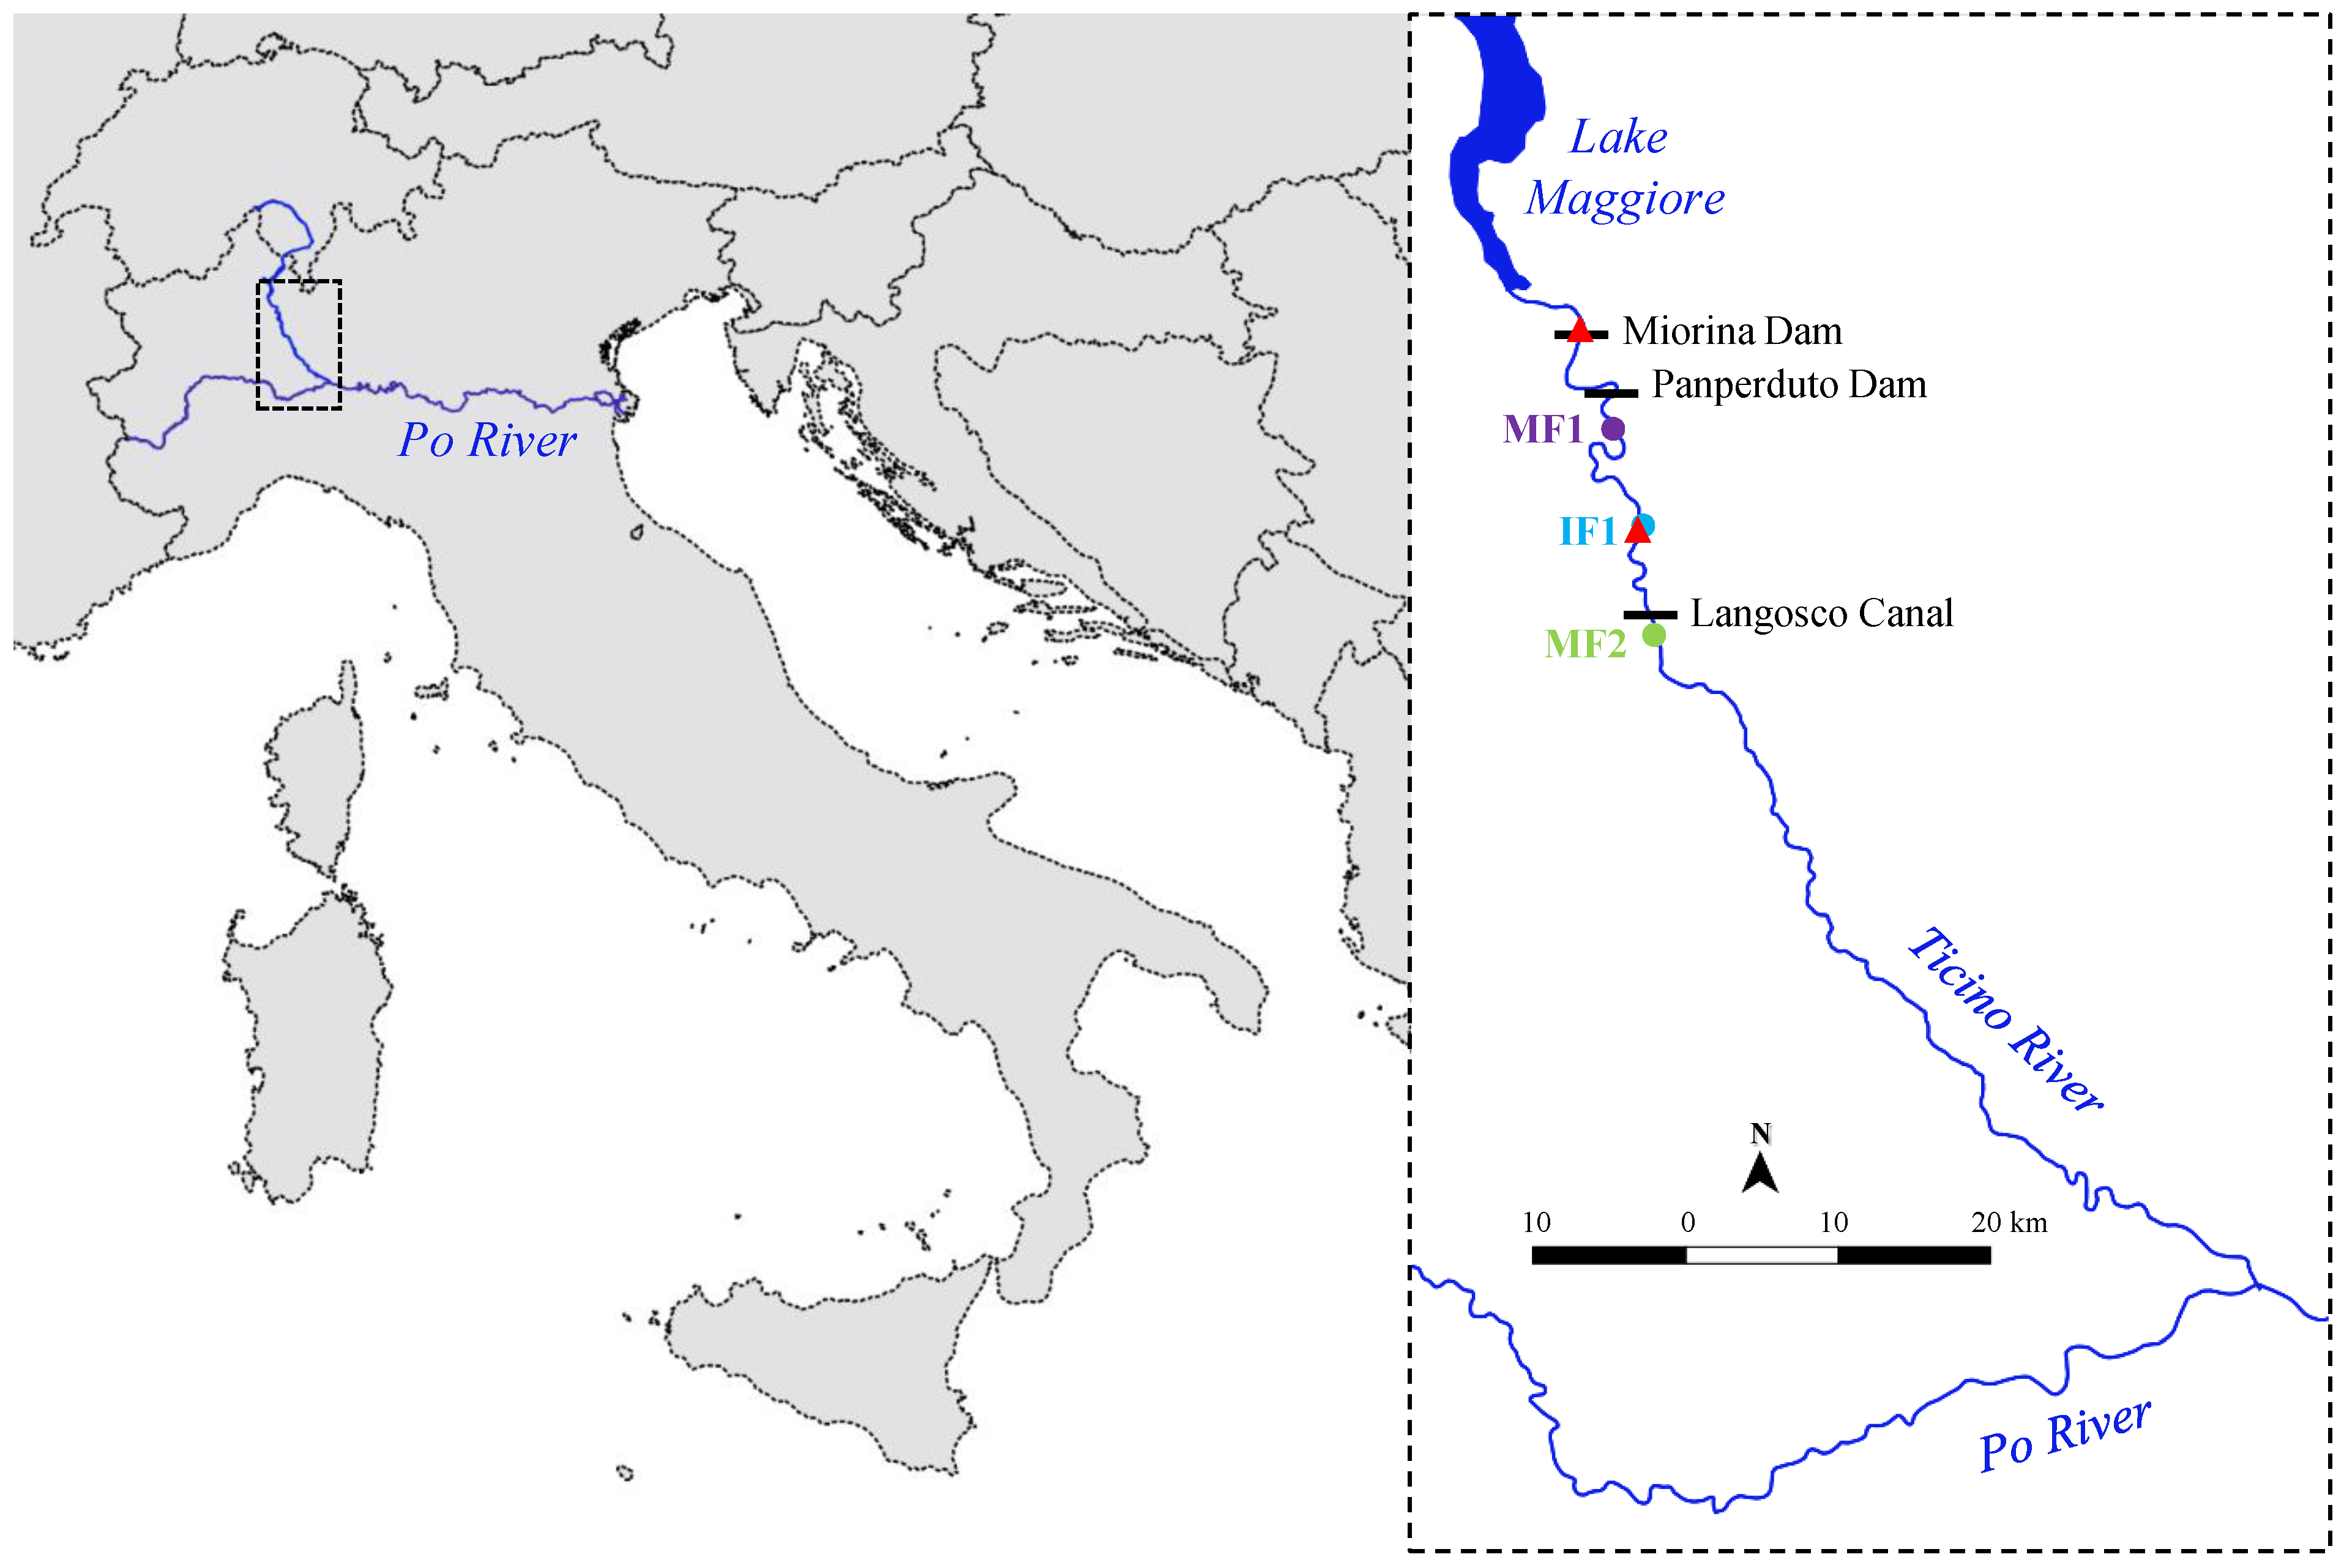
Study area. Position of the Ticino River, i.e., one of the main tributaries of the Po River, in Italy (left). Detail of the investigated river reach (right) downstream of Lake Maggiore with the Miorina and Panperduto dams, the intake of Langosco Canal and the three sampling sites (MF1, IF1, and MF2); flow gauging stations along the river are indicated by red triangles.
Figure 1.
Study area. Position of the Ticino River, i.e., one of the main tributaries of the Po River, in Italy (left). Detail of the investigated river reach (right) downstream of Lake Maggiore with the Miorina and Panperduto dams, the intake of Langosco Canal and the three sampling sites (MF1, IF1, and MF2); flow gauging stations along the river are indicated by red triangles.

Figure 2.
Data and Sen’s slope estimates of the hydrological parameters concerning the Lake Maggiore outflows recorded during the period 1943–2019 characterized by significant monotonic increasing or decreasing trend as detected by the Mann-Kendall test or its modified version [32] (see Table 1). Base flow = 7-day minimum flow divided by mean annual flow, Lo pulse # = number of annual low pulses, Lo pulse L = median duration of low pulses (days), Fall rate = median of all negative differences between consecutive daily values, Reversals = number of hydrologic reversals, XLowP L = median duration of extreme low-flow periods (days), QM-Sep/QM-year = mean flow of September divided by mean annual flow. Black and dashed red lines represent Sen’s estimate and 95% confidence interval, respectively.

Figure 3.
(a) Mean daily streamflows of the Ticino River at the three study sites downstream of water withdrawals (IF1 = blue line, MF1 = purple line, MF2 = green line) of a typical year during the study period (2010). (b) Monthly averaged streamflow reduction (%) at MF1 compared to the lake outflow, calculated over the period 2010–2015. NI-cold = Non-Irrigation-cold period of low flows, I-warm = Irrigation-warm period of low flows.

Figure 4.
Non-metric multidimensional scaling (NMDS) showing the Bray–Curtis distances between benthic assemblages collected at the three sampling sites (IF1 = light blue; MF1 = purple; MF2 = green) in the different periods (I-warm = filled dots and convex hulls; NI-cold = empty diamonds and convex hulls), taking into account taxonomical composition (a) and composition in functional feeding groups (b). Stress values: 0.17 (a) and 0.07 (b).

Figure 5.
Box plots of the biological metrics which resulted significantly different between site*period sample groups. Different letters above the boxes indicate significant differences between groups (Kruskal–Wallis and Dunn test, p < 0.05). Dots indicate outliers.
Figure 5.
Box plots of the biological metrics which resulted significantly different between site*period sample groups. Different letters above the boxes indicate significant differences between groups (Kruskal–Wallis and Dunn test, p < 0.05). Dots indicate outliers.

Figure 6.
Redundancy analysis (RDA) of the ecological (benthos metrics) and environmental (hydrological and physico-chemical) variables. Only the two hydrological variables mainly contributing to PC1 and PC2 axis of the principal component analysis (PCA) were selected (see Figure S1). I-warm = Irrigation and warm period, NI-cold = Non-Irrigation and cold period. FRELF = number of low-flow days, Qmin = minimum value of flow, T = temperature, DO = dissolved oxygen, EC = electrical conductivity, NH4+−N = ammonia nitrogen, NO3−−N = nitrate nitrogen, TP = total phosphorus, BOD5 = biochemical oxygen demand in five days, N = total density of macroinvertebrates, S = family richness, H = Shannon-Wiener diversity index, EPT = richness of EPT taxa, %EPT = relative abundance of EPT taxa, C/D = the ratio of Chironomidae/Diptera individuals, A/H = auto/heterotrophy, TDc = top-down control, LC = life cycle.


Table 1.
Statistics of Ljung–Box, Mann-Kendall test (or its modified version [32]*), and Sen’s method for the significant trends of the hydrological parameters concerning the Lake Maggiore outflows recorded during the period 1943–2019 (see Figure 2). Base flow = 7-day minimum flow divided by mean annual flow, Lo pulse # = number of annual low pulses, Lo pulse L = median duration of low pulses (days), Fall rate = median of all negative differences between consecutive daily values, Reversals = number of hydrologic reversals, XLowP L = median duration of extreme low-flow periods (days), QM-Sep/QM-year = mean flow of September divided by mean annual flow, n = the number of annual values in the calculation, χ2 = statistic of Ljung–Box test, Z = statistic of the Mann-Kendall test, p = significance level, Q = the Sen’s estimator for the true slope of linear trend, B = estimate of the constant B in the Sen’s equation, min95 and max95 = limits of the 95% confidence interval.
| Ljung–Box | Mann-Kendall | Sen’s Estimate | |||||||||
|---|---|---|---|---|---|---|---|---|---|---|---|
| Hydrological parameters | n | χ2 | p | Z | p | Q | Qmin95 | Qmax95 | B | Bmin95 | Bmax95 |
| Base flow | 77 | 0.18 | 0.669 | −2.10 | 0.036 | −0.001 | −0.003 | 0.000 | 0.4 | 0.5 | 0.4 |
| Lo pulse # | 77 | 15.43 | <0.001 | −4.89 * | < 0.001 * | −0.070 | −0.103 | −0.039 | 6.3 | 7.7 | 4.7 |
| Lo pulse L | 77 | 3.55 | 0.060 | 4.82 | <0.001 | 0.351 | 0.167 | 0.568 | −0.1 | 5.8 | −3.1 |
| Fall rate | 77 | 0.19 | 0.666 | −3.27 | 0.001 | −0.119 | −0.197 | −0.049 | −12.1 | −9.5 | −15.3 |
| Reversals | 77 | 34.69 | <0.001 | −3.09 * | 0.002 * | −0.863 | −1.096 | −0.625 | 98 | 106 | 87 |
| XLowP L | 54 | 0.05 | 0.820 | 3.97 | <0.001 | 0.324 | 0.134 | 0.590 | 1.7 | 5.8 | −3.8 |
| QM-Sep/QM-year | 77 | 0.58 | 0.447 | −2.08 | 0.029 | −0.004 | −0.008 | 0.000 | 1.0 | 1.3 | 0.9 |
Table 2.
Result of the SIMPER analysis of the taxonomical composition of macroinvertebrate assemblages collected at each site in the two sampling periods (I-warm = May-October; NI-cold = November-April). Only the taxa mainly contributing to the differentiation (i.e., those whose cumulative contribution amounts to > 95% of the total differentiation) are shown. AD = overall average dissimilarity, MA = mean abundance (individuals 0.5 m−2), C (%) = percentage of contribution to the dissimilarity.
| Taxon | AD = 65.8 | MA–IF1 | AD = 65.9 | MA–MF1 | AD = 62.3 | MA–MF2 | |||
|---|---|---|---|---|---|---|---|---|---|
| C (%) | I-Warm | NI-Cold | C (%) | I-Warm | NI-Cold | C (%) | I-Warm | NI-Cold | |
| Leuctra | 2.2 | 46 | 0.2 | 2.3 | 73 | 0.1 | 2.5 | 64 | 0.4 |
| Baetis | 16.0 | 425 | 229 | 14.4 | 678 | 231 | 16.7 | 537 | 201 |
| Caenis | 4.3 | 45 | 95 | 2.0 | 61 | 115 | 4.0 | 81 | 89 |
| Ecdyonurus | 1.1 | 24 | 20 | 1.7 | 66 | 28 | 2.2 | 51 | 26 |
| Ephemerella | 13.1 | 23 | 361 | 7.7 | 45 | 505 | 7.3 | 28 | 219 |
| Hydropsychidae | 17.2 | 299 | 362 | 22.3 | 1080 | 487 | 16.8 | 493 | 331 |
| Hydroptilidae | 1.0 | 15 | 12 | 1.0 | 33 | 4 | 0.9 | 20 | 1 |
| Leptoceridae | 0.9 | 9 | 13 | 0.4 | 7 | 3 | 0.2 | 3 | 2 |
| Psychomyiidae | 3.9 | 31 | 77 | 1.5 | 19 | 66 | 2.0 | 23 | 62 |
| Rhyacophilidae | 1.4 | 19 | 27 | 1.3 | 48 | 53 | 0.4 | 9 | 12 |
| Chironomidae | 17.6 | 306 | 422 | 33.9 | 307 | 2390 | 35.0 | 519 | 1200 |
| Simuliidae | 4.4 | 93 | 24 | 3.8 | 55 | 127 | 4.3 | 61 | 81 |
| Elmidae | 1.8 | 30 | 43 | 1.9 | 30 | 94 | 0.6 | 11 | 17 |
| Neritidae | 1.1 | 24 | 10 | 0.05 | 0.3 | 1 | 0.004 | 0.1 | 0 |
| Asellidae | 0.3 | 3 | 4 | 1.2 | 42 | 15 | 0.1 | 3 | 1 |
| Gammaridae | 4.5 | 74 | 11 | 0.1 | 3 | 2 | 1.5 | 40 | 20 |
| Lumbricidae | 0.8 | 19 | 13 | 0.5 | 21 | 13 | 0.5 | 10 | 10 |
| Naididae | 1.4 | 1 | 26 | 1.2 | 6 | 100 | 2.4 | 26 | 58 |
| Dugesia | 0.8 | 15 | 4 | 0.6 | 21 | 12 | 0.7 | 16 | 9 |
| Hydracarina | 2.3 | 31 | 15 | 0.6 | 13 | 10 | 0.5 | 9 | 6 |
Table 3.
Significant results of the OLS regression (best model selected according to the Akaike information criterion—AIC, constraining the result to one independent variable) carried out for each benthos metric, accounting for all the considered environmental (hydrological and physico-chemical) variables. The coefficient of determination adjusted (Adj. R2), the F-statistic, and model significance are also reported. I-warm = Irrigation and warm period, NI-cold = Non-Irrigation and cold period. N = total density of macroinvertebrates, S = family richness, H = Shannon-Wiener diversity index, EPT = richness of EPT taxa, %EPT = relative abundance of EPT taxa, C/D = the ratio of Chironomidae/Diptera individuals, A/H = auto/heterotrophy, TDc = top-down control, LC = life cycle, DURLF-max = maximum duration of low flows, Qmin = minimum value of flow, INCL = last flow increase between two consecutive days, QP75 = 75th flow percentiles, ΔQ = difference between maximum and minimum flow, INCMax = maximum flow increase between two consecutive days, T = temperature, NO3−−N = nitrate nitrogen.
| Period | Model Equation | Adj. R2 | AIC | F | p |
|---|---|---|---|---|---|
| I-warm | N = 964 + 30.6 × DURLF-max | 0.11 | 440 | 4.6 | 0.041 |
| H = 1.51 + 0.03 × Qmin | 0.17 | −66 | 7.1 | 0.013 | |
| % EPT = 1.04 − 0.54 × NO3−−N | 0.19 | −105 | 7.8 | 0.009 | |
| A/H = 1.34 − 0.03 × T | 0.20 | −119 | 8.3 | 0.008 | |
| TDc = 0.19 + 0.0006 × INCL | 0.27 | −176 | 11.5 | 0.002 | |
| LC = −0.50 + 2.25 × NO3−−N | 0.18 | −18 | 7.6 | 0.010 | |
| NI-cold | N = −15373 + 2234 × pH | 0.17 | 485 | 6.8 | 0.014 |
| S = 25.3 − 0.03 × QP75 | 0.13 | 113 | 5.5 | 0.027 | |
| EPT = 10.1 − 0.002 × ΔQ | 0.23 | 39 | 9.8 | 0.004 | |
| H = 1.29 + 0.02 × Qmin | 0.18 | −57 | 7.2 | 0.01 | |
| C/D = 0.94 − 0.009 × INCL | 0.48 | −121 | 27.9 | <0.0001 | |
| % EPT = 0.58 − 0.0002 × ΔQ | 0.13 | −98 | 5.2 | 0.030 | |
| TDc = 0.16 + 0.0002 × INCMax | 0.24 | −180 | 10.0 | 0.004 | |
| LC = −0.03 + 0.006 × ΔQ | 0.28 | 87 | 12.0 | 0.002 |
Publisher’s Note: MDPI stays neutral with regard to jurisdictional claims in published maps and institutional affiliations. |
© 2021 by the authors. Licensee MDPI, Basel, Switzerland. This article is an open access article distributed under the terms and conditions of the Creative Commons Attribution (CC BY) license (https://creativecommons.org/licenses/by/4.0/).
Share and Cite
MDPI and ACS Style
Salmaso, F.; Crosa, G.; Espa, P.; Quadroni, S. Climate Change and Water Exploitation as Co-Impact Sources on River Benthic Macroinvertebrates. Water 2021, 13, 2778. https://0-doi-org.brum.beds.ac.uk/10.3390/w13192778
AMA Style
Salmaso F, Crosa G, Espa P, Quadroni S. Climate Change and Water Exploitation as Co-Impact Sources on River Benthic Macroinvertebrates. Water. 2021; 13(19):2778. https://0-doi-org.brum.beds.ac.uk/10.3390/w13192778
Chicago/Turabian StyleSalmaso, Francesca, Giuseppe Crosa, Paolo Espa, and Silvia Quadroni. 2021. "Climate Change and Water Exploitation as Co-Impact Sources on River Benthic Macroinvertebrates" Water 13, no. 19: 2778. https://0-doi-org.brum.beds.ac.uk/10.3390/w13192778
Note that from the first issue of 2016, this journal uses article numbers instead of page numbers. See further details here.