
Rainwater Harvesting to Address Current and Forecasted Domestic Water Scarcity: Application to Arid and Semi-Arid Areas


Laboratoire de Génie Civil et Géo-Environnement, Lille University, IMT Lille Douai, JUNIA Hauts-de-France, ULR 4515-LGCgE, F-59000 Lille, France
*
Author to whom correspondence should be addressed.
Water 2021, 13(24), 3583; https://0-doi-org.brum.beds.ac.uk/10.3390/w13243583
Submission received: 1 October 2021
/
Revised: 12 December 2021
/
Accepted: 13 December 2021
/
Published: 14 December 2021
(This article belongs to the Special Issue Methods and Tools for Assessment of Groundwater)
Abstract
:This paper discusses the effectiveness of rooftops rainwater harvesting (RRWH) in addressing domestic water scarcity, emphasizing the West Bank (Palestine) as an example of arid to semi-arid areas with limited water resources. The paper deals with the actual and future water demand by considering climate-change impact and urban growth. The analysis is based on the evaluation of (i) the supply–demand balance index (SDBI), which designates the ratio between the total water supply (TWS) and total water demand (TWD), and (ii) the potential of RRWH. Applying this methodology to the West Bank shows that the potential RRWH can contribute by about 40 million cubic meters/year in 2020, which is approximately the same amount of water as the municipal water supply (42 million cubic meters/year). This contribution can effectively reduce the suffering governorates from 64% to 27% in 2020. Furthermore, it can support water-related decision-makers in the arid to semi-arid areas in formulating efficient and sustainable water resources strategies. The analysis also shows that the domestic water scarcity in 2050 will be worse than in 2020 for all governorates. For example, 73% of the West Bank governorates are expected to suffer from extreme to acute water scarcity in 2050 compared to 64% in 2020. Thus, RRWH appears to be highly efficient in mitigating the current and future domestic water scarcity in the West Bank.
1. Introduction
This paper aims to analyze the capacity of rooftops rainwater harvesting (RRWH) in addressing the domestic water scarcity in arid and semi-arid areas, such as the West Bank in Palestine. Domestic water scarcity is defined as the inability of available freshwater to satisfy the needed domestic water demand [1]. According to the World Health Organization (WHO), such scarcity adversely affects water consumption and hygiene [2]. Areas suffering from domestic water scarcity are classified as risky to human health [2]. This scarcity increases the spread of infectious diseases (e.g., influenza, Ebola, and SARS) that could be controlled by adopting the needed washing and hygiene measures [3,4,5]. The U.N. Sustainable Development Goal (SDG-6.4) expressed the necessity of decreasing or even eliminating the number of people affected by domestic water scarcity [6]. Domestic water scarcity is of increasing concern globally, especially in arid and semi-arid areas [7]. This could be attributed to the increasing water demand and the vulnerability of water resources under climate change [7,8,9]. In the West Bank, Palestine, the domestic water supply–demand gap reached 58 million cubic meters/year (40% of the water demand) in 2018 [10].
Assessing water scarcity constitutes a vital step in addressing water scarcity [11,12]. Various indices are used to evaluate domestic water scarcity. The Falkenmark index uses the per capita water availability as an indicator of water scarcity [13,14]. Refs. [15,16] proposed to use the criticality ratio index to estimate water scarcity. Refs. [7,12,17] used water poverty index for water scarcity assessment. This indicator considers the average of the following elements: water availability, accessibility, capacity, use, and environment. According to [18], the supply–demand balance index (SDBI) is the only index that directly considers both water availability and citizens’ water needs. It provides a simple way of assessing domestic water scarcity by estimating the ratio of the water supply to the water demand. It has a single value that characterizes the water scarcity level on a scale ranging from “extreme” to “no” water shortage [18].
RRWH is commonly adopted to support the insufficient conventional water resources in arid and semi-arid areas [19]. It is widely used in Pakistan [20], Kenya [21], East Africa [22], Ghana [23], Afghanistan [24], Zambia [25], Sri Lanka [26], Bangladesh [27], Iran [28], Egypt [29], and Jordan [19,30]. RRWH efficiency depends on many factors, including rainfall (RF) volume, patterns and distribution, catchment area, and catchment type [31,32].
Climate change directly influences the availability of water resources and the RF volume, patterns, and distribution [33]. In addition, the projected water demand should consider the demographic changes [34]. Accordingly, assessing the domestic water scarcity and the potential RRWH volume could be viewed as a dynamic process. Moving from temporary to sustainable water resources management requires considering, quantifying, and analyzing climate change and demographic growth [9]. The literature review shows that the estimation of potential RRWH and its consequences on domestic water scarcity (through SDBI) is not yet clearly defined by considering the climate change impact.
Based on the literature review and the critical water scarcity in arid and semi-arid areas, the paper contribution could be summarized by: (i) the use of SDBI to assess the current domestic water scarcity in arid and semi-arid regions, (ii) the investigation of the potential RRWH ability in addressing this scarcity, (iii) analysis of the role of potential RRWH in addressing future water scarcity considering the demographic and climate changes.
The paper is organized as follows. First, it presents the research methodology, including the estimation of SDBI and RRWH. It describes the case study with emphasis on data collection, and finally, it discusses the impact of RRWH in addressing the domestic water scarcity in the West Bank, Palestine.
2. Materials and Methods
2.1. Methodology
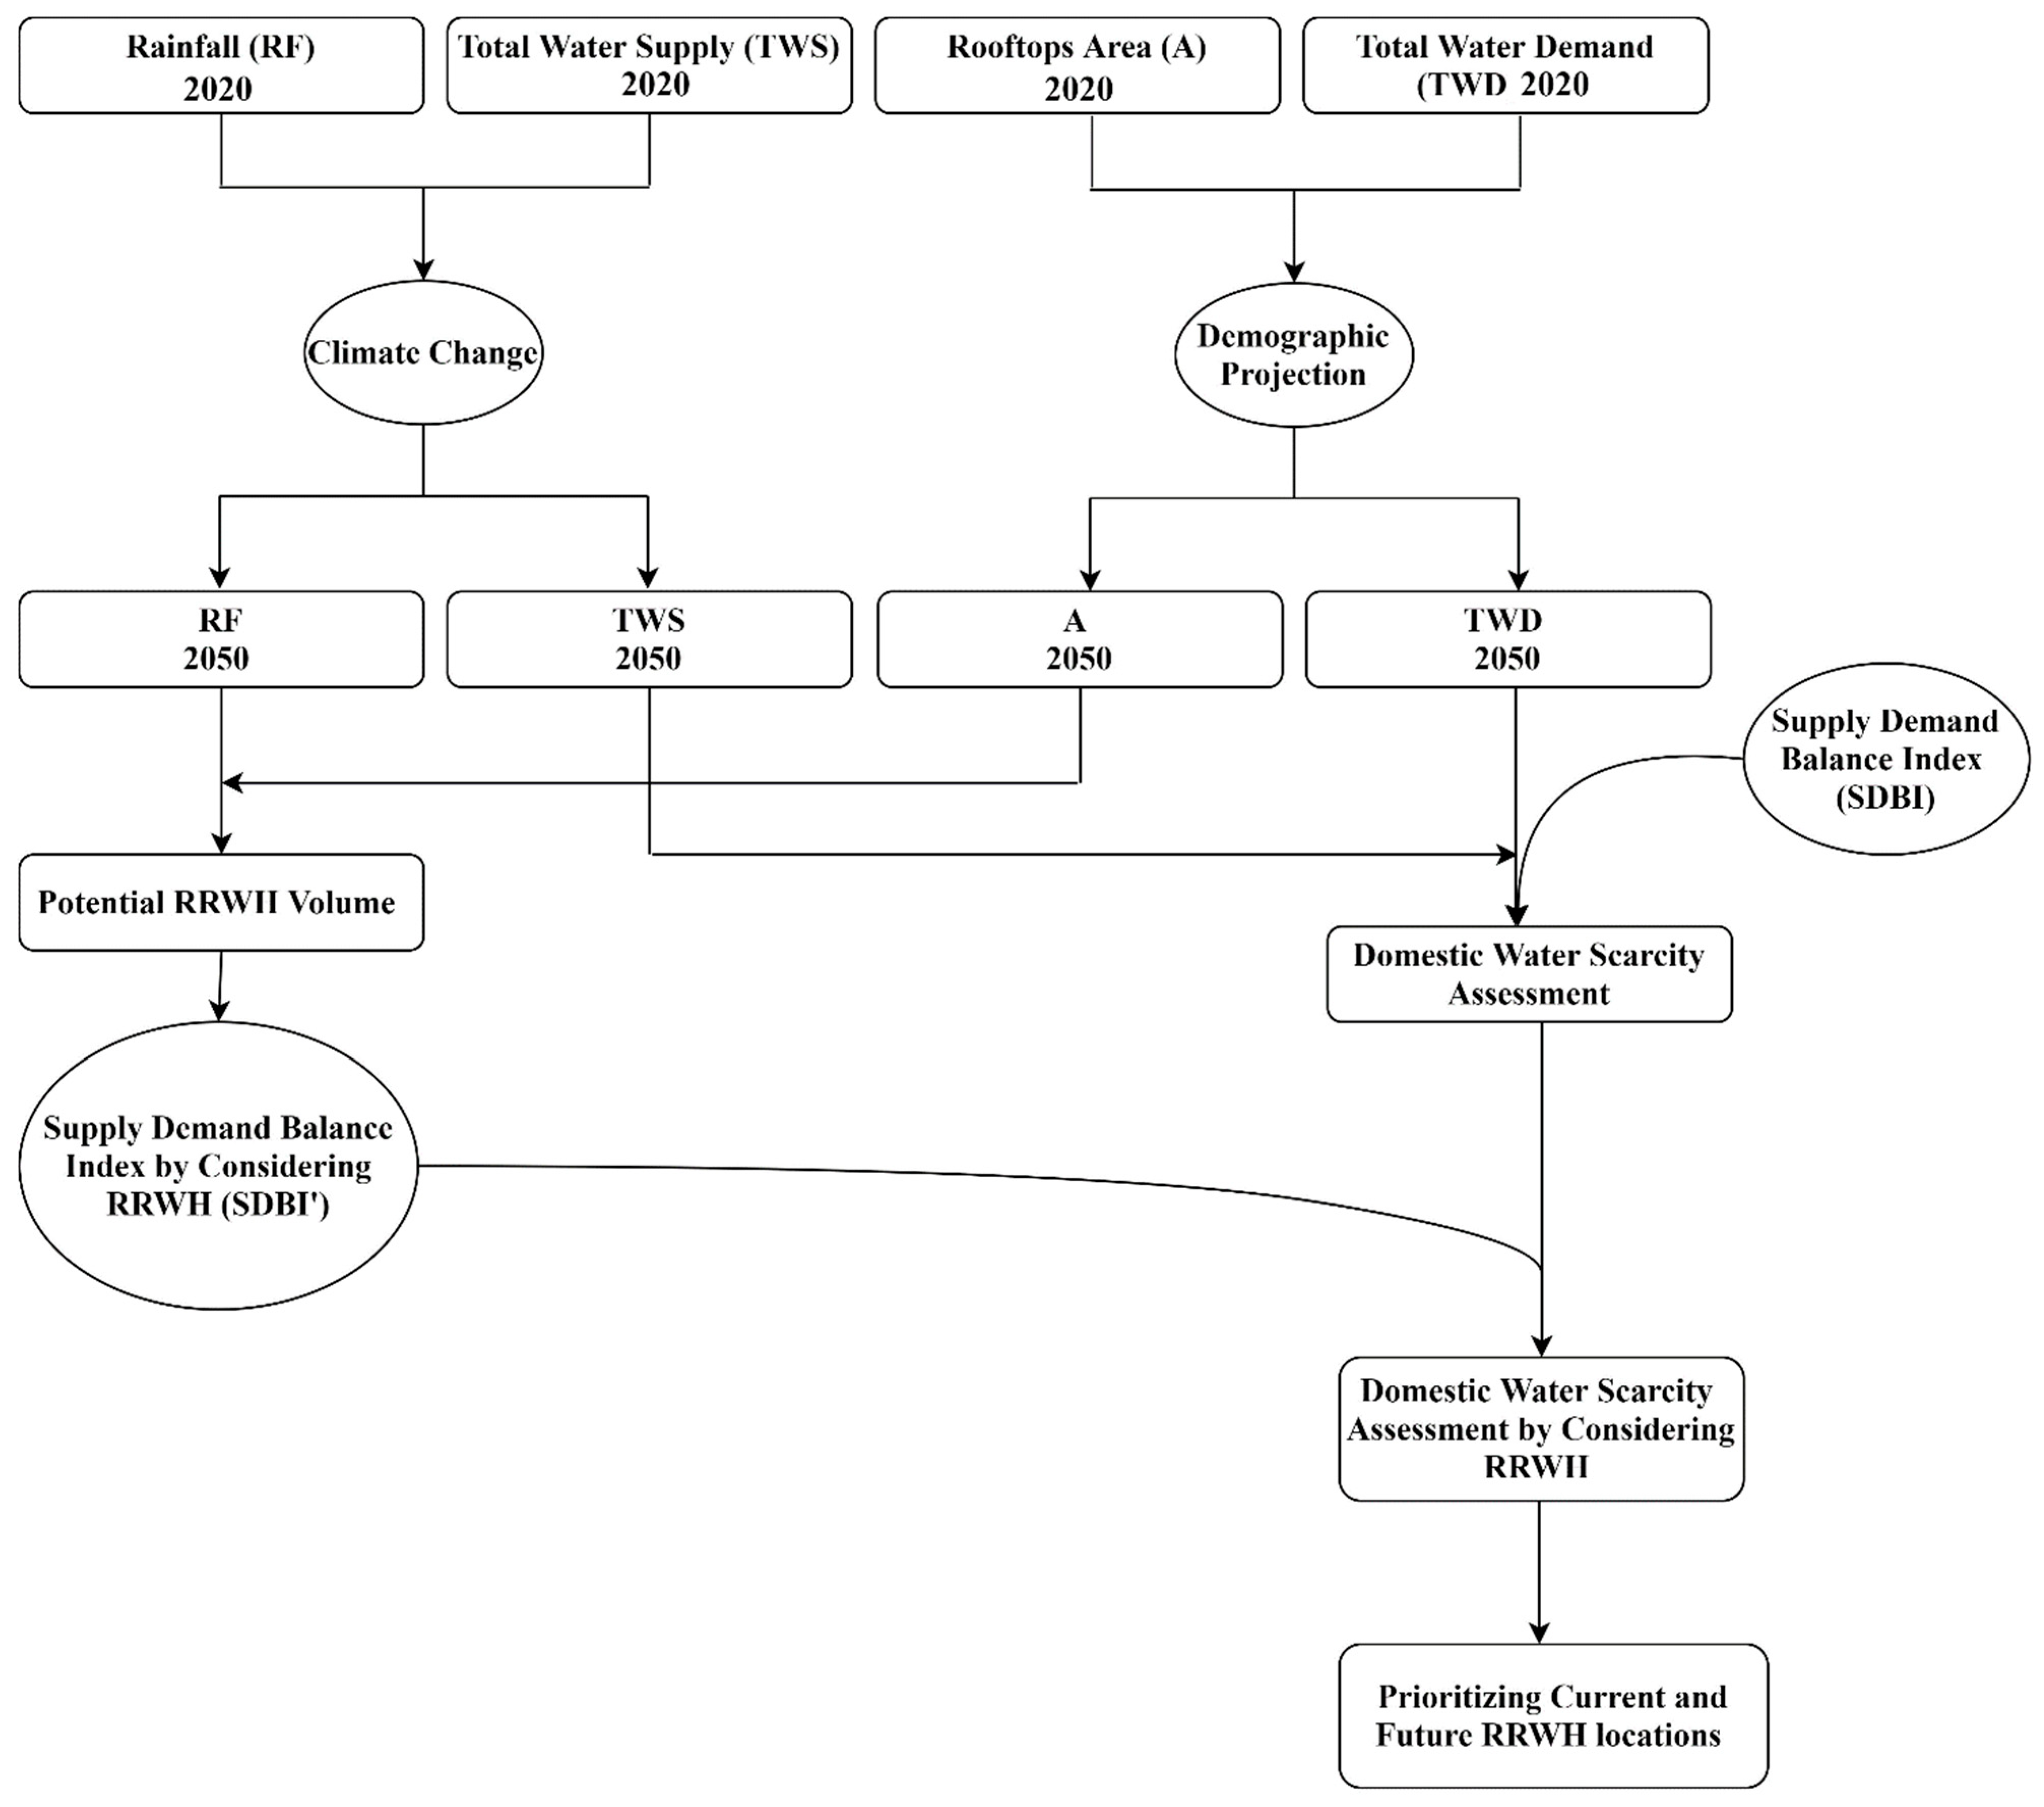
The methodology adopted in this research is illustrated in Figure 1. It includes two phases. It starts by identifying and quantifying the total water supply (TWS) in (million cubic meters/year), the total water demand (TWD) in (million cubic meters/year), and SDBI. The second phase focuses on estimating the potential RRWH volume in (million cubic meters/year) and its effect on the SDBI. Both phases are carried out for 2020 and 2050.
2.1.1. Assessment of the Domestic Water Scarcity
The assessment of domestic water scarcity starts by identifying and quantifying the sources of water supply (e.g., surface water, groundwater, desalination, etc.). Accordingly, the current TWS is estimated. The domestic water consumption rate (DWCR) is specified considering the recommendation of WHO [2]. Such rate, along with the population statistics, are used to estimate the TWD:
where
- TWDi is the TWD for the ith year in (cubic meters/year)
- POPi is the population for the ith year in (capita)
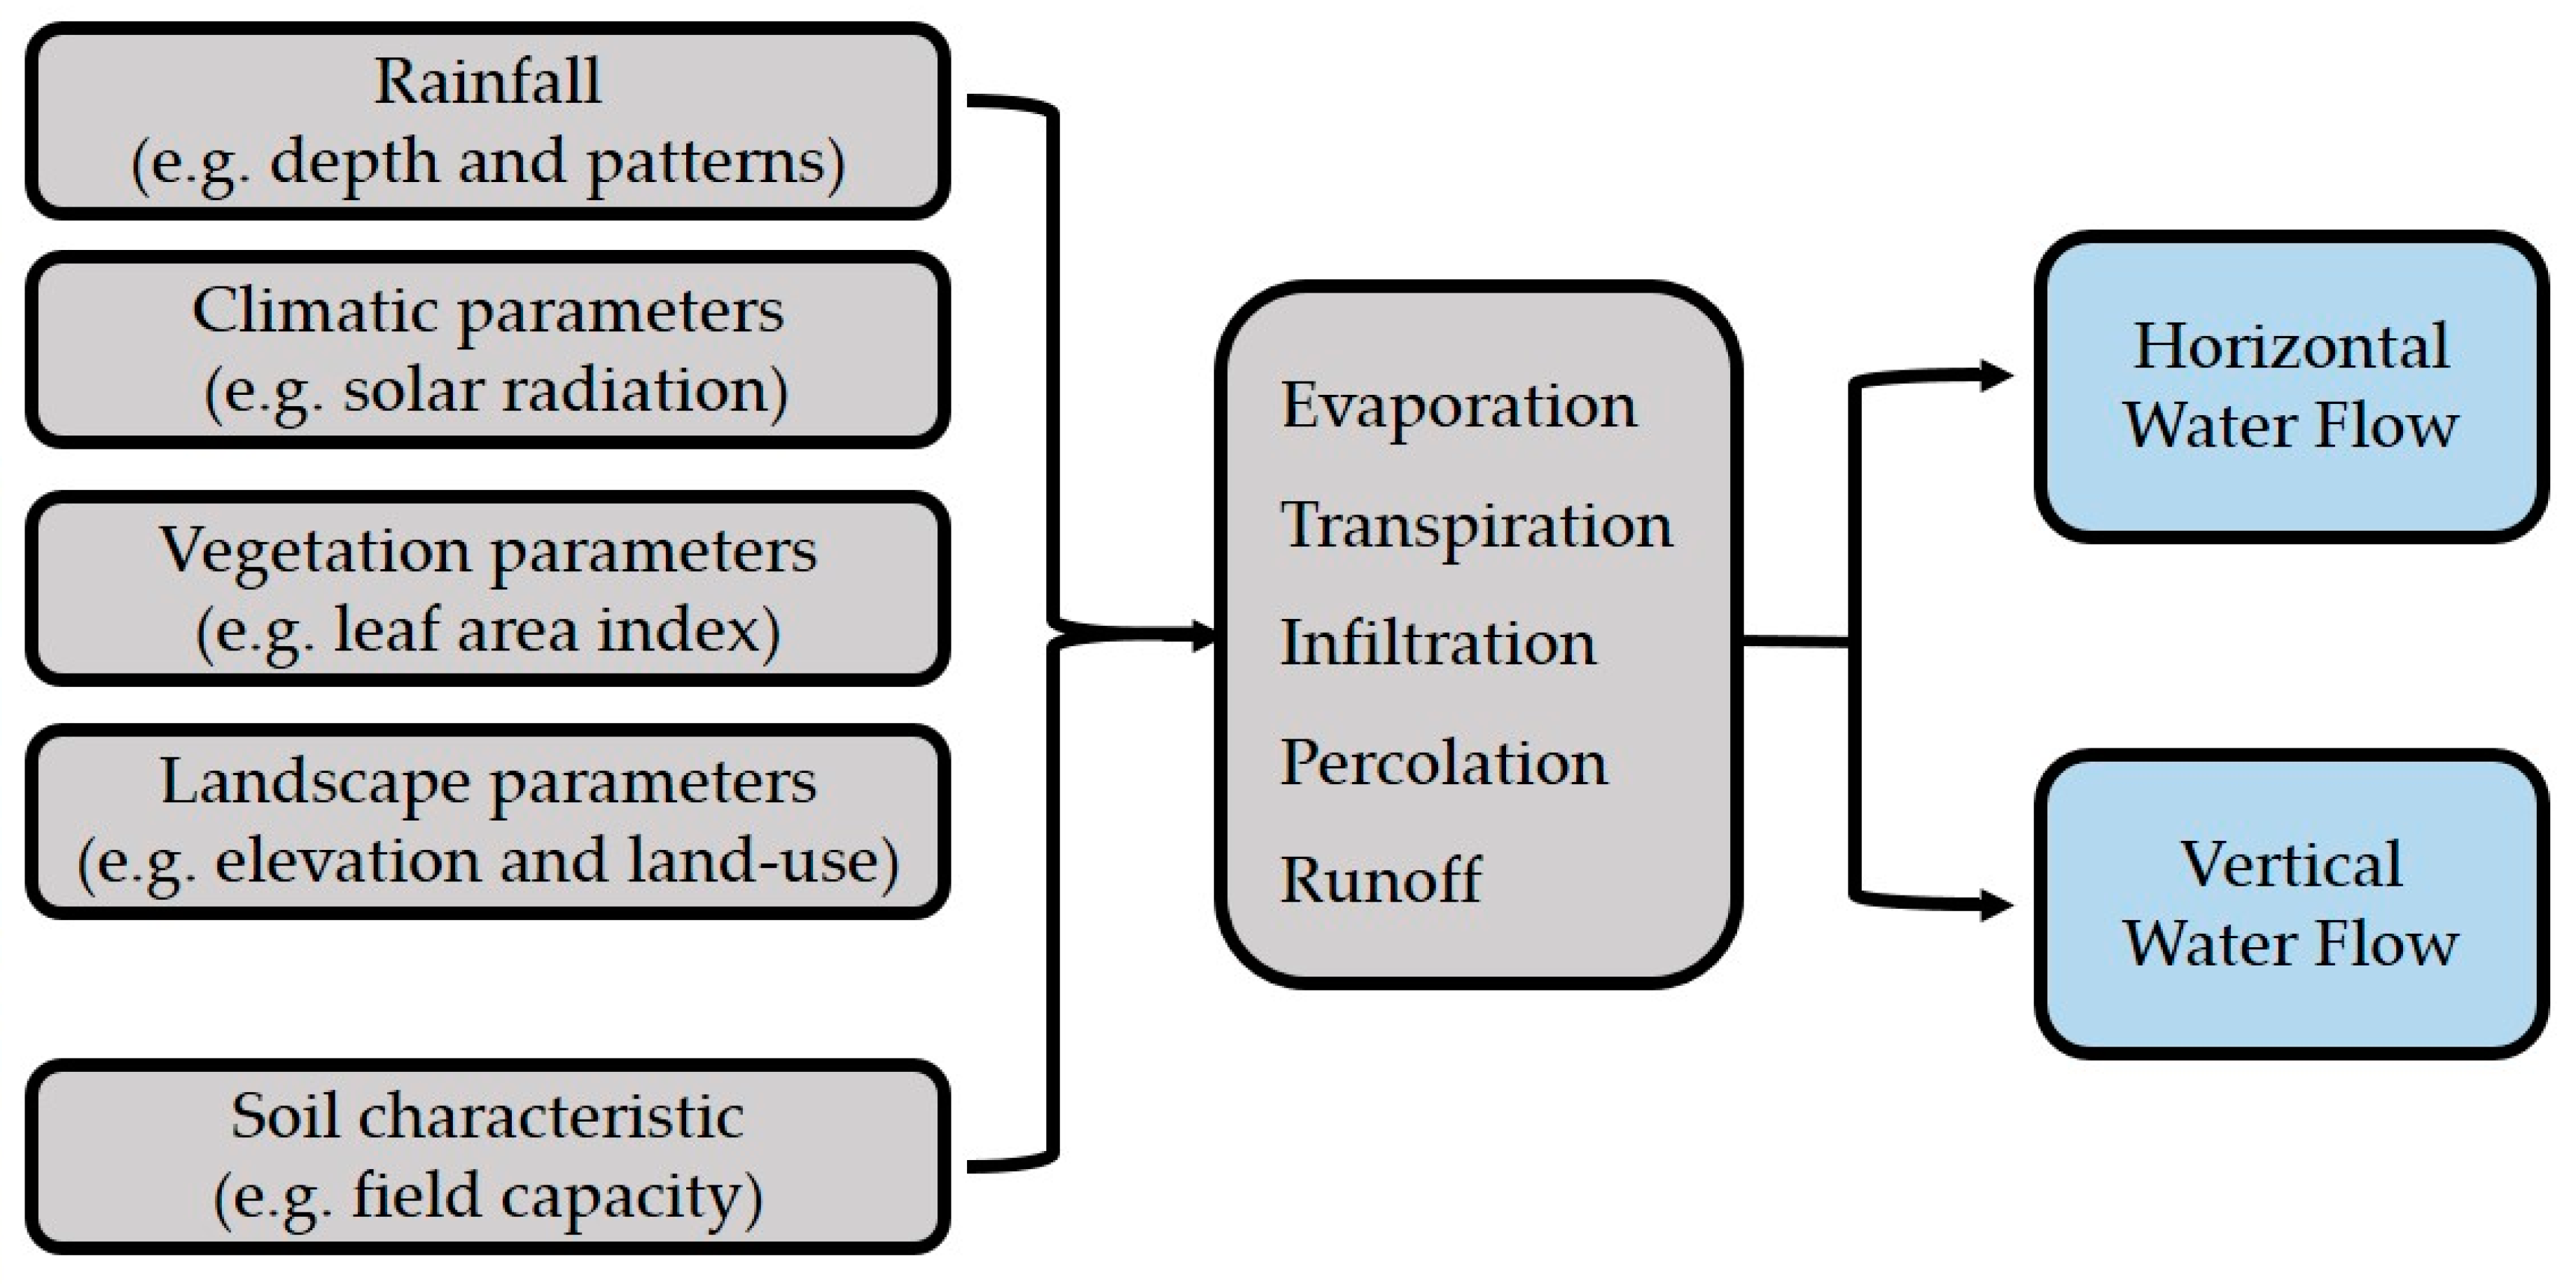
Scholars adopted various models to characterize the effect of climate change on water resources availability. Such models include (i) Water Balance Model developed by the Research Center for Climate Change (RCCC-WBM) [35], (ii) Hydrologiska Byrans Vattenbalansavdelning model (HBV) [36], (iii) Soil and Water Assessment Tool (SWAT) [37], and (iv) Soil-Vegetation-Atmosphere Model (SVAT) [9]. According to [38], the SVAT has the following strengths compared to the other models: (i) consideration of fine time-step analysis that goes in line with the time steps of the physical processes simulations, (ii) flexibility of the input parameters and their time-steps records, and (iii) consideration of the under-ground layer (e.g., soil layer), on-ground layer (e.g., vegetation layer), and over-ground layer (atmospheric layer) [38]. In this research, SVAT model is used for the determination of TWS in 2050 considering the influence of climate change [9]. The model has a resolution of 18 × 18 km2 and involves rainfall, climatic, vegetation, landscape, and soil parameters as inputs. Rainfall parameters include the rainfall depth, patterns, and spatial distribution. Climatic and vegetation parameters involve the solar radiation and the leaf area index, respectively. Landscape parameters imply the elevation, slope, and land use, while the soil parameters include soil type, texture, and field capacity [9].
The schematic overview of the SVAT model is shown in Figure 2. First, the model considers the different inputs. Then, characterizing the infiltration, percolation, interception, transpiration, and runoff is carried out. Finally, the vertical and horizontal water flow is estimated at the different time steps [9].
Projected population (POPp) and DWCR in 2050 are employed to quantify the projected TWD for the year 2050.
Current and projected TWS and TWD are used to estimate the SDBI for 2020 and 2050 [18]. This index is used for the assessment of domestic water scarcity. SDBI could be used at the regional and national levels [18]. It is estimated by the ratio between TWS and TWD:
where
- SDBIi: supply–demand balance index for the ith year
- TWSi: total water supply for the ith year in (million cubic meters/year)
- TWDi: total water demand for the ith year in (million cubic meters/year)
2.1.2. Effect of RRWH on the TWS, SDBI, and Associated Domestic Water Security
GIS is used to map the RF spatial distribution in 2020. Next, a Global Climate Model (GCM) (called European Centre Hamburg Model, Version 4) estimates the spatial RF distribution in 2050 [9]. Finally, this model is downscaled up to 18 × 18 km2 resolution using a Regional Climate Model (Mesoscale Model, Version 5). These models were developed and validated by GLOWA [9]. The spatial distribution of the current (2020) and projected (2050) rooftops is mapped using GIS.
Gould and Nissen-Petersen’s equation employs the current and projected RF and rooftops to estimate the potential RRWH [39]. This equation considers the RRWH collection efficiency and runoff rate [39]. An average runoff and collection efficiency coefficient (C) of about 0.9 is suggested by several scholars [30,40,41]:
where
- RRWHi: potential RRWH volume for the ith year in (m3/year)
- RFij: average RF for the jth rooftop in the ith year in (m/year)
- Aij: area of the jth rooftop in the ith year in (m2/year)
- n: number of rooftops
3. Presentation of the Case Study
3.1. Overview
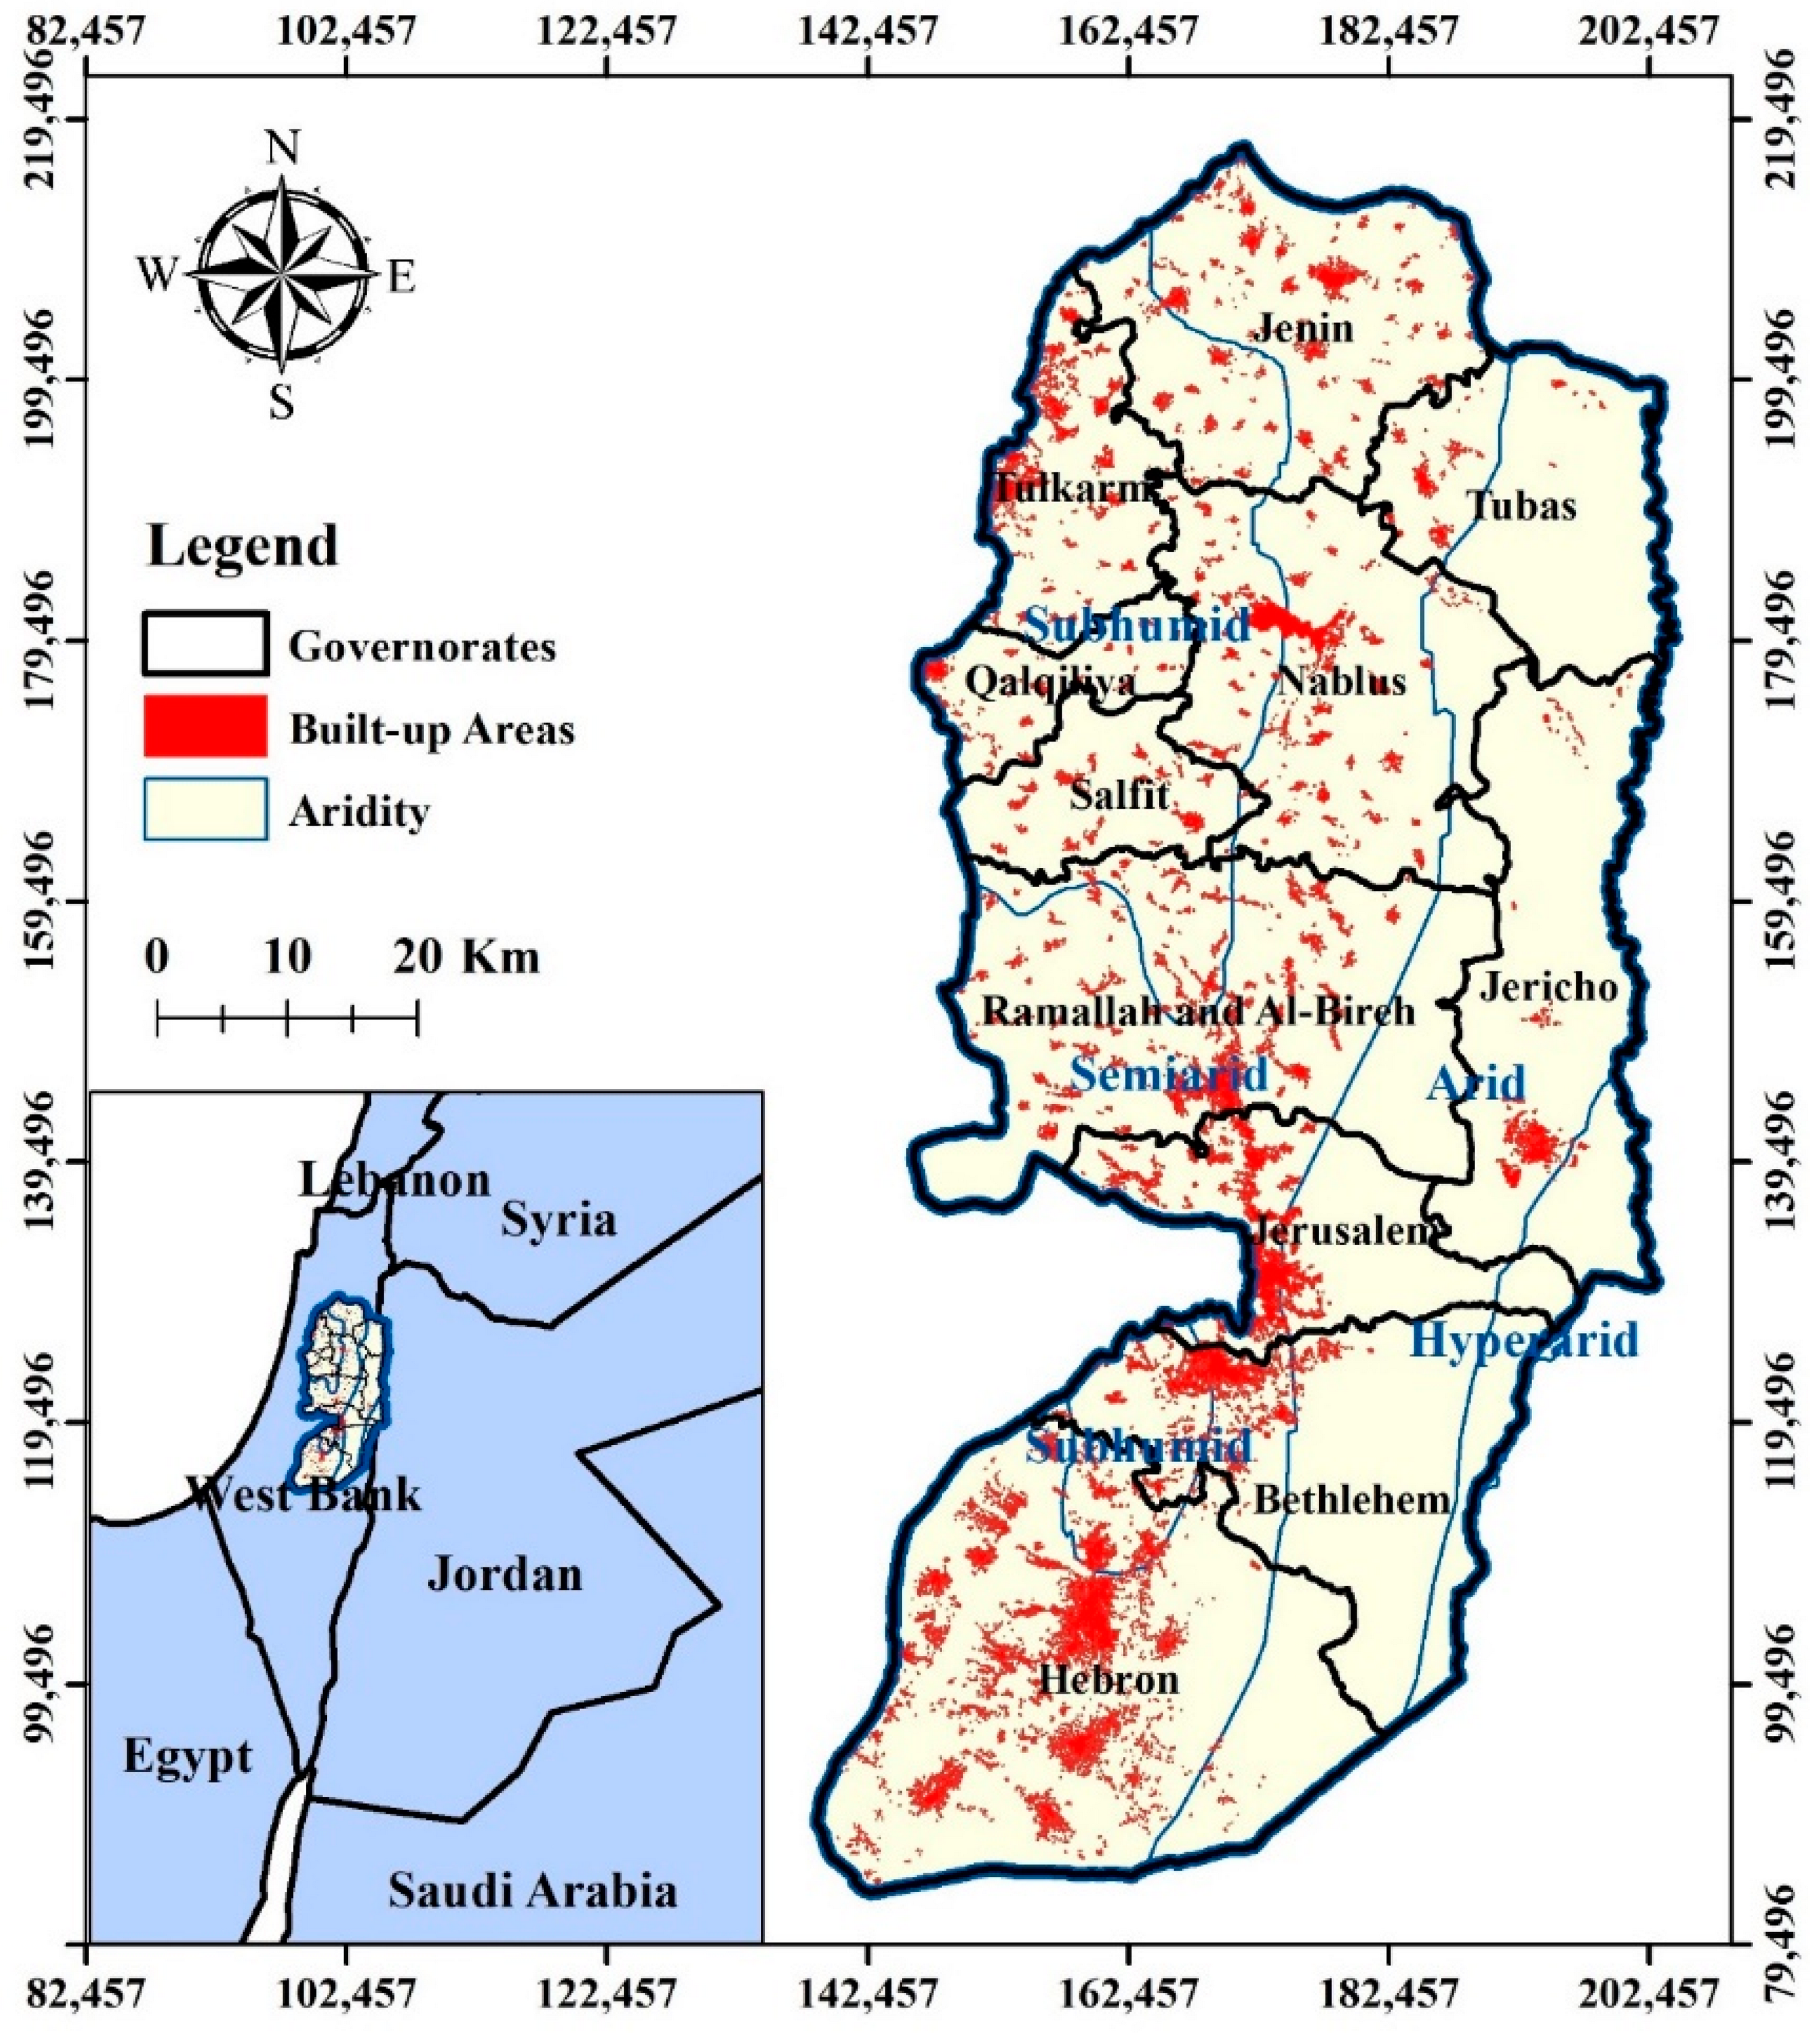
The proposed methodology is applied to the West Bank, Palestine, which is located to the west of the Dead Sea (Figure 3). It covers 11 governorates with 5860 km2 and about 3.12 million inhabitants [42]. A significant variation in RF among the governorates is indicated [7]. Since most governorates have independent water systems [43], this research is conducted at the governorate scale.
Groundwater contributes by more than 90% to freshwater use [43]. The West Bank is characterized by a Mediterranean climate with noticeable seasonal variations [44]. Approximately 80% of the West Bank ranges from hyper-arid to semi-arid, while the rest (20%) is classified as sub-humid [7]. The West Bank is internationally classified as an arid-to-semi-arid region [45]. According to the Palestinian Water Authority (PWA), the RRWH system collected about 4 million cubic meters/year in 2016 [46]. This value is strongly inferior to the capacity of the building rooftops [47].
3.2. Data Collection
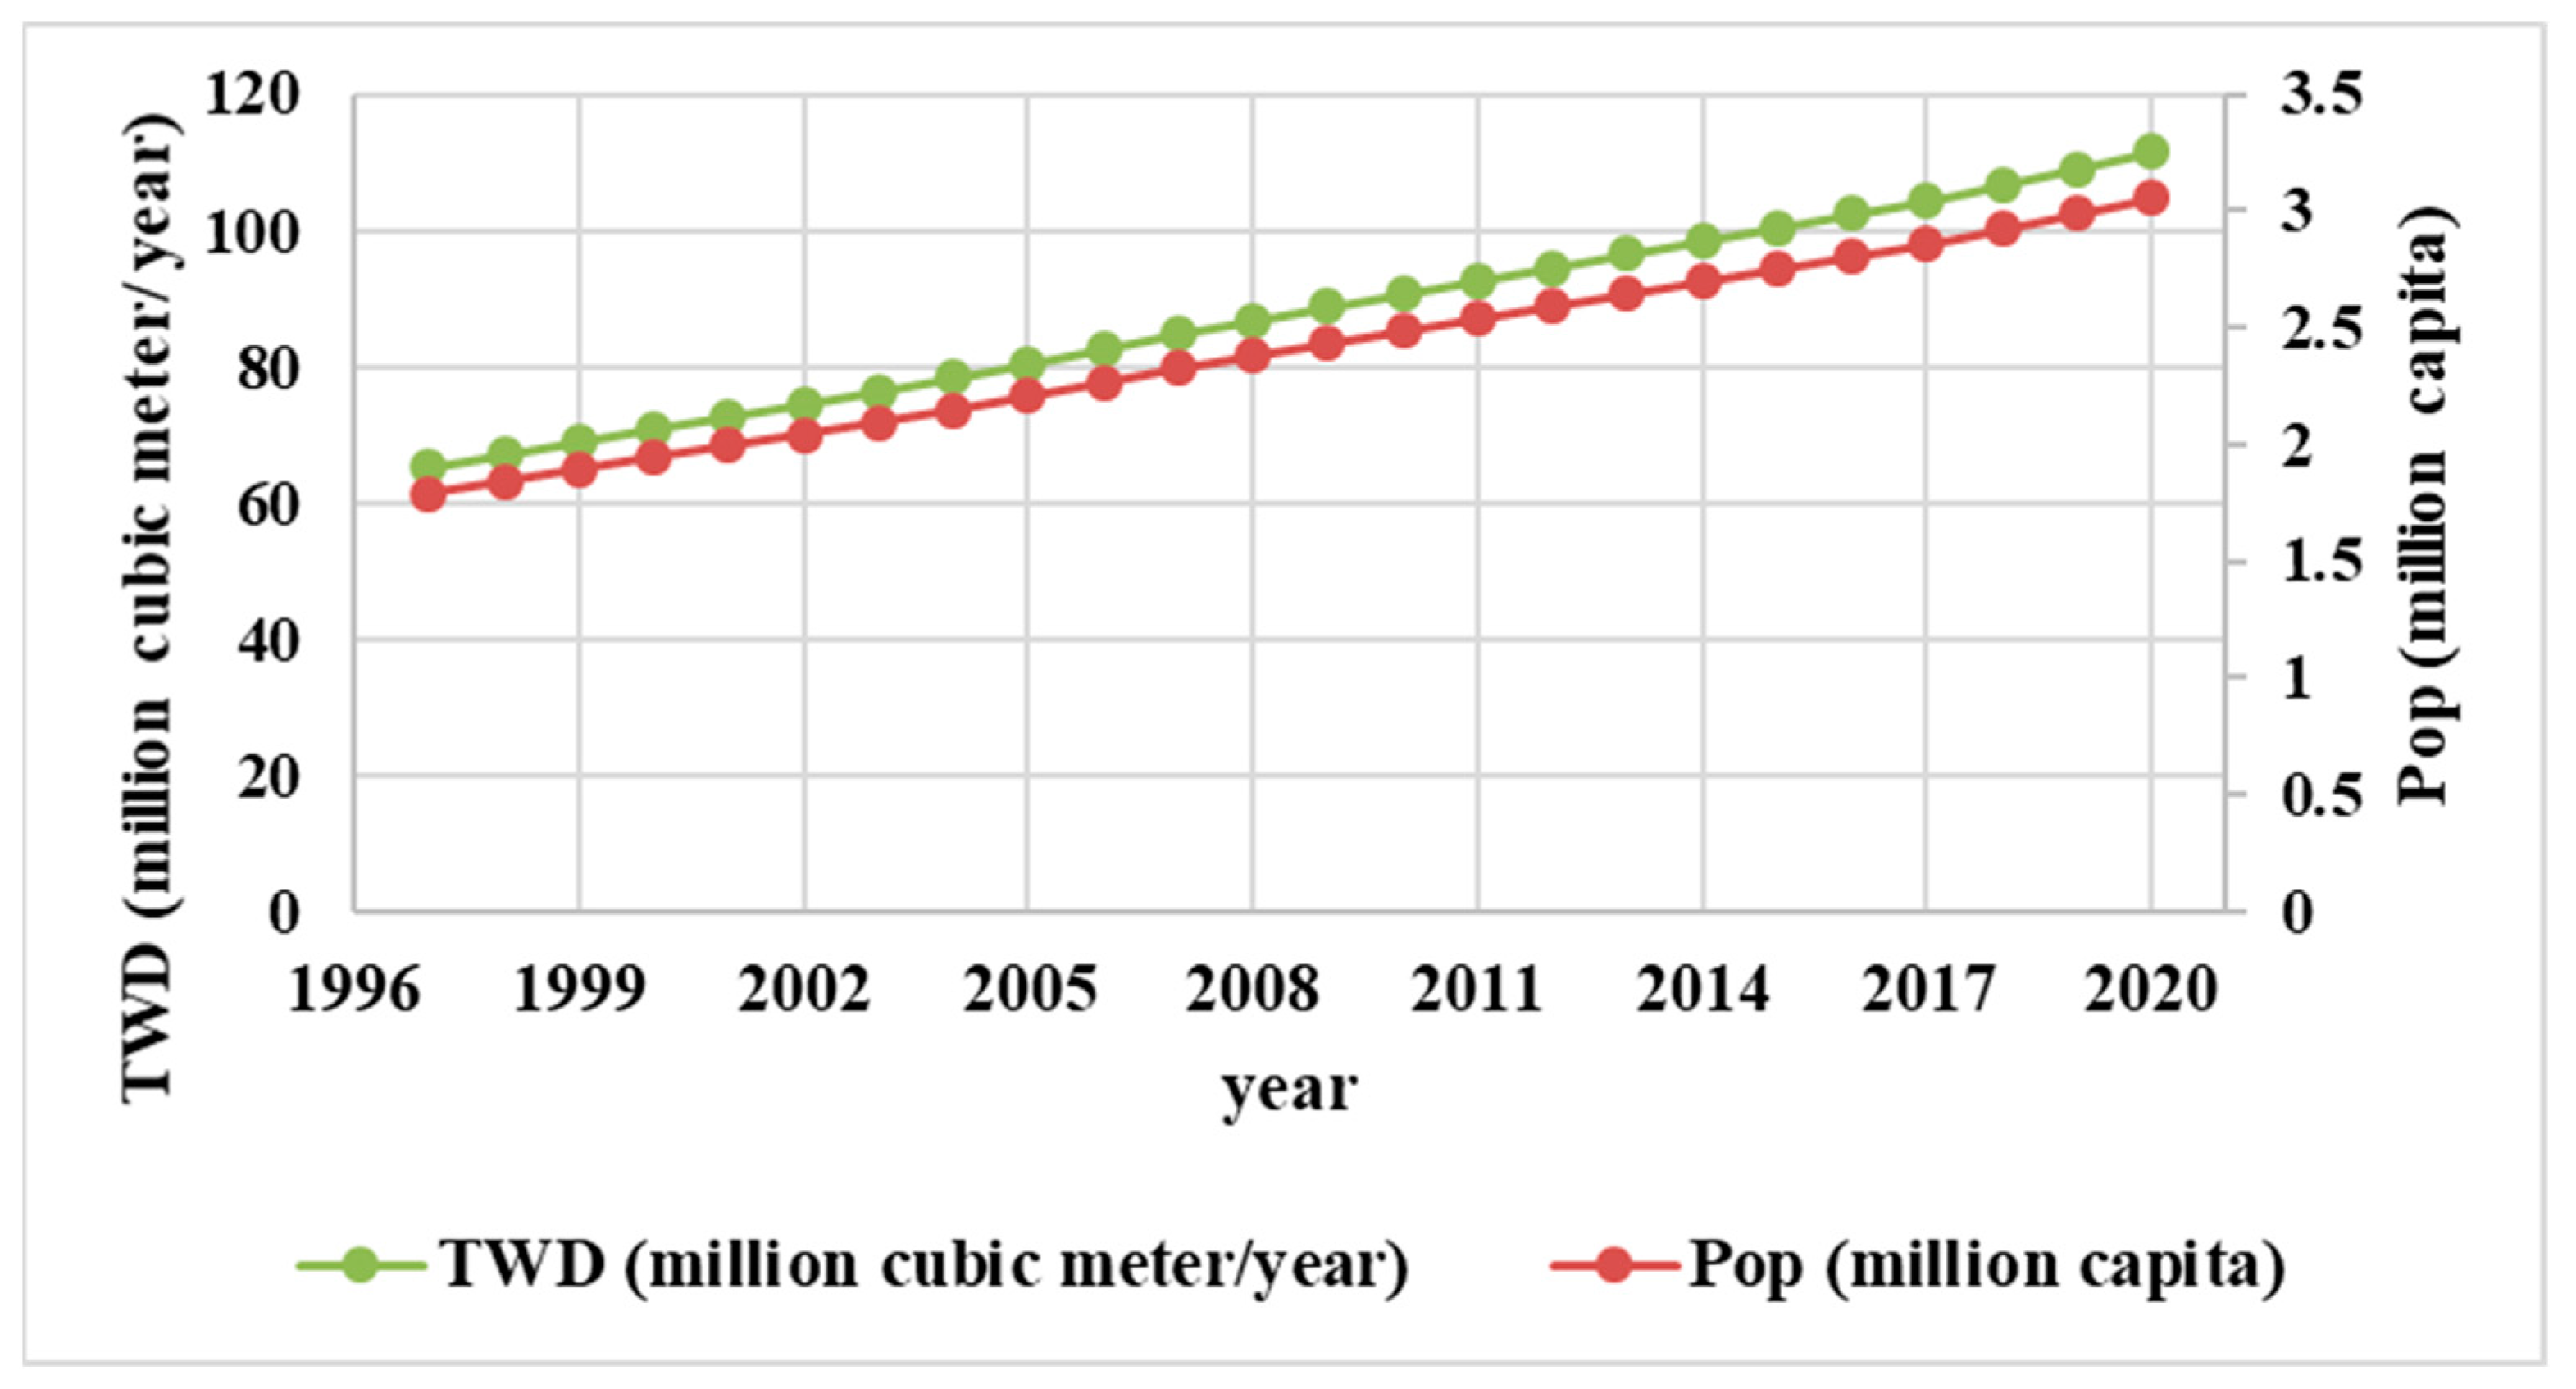
Data are collected from different sources. The building rooftops shapefile in 2020 is obtained from the Ministry of Local Government (MoLG) [47]. The historical and current population statistics are collected from the Palestinian Central Bureau of Statistics (PCBS) [42]. WHO recommended a DWCR of about 100 L per capita per day (l/c/d) [2]. Accordingly, Equation (1) is used for the estimation of historical and current TWD for the whole West Bank. Figure 4 shows the increasing trend in population and TWD. Population increases from 1.78 million capita to 3.05 million capita, and TWD increases from 65.2 million cubic meters/year to 111.4 million cubic meters/year between 1997 and 2020.
POPp (in 2050) is estimated using a dynamic population projection model (UNFPA) [48] that considers several determinants such as age, sex, fertility, international migration trends, and mortality rates. The projected rooftops area in 2050 is estimated, assuming a linear relation with the population growth. The authors are aware of the limitation of this assumption, which could be improved in the future.
Equation (1) is used for the determination of the TWD in 2020 and 2050 on a governorate scale. Table 2 summarizes the results for the 11 West Bank governorates. TWD in 2020 varies between 1.9 million cubic meters/year (Jericho) and 27.8 million cubic meters/year (Hebron), with an average value of 9.9 million cubic meters/year. In 2050, the TWD is expected to vary between 3.2 million cubic meters/year (Jericho) and 50.9 million cubic meters/year (Hebron), with an average value of 15.7 million cubic meters/year, which is about 58% higher than that in 2020.
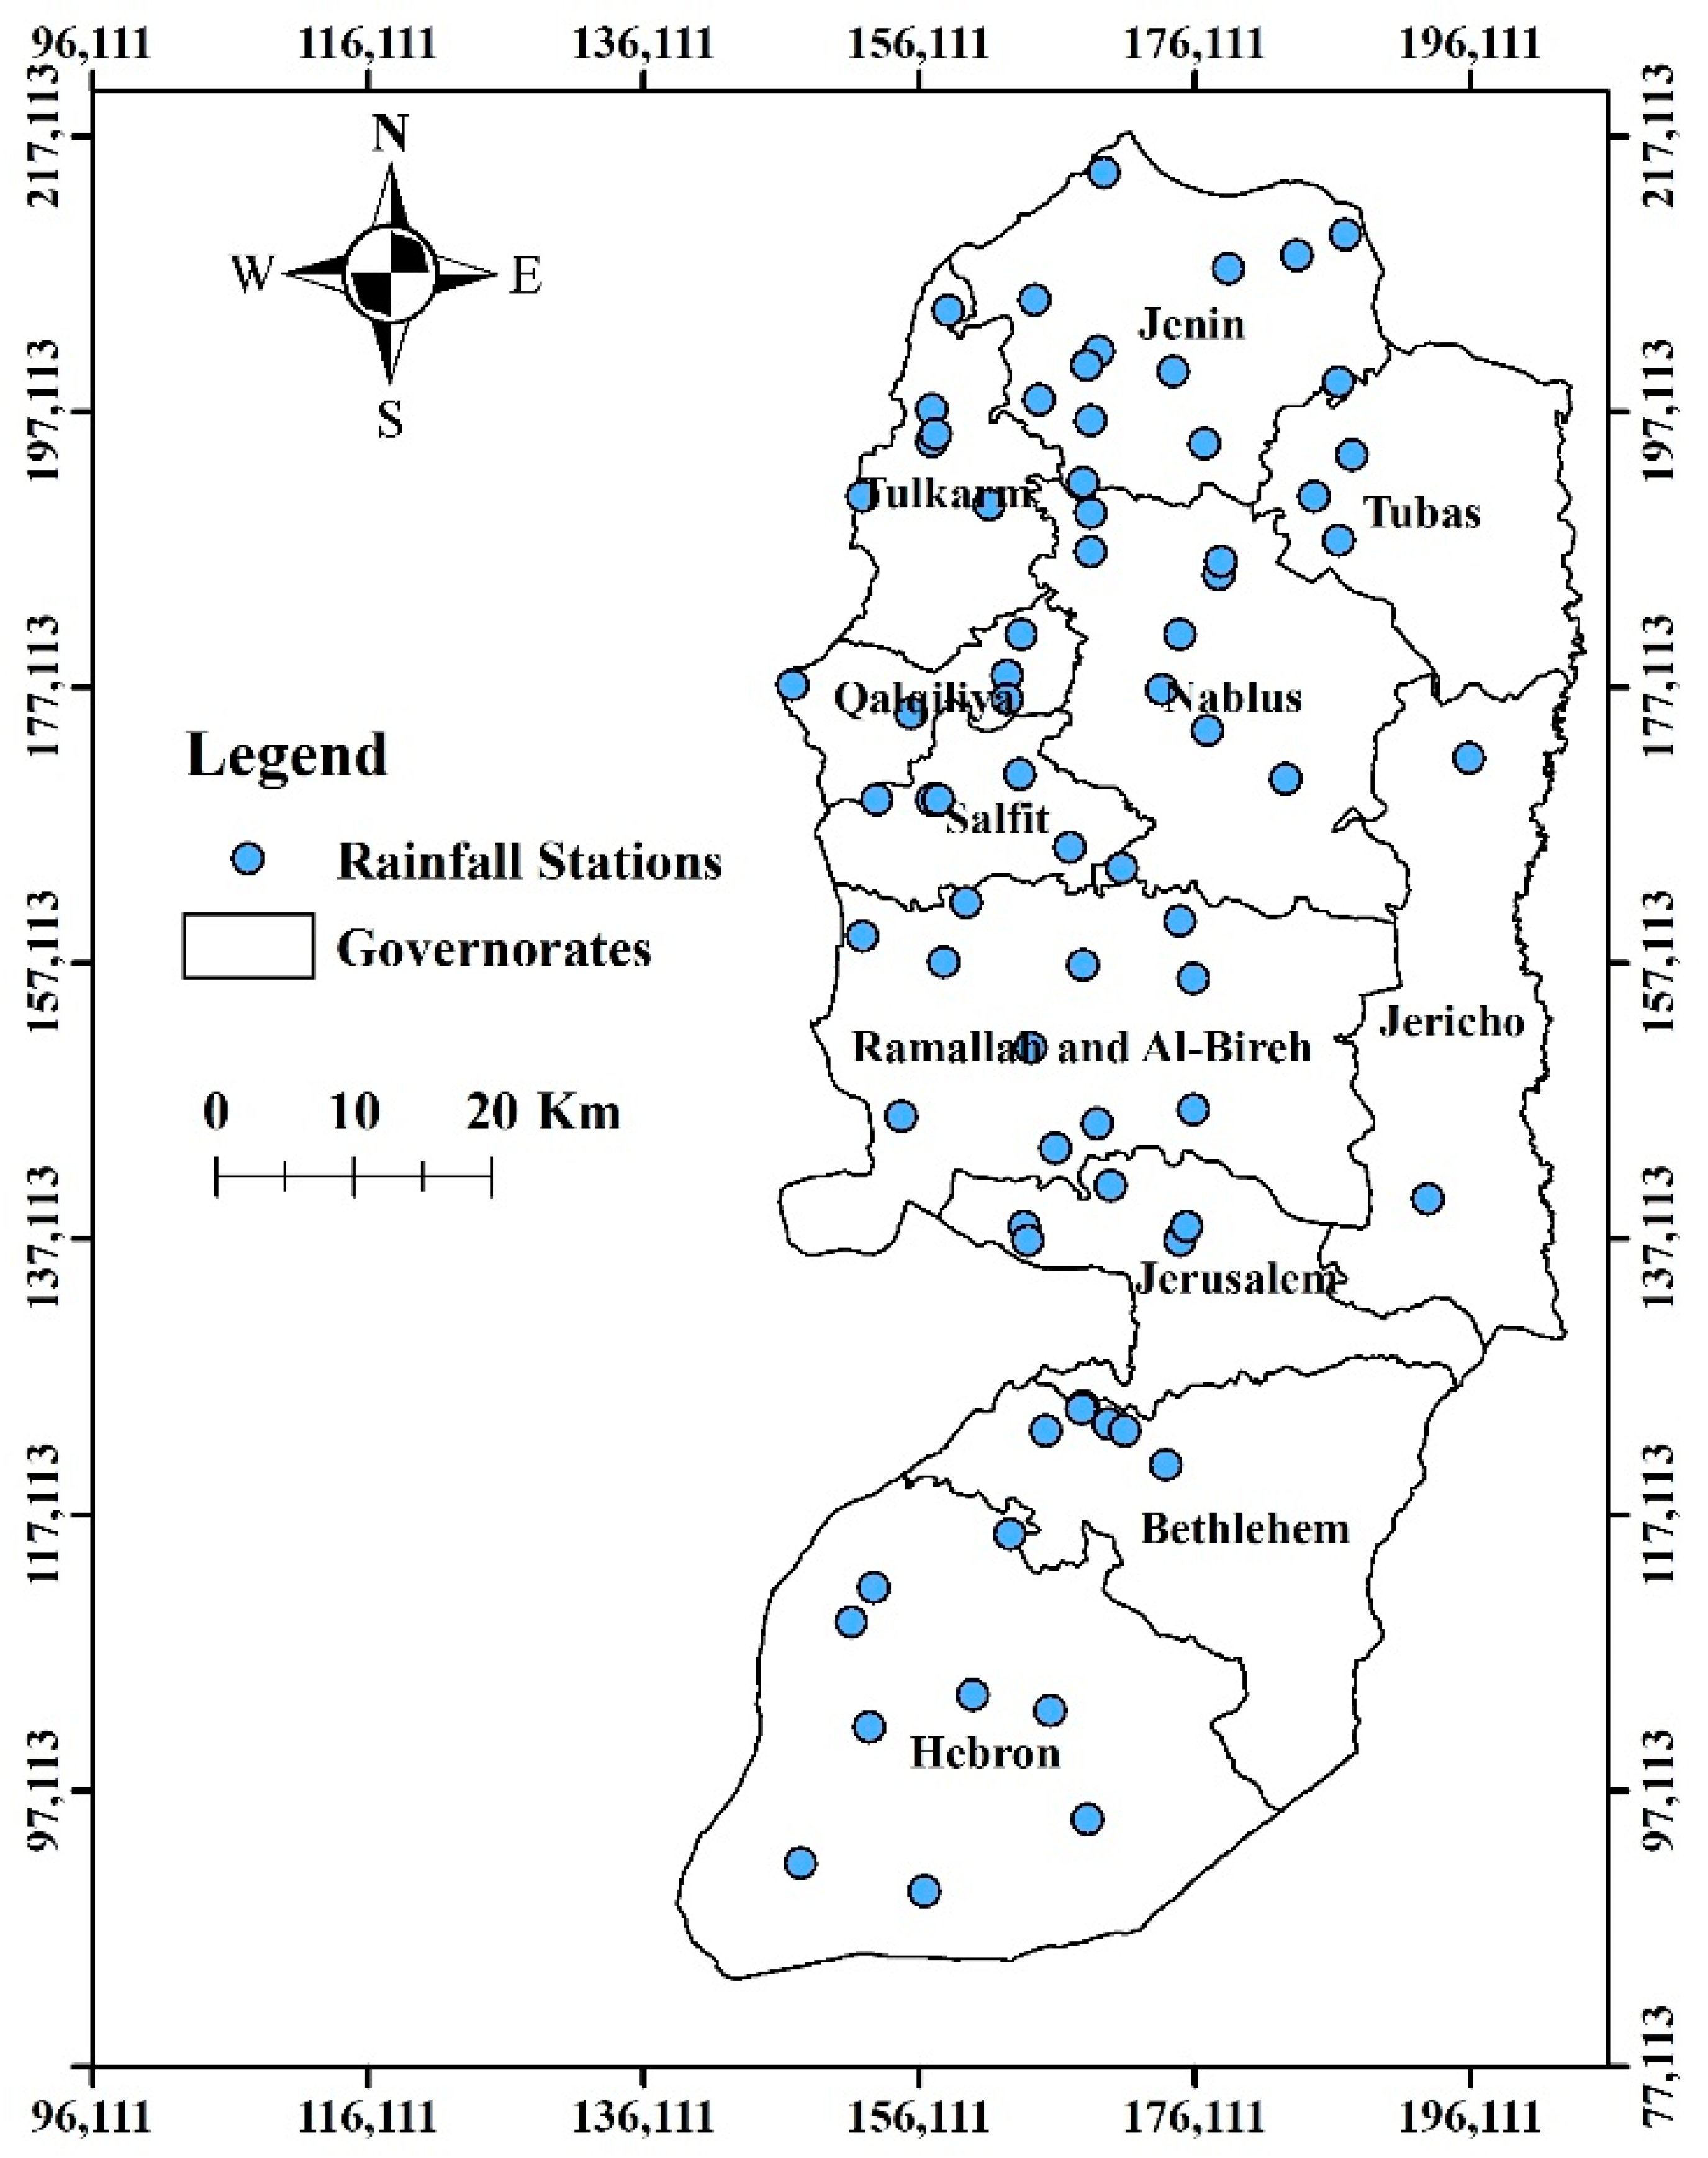
Current RF for the West Bank is obtained from the Palestinian Metrological Authority (PMA) [49]. PMA has 75 spatially distributed rainfall stations in the West Bank governorates (See Figure 5). Table 3 summarizes the number of rainfall satiations per km2 (for each governorate). It is noticed that the station resolution (density) ranges from 0.1 (in Hebron and Jerusalem) to 0.8 (in Salfit) station per km2.
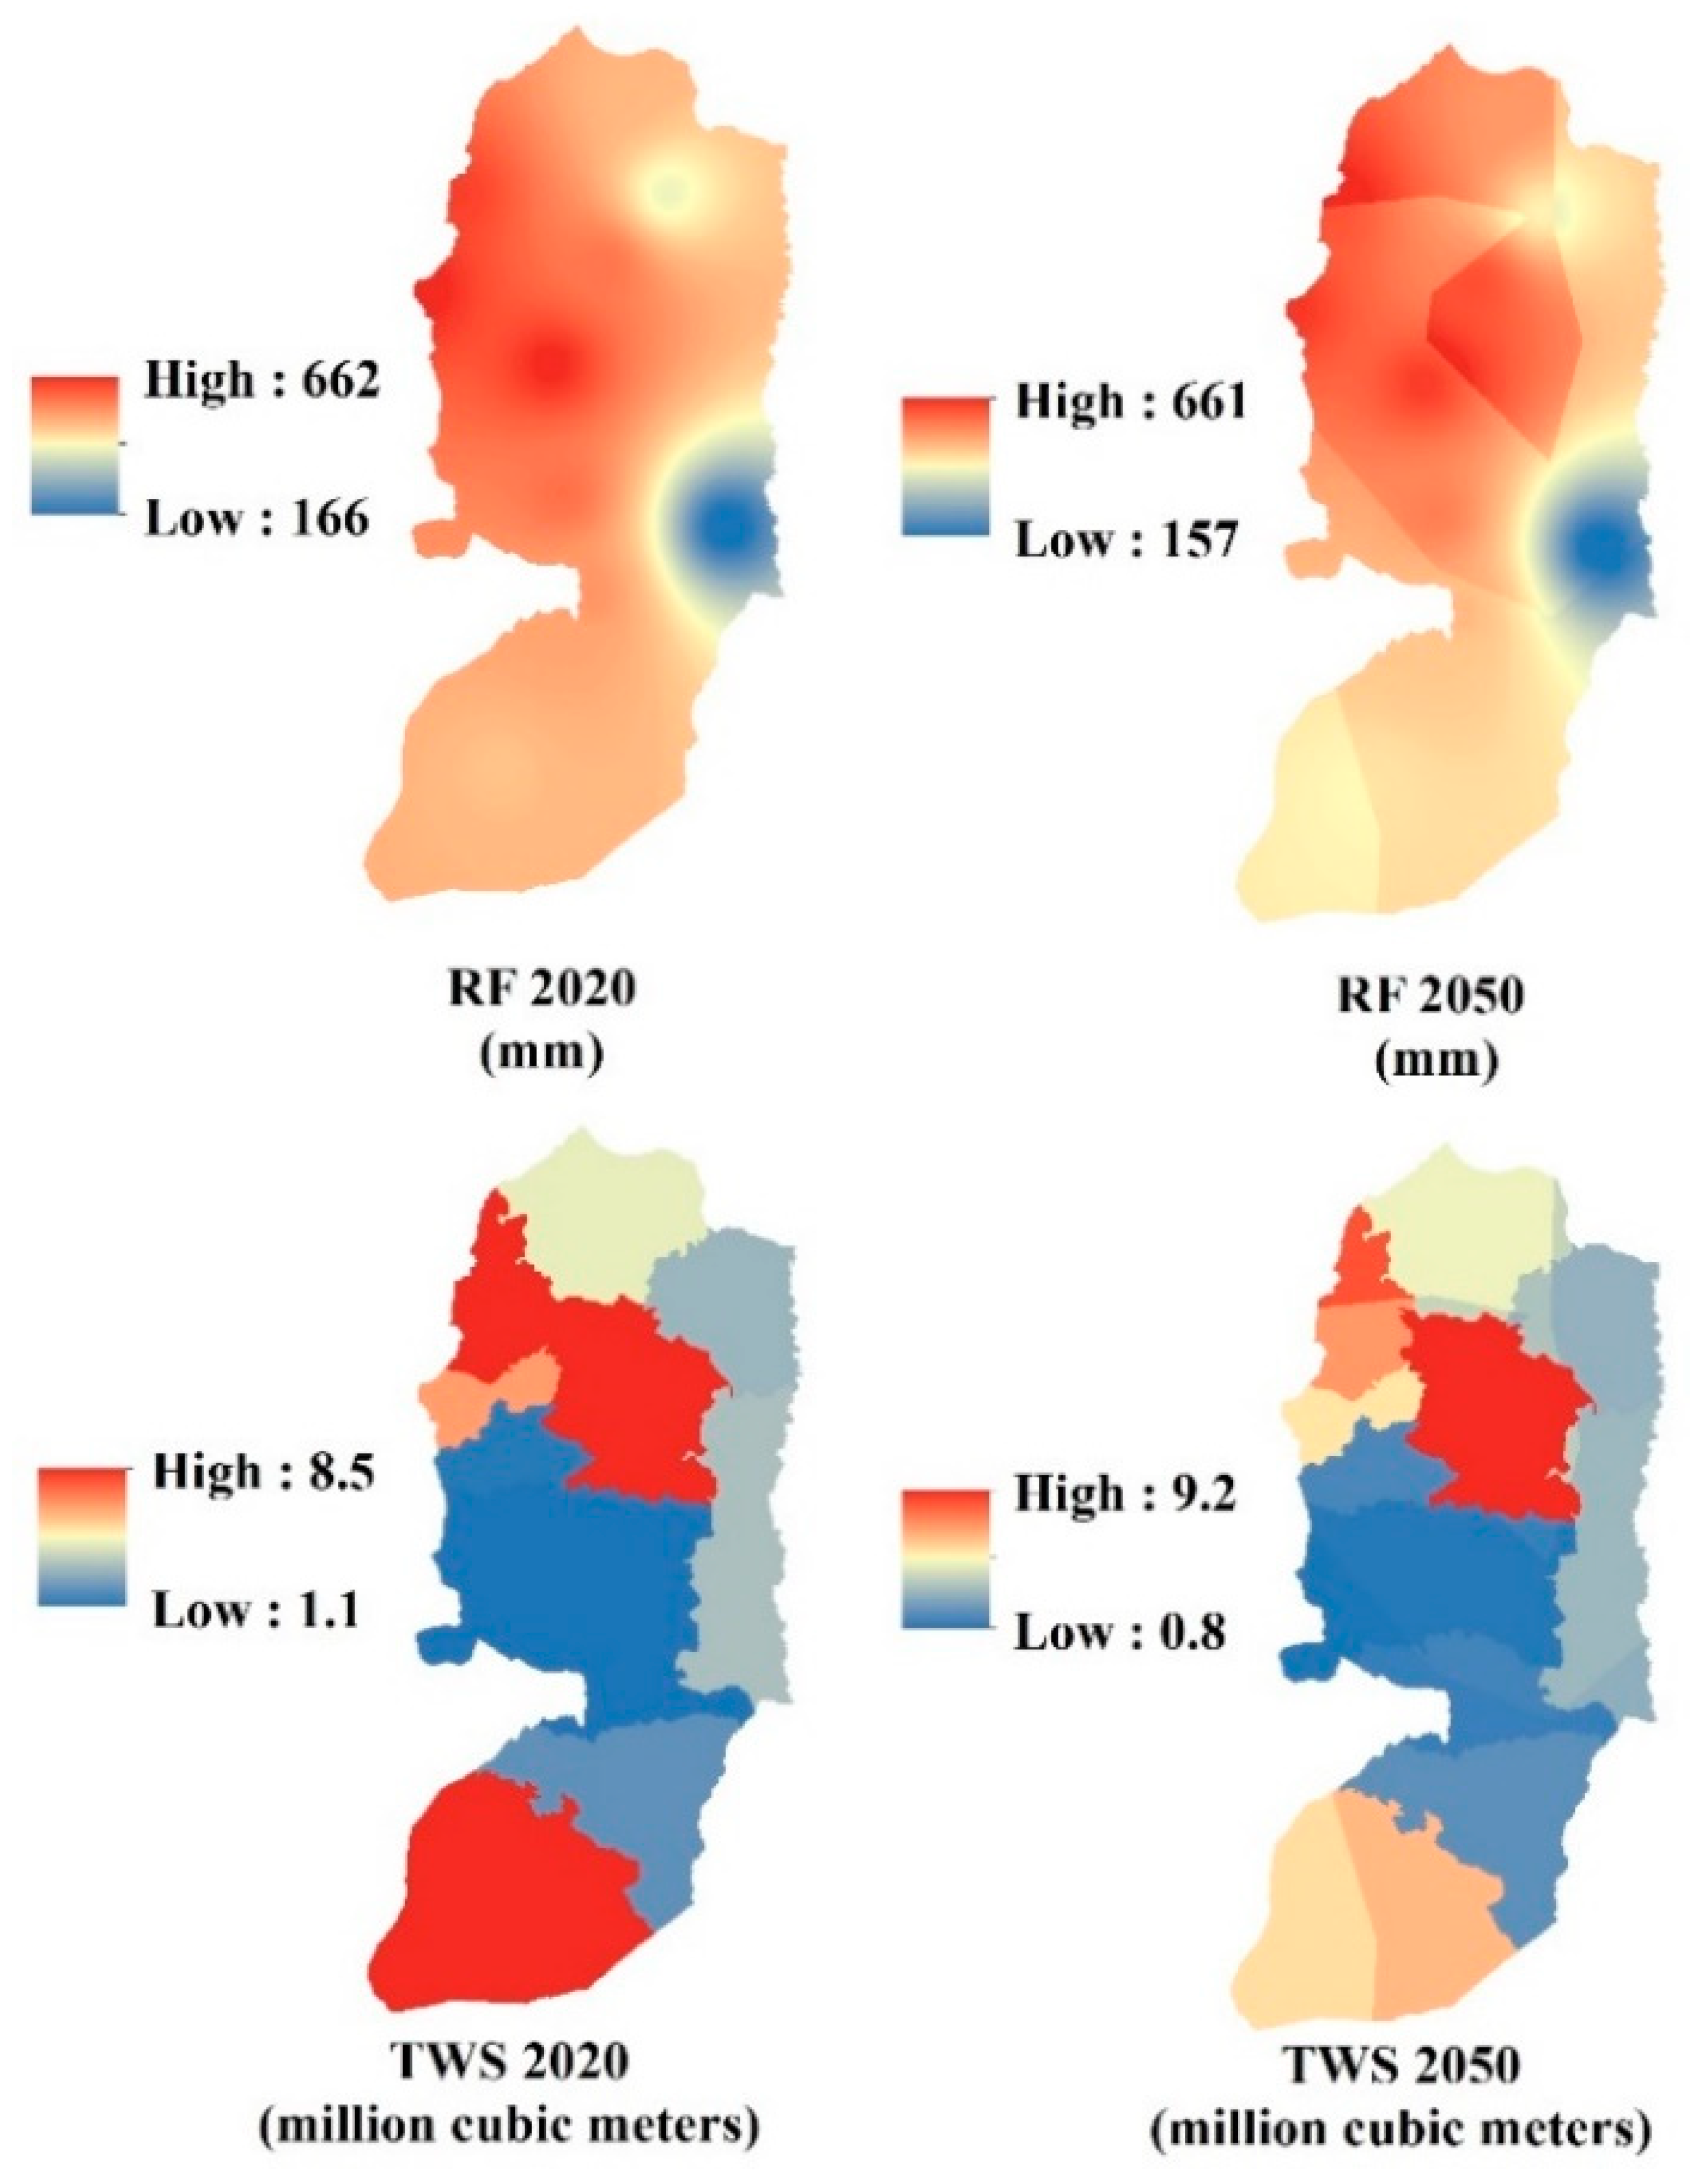
Figure 6 shows a GIS-based spatial interpolation for average annual RF from the spatially distributed rainfall stations. This interpolation is realized at a scale of 100 × 100 m2. It is indicated that the average annual RF (in 2020) ranges from 166 mm/year (in the eastern part) to 662 mm/year (in the middle part), with a mean value of 520 mm/year. Table 4 provides the average annual RF for the different West Bank governorates in 2020. However, the used rainfall data could form a source of uncertainty in the rainfall-dependent models (e.g., climate change models for rainfall and water availability) [50,51]. Scholars confirm the sensitivity of rainfall-dependent models to rainfall uncertainty [50,51]. The highest sensitivity occurs in the rainy periods (e.g., October to March). In dry periods with few rainfall amounts, the rainfall-dependent models are less sensitive to rainfall uncertainties [50,51]. Such uncertainty could be addressed by performing a cross-validation for the rainfall records using different approaches [50,51].
By characterizing the probable sources of water in the West Bank, it is found that water desalination and surface water have no contribution to the TWS [10]. Groundwater (through the pumping wells and the springs) is the only adopted source of water to supply citizens for their needs. Therefore, TWS is quantified through the estimation of the supplied (by services providers) groundwater volumes in the study area. Such volumes are gained from the PCBS database [10]. The variation in TWS in the West Bank governorates in 2020 is illustrated in Table 5. The lowest TWS is recorded in Ramallah & Al-Bireh with about 1.1 million cubic meters/year, while the highest TWS is in Nablus (8.5 million cubic meters/year).
The rate of change in TWS and RF between 2020 and 2050 is estimated using the downscaled SVAT and GCM models developed by GLOWA [9]. The GIS-based Raster Calculator is then used to estimate the values of TWS and RF in 2050. However, SVAT, GCM, and the downscale models involve uncertainties [9,52]. To mitigate this shortcoming, available data at the highest spatial and temporal resolution were used [9,52]. Calibration of the SVAT model was carried out using historical and current TWS records (in 2015 and 2020, respectively) [10]. Due to limited data availability, this calibration is conducted for the Jenin governorate. Actual TWS in 2015 (3.63 million cubic meters/year) is used to predict the TWS in 2020 (using SVAT) for the Jenin governorate. It is found that the predicted TWS in 2020 equals about 3.68 million cubic meters/year. Such prediction is significantly close to the actual TWS in 2020, which was equal to 3.70 million cubic meters/year (with a relative error of about 0.005) [10]. This slight relative error provides a considerable level of confidence in the used model.
Figure 6 illustrates the distribution of RF and TWS in the West Bank. It indicates that all the governorates, except Jenin and Nablus, will experience in 2050 a decrease in both RF and TWS compared to 2020. This decrease could reach 15% and 26% for RF and TWS, respectively. The most significant change is expected to be on the North of the West Bank.
4. Results and Discussion
4.1. Domestic Water Scarcity and the Potential RRWH in 2020
4.1.1. Assessment of Domestic Water Scarcity
This section presents the domestic water scarcity in 2020, considering the conventional water supply (with no RRWH). Table 6 summarizes the SDBI values and the associated domestic water scarcity levels in 2020. The status “no water shortage” is observed in Jericho, Qalqilya, and Tubas, with an SDBI of about 1.5, 1.2, and 1.1, respectively. A low water shortage was observed in Tulkarm, while the rest of the West Bank governorates experienced an extreme-to-acute water shortage.
Results of the current water scarcity in the West Bank are compatible with the results of other scholars [7,53]. All governorates (except for Tubas, Ramallah & Al-Bireh, and Jerusalem) have water scarcity/poverty categories, which are similar to the findings of [7]. Compared to [53], compatible water scarcity/security categories exist in all governorates except Tulkarm and Jericho. The gap in characterizing the water status in some governorates could be attributed to the approaches and indicators adopted by scholars. For example, [7] adopted the weighted arithmetic average method (WAAM) by considering the water availability, accessibility, capacity, use, and environment for assessing the water status, while [53] used the same method but in considering other indicators such as water resources, water services, and water governance. Adopting WAAM with flexible input indicators to characterize the water scarcity/poverty was discussed by [54,55,56], who confirmed that the change in the input indicators could affect the estimation of the water poverty/scarcity status [54,55,56].
4.1.2. RRWH for the Mitigation of Existing Domestic Water Scarcity
This section discusses the use of RRWH as an efficient option for addressing the domestic water scarcity challenge in the West Bank. In 2020, the potential RRWH in the West Bank can provide approximately 40 million cubic meters/year, which accounts for 95% of the water supply (42 million cubic meters/year).
Table 7 summarizes the impact of adopting RRWH on the increase in TWS. Jericho has the lowest increase (11%), followed by Tubas, Qalqilya, Tulkarm, and Nablus. The highest increase (577%) is observed in Ramallah & Al-Bireh. These results indicate the importance of RRWH in addressing the water scarcity challenges.
Considering the political and technical water supply challenges in the West Bank [43], RRWH presents a valuable alternative to address these challenges. Table 8 shows that RRWH can cover about 54% of the TWD in Salfit and between 40 and 48% in the Nablus, Bethlehem, Qalqilya, Ramallah & Al-Bireh, and Tulkarm governorates.
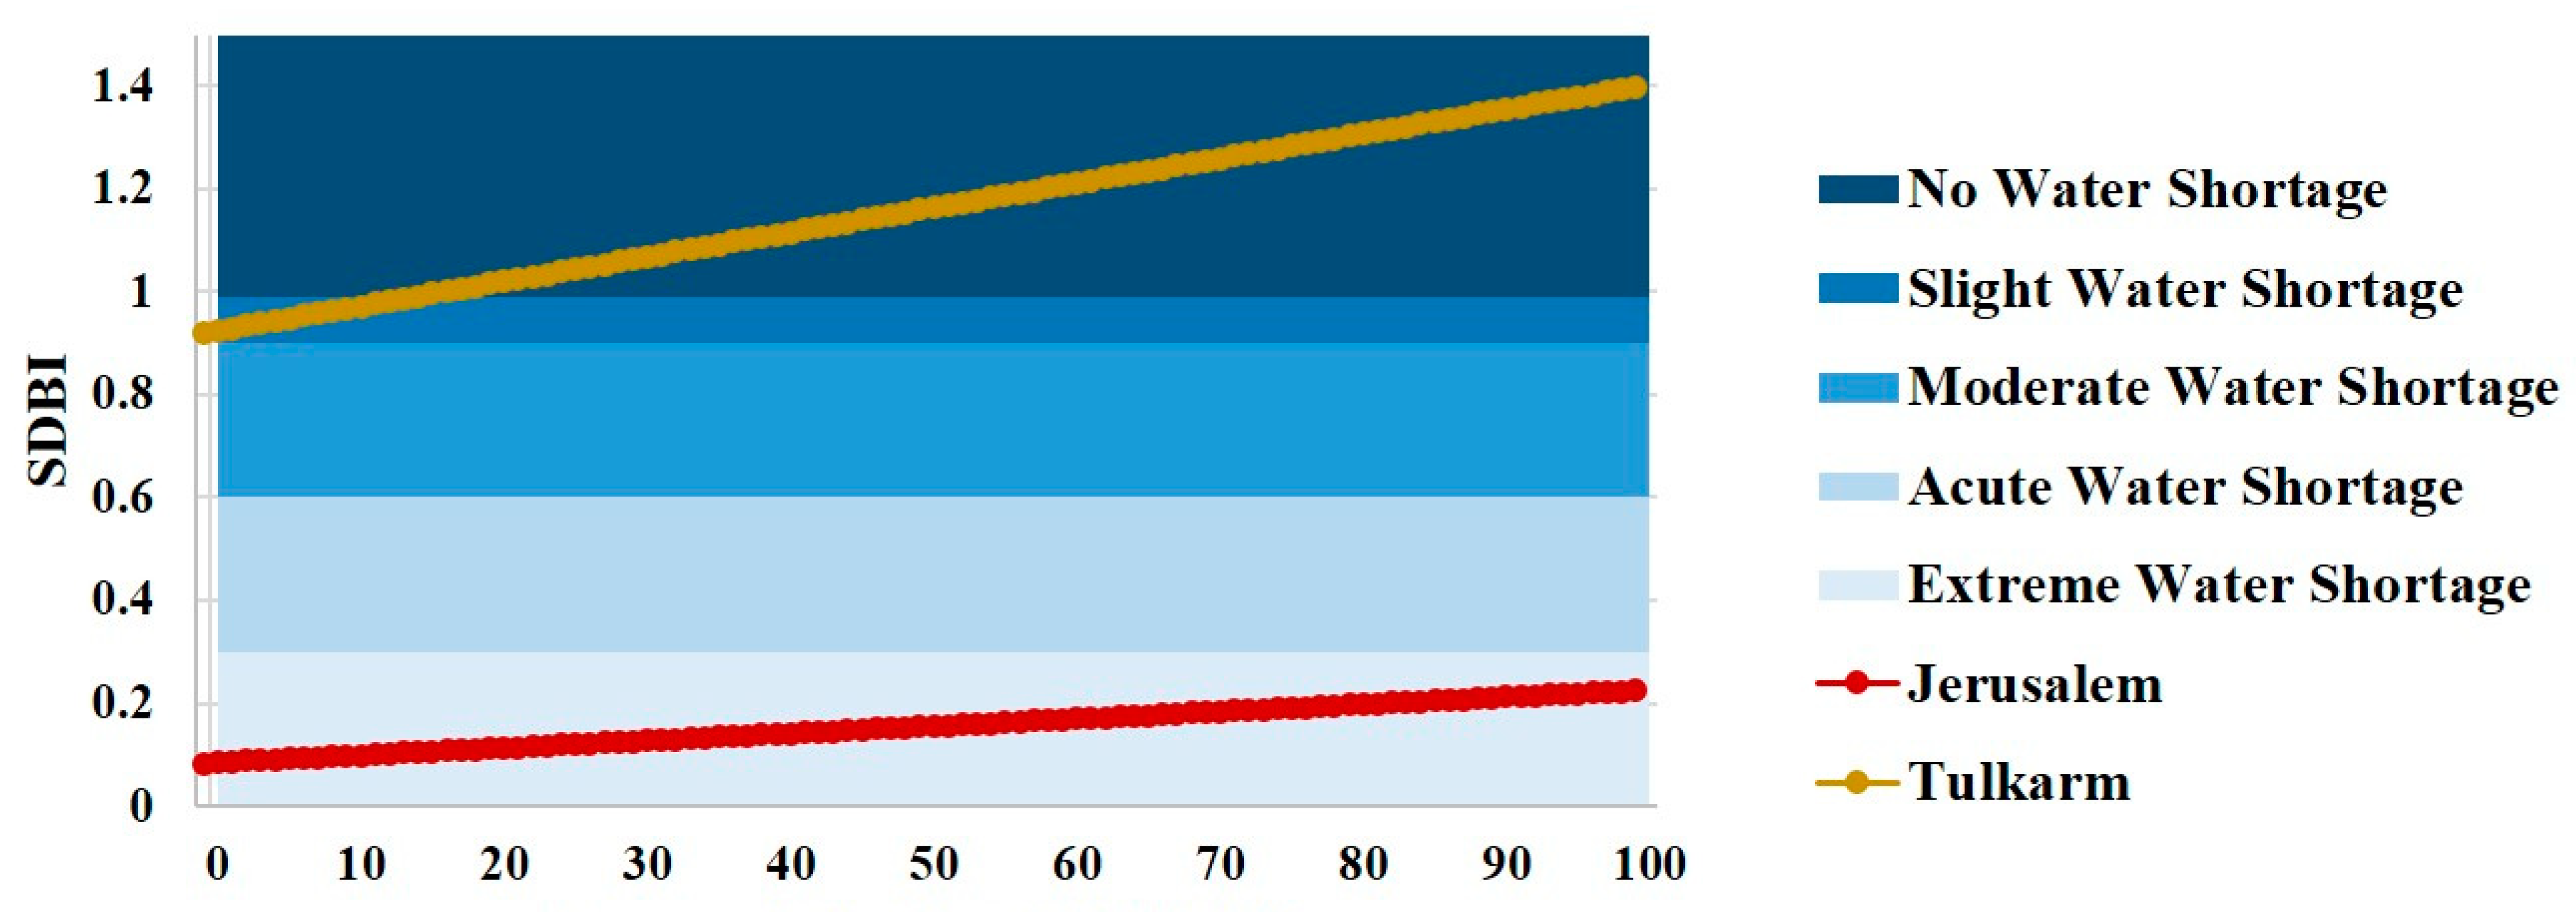
Figure 7 shows the impact of the RRWH on the domestic water-scarcity level in Tulkarm and Jerusalem in 2020. The highest effect is observed in Tulkarm. Exploiting about 16% of the roofs for RRWH could drop the scarcity level to “no water shortage”. The rest of the roof areas could support other purposes such as agricultural and industrial uses. The extra RRWH can also support water shortages in other governorates.
Figure 7 shows that the RRWH has low efficiency in addressing the domestic water scarcity in Jerusalem: Jerusalem faces an “extreme water shortage” after fully adopting RRWH in 2020. This low performance of the RRWH is due to the low ratio of rooftops to the population, which is about 10.7 m2/citizen, to be compared to values in the rest of the West Bank governorates, which varies between 26.5 and 42.4 m2/citizen.
Table 9 summarizes the impact of using four rooftops rates in the RRWH (25%, 50%, 75%, and 100%) on domestic water scarcity. It shows that full or partial use of the RRWH will cover the TWS in Tubas, Qalqilya, and Jericho. However, the status of “No shortage” in Slafit requires a full adoption of the RRWH. The latter is not sufficient to afford the TWS in Ramallah & Al-Bireh, and Hebron. This result argues for a national water strategy that shares the RRWH capacities.
Results confirm the findings of [7,40] concerning the potential of RRWH in the different West Bank governorates. However, [7] focused only on the optimal allocation of the RRWH in the West Bank, while [40] focused on estimating potential RRWH volume. Other scholars treated separately the allocation and the estimation of potential RRWH [57,58,59]. This research contributed to the analysis of the capacity of the potential RRWH to cover water scarcity by quantifying the influence of RRWH on the current and future domestic water scarcity.
4.1.3. RRWH Efficiency at Different Urban Scales
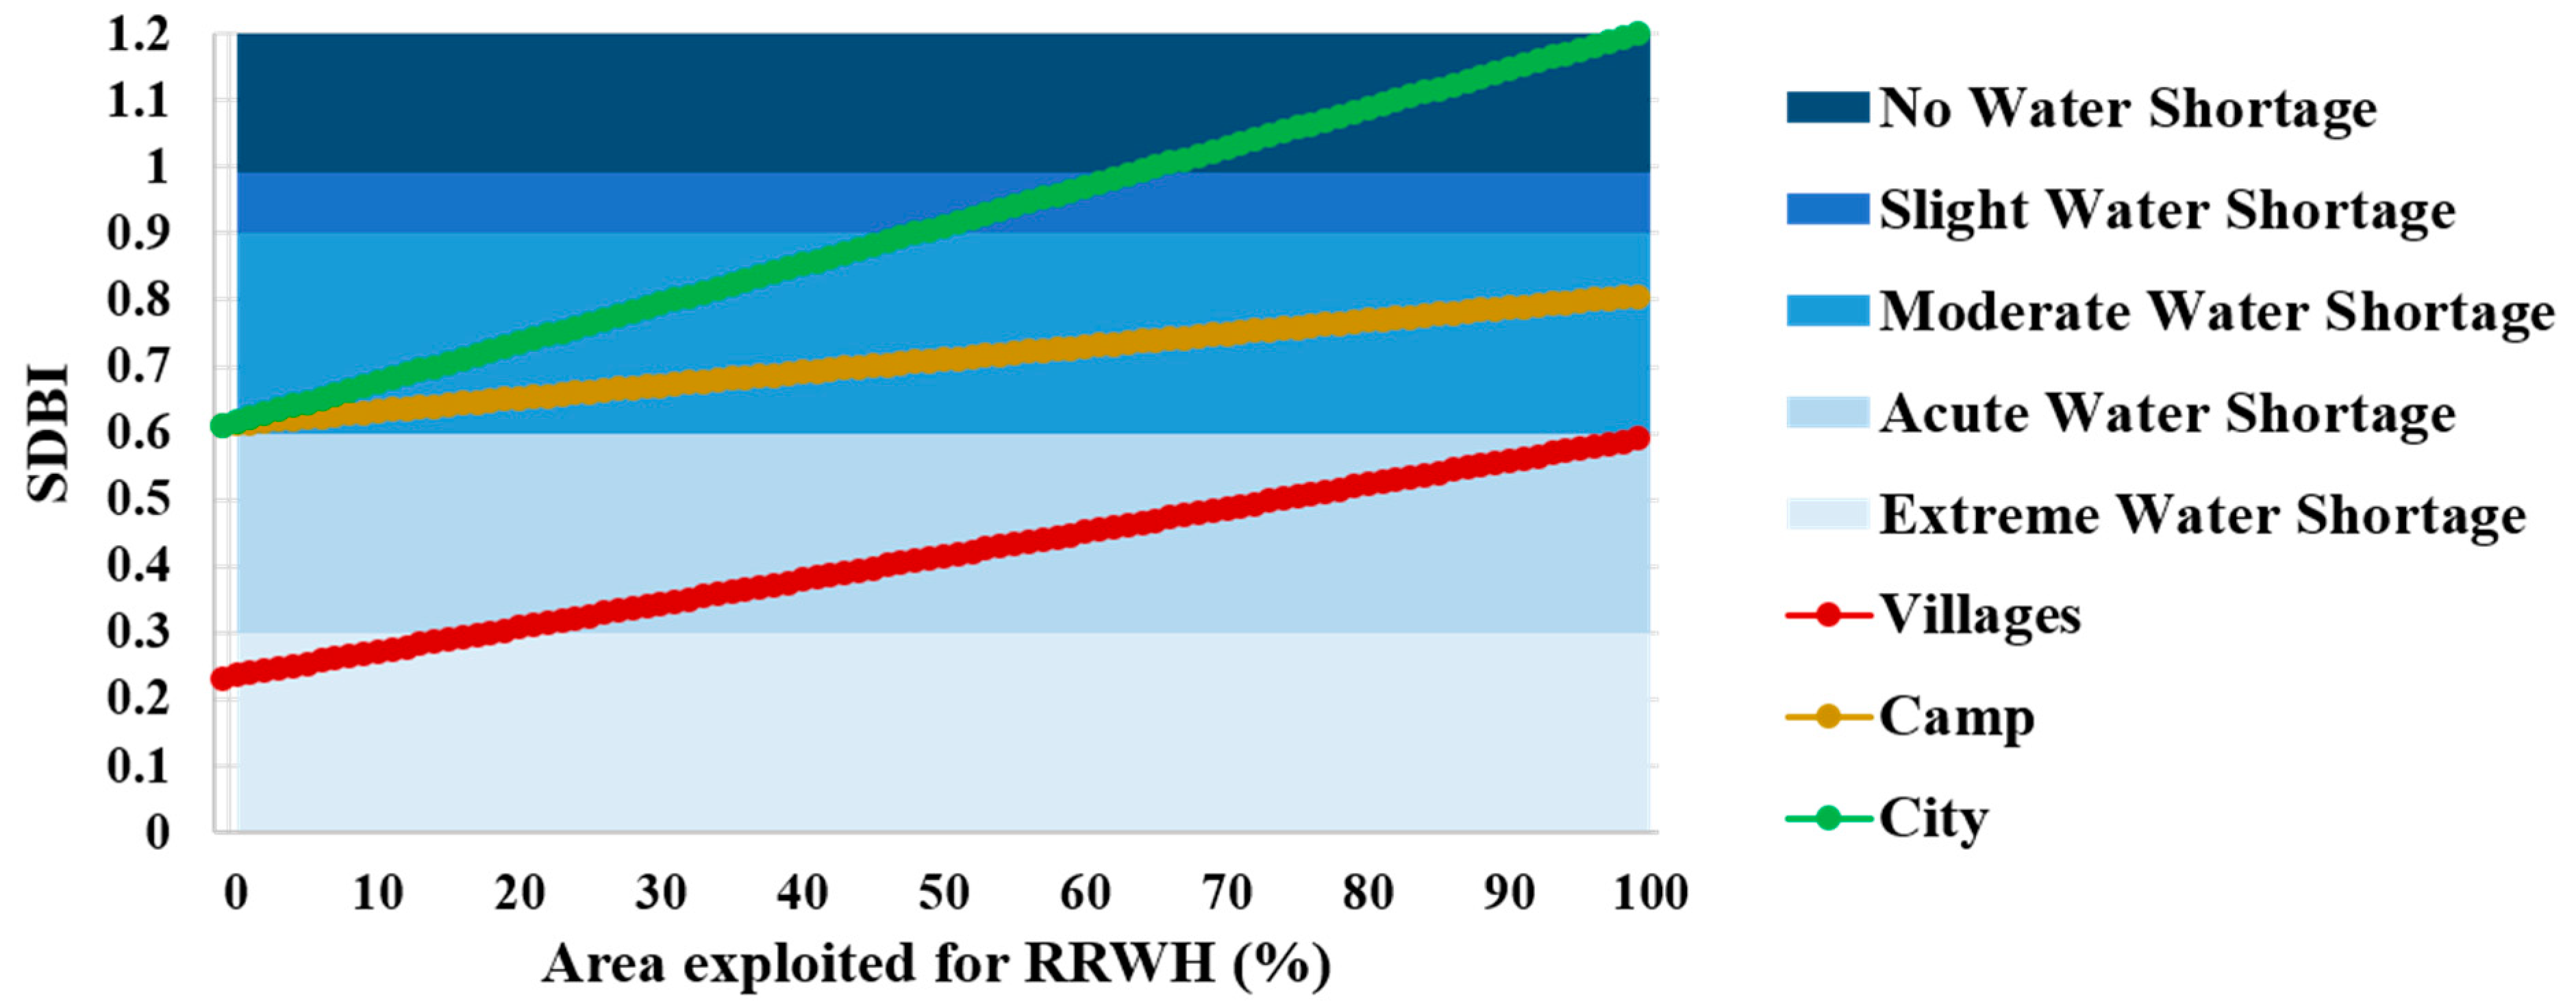
This section discusses the RRWH efficiency at different urban scales (city, village, and camp), emphasizing the Jenin governorate in 2020. Figure 8 shows that the full adoption of RRWH in Jenin can change the water scarcity status from “acute water shortage” to “no water shortage”. Furthermore, this full adoption can change the water scarcity status in (i) Jenin Camp from “acute water shortage” to “moderate water shortage” and (ii) in villages from “extreme water shortage” to “acute water shortage”. These results indicate that the lowest RRWH efficiency concerns the Jenin camp. The variation of the efficiency of the potential RRWH is related to the ratio of the rooftops to the population. This ratio equals 16 m2/citizen in the camp compared to 29 m2/citizen and 48 m2/citizen in the villages and the city, respectively.
Exploiting 65% of the rooftops is enough to cover the TWD in Jenin city. Therefore, full roof exploitation in this city could help mitigate or even eliminate the domestic water scarcity in the camp and villages.
4.2. Projected Capacity of RRWH to Address the Domestic Water Scarcity in 2050
This section discusses the capacity of the adoption of RRWH to address the projected domestic water scarcity in 2050. The projected RRWH is expected to provide about 59 million cubic meters/year in 2050, which is 1.5 times the projected municipal water supply. Table 10 summarizes the influence of the RRWH on both TWS and TWD. Full adoption of the RRWH is expected to increase the values of TWS from 20% (in Jericho) to 1038% (in Ramallah & Al-Bireh). This full adoption can satisfy half of the needed TWD in Salfit, and between 13 and 48% in other West Bank governorates.
Table 11 summarizes the impact of projected RRWH on water scarcity in the West Bank in 2050. Tulkarm and Qalqilya could reach “no water shortage” status. A “slight water shortage” could be reached in Jericho and Nablus by exploiting 50% and 100% of the roofs, respectively. Salfit, Tubas, and Jenin are expected to reach a moderate water-shortage status by exploiting 50%, 50%, and 100% of their roofs. In other governorates, full adoption of the RRWH will not be enough to cover the domestic water needs. A full RRWH adoption efficiently addresses the domestic water scarcity challenges in Ramallah & Al-Bireh, Bethlehem, and Hebron. For these governorates, the domestic water scarcity will be improved from “extreme water shortage” to “acute water shortage”. The best improvement from “extreme water shortage” to “moderate water shortage” is expected in Jenin. Likewise, a reasonable improvement from “moderate water shortage” to “no water shortage” is expected in Tulkarm and Qalqilya.
5. Conclusions
This paper presented an analysis of the capacity of rainwater harvesting to address the domestic water scarcity in arid and semi-arid areas. First, the supply–demand balance index (SDBI) was used to assess the current and future domestic water scarcity. Second, the rainwater harvesting capacity was determined by the rooftops surface, the local level’s rainfall, and its future variation. Finally, the proposed methodology was applied to the West Bank to (i) assess the domestic water scarcity at the governorate level and (ii) investigate the potential of rooftops rainwater harvesting (RRWH) in addressing the domestic water scarcity challenges.
Results show that the RRWH can address the current domestic water scarcity in the majority of the West Bank governorates. A national policy to share the potential RRWH capacity will increase the efficiency of the RRWH by transferring the excess water harvesting from some governorates to other governorates subjected to high water scarcity. An estimation of the potential RRWH capacity in 2050 shows that it could cover about 1.5 times the conventional water supply.
Authors are aware of the following limitations of this research, which are related to a lack of data: (i) lack of accurate rooftops projection model in 2050, (ii) absence of detailed information about the roof types (e.g., concrete, clay-tiles, steel, etc.), which affect the RRWH efficiency, and (iii) the absence of local climate-change models for predicting future rainfall and water resources availability. This research attempted to overcome these limitations by considering (i) a proportional relationship between the projected population and rooftops, (ii) an average runoff coefficient and collection efficiency of 0.9 as suggested in the literature. This research could be improved in the future by considering (i) a local rooftop model, (ii) a local climate change model to estimate the projected rainfall and water availability, and (iii) monitoring the water demand, water supply, rainfall intensity, and the rooftops water harvesting.
Author Contributions
Conceptualization, T.J. and I.S.; data curation, T.J.; formal analysis, T.J. and I.S.; investigation, T.J.; methodology, T.J. and I.S.; project administration, I.S.; software, T.J.; supervision, I.S.; validation, T.J.; visualization, T.J.; writing—original draft, T.J.; writing—review and editing, I.S. All authors have read and agreed to the published version of the manuscript.
Funding
This research received no external funding.
Institutional Review Board Statement
Not applicable.
Informed Consent Statement
Not applicable.
Data Availability Statement
Restrictions apply to the availability of these data. Data were obtained from the Palestinian Water Authority (PWA) and are available from the authors with the permission of PWA.
Conflicts of Interest
The authors declare no conflict of interest.
References
- Taylor, R. Rethinking Water Scarcity: The Role of Storage. Eos Trans. Am. Geophys. Union 2009, 90, 237–238. [Google Scholar] [CrossRef]
- Howard, G.; Bartram, J. Domestic Water Quantity, Service Level and Health; WHO: Geneva, Switzerland, 2003; pp. 1–39. [Google Scholar]
- Adams, E.A.; Stoler, J.; Adams, Y. Water Insecurity and Urban Poverty in the Global South: Implications for Health and Human Biology. Am. J. Hum. Biol. 2020, 32, e23368. [Google Scholar] [CrossRef]
- Anser, M.K.; Islam, T.; Khan, M.A.; Zaman, K.; Nassani, A.A.; Askar, S.E.; Abro, M.M.Q.; Kabbani, A. Identifying the Potential Causes, Consequences, and Prevention of Communicable Diseases (Including COVID-19). BioMed Res. Int. 2020, 2020, 8894006. [Google Scholar] [CrossRef] [PubMed]
- Zakar, M.Z.; Zakar, R.; Fischer, F. Climate Change-Induced Water Scarcity: A Threat to Human Health. South Asian Stud. 2012, 27, 293–312. [Google Scholar]
- United Nation (UN). Sustainable Development Goals: 17 Goals to Transform Our World. Available online: http://www.un.org/sustainabledevelopment/ (accessed on 23 July 2021).
- Shadeed, S.; Judeh, T.; Almasri, M. Developing a GIS-Based Water Poverty and Rainwater Harvesting Suitability Maps for Domestic Use in the Dead Sea Region (West Bank, Palestine). Hydrol. Earth Syst. Sci. 2019, 23, 1581–1592. Available online: https://hess.copernicus.org/articles/23/1581/2019/ (accessed on 22 June 2021). [CrossRef] [Green Version]
- The Arab Water Council. Vulnerability of Arid and Semi-Arid Regions to Climate Change-Impacts and Adaptive Strategies: Perspectives on Water and Climate Change Adaptation; AWC: Cairo, Egypt, 2009; pp. 1–16. [Google Scholar]
- Menzel, L.; ben Asher, J.; Ouroud, I.; Sternberg, M.; Yakir, D. GLOWA Jordan River Phase II Final Report: An Integrated Approach to Sustainable Management of Water Resources under Global Change; GLOWA: Amman, Jordan, 2009; pp. 1–385. [Google Scholar]
- PCBS. Quantity of Water Supply for Domestic Sector, Water Consumed and Daily Consumption per Capita in the West Bank by Governorate in 2018. Available online: https://www.pcbs.gov.ps/Portals/_Rainbow/Documents/water-E9-2018.html (accessed on 14 June 2021).
- Liu, J.; Yang, H.; Gosling, S.N.; Kummu, M.; Flörke, M.; Pfister, S.; Hanasaki, N.; Wada, Y.; Zhang, X.; Zheng, C.; et al. Water Scarcity Assessments in the Past, Present, and Future. Earth’s Future 2017, 5, 545–559. [Google Scholar] [CrossRef]
- Jafari-Shalamzari, M.; Zhang, W. Assessing Water Scarcity Using the Water Poverty Index (WPI) in Golestan Province of Iran. Water 2018, 10, 1079. [Google Scholar] [CrossRef] [Green Version]
- Falkenmark, M.; Rockström, J.; Karlberg, L. Present and Future Water Requirements for Feeding Humanity. Food Secur. 2009, 1, 59–69. [Google Scholar] [CrossRef]
- Falkenmark, M.; Lundqvist, J.; Widstrand, C. Macro-Scale Water Scarcity Requires Micro-Scale Approaches. Nat. Resour. Forum 1989, 13, 258–267. [Google Scholar] [CrossRef] [PubMed]
- Damkjaer, S.; Taylor, R. The Measurement of Water Scarcity: Defining a Meaningful Indicator. Ambio 2017, 46, 513–531. [Google Scholar] [CrossRef] [Green Version]
- Taikan, O.; Shinjiro, K. Global Hydrological Cycles and World Water Resources. Science 2006, 313, 1068–1072. [Google Scholar] [CrossRef] [Green Version]
- Liu, W.; Zhao, M.; Xu, T. Water Poverty in Rural Communities of Arid Areas in China. Water 2018, 10, 505. [Google Scholar] [CrossRef] [Green Version]
- Huang, L.; Yin, L. Supply and Demand Analysis of Water Resources Based on System Dynamics Model. J. Eng. Technol. Sci. 2017, 49, 705–720. [Google Scholar] [CrossRef]
- Abu-Zreig, M.; Ababneh, F.; Abdullah, F. Assessment of Rooftop Rainwater Harvesting in Northern Jordan. Phys. Chem. Earth 2019, 114, 102794. [Google Scholar] [CrossRef]
- Abbas, S.; Mahmood, M.; Yaseen, M. Assessing the Potential for Rooftop Rainwater Harvesting and Its Physio and Socioeconomic Impacts, Rawal Watershed, Islamabad, Pakistan. Environ. Dev. Sustain. 2021, 23, 17942–17963. [Google Scholar] [CrossRef]
- Mundia, C. Assessing the Reliability of Rooftop Rainwater Harvesting for Domestic Use in Western Kenya. Ph.D. Thesis, Southern Illinois University, Carbondale, IL, USA, January 2021. [Google Scholar]
- Bernard, B.; Joyfred, A. Contribution of Rainfall on Rooftop Rainwater Harvesting and Saving on the Slopes of Mt. Elgon, East Africa. Sci. World J. 2020, 2020, 7196342. [Google Scholar] [CrossRef] [PubMed]
- Boakye, E.; John-Jackson, N. Quantifying Rooftop Rainwater Harvest Potential: Case of Takoradi Polytechnic in Takoradi, Ghana. IJSR 2015, 5, 6–391. [Google Scholar] [CrossRef]
- Rahimi, O.; Murakami, K. Rooftop Rainwater Harvesting and its Efficiency in Kabul New City. J. Jpn. Soc. Civ. Eng. 2017, 73, 25–30. [Google Scholar] [CrossRef]
- Malambo, T.; Huang, Q. Rooftop Rainwater Harvesting as an Alternative Domestic Water Resource in Zambia. GEP 2016, 4, 41–57. [Google Scholar] [CrossRef] [Green Version]
- Sendanayake, S. Potential for Domestic Rooftop Rainwater Harvesting in the District of Colombo, Sri Lanka. IJIR 2016, 2, 231–236. [Google Scholar]
- Biswas, B.; Mandal, B. Construction and Evaluation of Rainwater Harvesting System for Domestic Use in a Remote and Rural Area of Khulna, Bangladesh. Int. Sch. Res. Notices 2014, 2014, 751952. [Google Scholar] [CrossRef]
- Sheikh, V. Perception of Domestic Rainwater Harvesting by Iranian Citizens. Sustain. Cities Soc. 2020, 60, 102278. [Google Scholar] [CrossRef]
- Gado, T.A.; El-Agha, D.E. Feasibility of Rainwater Harvesting for Sustainable Water Management in Urban Areas of Egypt. ESPR 2020, 27, 32304–32317. [Google Scholar] [CrossRef] [PubMed]
- Abdulla, F.A.; Al-Shareef, A.W. Roof Rainwater Harvesting Systems for Household Water Supply in Jordan. Desalination 2009, 243, 195–207. [Google Scholar] [CrossRef]
- Ffolliott, P.F.; Brooks, K.N.; Neary, D.G. Water Harvesting in Arid and Semi-Arid Regions; Arizona-Nevada Academy of Scince: Flagstaff, AZ, USA, 2014; pp. 41–44. [Google Scholar]
- Gebreyess, B.; Woldeamanuel, A.A. Water Harvesting Technologies in Semi-Arid and Arid Areas. JDMLM 2019, 7, 1921–1928. [Google Scholar] [CrossRef]
- Urama, K.; Ozor, N. Impacts of Climate Change on Water Resources in Africa: The Role of Adaptation. ATPS 2010, 29, 1–29. Available online: https://rb.gy/cjfzvv (accessed on 12 July 2021).
- Johannsen, I.M.; Hengst, J.C.; Goll, A.; Höllermann, B.; Diekkrüger, B. Future of Water Supply and Demand in the Middle Drâa Valley, Morocco, under Climate and Land Use Change. Water 2016, 8, 313. [Google Scholar] [CrossRef] [Green Version]
- Qiao, C.; Ning, Z.; Wang, Y.; Sun, J.; Lin, Q.; Wang, G. Impact of Climate Change on Water Availability in Water Source Areas of the South-to-North Water Diversion Project in China. Front. Earth Sci. 2021, 9, 860. [Google Scholar] [CrossRef]
- Versini, P.A.; Pouget, L.; McEnnis, S.; Custodio, E.; Escaler, I. Climate Change Impact on Water Resources Availability: Case Study of the Llobregat River Basin (Spain). Hydrol. Sci. J. 2016, 61, 2496–2508. [Google Scholar] [CrossRef]
- Emami, F.; Koch, M. Modeling the Impact of Climate Change on Water Availability in the Zarrine River Basin and Inflow to the Boukan Dam, Iran. Climate 2019, 7, 51. [Google Scholar] [CrossRef] [Green Version]
- Petropoulos, G.; Carlson, T.N.; Wooster, M.J. An Overview of the Use of the SimSphere Soil Vegetation Atmosphere Transfer (SVAT) Model for the Study of Land-Atmosphere Interactions. Sensors 2009, 9, 4286–4308. [Google Scholar] [CrossRef] [PubMed] [Green Version]
- Gould, J.; Nissen-Petersen, E. Rainwater Catchment Systems for Domestic Supply: Design, Construction and Implementation, 1st ed.; IT Publications: London, UK, 1999; pp. 1–352. [Google Scholar]
- Alawna, S.; Shadeed, S. Rooftop Rainwater Harvesting to Alleviate Domestic Water Shortage in the West Bank, Palestine. An-Najah Univ. J. Res. (Nat. Sci.) 2021, 35, 83–108. [Google Scholar]
- Farreny, R.; Morales-Pinzón, T.; Guisasola, A.; Tayà, C.; Rieradevall, J.; Gabarrell, X. Roof Selection for Rainwater Harvesting: Quantity and Quality Assessments in Spain. Water Res. 2011, 45, 3245–3254. [Google Scholar] [CrossRef]
- PCBS. Estimated Population in the Palestine Mid-Year by Governorate. 1997–2026. Available online: https://www.pcbs.gov.ps/statisticsIndicatorsTables.aspx?lang=en&table_id=676 (accessed on 11 May 2021).
- Judeh, T.; Haddad, M.; Özerol, G. Assessment of Water Governance in the West Bank, Palestine. Int. J. Glob. Environ. Issues 2017, 16, 119–134. [Google Scholar] [CrossRef]
- Shadeed, S.; Judeh, T.; Riksen, M. Rainwater Harvesting for Sustainable Agriculture in High Water-Poor Areas in the West Bank, Palestine. Water 2020, 12, 380. [Google Scholar] [CrossRef] [Green Version]
- Judeh, T.; Bian, H.; Shahrour, I. GIS-Based Spatiotemporal Mapping of Groundwater Potability and Palatability Indices in Arid and Semi-Arid Areas. Water 2021, 13, 1323. [Google Scholar] [CrossRef]
- Palestinian Water Authority (PWA). Water Authority Strategic Plan 2016–2018; PWA: Ramallah, Palestine, 2016; pp. 1–25. [Google Scholar]
- MoLG. Building Rooftops. Available online: https://geomolg-geomolgarconline.hub.arcgis.com/search?collection=Dataset (accessed on 18 May 2021).
- Courbage, Y.; Hamad, B.A.; Zagha, A. Palestine 2030—Demographic Change: Opportunities for Development; UNFBA: Ramallah, Palestine, 2016; pp. 1–275. [Google Scholar]
- Palestinian Metrological Authority (PMA). Climate Bulletin; PMA: Ramallah, Palestine, 2018; pp. 1–34. [Google Scholar]
- Muñoz, E.; Tume, P.; Ortíz, G. Uncertainty in Rainfall Input Data in a Conceptual Water Balance Model: Effects on Outputs and Implications for Predictability. Earth Sci. Res. J. 2014, 18, 69–75. [Google Scholar] [CrossRef]
- Fraga, I.; Cea, L.; Puertas, J. Effect of Rainfall Uncertainty on the Performance of Physically Based Rainfall–Runoff Models. Hydrol. Process. 2019, 33, 160–173. [Google Scholar] [CrossRef] [Green Version]
- Gunkel, A.; Lange, J. New Insights into the Natural Variability of Water Resources in The Lower Jordan River Basin. Water Resour. Manag. 2012, 26, 963–980. [Google Scholar] [CrossRef]
- Jabari, S.; Shahrour, I.; El Khattabi, J. Assessment of the Urban Water Security in a Severe Water Stress Area–Application to Palestinian Cities. Water 2020, 12, 2060. [Google Scholar] [CrossRef]
- Goodarzi, M.; Mohtar, R.; Kiani-Harchegani, M.; Faraji, A.; Mankavi, F.; Rodrigo-Comino, J. Water Poverty Index (WPI) Evaluation in Borujerd-Dorood Watershed (Iran) to Reinforce Land Management Plans. Pirineos 2021, 176, 2. [Google Scholar] [CrossRef]
- Koirala, S.; Fang, Y.; Dahal, N.M.; Zhang, C.; Pandey, B.; Shrestha, S. Application of Water Poverty Index (WPI) in Spatial Analysis of Water Stress in Koshi River Basin, Nepal. Sustainability 2020, 12, 727. [Google Scholar] [CrossRef] [Green Version]
- De Sousa Cordão, M.J.; Rufino, I.A.A.; Alves, P.B.R.; Filho, M.N.M.B. Water Shortage Risk Mapping: A GIS-MCDA Approach for a Medium-Sized City in the Brazilian Semi-Arid Region. Urban Water J. 2020, 17, 642–655. [Google Scholar] [CrossRef]
- Alwan, I.A.; Aziz, N.A.; Hamoodi, M.N. Potential Water Harvesting Sites Identification Using Spatial Multi-Criteria Evaluation in Maysan Province, Iraq. ISPRS Int. J. Geo-Inf. 2020, 9, 235. [Google Scholar] [CrossRef]
- Ranaee, E.; Abbasi, A.A.; Tabatabaee-Yazdi, J.; Ziyaee, M. Feasibility of Rainwater Harvesting and Consumption in a Middle Eastern Semiarid Urban Area. Water 2021, 13, 2130. [Google Scholar] [CrossRef]
- Hashim, H.Q.; Sayl, K.N. Detection of Suitable Sites for Rainwater Harvesting Planning in an Arid Region Using Geographic Information System. Appl. Geomat. 2021, 13, 235–248. [Google Scholar] [CrossRef]
Figure 1.
Research methodology.

Figure 2.
Schematic overview of the adopted Soil-Vegetation-Atmosphere Model (SVAT) model.

Figure 3.
The geographical setting of the West Bank.

Figure 4.
Historical and current statistics of population and total water demand (TWD) in the whole West Bank between 1997 and 2020.
Figure 4.
Historical and current statistics of population and total water demand (TWD) in the whole West Bank between 1997 and 2020.

Figure 5.
Distribution of rainfall stations in the West Bank.

Figure 6.
Variation in rainfall (RF) and TWS considering climate change.

Figure 7.
Impact of the RRWH on the domestic water scarcity in the Jerusalem and Tulkarm governorates (in 2020).
Figure 7.
Impact of the RRWH on the domestic water scarcity in the Jerusalem and Tulkarm governorates (in 2020).

Figure 8.
Impact of the RRWH on domestic water scarcity for the different urban scales of Jenin governorate.
Figure 8.
Impact of the RRWH on domestic water scarcity for the different urban scales of Jenin governorate.


Table 1.
Domestic water scarcity values and the associated levels [18].
Table 1.
Domestic water scarcity values and the associated levels [18].
| SDBI Level | SDBI Value |
|---|---|
| Extreme water scarcity | (0, 0.3) |
| Acute water scarcity | [0.3, 0.6] |
| Moderate water scarcity | (0.6, 0.9) |
| Slight water scarcity | [0.9, 1) |
| No water scarcity | ≥1 |
Table 2.
Current and projected population (POP), rooftop areas, and TWD.
| Governorate | POPc | POPp | Rooftops Area 2020 (km2) | Rooftops Density (m2/Capita) | Rooftops Area 2050 (km2) | TWD 2020 (Million Cubic Meters/Year) | TWD 2050 (Million Cubic Meters/Year) |
|---|---|---|---|---|---|---|---|
| Jenin | 332,050 | 481,000 | 10.5 | 31.7 | 15.3 | 12.1 | 17.6 |
| Tubas | 64,507 | 133,000 | 1.7 | 26.5 | 3.5 | 2.4 | 4.9 |
| Tulkarm | 195,341 | 227,000 | 6.0 | 30.8 | 7.0 | 7.1 | 8.3 |
| Nablus | 407,754 | 532,000 | 11.5 | 28.3 | 15.1 | 14.9 | 19.4 |
| Qalqilya | 119,042 | 174,000 | 3.3 | 27.8 | 4.8 | 4.3 | 6.4 |
| Salfit | 80,225 | 101,000 | 2.7 | 33.4 | 3.4 | 2.9 | 3.7 |
| Ramallah & Al-Bireh | 347,818 | 602,000 | 11.7 | 33.7 | 20.3 | 12.7 | 22.0 |
| Jerusalem | 461,666 | 642,000 | 4.9 | 10.7 | 6.8 | 16.9 | 23.4 |
| Jericho | 52,355 | 89,000 | 2.2 | 42.4 | 3.8 | 1.9 | 3.2 |
| Bethlehem | 229,884 | 354,000 | 7.3 | 31.6 | 11.2 | 8.4 | 12.9 |
| Hebron | 762,541 | 1,394,000 | 21.8 | 28.7 | 39.9 | 27.8 | 50.9 |
Table 3.
Density of rainfall measurements in the West Bank.
| Governorate | No. of Rainfall Stations | Urban Area (km2) | Rainfall Stations Density (Station/km2) |
|---|---|---|---|
| Jenin | 13 | 23.3 | 0.6 |
| Tubas | 3 | 5.1 | 0.6 |
| Tulkarm | 6 | 21.4 | 0.3 |
| Nablus | 9 | 27.6 | 0.3 |
| Qalqilya | 5 | 6.8 | 0.7 |
| Salfit | 5 | 6.7 | 0.8 |
| Ramallah & Al-Bireh | 11 | 38.7 | 0.3 |
| Jerusalem | 5 | 37.3 | 0.1 |
| Jericho | 3 | 10.2 | 0.3 |
| Bethlehem | 6 | 27.0 | 0.2 |
| Hebron | 9 | 77.2 | 0.1 |
Table 4.
Average annual rainfall (RF) for the different West Bank governorates in 2020.
| Governorate | Average Annual RF in 2020 (mm/Year) |
|---|---|
| Jenin | 498 |
| Tubas | 402 |
| Tulkarm | 630 |
| Nablus | 574 |
| Qalqilya | 662 |
| Salfit | 656 |
| Ramallah & Al-Bireh | 579 |
| Jerusalem | 537 |
| Jericho | 166 |
| Bethlehem | 518 |
| Hebron | 487 |
Table 5.
Total water supply (TWS) in the different West Bank governorates in 2020.
| Governorate | TWS in 2020 (Million Cubic Meters/Year) |
|---|---|
| Jenin | 3.7 |
| Tubas | 2.7 |
| Tulkarm | 6.6 |
| Nablus | 8.5 |
| Qalqilya | 5.2 |
| Salfit | 1.5 |
| Ramallah & Al-Bireh | 1.1 |
| Jerusalem | 1.4 |
| Jericho | 2.9 |
| Bethlehem | 2.0 |
| Hebron | 6.6 |
Table 6.
SDBI values and water scarcity levels in the West Bank governorates in 2020.
| Governorate | SDBI Value | Domestic Water Scarcity Level |
|---|---|---|
| Jenin | 0.29 | Extreme |
| Tubas | 1.14 | No Shortage |
| Tulkarm | 0.92 | Slight |
| Nablus | 0.57 | Acute |
| Qalqilya | 1.20 | No Shortage |
| Salfit | 0.50 | Acute |
| Ramallah & Al-Bireh | 0.08 | Extreme |
| Jerusalem | 0.08 | Extreme |
| Jericho | 1.53 | No Shortage |
| Bethlehem | 0.24 | Extreme |
| Hebron | 0.24 | Extreme |
Table 7.
Contribution of rooftops rainwater harvesting (RRWH) to TWS (in 2020).
| Governorate | Increase in TWS after Adopting RRWH (%) |
|---|---|
| Jenin | 133 |
| Tubas | 23 |
| Tulkarm | 52 |
| Nablus | 70 |
| Qalqilya | 38 |
| Salfit | 108 |
| Ramallah & Al-Bireh | 577 |
| Jerusalem | 169 |
| Jericho | 11 |
| Bethlehem | 170 |
| Hebron | 145 |
Table 8.
Contribution of RRWH to TWD in 2020.
| Governorate | The Ratio of RRWH to TWD (%) |
|---|---|
| Jenin | 39 |
| Tubas | 26 |
| Tulkarm | 48 |
| Nablus | 40 |
| Qalqilya | 45 |
| Salfit | 54 |
| Ramallah & Al-Bireh | 48 |
| Jerusalem | 14 |
| Jericho | 17 |
| Bethlehem | 40 |
| Hebron | 34 |
Table 9.
Impact of RRWH on the domestic water scarcity level in 2020.
| Governorate | RRWH Adoption Rate | |||
|---|---|---|---|---|
| 25% | 50% | 75% | 100% | |
| Jenin | Acute | Acute | Moderate | Moderate |
| Tubas | No shortage | No shortage | No shortage | No shortage |
| Nablus | Moderate | Moderate | Moderate | Slight |
| Qalqilya | No shortage | No shortage | No shortage | No shortage |
| Salfit | Moderate | Moderate | Slight | No shortage |
| Ramallah & Al-Bireh | Extreme | Acute | Acute | Acute |
| Jericho | No shortage | No shortage | No shortage | No shortage |
| Bethlehem | Acute | Acute | Acute | Moderate |
| Hebron | Acute | Acute | Acute | Acute |
Table 10.
Contribution of RRWH to TWS and TWD in 2050.
| Governorate | Increase in TWS after Adopting RRWH (%) | The Ratio of RRWH to TWD (%) |
|---|---|---|
| Jenin | 177 | 41 |
| Tubas | 49 | 25 |
| Tulkarm | 60 | 48 |
| Nablus | 89 | 42 |
| Qalqilya | 57 | 43 |
| Salfit | 141 | 51 |
| Ramallah & Al-Bireh | 1038 | 46 |
| Jerusalem | 250 | 13 |
| Jericho | 20 | 17 |
| Bethlehem | 285 | 36 |
| Hebron | 296 | 30 |
Table 11.
Impact of RRWH on the domestic water scarcity level in 2050.
| Governorate | RRWH Adoption Rate | ||||
|---|---|---|---|---|---|
| 0% | 25% | 50% | 75% | 100% | |
| Jenin | Extreme | Acute | Acute | Acute | Moderate |
| Tubas | Acute | Acute | Moderate | Moderate | Moderate |
| Tulkarm | Moderate | Slight | No shortage | No shortage | No shortage |
| Nablus | Acute | Acute | Moderate | Moderate | Slight |
| Qalqilya | Moderate | Moderate | Slight | No shortage | No shortage |
| Salfit | Acute | Acute | Moderate | Moderate | Moderate |
| Ramallah & Al-Bireh | Extreme | Extreme | Extreme | Acute | Acute |
| Jerusalem | Extreme | Extreme | Extreme | Extreme | Extreme |
| Jericho | Moderate | Moderate | Slight | Slight | Slight |
| Bethlehem | Extreme | Extreme | Acute | Acute | Acute |
| Hebron | Extreme | Extreme | Extreme | Acute | Acute |
Publisher’s Note: MDPI stays neutral with regard to jurisdictional claims in published maps and institutional affiliations. |
© 2021 by the authors. Licensee MDPI, Basel, Switzerland. This article is an open access article distributed under the terms and conditions of the Creative Commons Attribution (CC BY) license (https://creativecommons.org/licenses/by/4.0/).
Share and Cite
MDPI and ACS Style
Judeh, T.; Shahrour, I. Rainwater Harvesting to Address Current and Forecasted Domestic Water Scarcity: Application to Arid and Semi-Arid Areas. Water 2021, 13, 3583. https://0-doi-org.brum.beds.ac.uk/10.3390/w13243583
AMA Style
Judeh T, Shahrour I. Rainwater Harvesting to Address Current and Forecasted Domestic Water Scarcity: Application to Arid and Semi-Arid Areas. Water. 2021; 13(24):3583. https://0-doi-org.brum.beds.ac.uk/10.3390/w13243583
Chicago/Turabian StyleJudeh, Tariq, and Isam Shahrour. 2021. "Rainwater Harvesting to Address Current and Forecasted Domestic Water Scarcity: Application to Arid and Semi-Arid Areas" Water 13, no. 24: 3583. https://0-doi-org.brum.beds.ac.uk/10.3390/w13243583
Note that from the first issue of 2016, this journal uses article numbers instead of page numbers. See further details here.