Article

Dynamics of Nearshore Waves during Storms: Case of the English Channel and the Normandy Coasts

1
UNIROUEN, CNRS, UMR 6143–M2C, Normandie University, 76000 Rouen, France
2
Institute for Radiological Protection and Nuclear Safety, 92262 Fontenay-aux-Roses, France
3
UNICAEN, CNRS, UMR 6266–IDEES, Normandy University, 14032 Caen, France
4
SandS Corp, S.L., Bajada San Juan 73B, 39012 Santander, Spain
5
Agence de l’Eau Seine Normandie, CEDEX 1, 76176 Rouen, France
*
Author to whom correspondence should be addressed.
Submission received: 16 December 2021 / Revised: 13 January 2022 / Accepted: 19 January 2022 / Published: 22 January 2022
(This article belongs to the Special Issue Numerical Simulations and Modelling of Extreme Flood Events)

Abstract

:
This research was carried out in the framework of the Surface Water and Ocean Topography (SWOT) program of the French National Centre of Space Studies (CNES). In the context of global climate change, increases in frequency and intensity of extreme events are considered potential threats. Hence, many efforts have been devoted to acquiring a better understanding of the natural processes driving the hydrodynamics’ multiscale variability in order to produce a more accurate estimation of their fluctuations. In this situation, and in the framework of Normandy’s coastal risk management, the dynamics of extreme events were investigated from regional scales (the English Channel basin) to local scales (the Normandy beaches in Etretat and Hautot-sur-Mer). Offshore wave data were obtained and hourly wave data were simulated for two years using the SWAN (Simulating WAves till Nearshore) model, including ten highly energetic stormy events selected by their different physical characteristics. Spectral analysis was conducted to compare the transformation in frequencies of the wave spectra from the Channel to shallow waters. A special focus was given to the hydrodynamics close to Normandy during these extreme events depending on their duration, their strength, and the persistence of the maximum wave height.

1. Introduction

Extreme storm-related coastal inundation, one of the most destructive natural disasters, is considered a highly challenging issue in the global context of climate change and requires coastal adaptation measures that should be fitted to the changing climates [1]. Severe flooding cases are constantly increasing in number which, in turn, brings the issue of accurate mapping of inundation zones and designing criteria for adaptive methods to augment flood resiliency. The inundation phenomenon can be observed arising concomitantly with the combining driving forces of extreme waves, surges during high tides and an ongoing sea-level rise component. The need to increase coastal resilience in the near future is an important aspect since nearly 40% of the global population is living in coastal regions. Indeed, the number of people living in low-lying coastal zones (∼625 million in 2000) is expected to increase by a factor of 1.5 to 2 between 2030 and 2060 [2], which makes the need to model coastal wave climate even more important to protect those regions.
Changes in wave climate together with the sea-level rise component have increased the frequency and have reinforced the negative effects of storms and hurricanes worldwide [3,4,5]. For example, Liu et al. [3] have found by analyzing 68 years of data that with a sea-level rise of 0.5 m, storms with 1% annual exceedance probability (AEP) can occur up to 5% AEP along with the Connecticut coastal towns. In European water areas, the largest waves are identified at the Atlantic boundaries, where waves are to propagate over large fetches from the Atlantic Ocean. Here the persistence and strength of westerly winds are particularly important [6], as well as the intensity and frequency of storms. Wind-induced waves are generally affected by many factors including the water depth, which is locally modified by the coastal geometry and artificial structures. In shallow water areas, the decrease in height is the result of energy dissipation through bottom friction and wave breaking; this reduction of wave energy at a particular location may decrease over time if the sea level rises unless the coastal morphology in areas of mobile sediment can adapt at a similar rate [6]. The wave transformation is also important in semi-enclosed environments such as bays and estuaries, where the spatial variability of water depth is considerable, and the water–land contours are highly reflective and thus responsible for the modification of wave characteristics. This is the case of the English Channel and studying the transformation of waves when they are approaching from the English Channel to Normandy coasts is the focus of this research, including simulation nearshore, with a special interest in stormy events.
Simulating the behavior of wind-induced waves requires the use of third-generation wave models [7], which are the most advanced state-of-the-art numerical tools for this matter. Third-generation models differ from first- and second-generation models in that the wave spectrum is computed alone, by integration of the basic spectral transport equation, without any prior restriction of the spectral shape, fixing the numerical limitations of the previous generations’ models. In the case of open wave simulation, the most popular wave models are WAM (WAve Modelling) [8] and WaveWatch III (denoted as WW3 in the following) [9,10,11]. Applying these models is not always possible in coastal and shallow waters where non-linear and wave-bottom interactions play an important role. More details about models focused on coastal and shallow waters conditions are given by Booij et al. [12] or [13]. The wind–wave model, WW3, was applied to the case of the English Channel by Lewis et al. [14], Saulter et al. [15] and Skliris et al. [16] using a main spatial resolution of 7 km, 3 km and 1.5 km depending on the depth or proximity to the coast in different studies to reproduce the wave field and obtain spatially homogeneous long time-series of wave climate parameters, i.e., Wave Reanalysis Databases (WRD). However, the WRD accuracy presents several deficiencies compared to instrumental measurements [17,18]. Despite such limitations, reanalysis models are useful as they are considered to provide the optimal way to interpolate data in time and space for some locations for which no instrumental measurements work [19]. Nevertheless, numerical models allow the simulation of nearshore hydrodynamics while increasing the accuracy and resolution, thus providing an accurate approximation of instrumental measurements.
SWAN is the most extended model for reproducing numerically nearshore conditions in relation to wave transformation. SWAN is a phase-averaging third-generation spectral wind–wave model, and it allows us to increase the resolution of data obtained from models with a wider grid, such as WW3. With this aim, Guillou and Chapalain [20] have implemented the SWAN model in the Sea of Iroise (western Europe) to assess the amount of a wave energy resource at high spatial resolutions in coastal areas. Their results were validated using eight-year wave measurements at different timescales. They have estimated wave power production variability according to the inter-seasonal and inter-annual evolutions of the resource mentioned, particularly during the winter period. For the Sea of Iroise, monthly variations of the wave energy flux are distributed in the opposite way during the most energetic periods.
The objective of the present work is to analyze and model the wave transformation in coastal areas by investigating their dynamics at two different scales: the English Channel and close to the Normandy coasts. Different datasets will be obtained on the two entrances of the Channel, the Atlantic Ocean and the North Sea, on a point offshore of Normandy and on two points nearshore after a simulation of the propagation of waves using the SWAN model. A special focus will be devoted to two pilot coastal systems, Hautot-sur-Mer and Etretat, monitored by video systems and suffering from hazardous problems of marine submersion and erosion particularly during the last two years 2018–2020 [21,22].
The election of the SWAN model over other models, such as the phase-resolving Boussinesq-type models [23,24], is motivated by a compromise between the computational demand and the quality of the results obtained. This work aims to study the modification in the energy spectrum and the physical transformation of waves in the English Channel, especially during stormy events, when they are approaching Normandy coasts, but obtaining results only before waves start to break. For this purpose, SWAN is the most appropriate model, since more developed models resolve the dispersive effects of waves in deep water and other physical processes from the breaking zone till the shore, requiring a higher computational cost. SWAN has been extensively proven as the most effective and efficient model for propagating and studying the transformation of waves.
This paper is structured as follows: Section 2 describes and investigates the stormy events examined in this work and the hydrodynamic and bathymetry dataset used for setting up the model, which is explained in detail in Section 3. The results and extreme wave simulations verification are presented and discussed in Section 4. Final remarks are outlined in Section 5.

2. Data

2.1. Study Sites: The English Channel and Normandy Coasts

The English Channel is a basin connecting the Atlantic Ocean and the North Sea and separating both the French and the British coasts. A complex system of capes and bays, alongside multiple islands, characterizes the coastal morphology from the Peninsula of Brittany in the western end of the French coast, to the Cotentin Peninsula (also known as Cherbourg Peninsula) in the middle of the Channel. The Channel Islands lie on the West side of this Peninsula. From that area till the Strait of Dover, the coastline gets smoother, with some notable spots such as the Seine Estuary. Likewise, the British coastline is smoother in the eastern part and more intricate in the western part, defined mainly by the presence of the Isle of Wight in the central part of the British coast.
The Channel extends over about 560 km with varying widths plummeting from around 240 km in the Atlantic Ocean to less than 35 km in the Strait of Dover, representing a shallow area taking the continental shelf area with an averaged depth of 60 m in the central part and less than 20 m on the sides of the basin. The depth is increasing westward up to over 100 m, but still far from the continental margin (see bathymetry map in Figure 1).
The areas taken as the study object are located along the northern coast of France, in the eastern part of the Channel. This work is focused on examining the areas surrounding Etretat and Hautot-sur-Mer, which belong to the Normandy region (Figure 1). This area is strongly influenced by tides which are semidiurnal and have macro to mega tidal ranges [25], from around 3 m at the neap tides up to 10 m at the spring tides. The Norman beaches located at the North of the mouth of the Seine River are defined by their morphology, mostly constituted by pebbles and gravels (D50 of 5.99 cm and 7.44 cm in Etretat and Hautot-sur-Mer, respectively [21]). This is explained by the configuration of the coast, formed by chalk cliffs with flint strata that get eroded by the impact of the sea.
The beach of Etretat is located between two of these cliff systems, the Falaise d’Aval is in the West, and the Falaise d’Amont is in the East. It is about 1 km long with the width varying in the tidal range. The shoreline is oriented to the Northeast with an inclination of North 47°. The beach has a steep slope of up to 12% and can be described as a pure gravel beach according to Jennings and Shulmeister [26].
The Hautot-sur-Mer beach is located in the West of the city of Dieppe, being semi-enclosed by chalk cliffs. This beach is 1.1 km long, with the width varying in the tidal range, being a composite beach, which includes a sandy low tide terrace and a pebble ridge, with a slope of 10% for the latter. The shoreline of Hautot-sur-Mer is oriented to the ENE, with an inclination of North 71°.

2.2. Wind and Wave Fields Measurements

For the analysis of the transformation of waves, including the forcing of the model, data were extracted from the MARC project (Modélisation et Analyse pour la Recherche Côtière, Modelling and Analysis for Coastal Research [27]). Models implemented in MARC include MARS3D (Model for Applications at Regional Scales [28], circulation, biogeochemistry and sediment dynamics) from Ifremer and WW3 wave model delivered by an international consortium coordinated by NOAA (National Oceanic and Atmospheric Administration). The implementation used—called NORGAS-2MIN database [29]—offers wave, wind and sea level data alongside the French Atlantic coast with the spatial resolution of 2 min at an hourly frequency starting from 2012, more specifically, along the Normandy and Gascony coasts, in the English Channel and the Bay of Biscay, respectively.
Hourly wave and wind data were obtained from external nodes of the reanalysis model WW3. WW3 [11,30,31] is a wave model developed at NOAA/NCEP (National Centers for Environmental Prediction) in the spirit of the WAM model [7,8]. It represents the attempt to sophisticate both models WaveWatch as developed at Delft University of Technology [29,32] and WaveWatch II, developed at NASA (National Aeronautics and Space Administration), Goddard Space Flight Center [33]. WW3, however, differs from its predecessors in terms of numerous important points such as governing equations, model structure, numerical methods and physical parameterization. Furthermore, along with version 3.14, the WW3 evolved from a wave model into a wave modeling framework, which allows the developing of additional physical and numerical approaches to wave modeling in an easier way.
WW3 solves the random phase spectral action density balance equation for wavenumber–direction spectra. The implicit assumption of this equation is that the properties of medium (water depth and current), as well as the wave field itself, vary with time and space scales, being much larger than the single wave variance scales, considering wetting and drying of grid points. However, the surf-zone physics implemented so far are still fairly rudimentary and imply that the wave model can be applied for the case of arbitrary shallow waters [34].
The data of the sea surface height above sea level were obtained from the MARS3D model. MARS is a community model developed by Ifremer (Institut Français de Recherche pour l’Exploitation de la Mer, French Institute for the Research and the Exploitation of the Sea) and shared by the DYNECO/DHYSED team (Dynamique HYdro-SEDimentaire du département DYNamiques des Ecosystèmes COtier, Hydro-Sedimentary Dynamics of the Dynamics of Coastal Ecosystems Department). The MARS model is a three-dimensional (3D) model based on a set of fluid mechanics equations (the so-called primitive equations) solved under some classic approximations for the hypotheses: (1) the Boussinesq assumption [35], for which density in the medium slightly deviates from a reference density and therefore can be replaced by a reference density except within the gravity term; and (2) the hydrostatic approximation resulting from scaling the equations, for which the horizontal movement scale is assumed to be an order of magnitude larger than the vertical one. These equations are transformed under the sigma framework in order to make free surface processing easier.
The MARS model is used to provide some realistic description of the coastal phenomena and is implemented for research and for operational interests over the three metropolitan basins: the Channel itself, the Bay of Biscay and the North-Western Mediterranean Sea. The main original aspect of the MARS model is the coupling between barotropic and baroclinic modes specifically. The base resolution of the free surface is 5 km [28], increased to 500 m along the French Atlantic coast in the MARC project [27].
Validation of the propagated data is proposed with the objective of confirming that the setup of the SWAN model is correctly defined and that the datasets used for forcing the model are also appropriate since the results of these propagations are potentially utilizable in further studies. For validating the results obtained from the simulations, wave measurements of two buoys were compared to the time series extracted at the same locations of these two stations (one for each of the study areas).
For Etretat, the wave measurement data were extracted from SCENES buoy (Station Côtière pour l’observation de l’Environnement en Estuaire de Seine, Coastal Station for the Observation and the Environment in the Seine Estuary) at the Seine Estuary mouth at a depth of 10 m (49°28.844′ N–0°1.932′ E, Figure 1), operated by Ifremer from October 2017. An ADCP (Acoustic Doppler Durrent Profiler) provides current velocity profiling every 30 min (the same goes for the wave parameters being provided every hour).
Regarding Hautot-sur-Mer, data were obtained by the campaign 07608 carried out by Cerema and EDF (Electricité de France, France Electricity Company, Paris, France) close to Penly (49°59.36′ N–01°12.06′ E, Figure 1), at 11 m of depth with more than three years of wave data measurements every 30 min (7 November 2017–31 May 2021).

2.3. Storm Events Identification

A 26-month time series of significant wave height was used to identify extreme events. It was obtained from the WW3 model output at intermediate waters in the node located between both study sites (49°58.728′ N–0°32.01′ E, at 29 m of depth, Figure 1), marked as a Reference point. The extreme events in the wave height time series were identified using a Peak Over Threshold (POT) method. Extreme events were selected with a threshold equal to the quantile Q95% following the hypothesis that, at least 5 days separate two consecutive peaks (Figure 2) for ensuring the independence of storms. A storm’s duration was defined as the time elapsed during the increase before the peak and decrease after the peak of the wave height time series. This aims to cover the whole development and fading processes during a storm. More than 30 extreme events were identified applying this definition. In the literature, it is worth noting that in some of them several values for the elapsed time between storms were used, from 1.25 days in Morton et al. [36] up to 20 days in Guedes Soares and Scotto [37]. In this study, choosing 5 days is motivated by the will to get a short enough elapsed time for obtaining a higher number of extreme events, while remaining long enough so that the definition of duration allows obtaining the growth and decay of every storm independently.
Among these 30 extreme events, 10 were selected to be analyzed considering variability in their characteristics (seasonal occurrence, wave magnitude, wave direction, sea level, storm duration) with the aim to classify the different events and identify their similarities and their differences, including their common hydrodynamic response close to the shoreline. Three storms, among the 10 ones analyzed, have happened at summer–autumn time each year: that is the case of Ali (starting 20 September 2018), Lorenzo (29 September 2019) and Francis (25 August 2020). The seven remaining storms took place during winter–spring time: Deirdre (5 December 2018), Gabriel (25 January 2019), Gareth (10 March 2019), Hannah (26 April 2019), Amelie (31 November 2019), Atiyah (7 December 2019) and Ciara (8 February 2020). The 10 storms are identified in Figure 2.

3. Methodology

3.1. Wave Model

Wave propagation and evolution were simulated using the SWAN model [12]. SWAN was developed at Delft University of Technology, and computes random, short-crested wind-generated waves in coastal regions and inland waters swells. The model simulates the growth, decay and transformation of wind-generated surface gravity waves and swells [38].
SWAN solves the spectral action balance equation without any a priori restrictions on the spectrum for the evolution of wave growth. SWAN wave propagation is calculated from deep water to the surf zone.
The discretization of the wave action balance equation in both geographical and spectral space is performed using a finite difference approach based on the so-called method of lines, while the geographical domain is discretized by structured rectangular meshes in the set-up used in this study.
SWAN accounts for the following physics: (a) wave transformation processes (shoaling, refraction due to current and depth, frequency shifting due to currents and non-stationary depth) (b) energy source/dissipation processes (wave generation by wind, white capping/bottom friction/depth-induced breaking, dissipation due to aquatic vegetation/turbulent flow/viscous fluid mud, wave-induced set-up, transmission through and reflection (specular and diffuse) against obstacles), and (c) non-linear energy transfer conservative processes (three- and four-wave interactions).

3.2. Model Set-Up

The boundary conditions of the SWAN model are defined by nine variables, including waves, wind and sea level, that need to be set up into the model in the coarse grids for both Etretat and Hautot-sur-Mer.
Wave data extracted from the MARC’s WRD applying the WW3 model consist in the significant height of wind and swell waves ( H s ), the peak period of the energy spectrum ( T p ) calculated from the wave peak frequency, the mean wave direction ( θ ) and the coefficient of directional spreading. The breaking constant ( γ b ) is calculated from the wavelength and the Iribarren number, considering the averaged slope at each location. The peak enhancement parameter of the Jonswap spectrum is obtained from the energy of the waves.
Wind was also obtained from the MARC database applying WW3 [34], and a middle node in the center of each study site was chosen to force the model considering velocity ( W s p e e d ) and direction ( W d i r e c t i o n ) at 10 m of elevation, calculated from the horizontal Northward and Eastward components.
Sea surface height above sea level, taken from MARC database through the use of MARS3D model [34] is also set as an hourly constant value considering the same coordinates of the node chosen for wind input data.
An output nested grid, i.e., an additional grid located inside the coarse grid with a higher resolution, is defined at each location. To reduce the scale, the ratio of the size of the cells from the coarse grid to the nested grid must be up to 1:5. When nesting, SWAN searches the boundary conditions of the internal grid in the output files of the previous coarse runs to take the boundary conditions at the start time of the nested run.
Hourly data from June 2018 to September 2020 were extracted from WW3 and MARS3D through MARC database to force the model. The model was run in a non-stationary mode with white capping, quadruplets and dissipation by bottom friction processes activated.
The meshes used for the simulations were created defining two density zones. The first grids (coarse meshgrids, Figure 3) are extended on the deep-water boundaries from 43 m of maximum depth in Etretat (spatial domain of 20.23 × 26.73 km) and from 31 m of maximum depth in Hautot-sur-Mer (19.54 × 20 km) to the shoreline with a cell size resolution of about 100 m. The second grids (nested meshgrids, Figure 3) are extended from 24 m of maximum depth in Etretat (3.6 × 3 km) and 21 m in Hautot-sur-Mer (3.9 × 4 km) on the boundaries to the shoreline of the Normandy coasts with a constant cell size resolution of 20 m.
This results in a coarse grid of 203 × 268 nodes in Etretat and a coarse grid of 196 × 201 nodes in Hautot-sur-Mer, and nested grids of 181 × 151 nodes and 201 × 231 nodes in each of the locations.
Increasing the resolution nearshore through the use of nested grids is necessary to obtain more reliable datasets that can be used in following studies, such as transport of sediments works or coastal modeling focused on the beaches of Etretat and Hautot-sur-Mer. Raw datasets with the 100 m resolution defined in coarse grids would not be fine enough for the studies mentioned. At the same time, the computational cost of adding nested grids in the propagations is not noticeable for the 2 years simulated and the spatial domains considered.
The model’s computational digital elevation model (DEM) is a composition and merging of regional bathymetry from the European Marine Observation and Data Network (EMODnet) Bathymetry portal [39] and high-resolution images from LiDAR campaigns. The vertical datum was the Lowest Astronomical Tide (LAT) for both sources and both locations. The spatial reference was the projection system EPSG:32631 WGS84/UTM zone 31N.
Bathymetry of the external area was extracted from the EMODnet portal. A detailed description of the EMODnet project, the digital terrain model (DTM) and the latest release can be found on the website [39]. The nearshore bathymetry of the LiDAR campaigns was provided by the ROL (Réseau d’Observation du Littoral de Normandie et des Hauts-de-France, Observation Network of the Coast of Normandy and Hauts-de-France). ROL is a monitoring strategy for coordinating a homogeneous coastline, which provides the information used in this study [40]. This dataset provides information of water depth every 1 m along the beaches and in all the surrounding area, seawards and landwards, for both locations.

3.3. Wave Statistics

Firstly, validation of the results of the numerical model was evaluated by calculating classical statistical parameters in comparison to buoy measurements. In the second place, the Continuous Wavelet Transform (CWT) was calculated with the datasets to perform the frequency analysis in the transformation of waves from the English Channel to the Normandy coasts.
Model performances are assessed using standard statistical parameters, as in Stopa et al. [41], including the Root Mean Square Error (RMSE) (Equation (1)), the Pearson’s correlation coefficient (R) (Equation (2)), and the scatter index (SI) (Equation (3)).
RMSE is useful to obtain an evaluation of the average distance between the observed data and the data obtained from the simulations.
RMSE = 1 n i = 1 n ( y i x i ) 2 ,
where n is the total number of coincident data, x i and y i represent the two sets of measured data and model estimation.
The Pearson’s correlation coefficient can be used as an indicator of the trends of the measured and the modeled datasets. If the datasets analyzed tend to increase or decrease together is closer to 1, and if they disagree in their trends is closer to 0.
R = i = 1 n [ ( x i x ¯ ) ( y i y ¯ ) ] [ 1 n i = 1 n ( x i x ¯ ) 2 1 n i = 1 n ( y i y ¯ ) 2 ] ,
where x ¯ and y ¯ are the mean values of coincident observed and simulated data, respectively.
And the scatter index ( SI ) is a normalized RMSE, and it provides information on the precision of the results of simulations with respect to the observations in percentage.
SI = 1 n i = 1 n [ ( y i y ¯ ) ( x i x ¯ ) ] 2 / x ¯ ,
A spectral approach of continuous wavelet was used to investigate the non-stationary behavior of waves and changes in their spectrum and their direction at different timescales.
The CWT has been largely used in meteorological applications to investigate the time–frequency evolution of climate patterns [42,43,44]. The technique of wavelet consists of decomposing a variability signal into scaled and translated versions (i.e., daughter wavelets) of a reference wave function (i.e., mother wavelet). The correlation between the undecomposed signal and the larger daughter wavelets allows the identification of different scales of the variability. For example, the existence of a correlation between the undecomposed signal and the smaller wavelets emphasizes the presence of the smaller (shorter wavelengths) variations in the undecomposed signal. Scanning the undecomposed signal with the set of daughter wavelets (i.e., convolving the signal with the wavelets) produces a diagram of space (X direction) versus space frequency of the variability.
The diagrams of CWT contain: (1) the contour diagram with space on the x-axis; (2) the frequency (spatial scale) or equivalent wavelength on the y-axis; and (3) the power or variance, which quantifies the correlation between the signal and the wavelet basis, on the z-axis.

4. Results

4.1. Model Validation

The wave measurements were compared to the SWAN wave simulations during the 26-month period propagated (from June 2018 to September 2020) to quantify the accuracy of the numerical approach at shallow water areas where the wave buoys are available (for Etretat, the SCENES buoy operated by Ifremer, and, for Hautot-sur-Mer, the buoy of the campaign 07608 carried out by Cerema and EDF). The comparison between both datasets highlights that RMSE is about ~20 cm in Etretat and about ~15 cm in Hatout-sur-Mer, agreeing with previous values obtained extensively in the literature for WRD obtained from the WW3 model [45,46,47], with less than 20 cm for the whole set of validation points.
For the site of Etretat, a bigger error is motivated by the Seine River discharge, which is not considered in our simulations since SWAN is not able to consider river flow inputs without coupling it with an external hydrodynamical model, and also has affection in the measurements of the buoy. Nevertheless, the datasets of observations and simulations show a good agreement with a correlation coefficient higher than 0.92 in both locations, reaching R = 0.96 in Hautot-sur-Mer (Figure 4). In the literature, these values for databases obtained from WW3 are also around 0.94. Precision is also better in Hatout-sur-Mer than in Etretat, with a scatter index of around 33% in the second site and around 22% in the first location, which proves a lofty precision.
For example, the significant wave height of 2.5 m in Etretat is overestimated by the model with a mean variance of 0.3 m (Figure 4a). In Hautot-sur-Mer, these errors appear when wave height takes values superior to 3 m and the simulations underestimate the observations also by around 0.2 m (Figure 4b). For an extreme event of 4 m, this explained variance is around ~0.30 m in Etretat and ~0.28 m in Hautot-sur-Mer.
Such comparison highlights the accuracy of the propagations with the SWAN model and the set-up of this study considering wind, waves and sea level, with positive biases in Etretat and negative ones in Hautot-sur-Mer for higher values. The validation of the results obtained from the model with the observations of the two buoys avoids the necessity of a calibration of the set-up of the model before propagation and provides support for the use of the datasets obtained as results in further studies.

4.2. Changes in Directional Wave Spectrum

In this section, five time series of simulated waves, extracted at different depths, from deep waters to nearshore, were studied. The signal of the wave height and the direction during the whole record of the dataset during the 26 months period was analyzed to investigate the variability of each parameter. They were calculated for five different points: two external points at deep waters from WW3 on the North Sea (1) and the Atlantic Ocean (2); the Reference point in intermediate waters between the two study sites (3); and two points extracted from nested grids and located on closure depth of Etretat (4) and Hautot-sur-Mer (5) (Figure 1). The closure depth is situated on shallow waters most of the time, but with the possibility of being on intermediate waters for some combinations of sea level and wave height, and it represents the shallowest depth where there is no significant change in the bottom elevation. The election of this point as the representative point is motivated because it is the last permanent depth that can be used landward, where waves are still not broken and where SWAN can reproduce their behavior accurately.
The wave climate regime at deep water is mainly controlled by the waves coming from the North Sea and from the Atlantic Ocean where waves present distribution with two modes, 40° and 225°, exhibiting both sea and swell waves, respectively (Figure 5). The frequency of sea waves is higher in the North Sea while swell waves are more important on the Atlantic side. At the Reference point, the distribution shows 30% of sea waves and 70% of swell waves. In the shallower water areas of Hautot-sur-Mer and Etretat, the swell waves are dominant for the period of time studied. Regarding the distribution of H s , the gaussian behavior is fully conserved from deep water to shallow areas with decreasing height induced by changes in water depth. The maximum Atlantic waves reach 10 m and are limited to 5 m at the North Sea. The average Hs is reduced to around 50% from the Atlantic to the Reference point where wave energy is also dissipated with 25% to reach Etretat and Hautot-sur-Mer.
Indeed, the maximum wave height is reduced by 15% and by 35%, close to Etretat and Hautot-sur-Mer, respectively. Changes in wave direction take an average of 18° clockwise for most of the storms close to Etretat at the peak of the storm; and they increase to 38° close to Hautot-sur-Mer, varying their directions from the sectors W-WNW to the sectors WNW-NW. The overall changes in wave height and direction are mainly induced by the refraction and energy dissipation processes, respectively, due to the bathymetry variation and the bottom friction (Figure 5).
In the frequency domain, the Continuous Wavelet Transform (CWT) of H s and θ were calculated for the different locations (Figure 6). In these spectra, the color scale represents an increasing power (variance) from blue to yellow and red. The CWT diagrams highlight the existence of several scales for depths with different ranges of frequencies: the inter-monthly scales of ~3–6 months and ~1–2 months and the inter-daily scales of ~0.5 months.
For high frequencies less than 0.5 months, the H s spectrum is relatively important at the North Sea, varying hourly scales, compared to the Atlantic where the low frequencies of 1–2 months and ~3–6 months are more structured. The full spectrum decreases from the deep water to the Reference point and then Etretat and Hautot-sur-Mer. Accordingly, waves do not exhibit significant changes in their height but should be modulated in their spectrum resulting from wind sea and swell waves. Such modulation seems to be related to an energy transfer between the wave frequencies induced by their physical transformation at shallow water areas.
Regarding the θ , significant changes are outlined at the different locations. Contrary to H s , high frequencies are less structured for the wave direction that varies at scales of days. The full spectrum from high to low frequencies is clearly observed at the North Sea and decreases slightly at the Reference point; it is reduced at Etretat and Hautot-sur-Mer. This variation should be mainly explained by the wave refraction induced by changes in sea bottom within the English Channel; it seems to be similarly produced for all waves coming from different directions at deep waters.

4.3. Storms Evolution within the English Channel

The hydrodynamics related to waves were investigated for the selected storms within the English Channel, more specifically, the time series of the variables H s and θ at the Reference point. The value of the maximum wave height ( H s , m a x ) was identified in the H s timeseries, named hereafter as the peak of the storm. In the same way, θ H s , p e a k was identified in the time series of θ as the value associated with the instant of this peak. H s , m a x gives us the information of the most hazardous scenario, when H s is reaching the highest value during the storm. If θ H s , p e a k turns perpendicular to the shoreline at this instant, the extreme event comes with an associated risk that requires to be deemed.
The definition of the duration of a storm between the instants of the two minima located before and after the peak was also applied at the Reference point. We defined the new variables H s , s t o r m and θ s t o r m as the timeseries of H s and θ for the duration of each storm.
Finally, in order to know the occurrence of the values H s , m a x and θ H s , p e a k , we analyzed the distribution of the variables H s , s t o r m and θ s t o r m . We sorted the time series of H s , s t o r m and θ s t o r m and divided the records into 10 equally spaced bins between the minimum and the maximum values of the two variables, containing each bin a 10% of the record. Calculating the relative frequencies of those bins, we figured out the occurrences of the 10% of the record of H s , s t o r m and θ s t o r m within which H s , m a x and θ H s , p e a k are contained. This information is important to realize the real impact of each storm. A more elevated value of the occurrence of H s , m a x implies a longer time with the coast exposed to the impact of these extreme events, whereas a lower value results in faster growth and decay of the storm.
A confluence of a high value of H s , m a x with a high value of its associated occurrence brings the worst scenario, with a strong impact due to the elevated wave height at the peak and persistent in time because of the high relative frequency of the 10% of the sorted distribution of the variable H s , s t o r m within which H s , m a x is included. If this happens to be with a θ H s , p e a k perpendicular to the shoreline and with an elevated associated occurrence of the bin containing it, the combination is the most hazardous.
Table 1 summarizes the main variables: the duration, the values of the wave height H s , m a x and the associated mean direction θ H s , p e a k , the percentage of occurrence of the bins containing H s , m a x and θ H s , p e a k , and the standard deviation of H s , s t o r m and θ s t o r m .
Among the different storms investigated, we distinguish: (1) Three storms were produced in summer–autumn (Ali, Lorenzo and Francis) with values of H s , m a x and θ H s , p e a k of 3.2–3.9 m and 277–279°, respectively; (2) Seven winter–spring storms (Deirdre, Gabriel, Gareth, Hannah, Amelie, Atiyah and Ciara) with a maximum wave height of 3.25–5.3 m and a mean direction of 259–293°, respectively. On the European coast of the North Atlantic Ocean, the season of low pressures or depressions starts traditionally in September–October. The events with the strongest impacts receive a name given by one of the coordinated European groups formed by the meteorological services of the different countries. Coinciding with the initial time of this work, the Southwest Group names the storms since the 2017–2018 season. Accounting for all the storms named by this Group since 2017, 12% were produced in summer–autumn and 88% of them were produced in winter–spring time, agreeing with this work in a bigger proportion of winter storms and with the strongest impact.
Storms with a shorter duration usually take place during the summer–autumn period and storms with longer durations in the winter–spring period. However, duration is not directly related to H s , m a x , since Lorenzo, being the shortest storm with a duration of 1.8 days, ranks fifth in the H s , m a x classification, and Deirdre, being the longest storm with a duration of 6.6 days, has just the third-highest H s , m a x .
As described before, investigating the occurrence of H s , m a x and θ H s , p e a k is important for learning about the behavior of the storms, especially at their peak. The occurrence of the highest 10% of the time series H s , s t o r m appears to be high during Ali, Deirdre, Hannah Amelie and Francis. Nevertheless, for these five storms, just Deirdre takes an elevated value of H s , m a x , which results in a risky situation, with a strong wave height that is also persistent in time. If we complete this information with the fact that Deirdre had the longest duration of all, we can declare that Deirdre is one of the most hazardous storms. In the case of Ciara, with the highest H s , m a x , the occurrence remains low, but this is conditioned probably by a high value of a standard deviation, as shown in Table 1. For this storm, the most elevated value of the standard deviation shows a wide range in the H s , s t o r m , being able to assume is one of the most hazardous storms too.
For this analysis, we assume that a high occurrence or a high wave height are considered when the percentage of occurrence or the value of H s at the peak are above the average value obtained from the storms studied, that is, 6.2% for the occurrence and 4.02 m for H s , m a x .
In the case of the occurrence of θ H s , p e a k , it becomes less important since a real affection to our study sites is conditioned by the value of θ H s , p e a k itself. In Etretat, the worst θ H s , p e a k of a storm would be the perpendicular direction to the shoreline, which is 317°. For Hautot-sur-Mer, this direction would be 341°. Considering that the storm with a stronger northern component is Gabriel, and the value of θ H s , p e a k is just 293.3°, we can accept that the storms studied are not as hazardous as they could be in relation to θ H s , p e a k and the associated occurrence.
It can be observed that, for some of the storms, the standard deviation of θ s t o r m is elevated. This is conditioned by the evolution of the mean direction during the storms, showing some variabilities, generally a shift to sectors with a W-SW component during the development phase of H s , s t o r m , taking an almost constant value during the fading phase. The storms with a bigger shift, before or after the peak, can be easily recognized by these high values in the standard deviation of θ s t o r m , especially Amelie.
These four storms pointed out for their different characteristics, Ciara, Amelie, Deirdre and Gabriel, are shown at their own peaks in Figure 7 and Figure 8 for the coarse and nested grids used during the simulations. The color maps represent the significant wave height, and the arrows represent the field of mean directions.

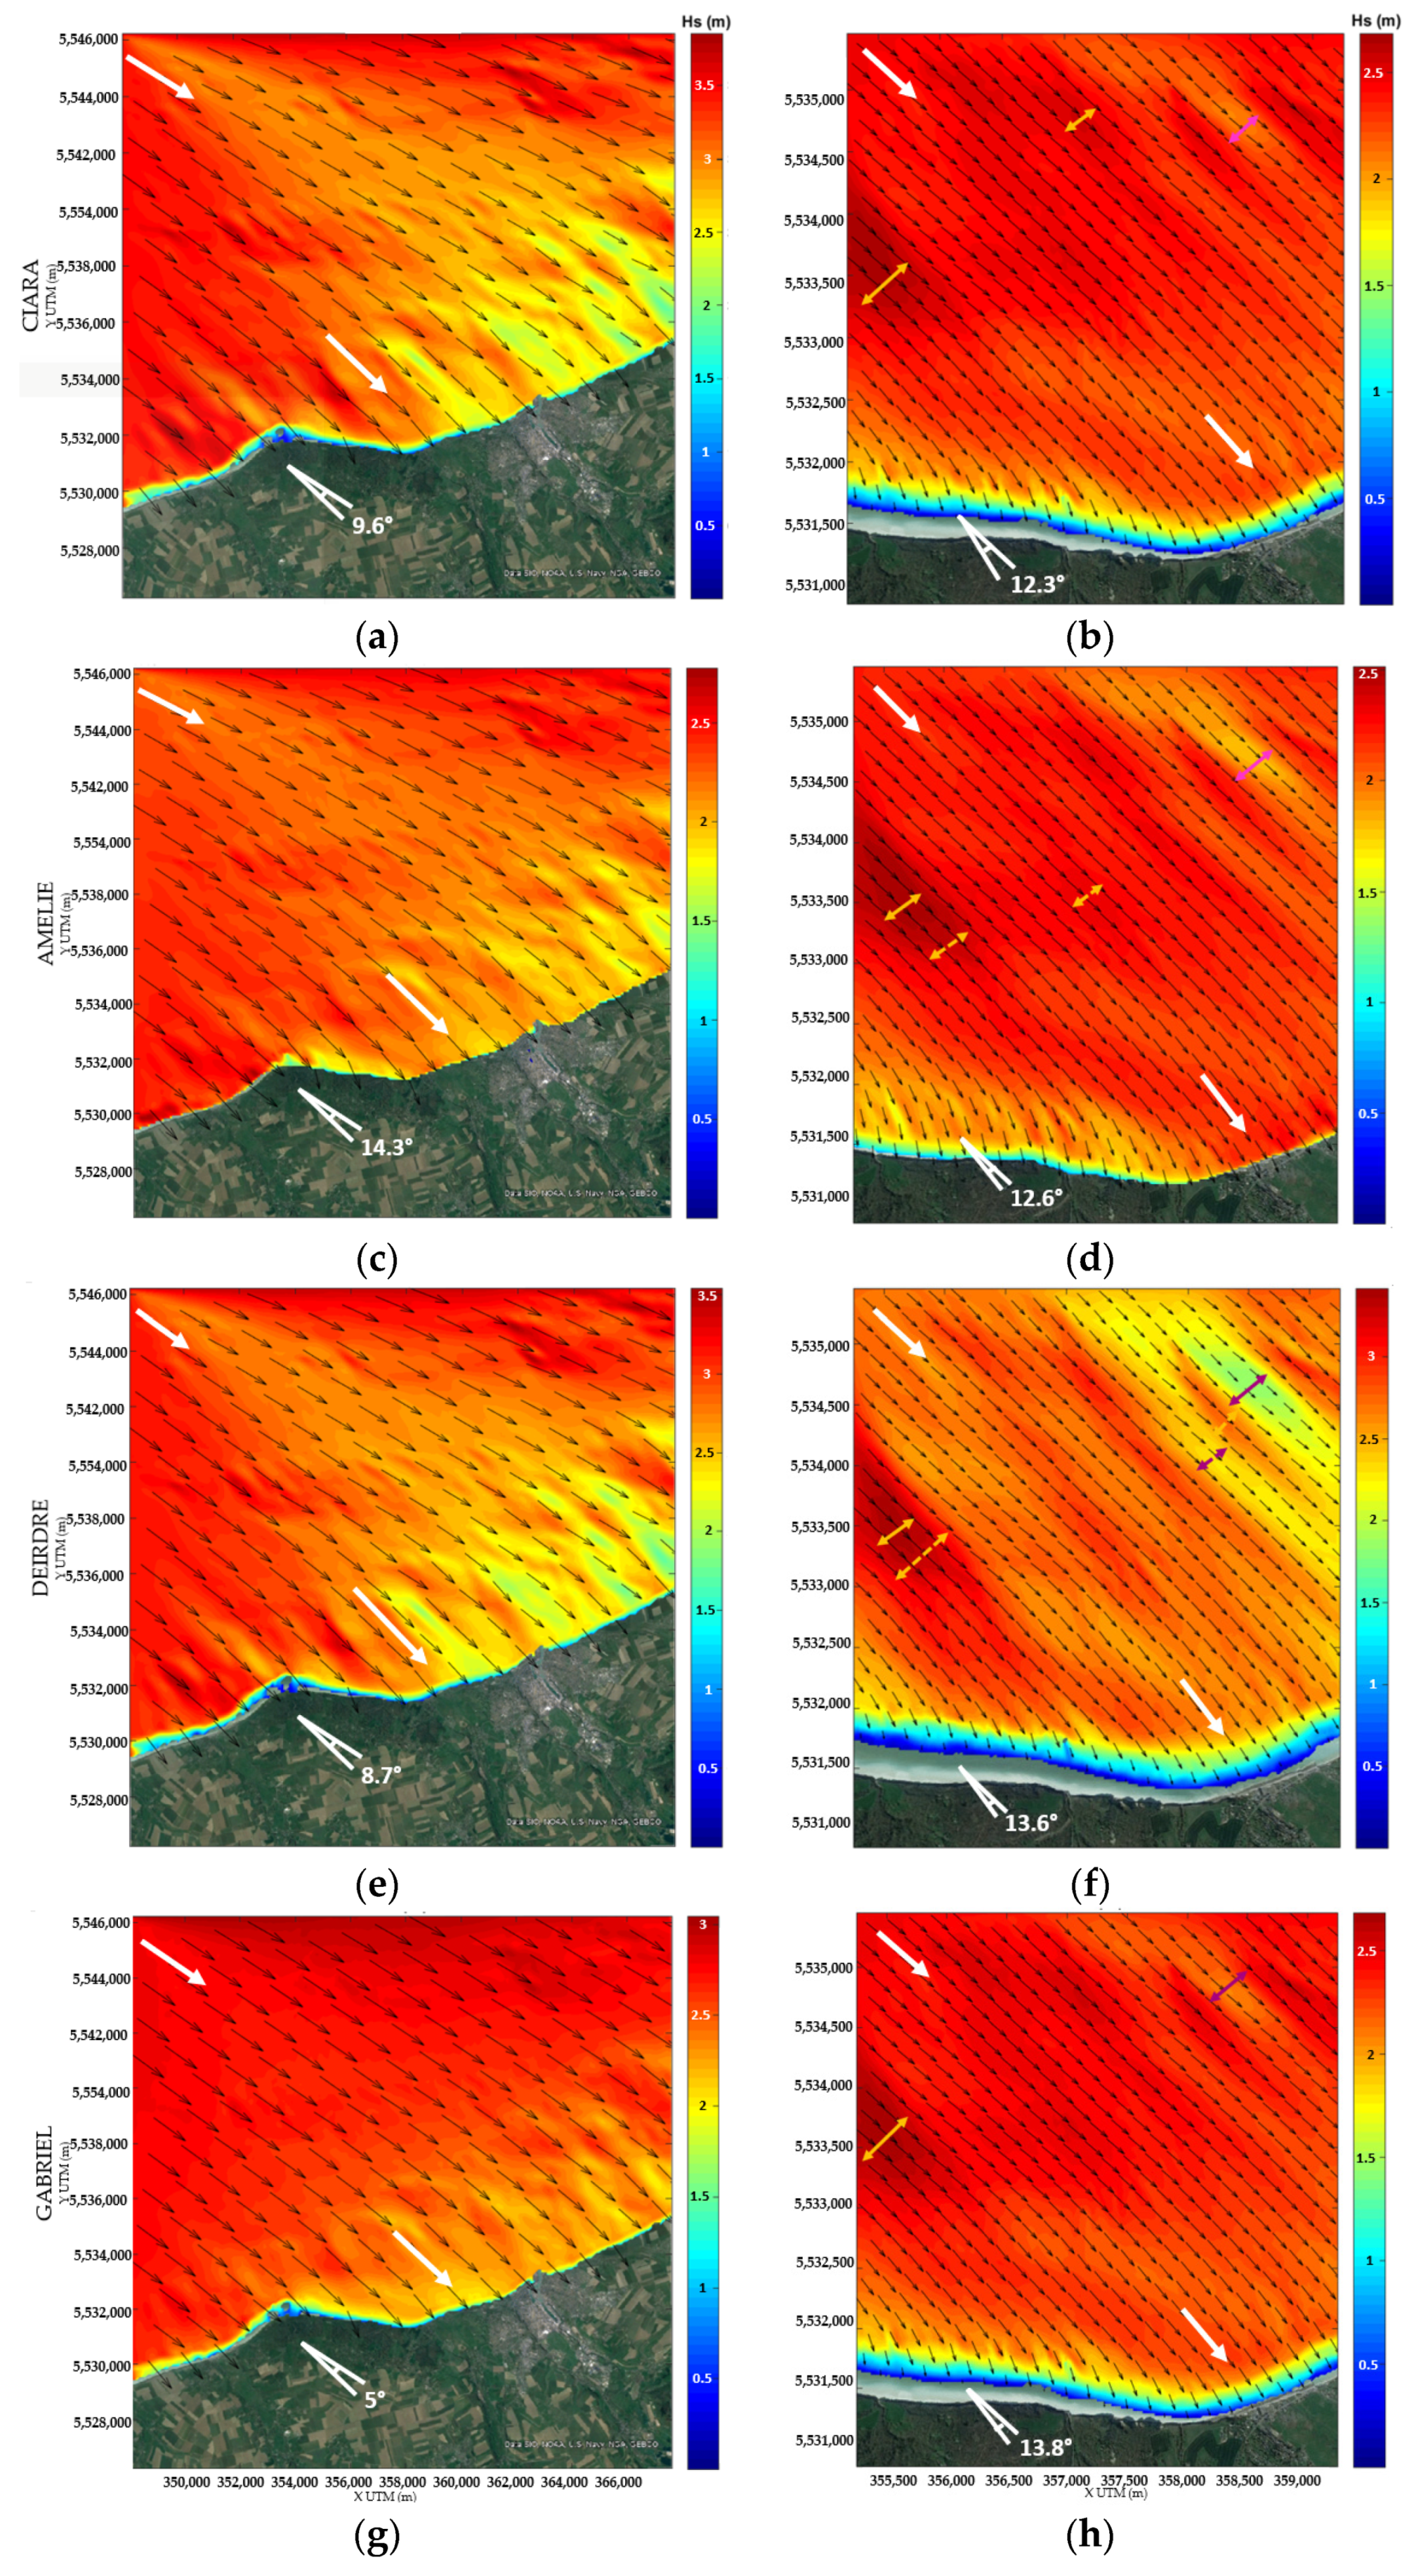
4.4. Storm Evolution in Normandy Coasts: Case of Etretat and Hautot-sur-Mer

At shallow waters, the energy of nearshore waves is dissipated close to Normandy coasts. More than 50% is reduced at Hautot-sur-Mer and Etretat with a mean of 70% and 85%, respectively. This amount of dissipation is higher than 90% for storms produced at spring tides. The wave dissipation seems to be not homogenous along the coastal zones with an H s gradient strongly influenced by changes in the morphology of sea bottom and the coastal geometry.
Indeed, the wave gradients at Hautot-sur-Mer (Figure 7) take different distributions between the western and the eastern side with an increasing and decreasing wave height, respectively. Such changes are mainly controlled by the presence of sandbanks and irregularities of the bathymetric responsible for wave refraction.
A clear example is observed for the line of 10 m of depth (see Figure 3), which is approximately 1.5 km and 3 km away from the shoreline in the western and the eastern side, respectively. Similar irregularities between both sides are also observed for the bathymetric line 20 which is far from the shoreline with a distance varying between 5 km and 7 km. Such a configuration exhibits changes in the morphological slope which are limited to 0.2% between 10 m and 20 m of depth and increases to 0.45% between the shoreline and 10 m of depth. Then, waves are bigger close to the soft slope while they break when the slope is steeper, which is the case for storms occurred during high tides. Here, the breaking depth ranges from 4.5 m for the biggest waves to less than 1 m for the smallest. For the studied storms, this depth is 3–4 m.
Some changes in θ H s , p e a k from deep waters to shallow areas are observed. Waves, coming from deep waters, are refracted twice at the intermediate and the shallow areas, respectively. The first refraction, with an average value of 10° degrees for the storms studied, is less pronounced than the second one, given that the second refraction reaches a mean value of 13°. This is due to the configuration of the bathymetry at the bottom of the sea (Figure 3). The first refraction makes all the waves turn into the SE direction, increasing this shift inside the same sector by strengthening the southern component with the second refraction.
The wave dissipation is differently manifested at Etretat beach, considered as a pocket beach, where nearshore waves are diffracted close to rocky structures limiting the beach cell (Figure 8). Such geometry is mainly responsible for the reduction of the H s and a regular bathymetric configuration parallel to the shoreline. Contrary to Hautot-sur-Mer, no sandbanks or bathymetric irregularities are highlighted. For this zone, changes in morphological slope are mainly observed between the center of Etretat bay and the East and West boundary areas with 1.5% and 0.3%, respectively.
This almost flat zone produces waves going unaltered over it, lacking any increasing or decreasing on the H s , m a x , especially since these depths are the ones causing the shoaling process.
θ H s , p e a k also changes in Etretat with two different refractions in intermediate and in shallow waters. The first refraction, with an average of 7°, is more pronounced than the second one, since this second one is half of it, with a mean of 3.5°.
For this location, no matter where the storms come from, during the first refraction, θ H s , p e a k tends towards the E-ESE sectors and, during the second, almost exclusively to the ESE sector. The presence of the Cotentin Peninsula limits the range of directions where storms can come from in Etretat, being more to the South and closer to the Peninsula with respect to Hautot-sur-Mer. Hence, the change in direction can be explained considering this fact alongside the bathymetry.
In the light of these results, the configuration of the bottom morphology has a key role in generating variability in the wave height, which is largely observed in Hautot-sur-Mer beach where the wave gradient is significant. The energy dissipation is significant while Etretat is more exposed to storms coming from the Atlantic Ocean. In Hautot-sur-Mer, further from the ocean, storms were losing strength due to bottom friction and other processes, and they arrive with a smaller wave height. The bedrock, the enclosed beach and the presence of the cliffs play an important role in the dissipation of energy and wave gradient when they approach the coast.
Considering changes in θ H s , p e a k , refractions produced on both sites are manifestly different because of some characteristics in the morphology of the beaches. The main reason is the orientation of the shoreline with respect to the North as described above. The shoreline in Etretat presents an inclination of 47° clockwise. However, the shoreline in Hautot-sur-Mer is more oriented to the East, with an inclination of 71°. This difference produces bigger refraction of the waves when approaching to Hautot-sur-Mer, especially offshore, since waves tend to acquire the orthogonal direction to the bathymetric lines and when they are close to the coast, they have already obtained it, considering also that all the storms studied and most of the storms arriving at these coasts come from the Atlantic Ocean. These characteristics condition the range of θ H s , p e a k . In Hautot-sur-Mer, it is in the range of 15°, and in Etretat only 8°.

5. Discussion

This work uses wave datasets and a simulation with SWAN numerical model to investigate the dynamics of waves transformation during a period of 26 months. An analysis of the evolution of these different datasets was carried out in the spectral domain investigating the frequencies of wave height and mean direction and in relation to the spatial distribution of the hydrodynamics. The main focus is devoted to different storm events at two spatial scales: a regional scale, the English Channel, and a local scale close to Normandy coasts, on the sites of Etretat and Hautot-sur-Mer.
Simulated data were validated with buoy measurements employed at shallow areas (depth of 10–11 m) to corroborate that the databases generated are utilizable both in this work and for further studies. Error metrics were estimated for the significant wave height. The comparison of modeling results with the buoy measurements for each location showed that waves are accurately reproduced for the simulated period, with a good correlation coefficient of 92% and 96% for Etretat and Hautot-sur-mer, respectively.
This correlation is limited at Etretat, where the hydrodynamics and the measurements of the buoy are partly influenced by the hydrological effects of the Seine River. The measured waves, extracted from the SCENES buoy, should be modulated by marine surges and hydrological discharge. The variability of the stochastic component of water level in Seine Bay was investigated by Turki et al. [48]. They have demonstrated that its variability is induced by the combining effects of local-driven forces with meteorological, oceanographic and hydrological origins. This activity is largely observed during flooding periods.
In this work, the directional wave spectrum was investigated in the different scales mentioned, from the English Channel to the Normandy coasts, using frequency analyses. Results exhibit that waves are modulated and change in their spectrum at shallow water areas evolving a possible energy transfer between the wave frequencies induced by their physical transformation. Regarding the wave direction, its mainly controlled by sea and swell waves at the North Sea, with a large spectral width from high to low frequencies. This width does not show significant changes at the intermediate waters on the Channel while it is deeply modified close to Etretat and Hautot-sur-Mer after the physical transformation of waves. Their refraction is similarly produced and modified for all waves coming from different directions at deep waters.
The energy transfer between the frequencies of wave height was also investigated in previous works [49]. Abroug et al. have studied in the laboratory the non-linear wave–wave interactions in the littoral zone using the bispectral analysis. They demonstrated that the phase coupling increases gradually and approaches one just prior to breaking, accordingly with the spectrum broadening and the energy increase in high-frequency components. They analyzed waves downstream breaking, however breaking zone is the limit of the present study when waves are approaching the coast.
In contexts with strong tidal dynamics, such as the coasts of Normandy, the wave climate is generally modulated by the wave–tide interaction exhibiting changes in its spectrum; a very important process that should be considered in flood risk assessments. An example of wave–tide interaction effects on coastal hazards was outlined in the works of Lewis et al. [50] where the risk of coastal flooding by extreme waves in the Irish Sea is investigated. They have highlighted that the tidal dynamics have a key role in the nearshore wave climate at shallow areas of around 10 m of depth and water wave heights with 20% larger in some regions, which proves to have a clear implication in coastal hazards. They have also shown that the sea-level rise influences the extreme wave height, i.e., during stormy events as the 10 events analyzed, with a 5% increase in hazardous areas.
In the present work, the evolutions of wave height and direction during each storm were considered to study the different characteristics of coastal extreme events. The characteristics highlighted were defined from a 26-month period of waves, which is useful and distinctive enough for an overview of the storm events in the English Channel, and particularly on the Normandy coasts, but not fully representative of the different hydrodynamic conditions of the zone. In a longer period, more variations will show up and provide other information to be able to identify some additional patterns in the behavior of extreme events.
For the 10 storms identified, the distribution and the persistence of the high values in the time series of wave height and mean direction were investigated. A joint analysis of the frequencies of occurrence of the maxima, alongside the maximum values themselves and the deviation from the mean, allowed us to appreciate the possible risk associated with the different storms. A combination of a high peak in wave height that is persistent in time implies a greater impact on the coast, as it happened during the storm Deirdre. In the same way, Ciara showed a low occurrence of its maximum values, but it was explained because of an elevated deviation, producing a hazardous scenario too.
Other parameters could have been highlighted and deeply analyzed such as the duration [51] of the event and also the associated extreme surges [52,53].
Martzikos et al. [51] defined a storm in a different way to the present study, as the event exceeding a minimum significant wave height with certain minimum duration. They have considered that the thresholds for the wave height, the duration and the calm period between two successive storms vary depending on the area of interest. Applying their definition to the period of time studied in this work in the English Channel, a similar number of storms can be identified. Their classification was achieved with cluster analysis based on the storm energy and the storm period and validated via appropriate indices related to their impacts on the coastal area.
Then, Turki et al. [53] used the extreme surges in the English Channel and along the Normandy coasts to identify the historical storms, their impacts and their physical relationship with the large climate oscillations.
In this context, and in a nearby area, the West coast of France, Bertin et al. [52] investigated the storm-induced coastal flooding associated with Xynthia that severely damaged the central part of the Bay of Biscay in February 2010 using a numerical approach of a 2DH fully coupled modeling applied to the North-East Atlantic Ocean. They demonstrated the impact of Xynthia on coastal areas with anthropogenic activities, including a simulation increasing the height of the dikes and barriers in the study area responsible for disabling floods.
After an analysis of the evolution and transformation of waves from the English Channel to the Normandy coasts, a numerical simulation with SWAN allowed for obtaining a database nearshore to complete the study. Wave height gradients and wave direction refraction are clearly observed when the storms analyzed reach their maximum, modified by the sea bottom morphology and by the characteristic geometry of Normandy coasts, defined in this area by the presence of cliffs that enclose beaches along the shore.
The numerical approach used in the research is based on the structured version of SWAN, but it is also possible to use the unstructured grids for studies of wave propagations. In this case, we used structured grids, which implies the use of nested grids for obtaining a higher resolution in coastal areas. When using unstructured grids, mainly built on triangles, this becomes unnecessary, because the triangles, or any other kind of polygon used, are decreasing in size when approaching the coast so that they can provide a higher resolution and adapt to land boundaries. The use of coarse and nested grids in this study was the alternative chosen due to the available bathymetry data, with a low density of information on the external areas of our two locations and really dense bathymetry data obtained from LiDAR campaigns nearshore. The ratio when reducing the scale is linked to this increase in information on the available data, being appropriate for this study. Using an unstructured grid requires a higher computational cost, and propagating hour by hour during 26 months would have demanded a too long time.
As an example of this alternative, Guillou and Chapalain [20] have implemented an unstructured version of SWAN in the Sea of Iroise to assess the wave energy resource along coastal zones for an eight-year period (2004–2011). They have used numerical modeling to estimate the variability of wave power production conducted over the European shelf seas significant inter-seasonal and inter-annual evolutions of the resource in the Sea of Iroise.

6. Conclusions

The analysis of the directional wave spectrum in the different scales defined provides information on the behavior of waves in relation to their frequencies when they are propagated inside the English Channel and when they approach Normandy coasts. There is a modulation in the significant wave height spectrum resulting from wind sea and swell waves, related to an energy transfer between the wave frequencies induced by their physical transformation at shallow water areas. The variation in the mean direction spectrum is mainly explained by the wave refraction induced by changes in the sea bottom within the English Channel.
Considering the 10 storms analyzed, which are representative of the 26-month period simulated, in the scale of the Channel, the hazard is increased by a confluence of an elevated maximum wave height with a lasting persistence of high values in time, as was confirmed with the Deirdre or Ciara storms. On the scale of Normandy coasts, wave height is reduced by more than 50%. Both of the sites studied, Etretat and Hautot-sur-Mer, present beaches enclosed by cliffs, typical of the Normandy region. The wave height gradient is remarkably influenced by changes in the morphology of the sea bottom and the coastal geometry, also forcing refraction of waves that cannot occur as quickly as necessary in these locations to impact perpendicularly to the shoreline, this way avoiding the worst scenario.
The implementation of a structured version of SWAN gives promising results for the quantification of the nearshore wave contribution in coastal flooding. However, this approach is not enough to fully resolve the physical processes close to the shoreline in response to storms, the case of the long-crested waves and their influence on the marine submersion, although that was not the aim of this research. Different models can deal with these limitations and provide more information from the breaking zone to the coast. Further works will be focused on the hydrodynamics at regional and local scales of the English Channel and the Normandy coasts by considering the interaction between waves and sea level, constituted by tide and surges. Resolving the infragravity waves and their impacts on the overwash at the shoreline and the overtopping close to maritime structures requires the use of new probabilistic and empirical approaches to avoid the overestimated coastal safety obtained using the statistical and numerical methods in current practice.
This finding is a first step to deeply understanding the modification of energy within the English Channel basin from deep water till nearshore using a phase-averaging model. It is also considered a key phase for coastal management strategies as well as engineering topics relying on one-way nesting. The impact close to the shoreline and over maritime structures, including the impact of infragravity waves, will be carried out by coupling these results, using high-computational phase-resolving models.

Author Contributions

Conceptualization, C.L.S., E.I.T. and A.S.; methodology, C.L.S., E.I.T. and A.S.; software, C.L.S., A.S. and Á.D.G.B.; validation, C.L.S., R.L. and S.C.; formal analysis, C.L.S. and E.I.T.; investigation, C.L.S., E.I.T. and A.S.; resources, B.L., E.I.T. and Y.H.; data curation, E.I.T., A.S. and S.C.; writing—original draft preparation, C.L.S., E.I.T. and A.S.; writing—review and editing, C.L.S., E.I.T., Y.H., A.S., S.C., B.L., Á.D.G.B., N.A., D.J. and R.L.; supervision, E.I.T., Y.H. and R.L.; project administration, Y.H., B.L. and R.L. All authors have read and agreed to the published version of the manuscript.

Funding

This research received no external funding.

Data Availability Statement

Datasets used for this study are confidential or need a request for obtaining them. Images from Lidar campaigns belong to ROL, and datasets used for validation belong to Ifremer, Cerema and EDF.

Acknowledgments

This Ph.D. research is acknowledged to the partners Normandy Region, the Institute for Radiological Protection and Nuclear Safety (IRSN) and the Agence de l’Eau Seine Normandie (AESN). We are grateful to the international project SWOT 3MC funded by CNES-TOSCA and related to the future mission of Surface Water and Ocean Topography (SWOT). We also acknowledge the Observation Network of the Coast of Normandy and Hauts-de-France (ROL), the European Marine Observation and Data Network (EMODnet) Bathymetry portal, the French Institute for the Research and the Exploitation of the Sea (Ifremer), Cerema and the French Electricity Company (EDF) for providing datasets used for the set-up of the model and for validation. We greatly thank the reviewers and the editors of the Journal of Water for their useful suggestions to improve the manuscript.

Conflicts of Interest

The authors declare no conflict of interest.

References

  1. Liu, M.; Smith, J.A.; Yang, L.; Vecchi, G.A. Tropical cyclone flooding in the Carolinas. J. Hydrometeorol. 2021, 23, 53–70. [Google Scholar] [CrossRef]
  2. Neumann, B.; Vafeidis, A.T.; Zimmermann, J.; Nicholls, R.J. Future coastal population growth and exposure to sea-level rise and coastal flooding-A global assessment. PLoS ONE 2015, 10, e0118571. [Google Scholar] [CrossRef] [PubMed] [Green Version]
  3. Liu, C.; Jia, Y.; Onat, Y.; Cifuentes-Lorenzen, A.; Ilia, A.; McCardell, G.; Fake, T.; O’Donnell, J. Estimating the annual exceedance probability of water levels and wave heights from high resolution coupled wave-circulation models in long island sound. J. Mar. Sci. Eng. 2020, 8, 475. [Google Scholar] [CrossRef]
  4. McInnes, K.L.; Walsh, K.J.E.; Hubbert, G.D.; Beer, T. Impact of sea-level rise and storm surges in a coastal community. Nat. Hazards 2003, 30, 187–207. [Google Scholar] [CrossRef]
  5. O’Donnell, J.; Whitney, M.; Strobel, K.H. A Study of Coastal Flooding at Jarvis Creek; Connecticut LIS PO Review View Project Sea Level Rise View Project. 2016. Available online: https://www.researchgate.net/publication/311583802_A_Study_of_Coastal_Flooding_at_Jarvis_Creek_Connecticut (accessed on 15 December 2021).
  6. Wolf, J.; Woolf, D.K. Waves and climate change in the north-east Atlantic. Geophys. Res. Lett. 2006, 33, L06604. [Google Scholar] [CrossRef] [Green Version]
  7. Komen, G.J.; Cavaleri, L.; Donelan, M.; Hasselmann, K.; Hasselmann, S.; Janssen, P.A.E.M. Dynamics and Modelling of Ocean Waves; Cambridge University Press: Cambridge, UK, 1994. [Google Scholar] [CrossRef]
  8. Hasselmann, K.; Bauer, E.; Janssen, P.A.E.M. The WAM model-a third generation ocean wave prediction model. J. Phys. Oceanogr. 1988, 18, 1775–1810. [Google Scholar] [CrossRef]
  9. Tolman, H.L. Distributed-memory concepts in the wave model WAVEWATCH III. Parallel Comput. 2002, 28, 35–52. [Google Scholar] [CrossRef]
  10. Tolman, H.L. Validation of WAVEWATCH III Version 1.15 for a Global Domain; Environmental Modeling Center: College Park, MD, USA, 2002. [Google Scholar]
  11. Tolman, H.L. User Manual and System Documentation of WAVEWATCH III TM Version 3.14; NOAA/NWS/NCEP/OMB Technical Note; 2009; Volume 276, 194p. Available online: https://polar.ncep.noaa.gov/mmab/papers/tn276/MMAB_276.pdf (accessed on 15 December 2021).
  12. Booij, N.; Ris, R.C.; Holthuijsen, L.H. A third-generation wave model for coastal regions 1. Model description and validation. J. Geophys. Res. Ocean. 1999, 104, 7649–7666. [Google Scholar] [CrossRef] [Green Version]
  13. Camus, P.; Mendez, F.J.; Medina, R. A hybrid efficient method to downscale wave climate to coastal areas. Coast. Eng. 2011, 58, 851–862. [Google Scholar] [CrossRef]
  14. Lewis, H.W.; Manuel Castillo Sanchez, J.; Siddorn, J.; King, R.R.; Tonani, M.; Saulter, A.; Sykes, P.; Pequignet, A.C.; Weedon, G.P.; Palmer, T.; et al. Can wave coupling improve operational regional ocean forecasts for the north-west European Shelf? Ocean. Sci. 2019, 15, 669–690. [Google Scholar] [CrossRef] [Green Version]
  15. Saulter, A.N.; Bunney, C.; King, R.R.; Waters, J. An Application of NEMOVAR for Regional Wave Model Data Assimilation. Front. Mar. Sci. 2020, 7. Available online: https://www.frontiersin.org/articles/10.3389/fmars.2020.579834/full (accessed on 15 December 2021). [CrossRef]
  16. Skliris, N.; Marsh, R.; Srokosz, M.; Aksenov, Y.; Rynders, S.; Fournier, N. Assessing extreme environmental loads on offshore structures in the North Sea from high-resolution ocean currents, waves and wind forecasting. J. Mar. Sci. Eng. 2021, 9, 52. [Google Scholar] [CrossRef]
  17. Caires, S.; Sterl, A.; Bidlot, J.-R.; Graham, N.; Swail, V. Intercomparison of Different Wind-Wave Reanalyses. J. Clim. 2004, 17, 1893–1913. [Google Scholar] [CrossRef]
  18. Cavaleri, L.; Sclavo, M. The calibration of wind and wave model data in the Mediterranean Sea. Coast. Eng. 2006, 53, 613–627. [Google Scholar] [CrossRef]
  19. Weisse, R.; von Storch, H. Marine Climate Change: Storms, Wind Waves and Storm Surges; Springer: Berlin/Heidelberg, Germany, 2010. [Google Scholar] [CrossRef]
  20. Guillou, N.; Chapalain, G. Numerical modelling of nearshore wave energy resource in the Sea of Iroise. Renew. Energy 2015, 83, 942–953. [Google Scholar] [CrossRef] [Green Version]
  21. Soloy, A.; Turki, I.; Fournier, M.; Costa, S.; Peuziat, B.; Lecoq, N. A deep learning-based method for quantifying and mapping the grain size on pebble beaches. Remote Sens. 2020, 12, 3659. [Google Scholar] [CrossRef]
  22. Soloy, A.; Turki, I.; Lecoq, N.; Gutiérrez Barceló, Á.D.; Costa, S.; Laignel, B.; Bazin, B.; Soufflet, Y.; le Louargant, L.; Maquaire, O. A fully automated method for monitoring the intertidal topography using Video Monitoring Systems. Coast. Eng. 2021, 167, 103894. [Google Scholar] [CrossRef]
  23. Shi, F.; Kirby, J.T.; Harris, J.C.; Geiman, J.D.; Grilli, S.T. A high-order adaptive time-stepping TVD solver for Boussinesq modeling of breaking waves and coastal inundation. Ocean Model. 2012, 43–44, 36–51. [Google Scholar] [CrossRef]
  24. Ning, Y.; Liu, W.; Zhao, X.; Zhang, Y.; Sun, Z. Study of irregular wave run-up over fringing reefs based on a shock-capturing Boussinesq model. Appl. Ocean. Res. 2019, 84, 216–224. [Google Scholar] [CrossRef]
  25. Levoy, F.; Anthony, E.J.; Monfort, O.; Larsonneur, C. The morphodynamics of megatidal beaches in Normandy, France. Mar. Geol. 2000, 171, 39–59. [Google Scholar] [CrossRef]
  26. Jennings, R.; Shulmeister, J. A field based classification scheme for gravel beaches. Mar. Geol. 2002, 186, 211–228. [Google Scholar] [CrossRef]
  27. Modélisation et Analyse pour la Recherche Côtière. Available online: https://marc.ifremer.fr/ (accessed on 15 December 2021).
  28. Lazure, P.; Dumas, F. An external-internal mode coupling for a 3D hydrodynamical model for applications at regional scale (MARS). Adv. Water Resour. 2008, 31, 233–250. [Google Scholar] [CrossRef]
  29. Dumas, F.; Pineau-Guillou, L.; Lecornu, F.; le Roux, J.-F.; le Squère, B. General Introduction: PREVIMER, a French Pre-Operational Coastal Ocean Forecasting Capability. Available online: https://archimer.ifremer.fr/doc/00189/30037/2014. (accessed on 15 December 2021).
  30. Tolman, H.L. User Manual and System Documentation of WAVEWATCH III Version 1.15; NOAA/NWS/NCEP/OMB Technical Note; 1997; Volume 151, 97p. Available online: https://polar.ncep.noaa.gov/mmab/papers/tn151/OMB_151.pdf (accessed on 15 December 2021).
  31. Tolman, H.L. User Manual and System Documentation of WAVEWATCH-III Version 1.18; NOAA/NWS/NCEP/OMB Technical Note; 1999; Volume 166, 110p. Available online: https://polar.ncep.noaa.gov/mmab/papers/tn166/OMB_166.pdf (accessed on 15 December 2021).
  32. Tolman, H.L. The numerical model WAVEWATCH: A third-generation model for the hindcasting of wind waves on tides in shelf seas. Commun. Hydraul. Geotech. Eng. 1989, 89, 72. [Google Scholar]
  33. Tolman, H.L. Effects of numerics on the physics in a third-generation wind-wave model. J. Phys. Oceanogr. 1992, 22, 1095–1111. [Google Scholar] [CrossRef] [Green Version]
  34. WAVEWATCH III R Development Group (WW3DG). User Manual and System Documentation of WAVEWATCH III R Version 6.07; Tech. Note 333; NOAA/NWS/NCEP/MMAB: College Park, MD, USA, 2019; 465p. Available online: https://polar.ncep.noaa.gov/waves/wavewatch/ (accessed on 15 December 2021).
  35. Boussinesq, J. Théorie Analytique de la Chaleur; Gauthier-Villars: Paris, France, 1903; Volume II. [Google Scholar]
  36. Morton, I.D.; Bowers, J.; Mould, G. Estimating return period wave heights and wind speeds using a seasonal point process model. Coast. Eng. 1997, 3, 305–326. [Google Scholar] [CrossRef]
  37. Guedes Soares, C.; Scotto, M.G. Application of the r largest-order statistics for long-term predictions of significant wave height. Coast. Eng. 2004, 51, 387–394. [Google Scholar] [CrossRef]
  38. SWAN, Implementation Manual. Delft University of Technology, Environmental Fluid Mechanics Section. Available online: https://swanmodel.sourceforge.io/online_doc/swanimp/swanimp.html (accessed on 15 December 2021).
  39. EMODnet Bathymetry Portal. Available online: https://www.emodnet-bathymetry.eu/data-products (accessed on 12 December 2021).
  40. ROL (Réseau d’Observation du Littoral de Normandie et des Hauts-de-France). PHASE 2 Topographique et Orthophoto 2020. 2020. Available online: https://rolnp.maps.arcgis.com/apps/MapJournal/index.html?appid=727a93598d4a47a39af3ca01edf150f6 (accessed on 15 December 2021).
  41. Stopa, J.E.; Ardhuin, F.; Babanin, A.; Zieger, S. Comparison and validation of physical wave parameterizations in spectral wave models. Ocean. Model. 2016, 103, 2–17. [Google Scholar] [CrossRef] [Green Version]
  42. Labat, D. Recent advances in wavelet analyses: Part 1. A review of concepts. J. Hydrol. 2005, 314, 275–288. [Google Scholar] [CrossRef]
  43. Turki, I.; Laignel, B.; Kakeh, N.; Chevalier, L.; Costa, S. A new hybrid model for filling gaps and forecast in sea level: Application to the eastern English Channel and the North Atlantic Sea (western France). Ocean. Dyn. 2015, 65, 509–521. [Google Scholar] [CrossRef]
  44. Massei, N.; Dieppois, B.; Hannah, D.M.; Lavers, D.A.; Fossa, M.; Laignel, B.; Debret, M. Multi-time-scale hydroclimate dynamics of a regional watershed and links to large-scale atmospheric circulation: Application to the Seine River catchment, France. J. Hydrol. 2017, 546, 262–275. [Google Scholar] [CrossRef] [Green Version]
  45. Dodet, G.; Castelle, B.; Masselink, G.; Scott, T.; Davidson, M.; Floc’h, F.; Jackson, D.; Suanez, S. Beach recovery from extreme storm activity during the 2013–14 winter along the Atlantic coast of Europe. Earth Surf. Process. Landf. 2019, 44, 393–401. [Google Scholar] [CrossRef] [Green Version]
  46. Boudière, E.; Maisondieu, C.; Ardhuin, F.; Accensi, M.; Pineau-Guillou, L.; Lepesqueur, J. A suitable metocean hindcast database for the design of Marine energy converters. Int. J. Mar. Energy 2013, 3, e40–e52. [Google Scholar] [CrossRef] [Green Version]
  47. Ardhuin, F.; Roland, A.; Dumas, F.; Bennis, A.C.; Sentchev, A.; Forget, P.; Wolf, J.; Girard, F.; Osuna, P.; Benoit, M. Numerical wave modeling in conditions with strong currents: Dissipation, refraction, and relative wind. J. Phys. Oceanogr. 2012, 42, 2101–2120. [Google Scholar] [CrossRef]
  48. Turki, I.; Massei, N.; Laignel, B. Linking sea level dynamic and exceptional events to large-scale atmospheric circulation variability: A case of the Seine Bay, France. Oceanologia 2019, 61, 321–330. [Google Scholar] [CrossRef]
  49. Abroug, I.; Abcha, N.; Jarno, A.; Marin, F. European Geosciences Union. Hazards Earth Syst. Sci. 2020, 2020, 3279–3291. [Google Scholar] [CrossRef]
  50. Lewis, M.J.; Palmer, T.; Hashemi, R.; Robins, P.; Saulter, A.; Brown, J.; Lewis, H.; Neill, S. Wave-tide interaction modulates nearshore wave height. Ocean. Dyn. 2019, 69, 367–384. [Google Scholar] [CrossRef] [Green Version]
  51. Martzikos, N.; Afentoulis, V.; Tsoukala, V.K.; Martzikos, N.; Afentoulis, V.; Tsoukala, V. Storm clustering and classification for the port of Rethymno in Greece. Water Util. J. 2018, 20, 67–79. [Google Scholar]
  52. Bertin, X.; Li, K.; Roland, A.; Zhang, Y.J.; Breilh, J.F.; Chaumillon, E. A modeling-based analysis of the flooding associated with Xynthia, central Bay of Biscay. Coast. Eng. 2014, 94, 80–89. [Google Scholar] [CrossRef]
  53. Turki, I.; Massei, N.; Laignel, B.; Shafiei, H. Effects of Global Climate Oscillations on Intermonthly to Interannual Variability of Sea levels along the English Channel Coasts (NW France). Oceanologia 2020, 62, 226–242. [Google Scholar] [CrossRef]
Figure 1. Bathymetry map of the English Channel with the locations of the study sites (Etretat and Hautot-sur-Mer) the two buoys used for validation (in blue), the two points located in deep waters (North Sea and Atlantic Ocean) and the Reference point in intermediate waters. The latter three were used for studying the transformation of waves when getting inside the Channel and when approaching the study sites. Main geographical features are highlighted in yellow.
Water 14 00321 g001
Figure 2. Time series of significant wave height (Hs) from June 2018 to September 2020. The red dotted line represents the quantile 95, used as threshold for the identification of extreme events. The vertical red still lines locate in the time series the 10 storms used for the analysis of transformation of waves in this study.
Water 14 00321 g002
Figure 3. Coarse and nested grids, in white and red colors, respectively, for (a) Etretat and (b) Hautot-sur-Mer. DEMs of coarse grids in (c) Etretat and (d) Hautot-sur-Mer, and DEMs of nested grids in (e) Etretat and (f) Hautot-sur-Mer. Bathymetry data obtained from a merged DEM of EMODnet dataset and LiDAR campaign datasets. Satellite images from Google Earth.
Water 14 00321 g003
Figure 4. Significant wave height (Hs) comparison of results of simulations from the SWAN model versus observations measured by (a) SCENES buoy for Etretat and (b) campaign 07608 for Hautot-sur-Mer.
Water 14 00321 g004
Figure 5. Probability Density Functions (PDF) of H s (a) and of θ (b) and wave roses (c) at deep waters in the North Sea (depth = 44 m), the Atlantic Ocean (depth = 116 m), the Reference point (depth = 28 m), close to Etretat (depth = 13.4 m) and to Hautot-sur-Mer (depth = 13 m).
Water 14 00321 g005
Figure 6. Continuous Wavelet Transform (CWT) of H s (a) and θ (b) at deep waters in the North Sea, the Atlantic Ocean, the Reference point (depth = 28 m), close to Etretat (depth = 13.4 m) and Hautot-sur-Mer (depth = 13 m).
Water 14 00321 g006
Figure 7. Distribution maps at the peak of the storm of H s and θ in the coarse grid (a,c,e,g) and nested grid (b,d,f,h) in Hautot-sur-Mer for Ciara (February 2020) (a,b), Amelie (November 2019) (c,d), Deirdre (December 2018) (e,f) and Gabriel (January 2019) (g,h) storms. White arrows show the refraction of waves when approaching to coast.
Water 14 00321 g007
Figure 8. Distribution maps at the peak of the storm of H s and θ in the coarse grid (a,c,e,g) and nested grid (b,d,f,h) in Etretat for Ciara (February 2020) (a,b), Amelie (November 2019) (c,d), Deirdre (December 2018) (e,f) and Gabriel (January 2019) (g,h) storms. White arrows show the refraction of waves when approaching to coast.
Water 14 00321 g008
Table 1. Summary of characteristics of the 10 storms in the Reference point selected from June 2018 to September 2020 with the duration, the wave height H s , m a x , the mean direction θ H s , p e a k , the occurrences of H s , m a x and θ H s , p e a k , and the standard deviation of H s , s t o r m and θ s t o r m .
StormDuration (Days) H s , m a x   ( m ) θ H s , p e a k   ( ° ) Occurrence   H s , m a x   ( % ) Occurrence   θ H s , p e a k   ( % ) Standard   Deviation   H s , s t o r m   ( m ) Standard   Deviation   θ s t o r m   ( ° )
Ali2.13.25274.69290.89.3
Deirdre6.64.43276.27481.2418.26
Gabriel4.53.5293.33170.8824.68
Gareth2.14.02274.46150.98.83
Hannah3.33.55274.38321.16.89
Lorenzo1.83.94271.84140.8313.39
Amelie2.73.81259.37321.1139.68
Atiyah2.74.46280.66121.1117.16
Ciara4.45.332763431.2612.11
Francis2.53.93268.19371.1213.56
Publisher’s Note: MDPI stays neutral with regard to jurisdictional claims in published maps and institutional affiliations.

