
Hydrogeochemical and Isotopic Characteristics of the Hot Springs in the Litang Fault Zone, Southeast Qinghai–Tibet Plateau

 , , ,
, , ,
Abstract
:1. Introduction
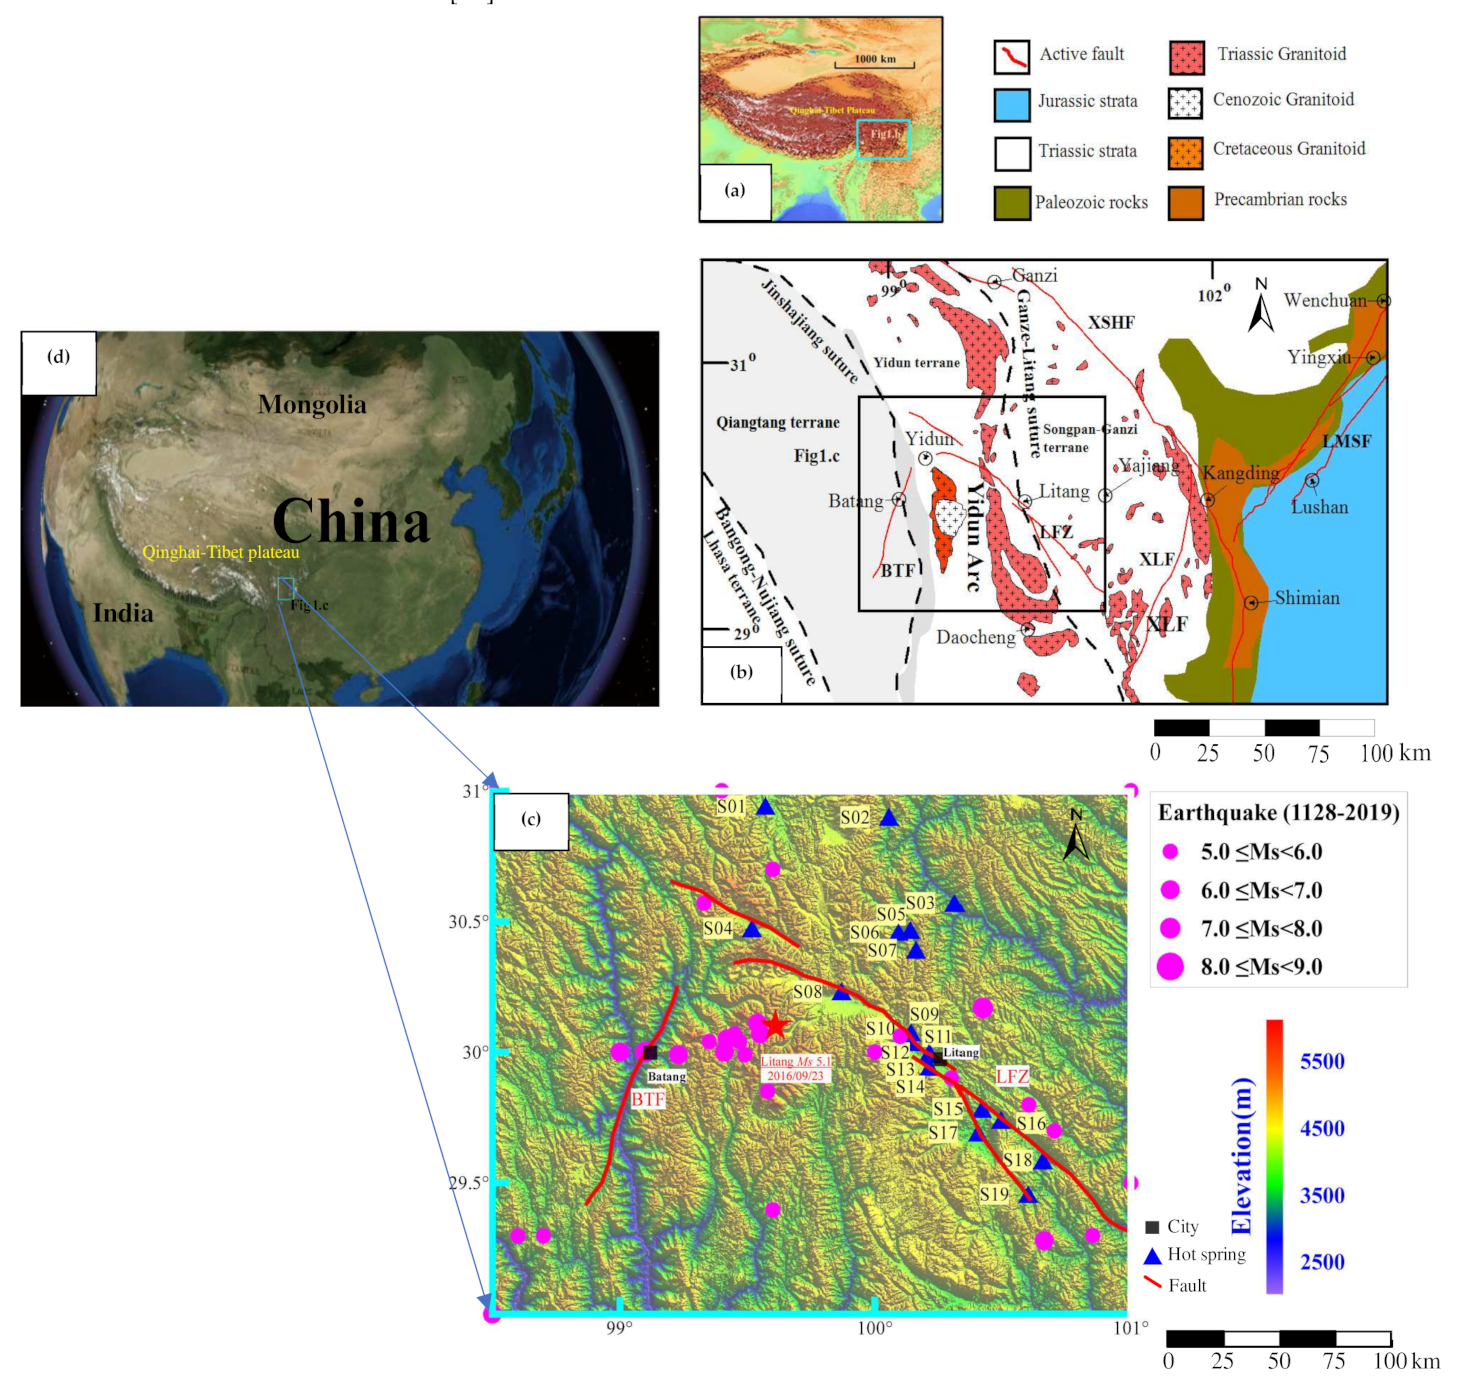
2. Seismogeological Setting
3. Sampling and Methods
3.1. Sampling
3.2. Methods
3.3. Data Processing
4. Results
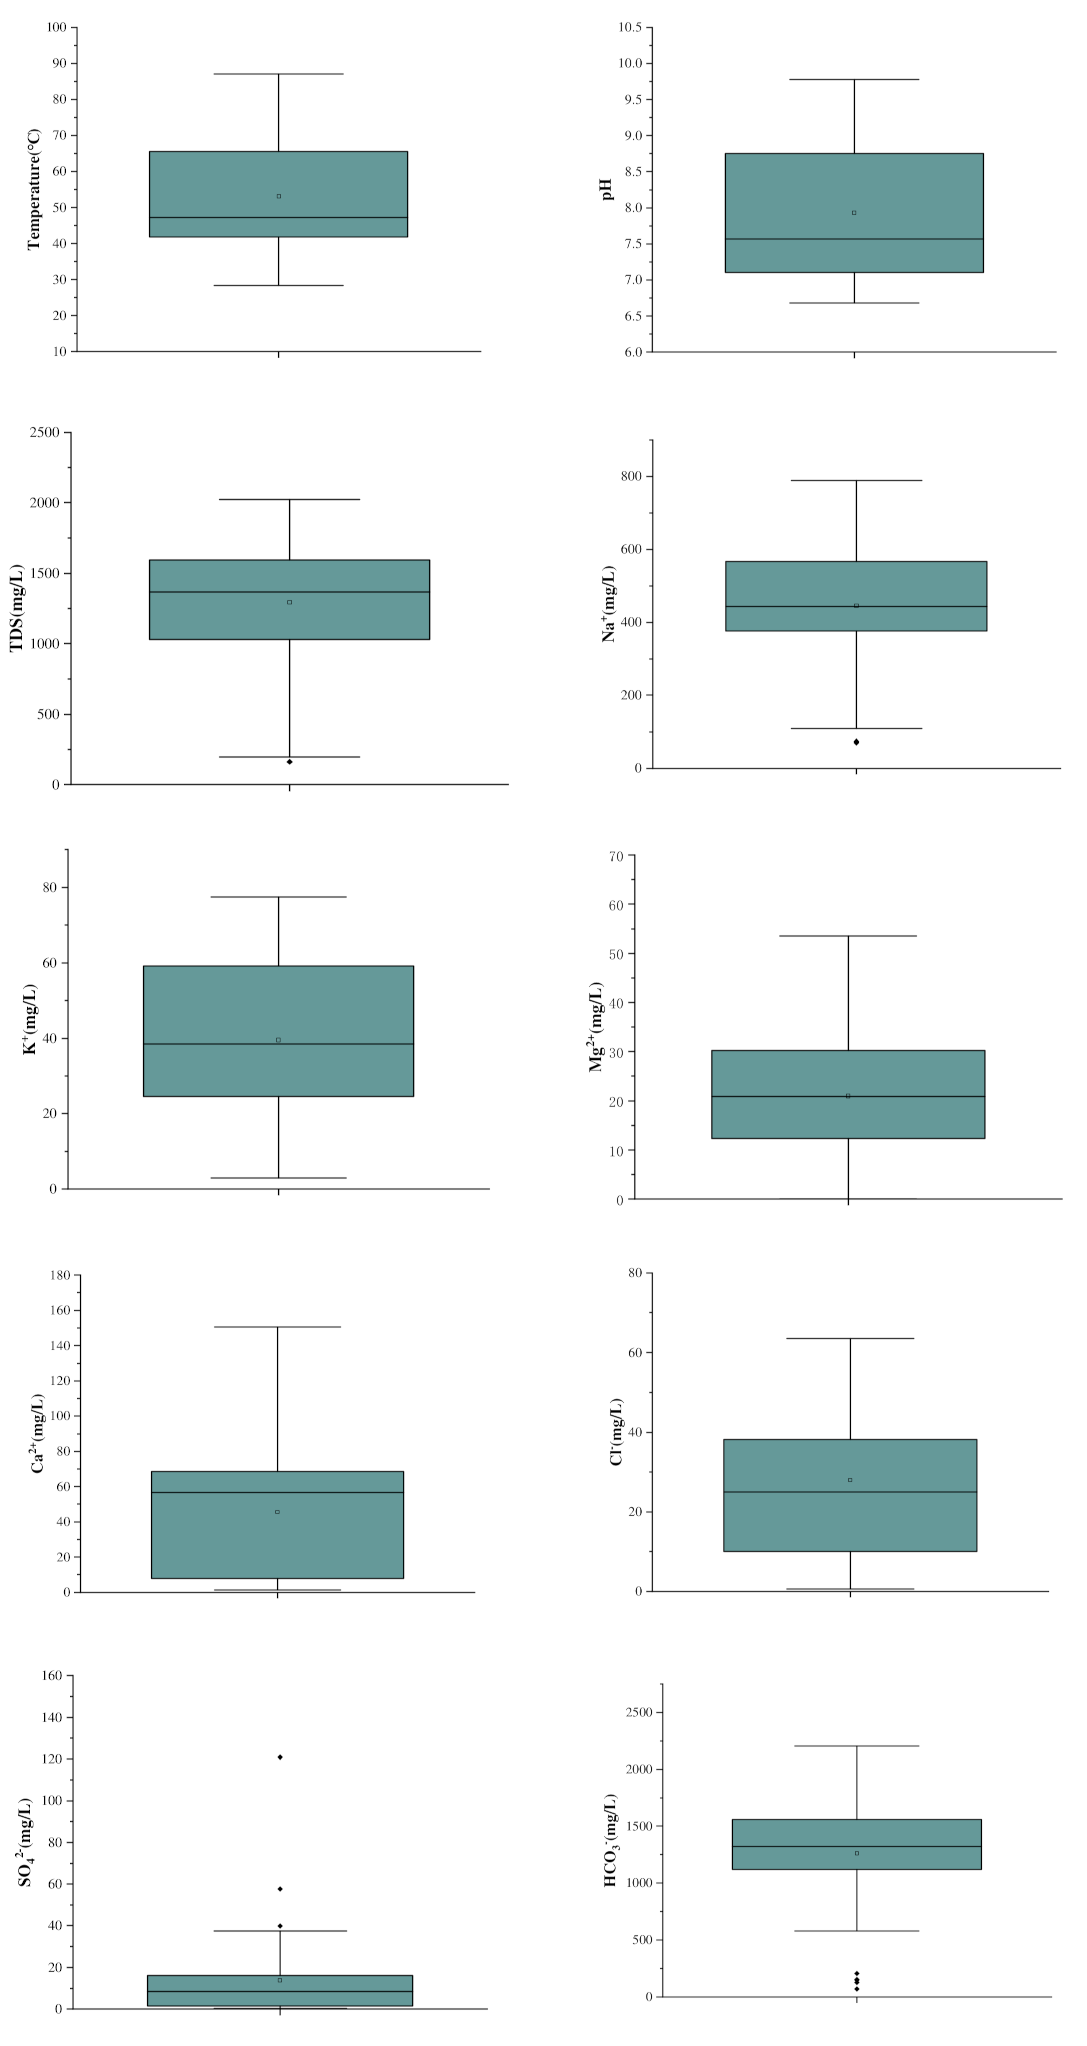
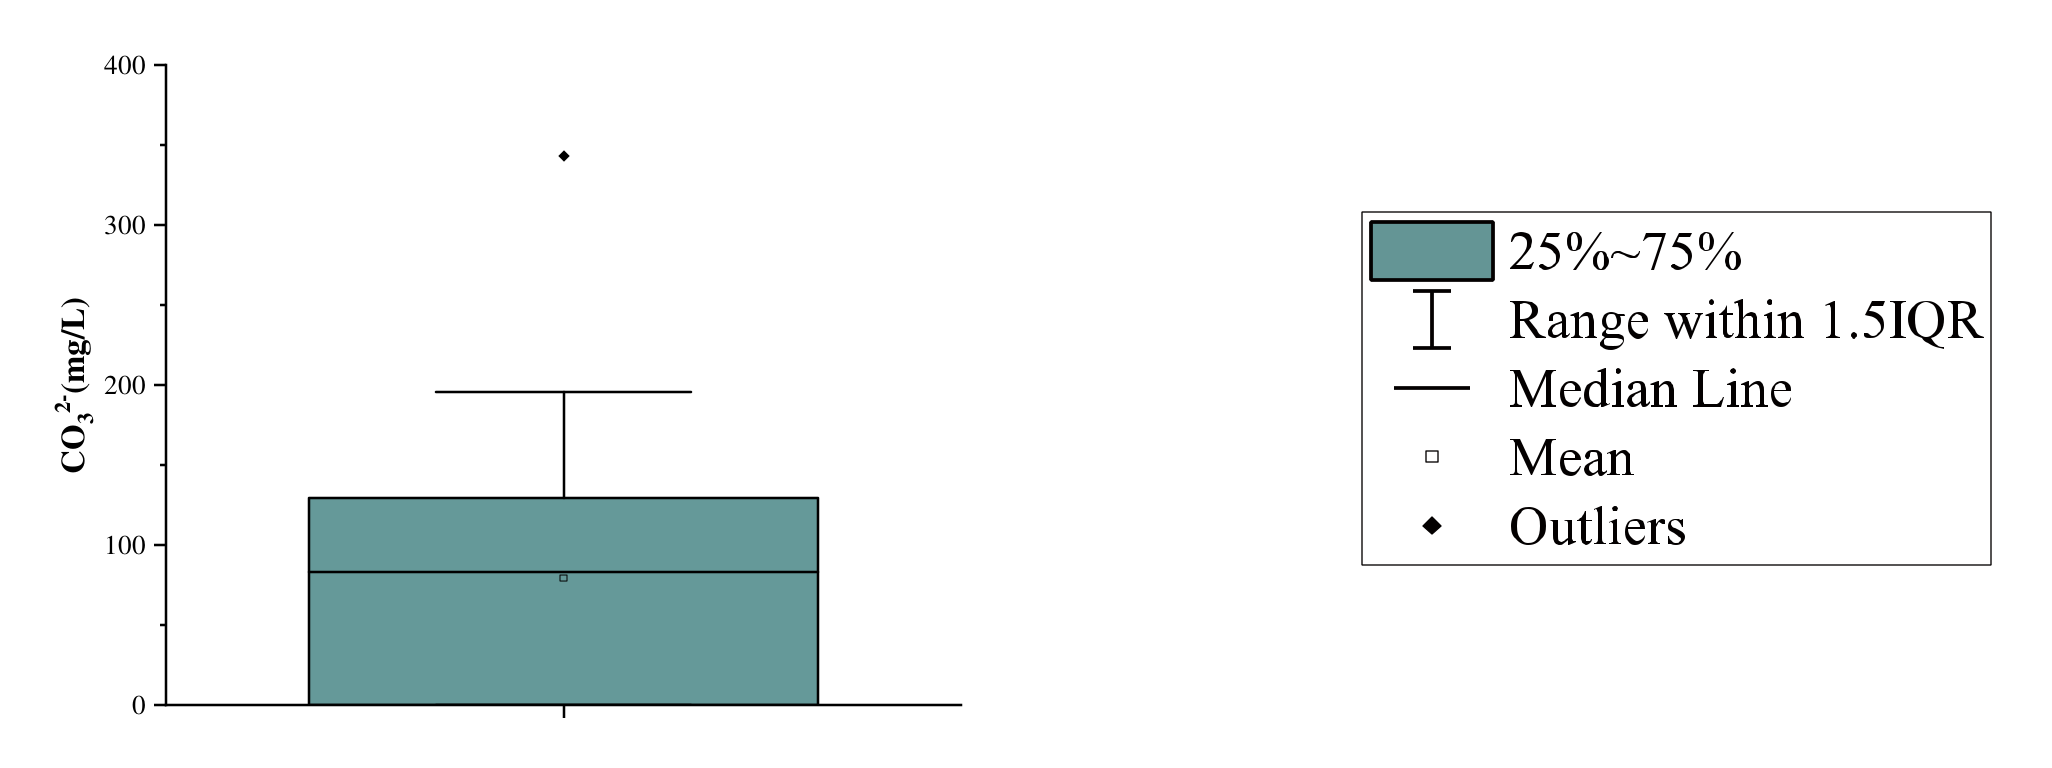
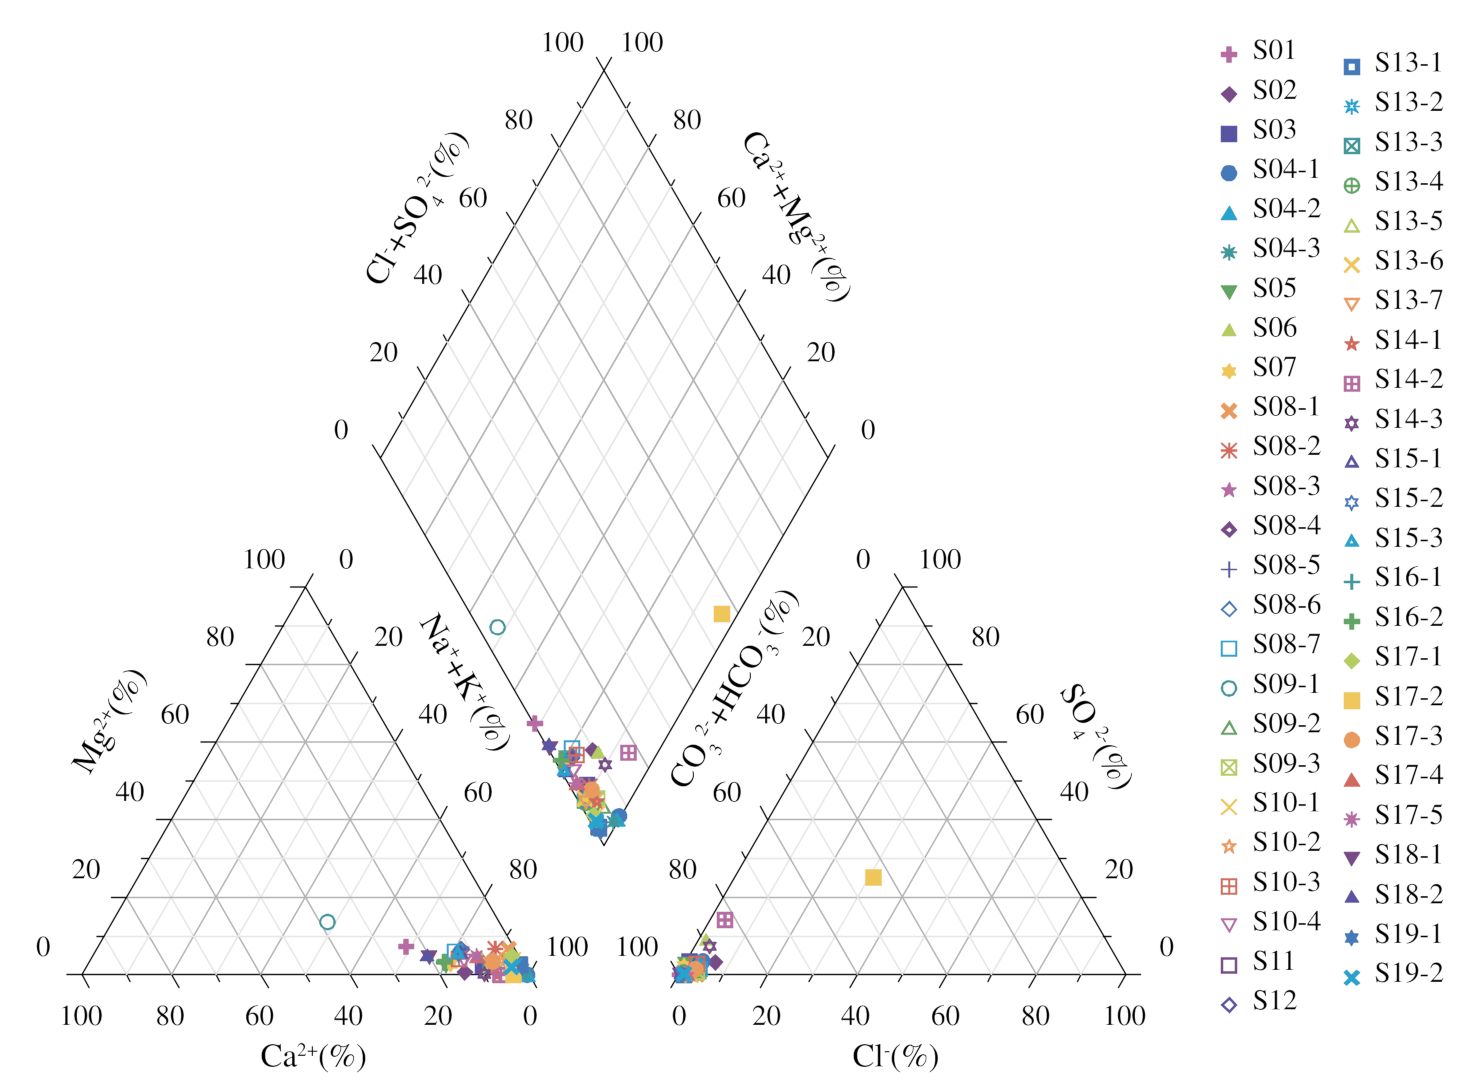
4.1. Hydrogeochemical Characteristics
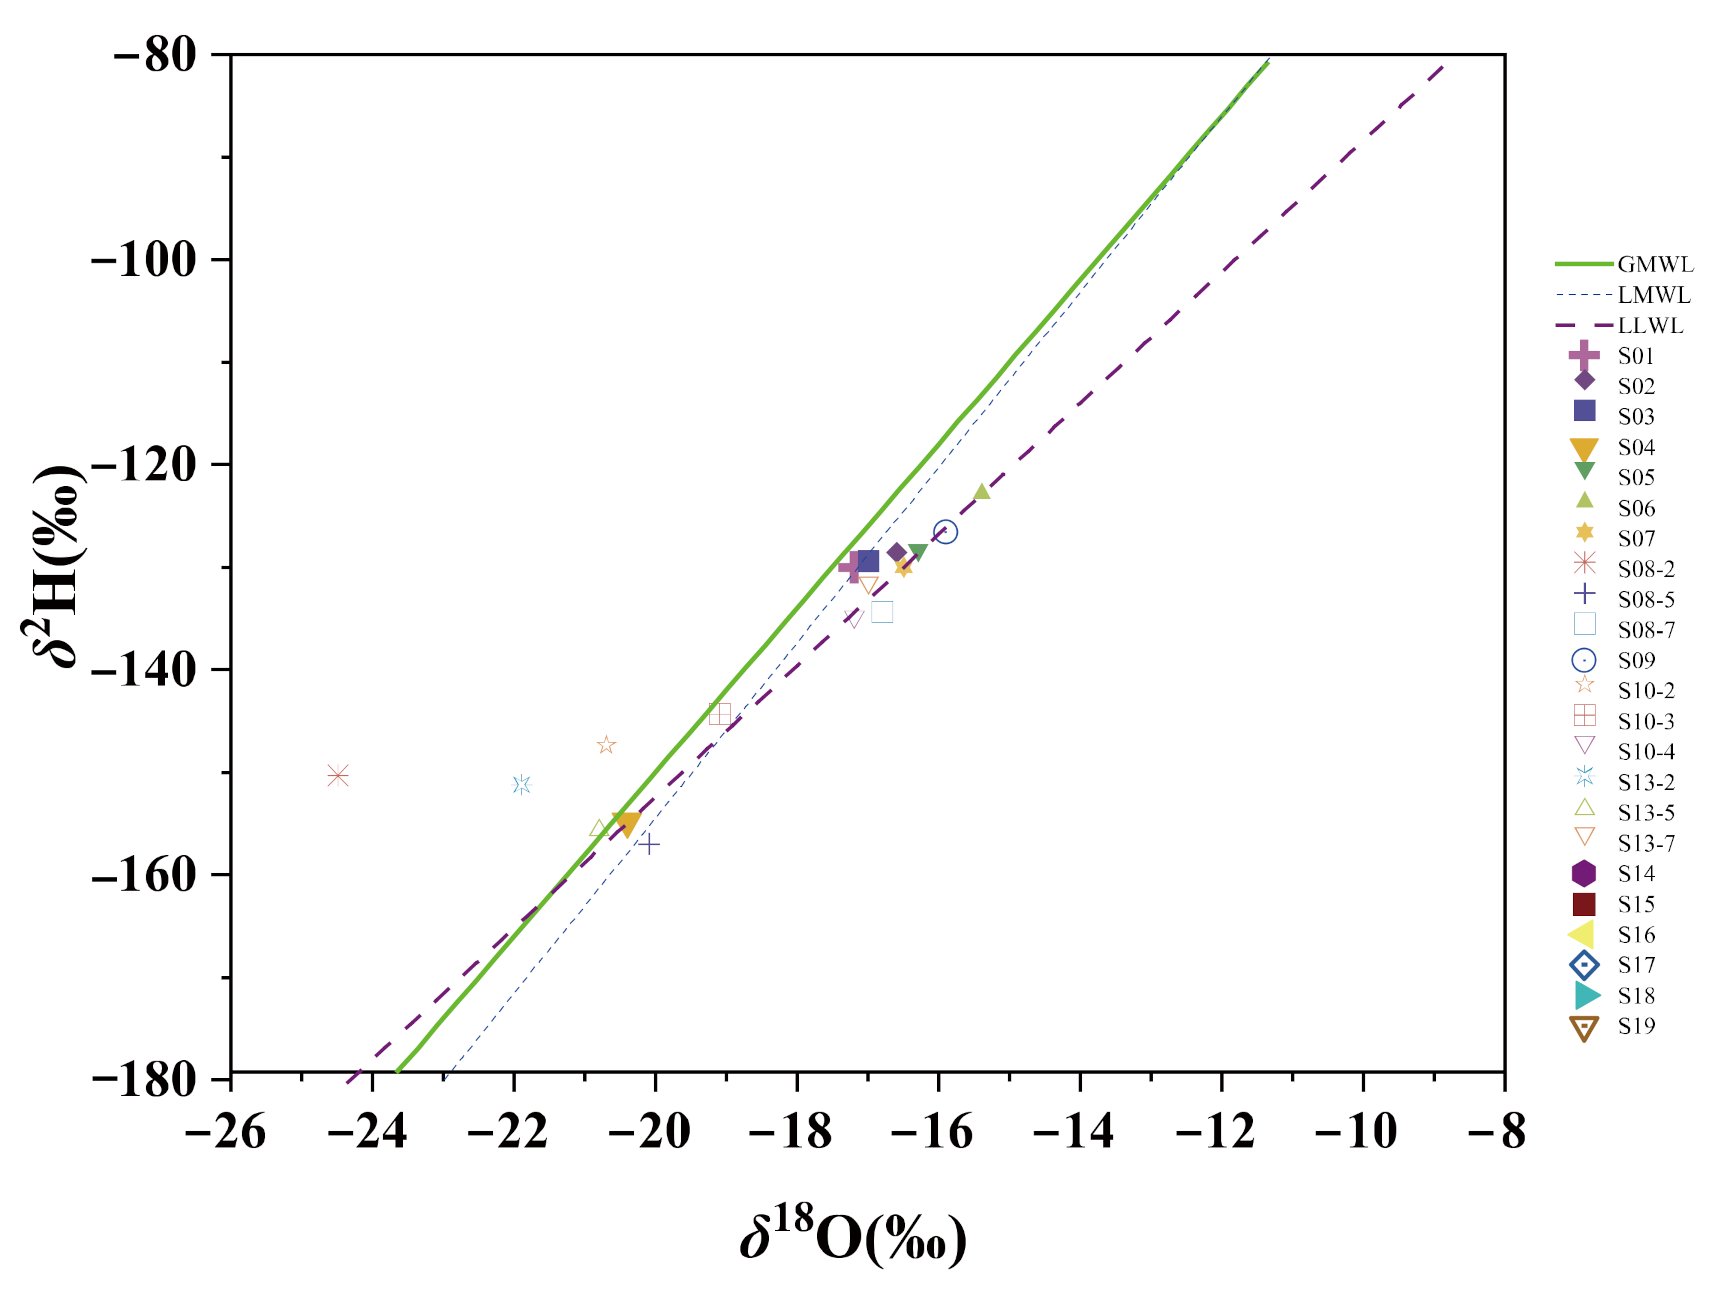
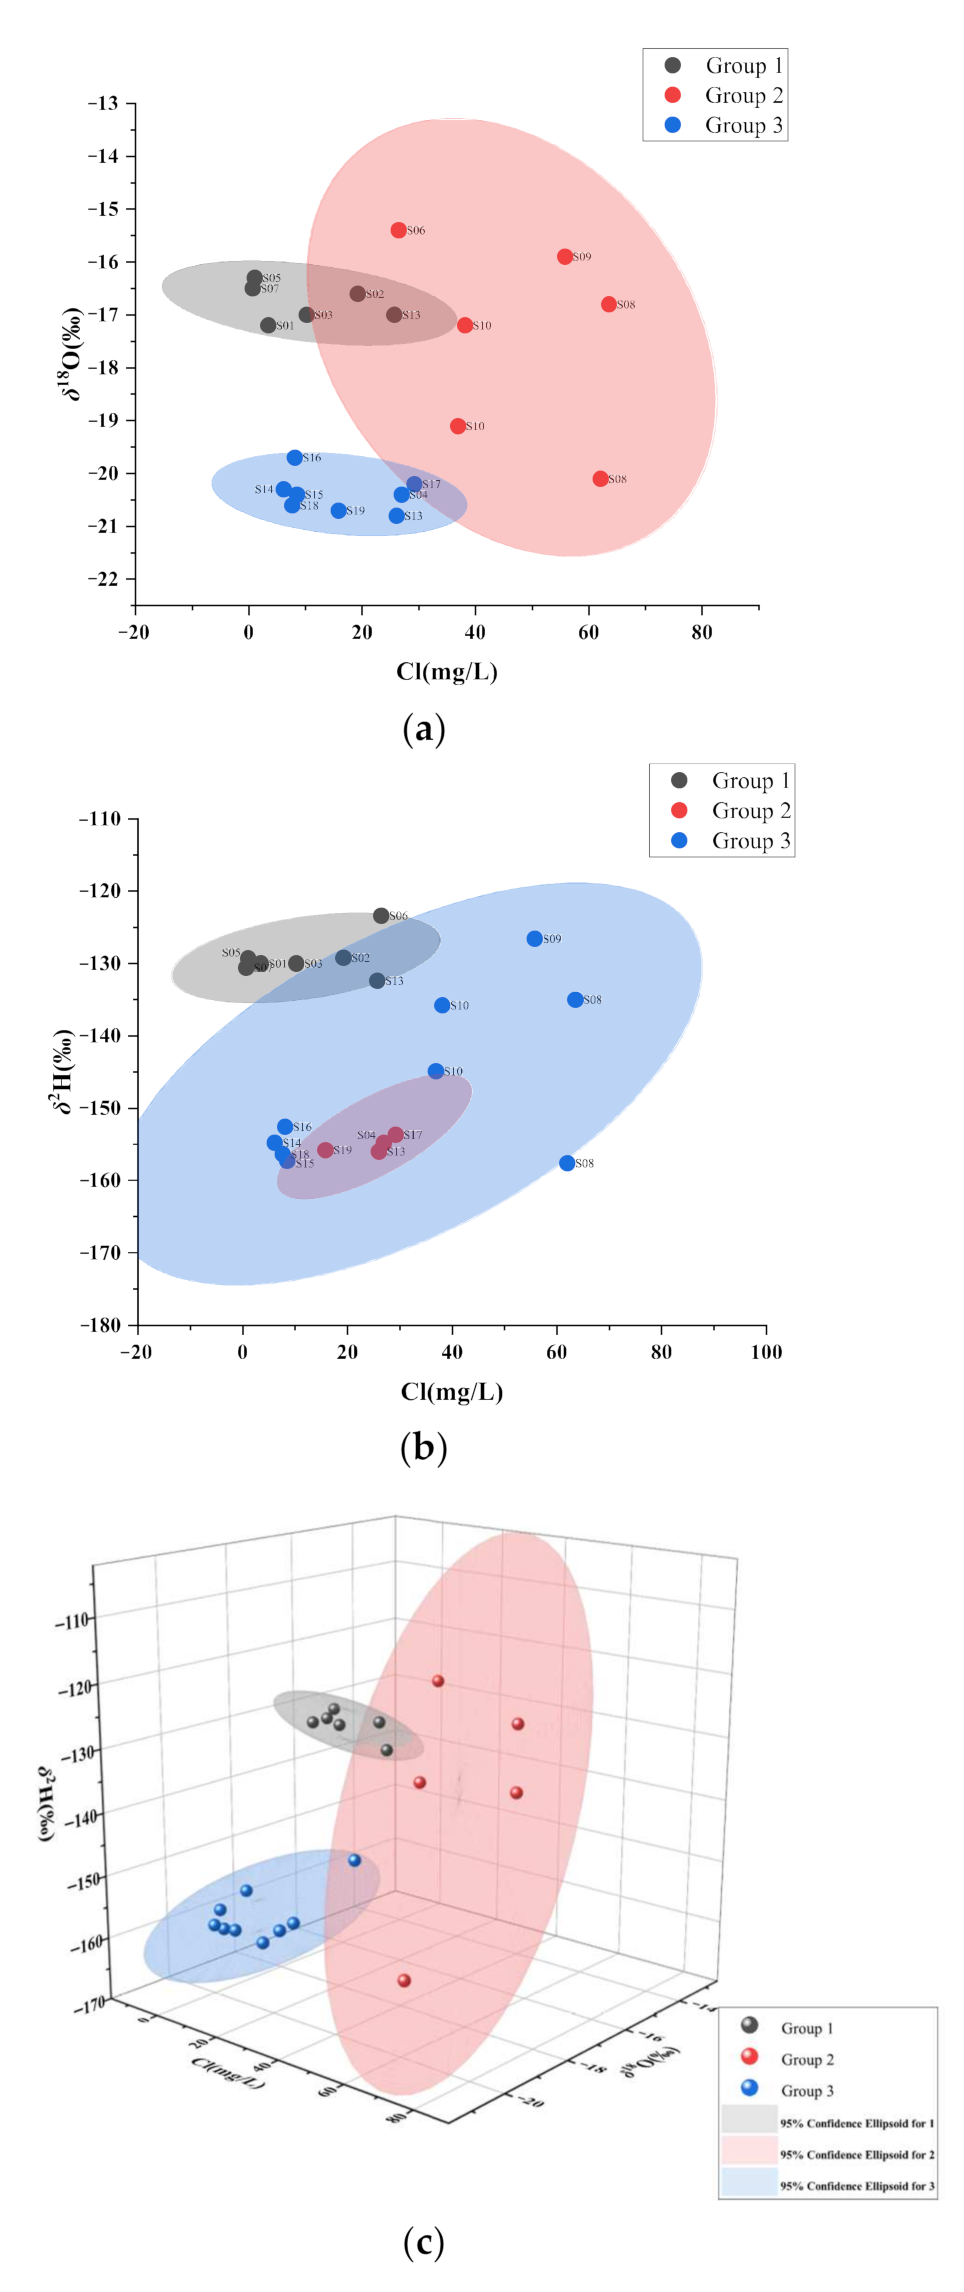
4.2. Oxygen and Hydrogen Isotopes
5. Discussion
5.1. Origin of Spring Water
5.2. Origin of Ions
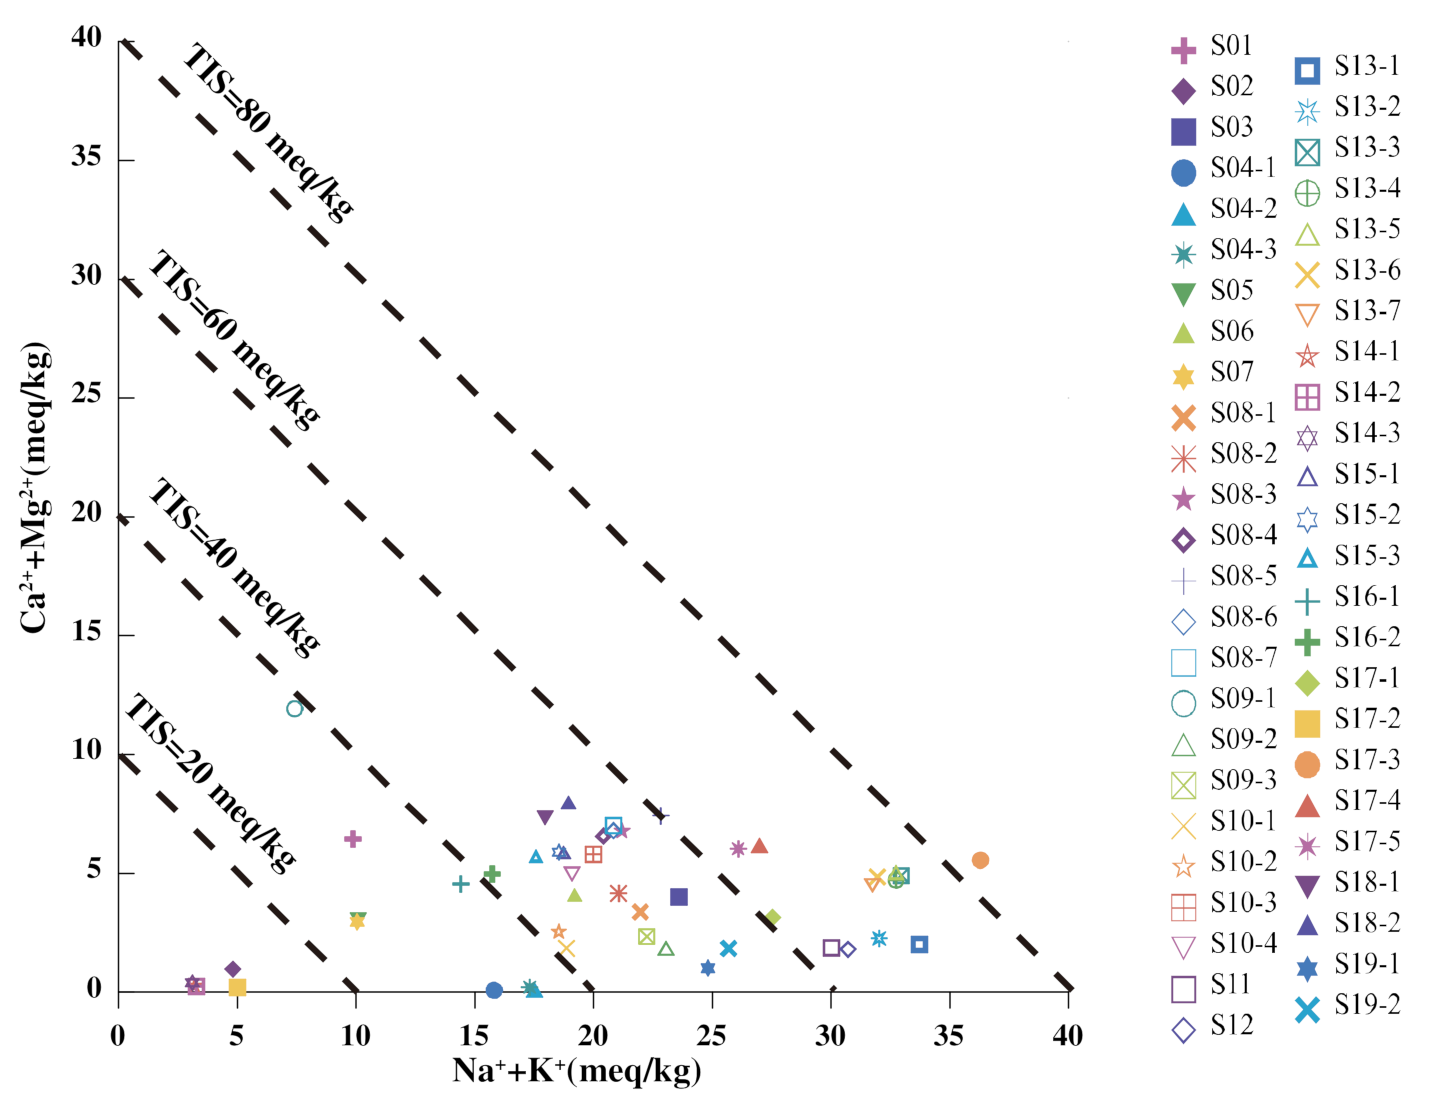
5.2.1. Major Ion
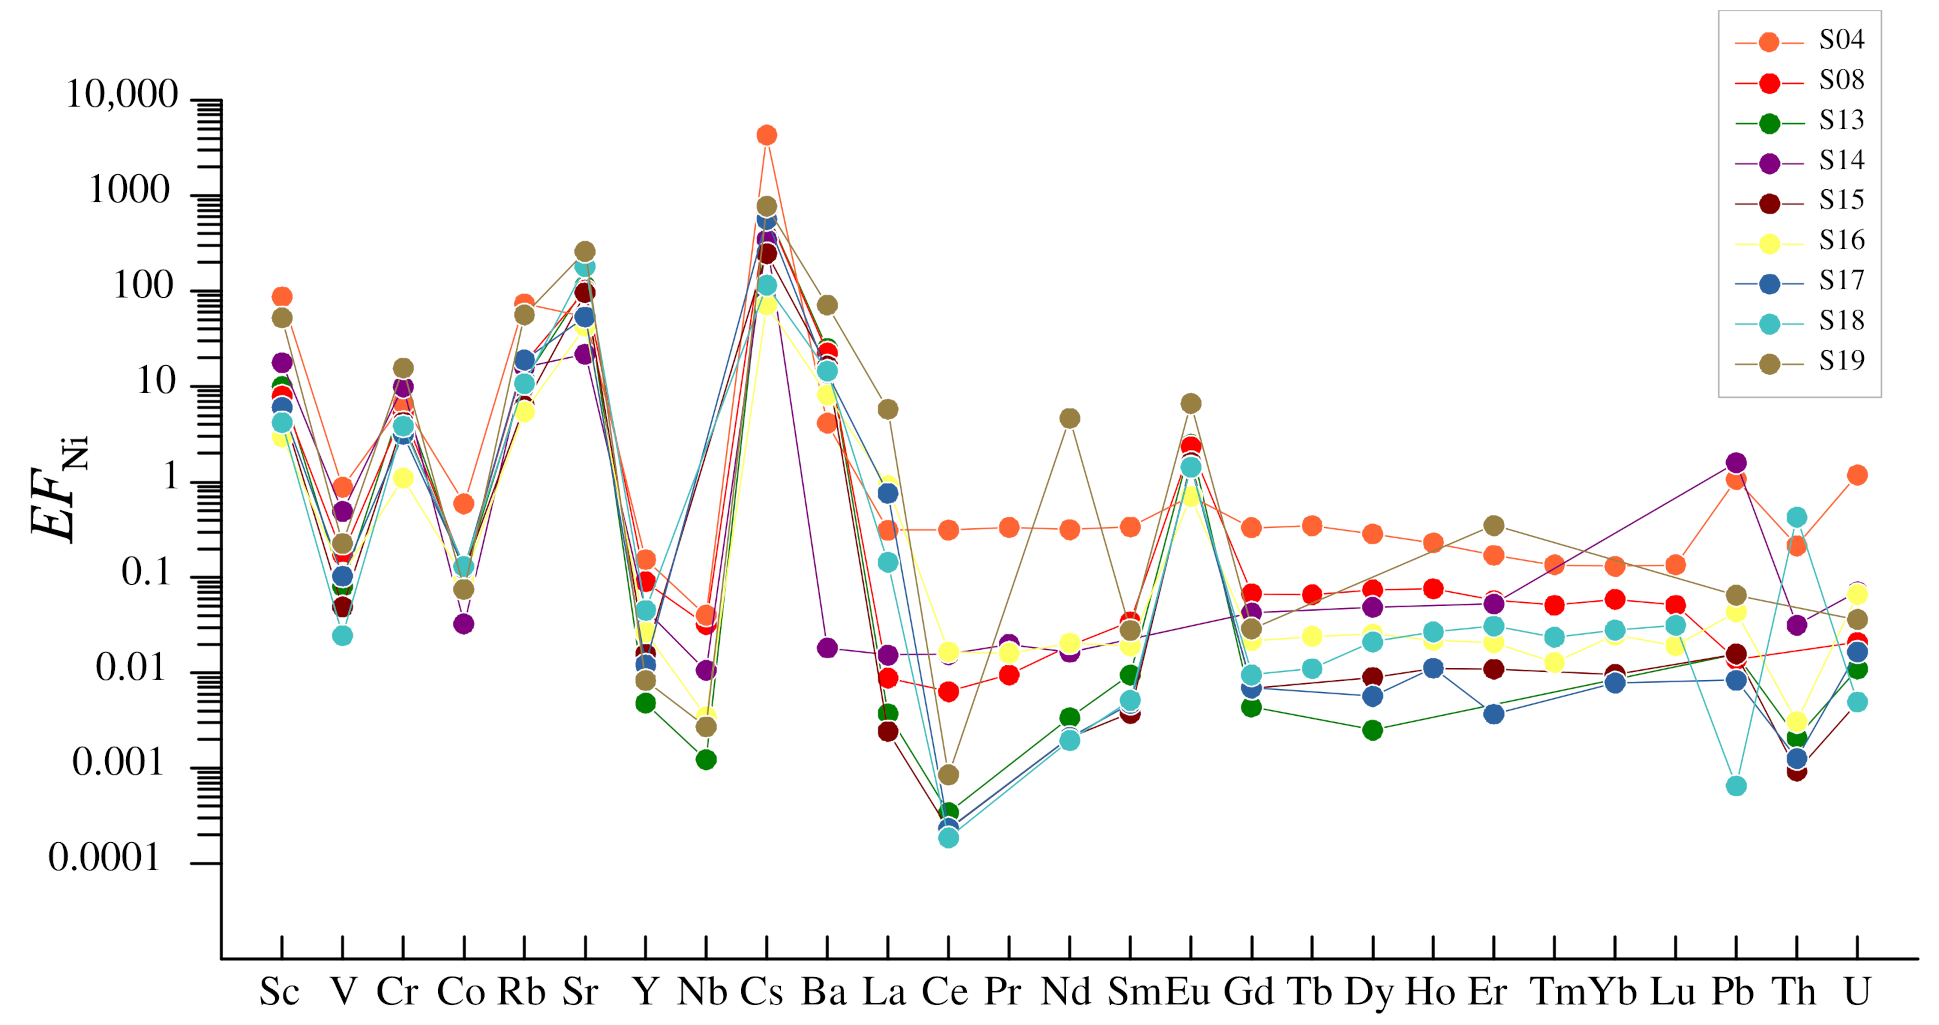
5.2.2. Trace Elements
5.3. Water–Rock Reactions
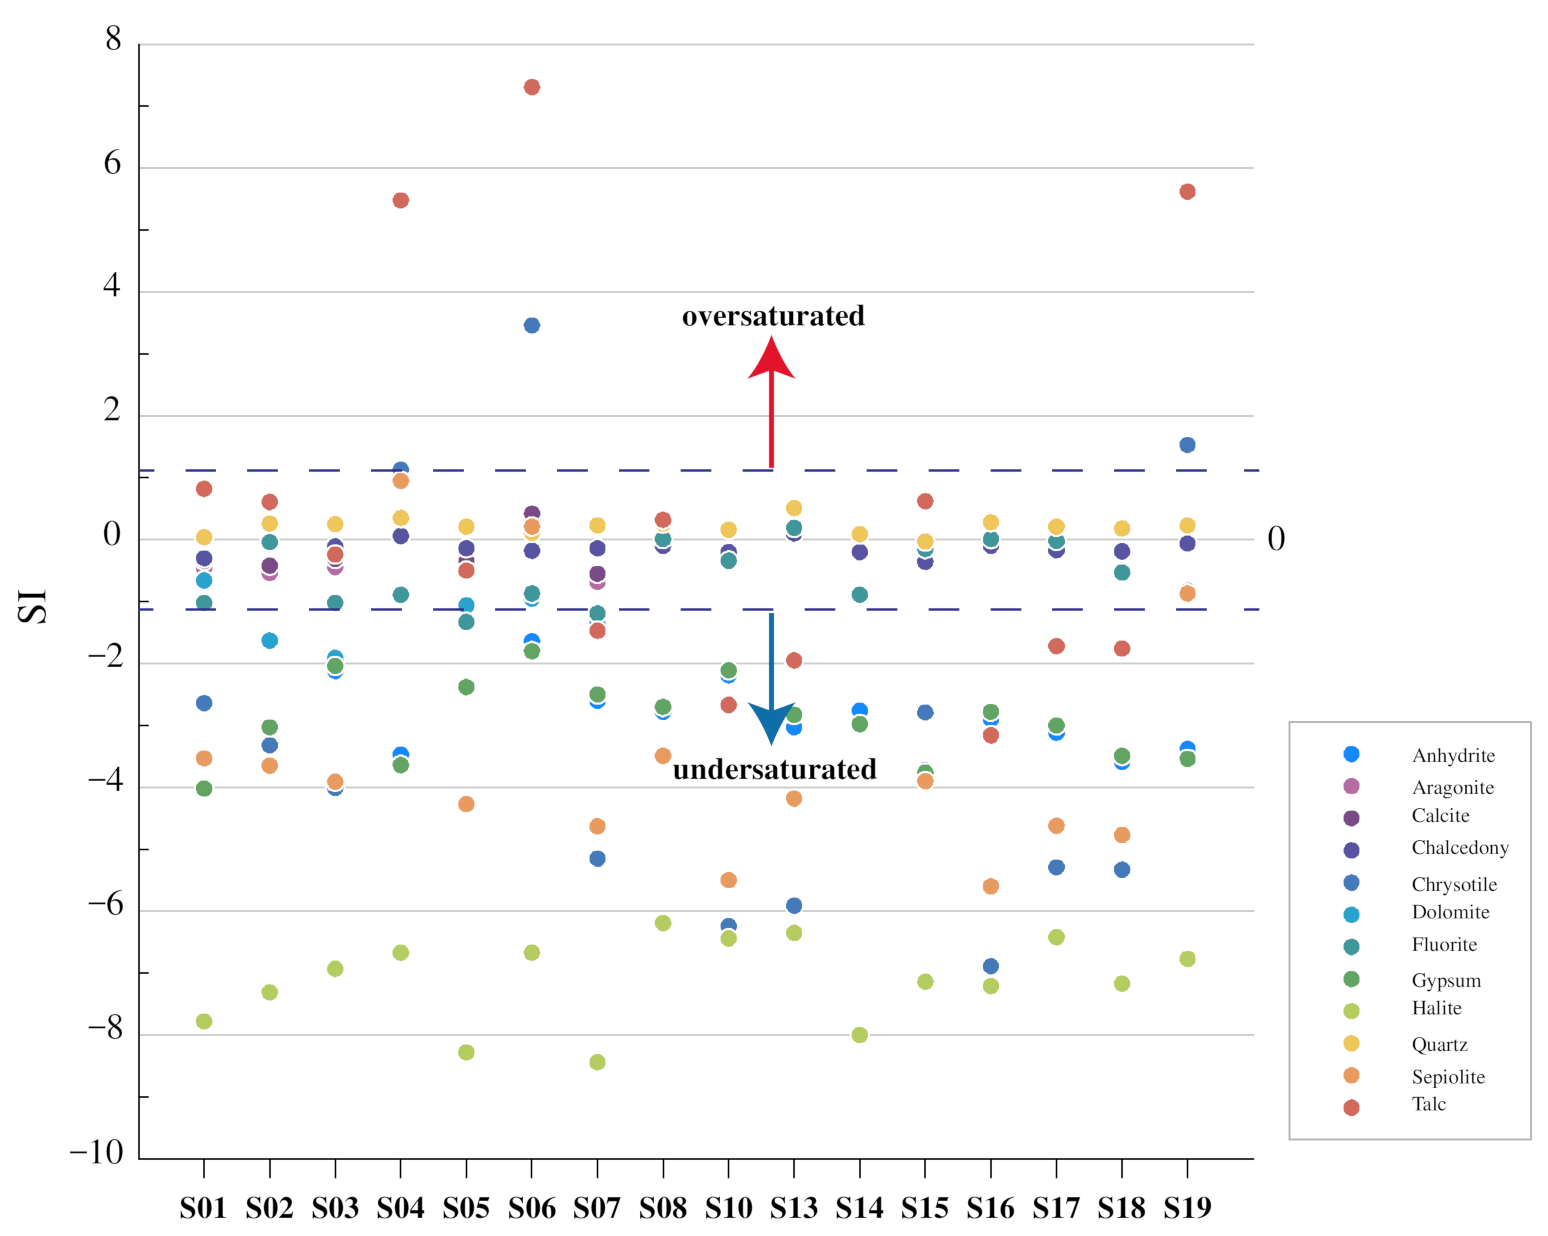
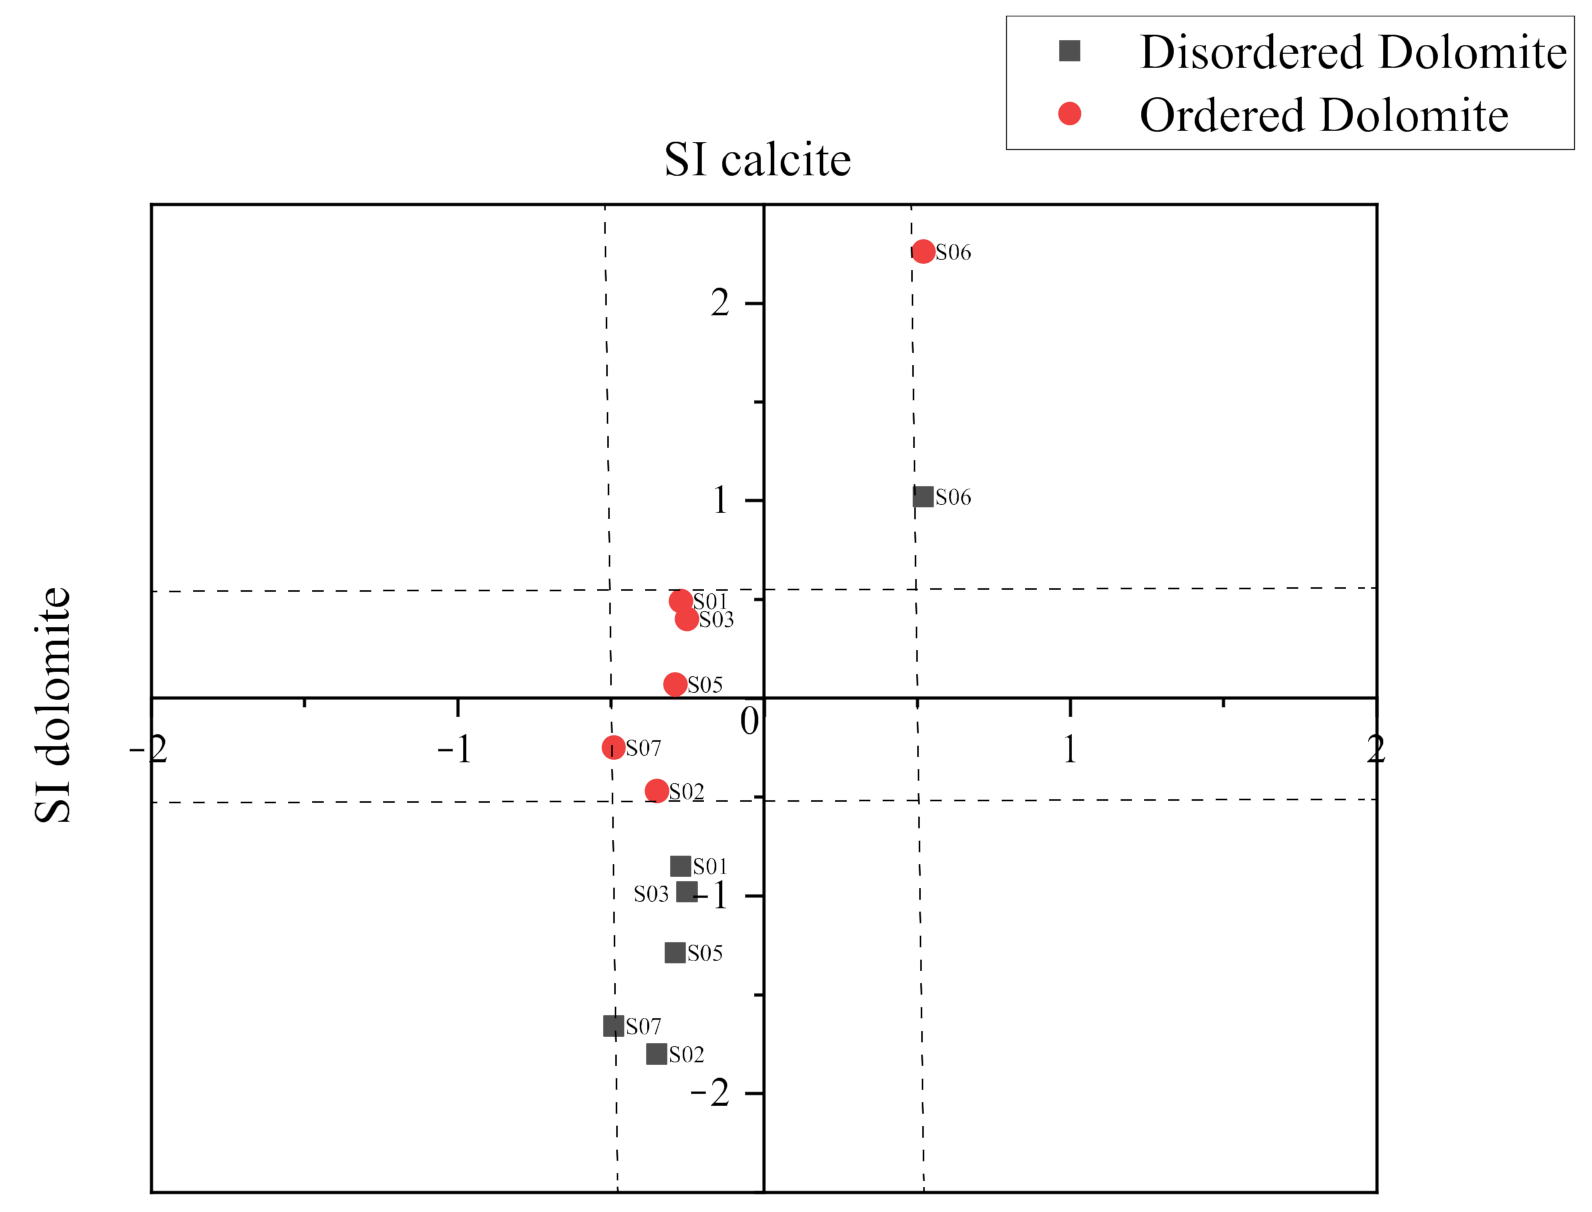
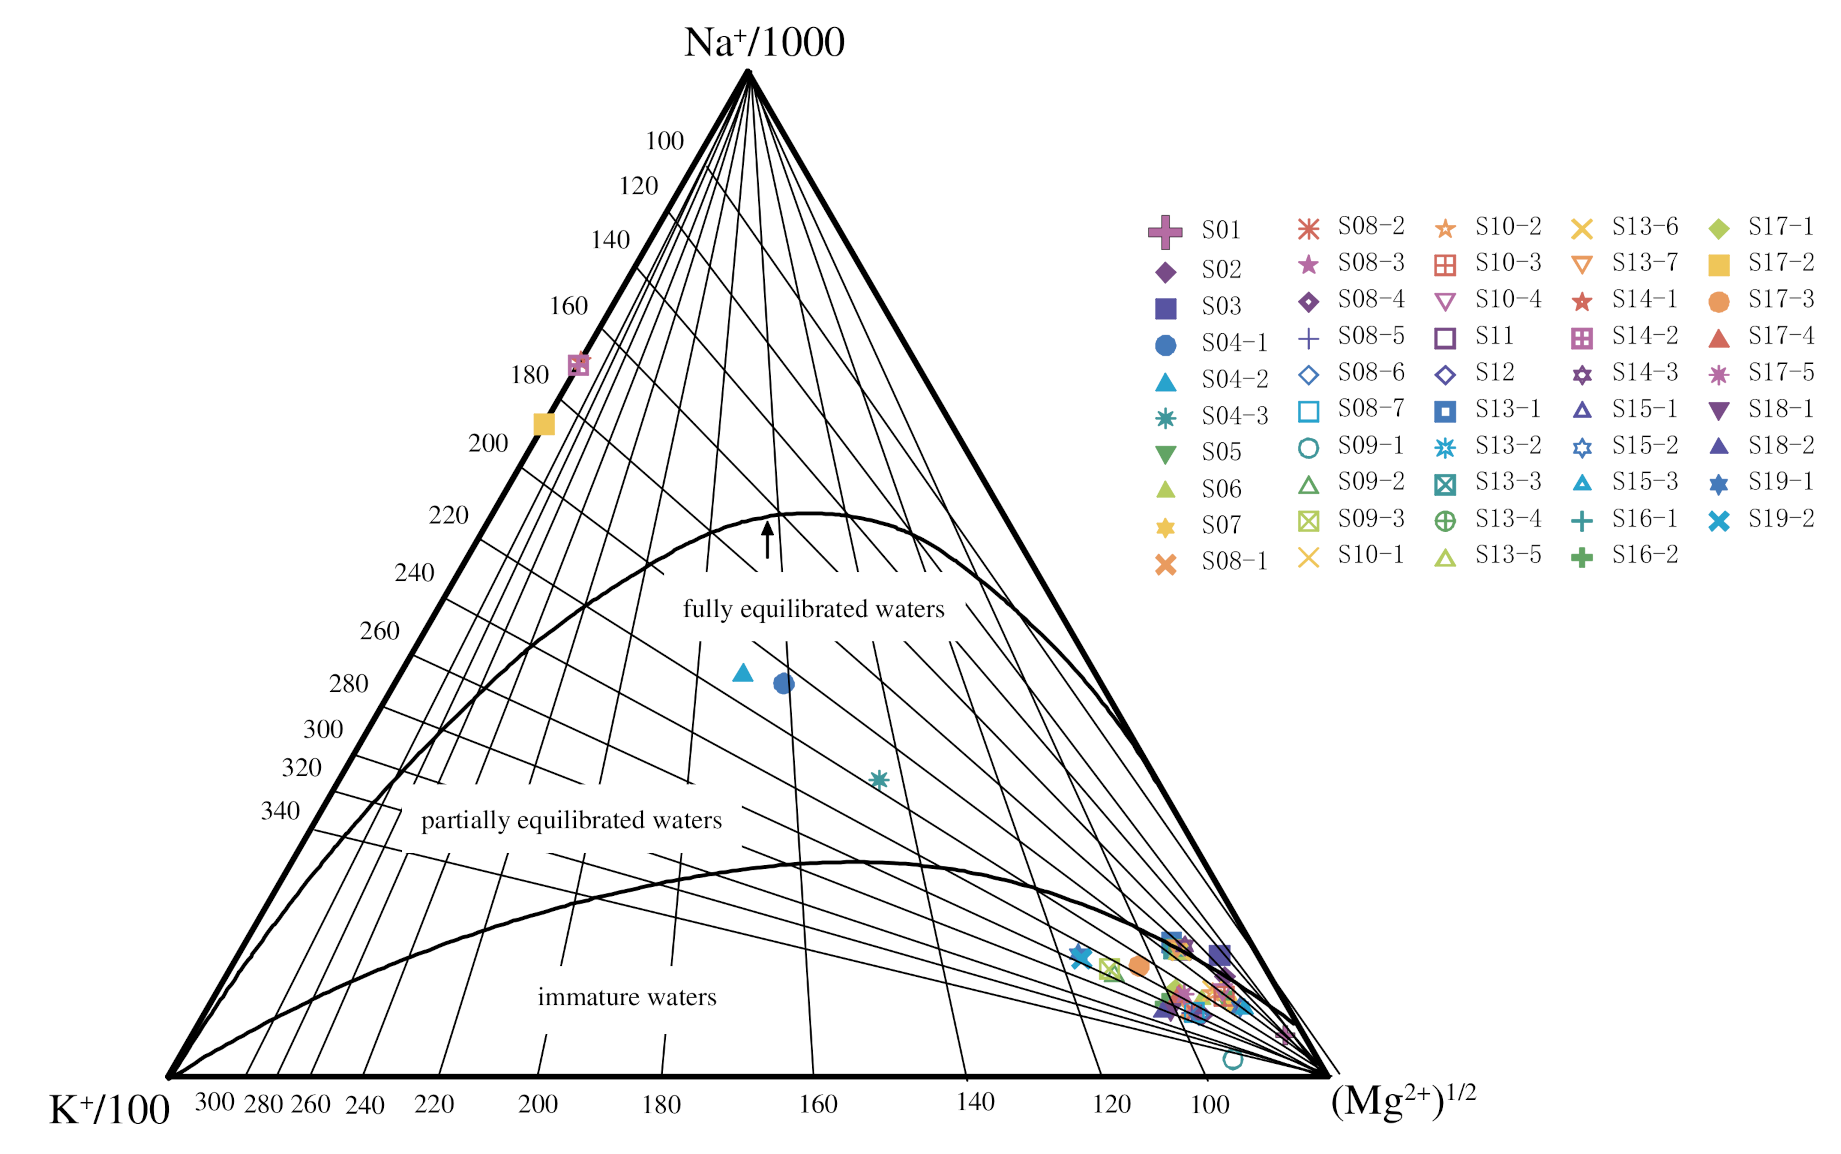
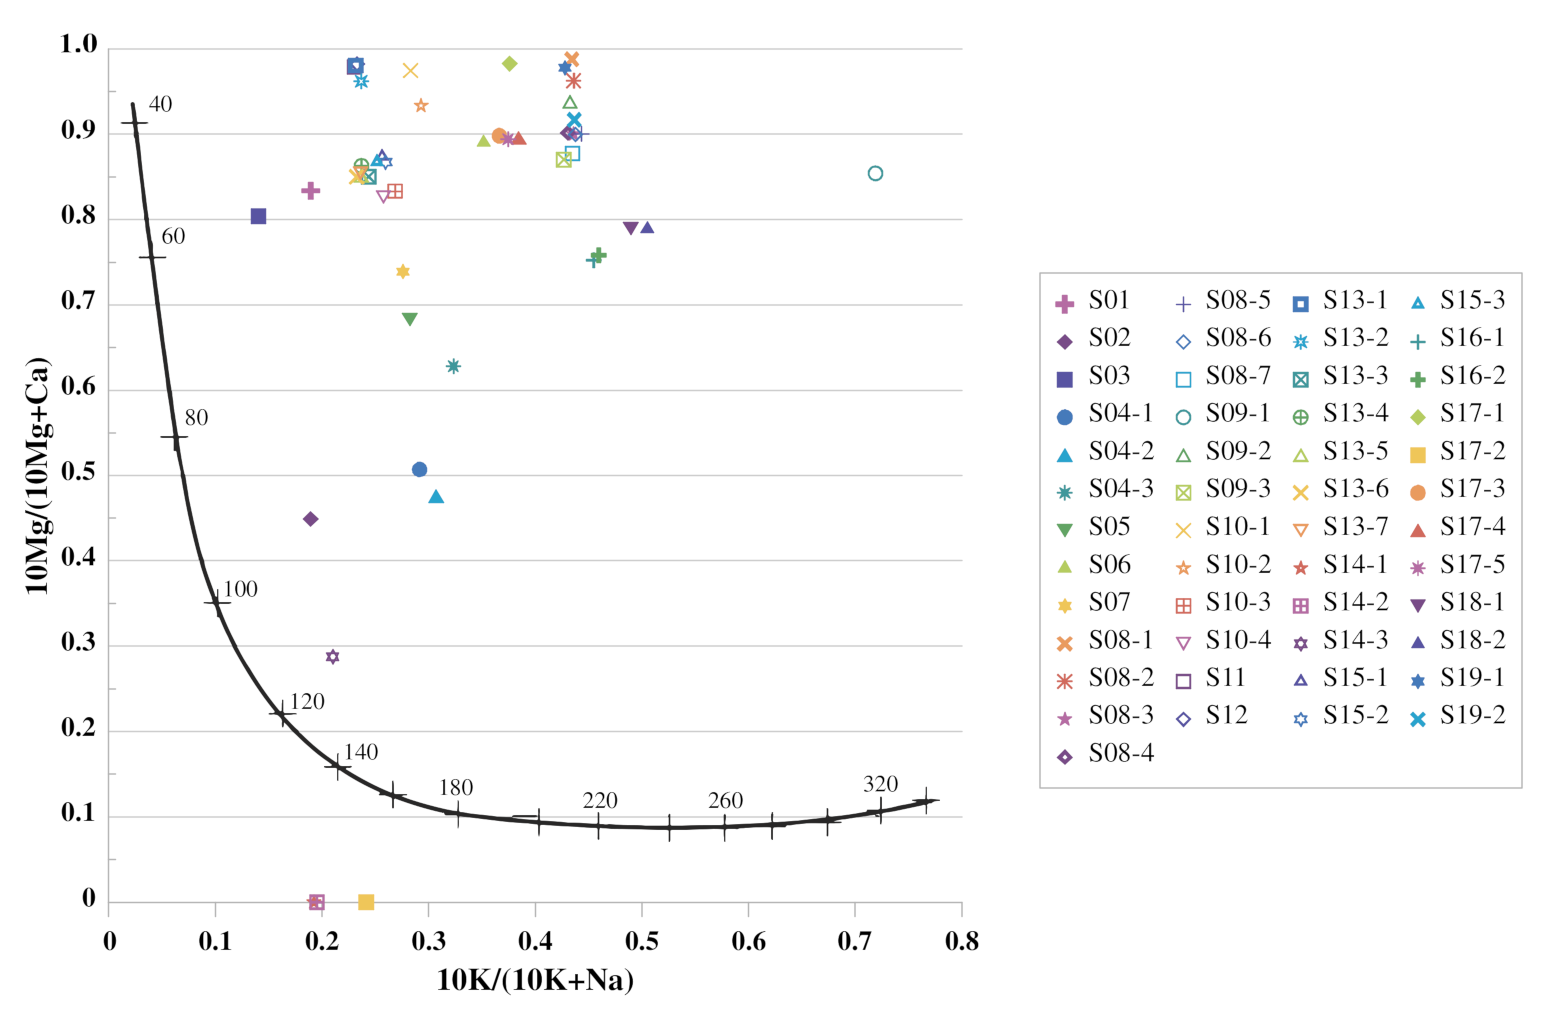
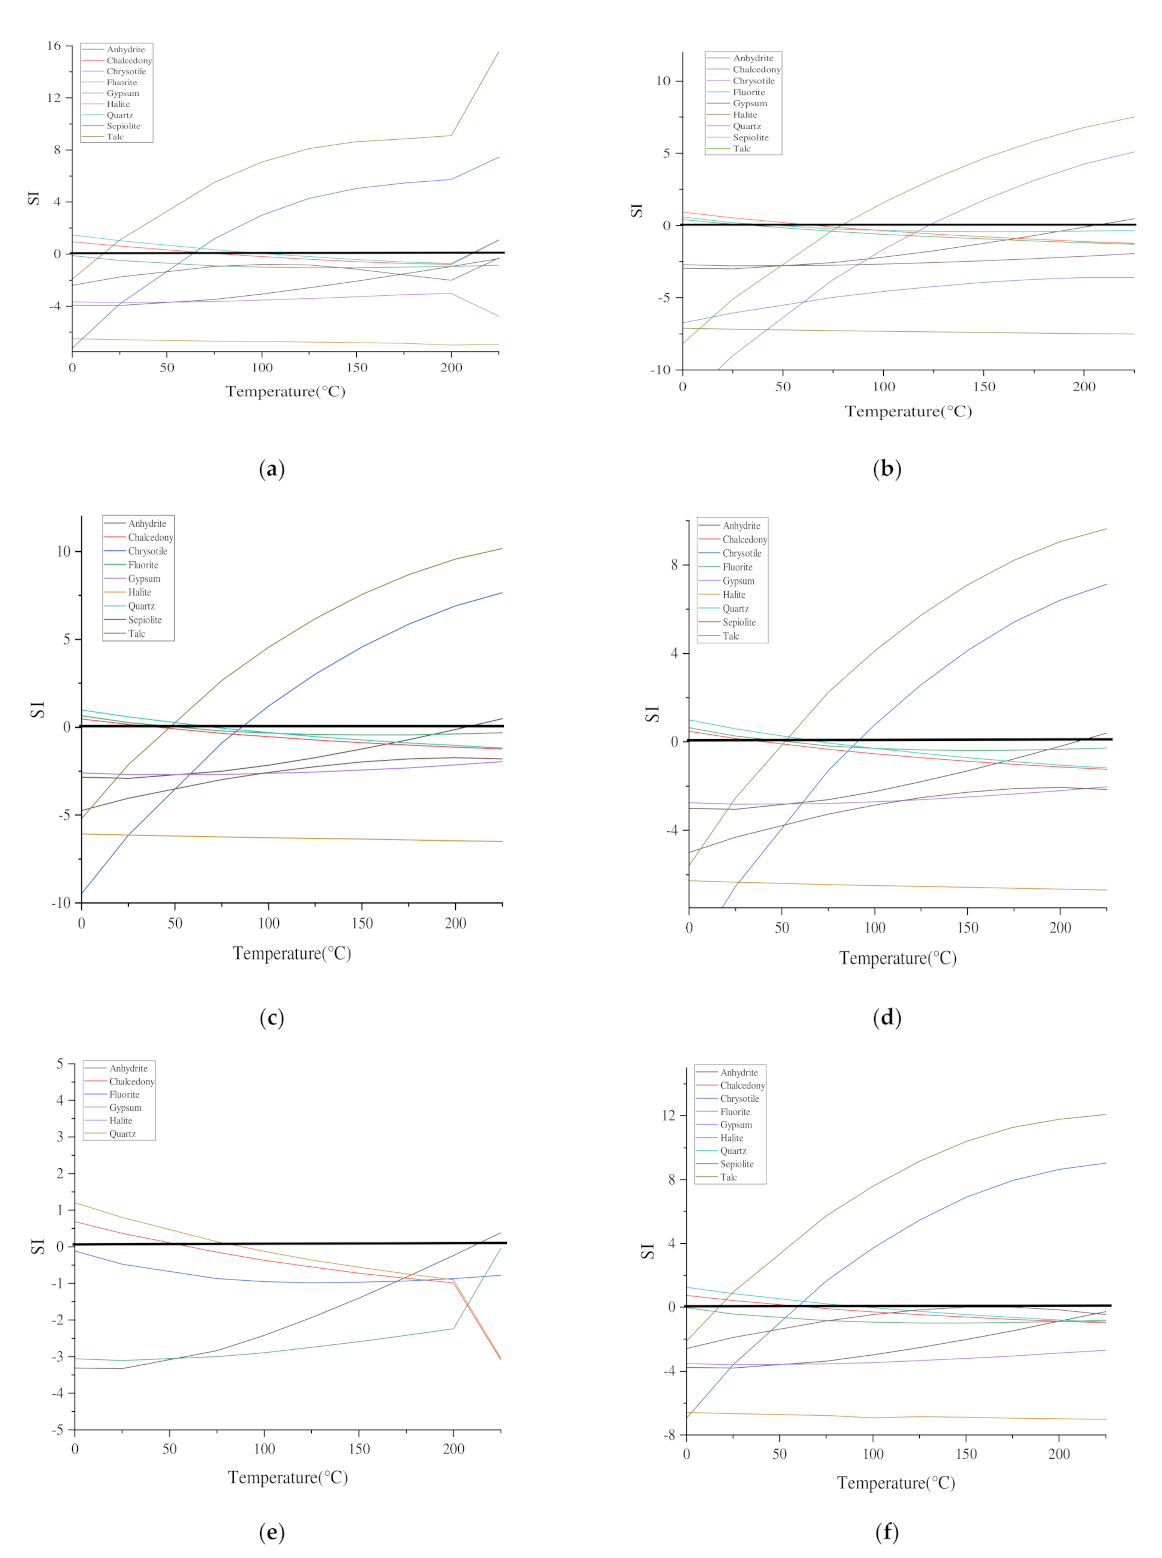
5.3.1. Determination of Equilibrium Condition
5.3.2. Reservoir Temperature and Circulation Depth
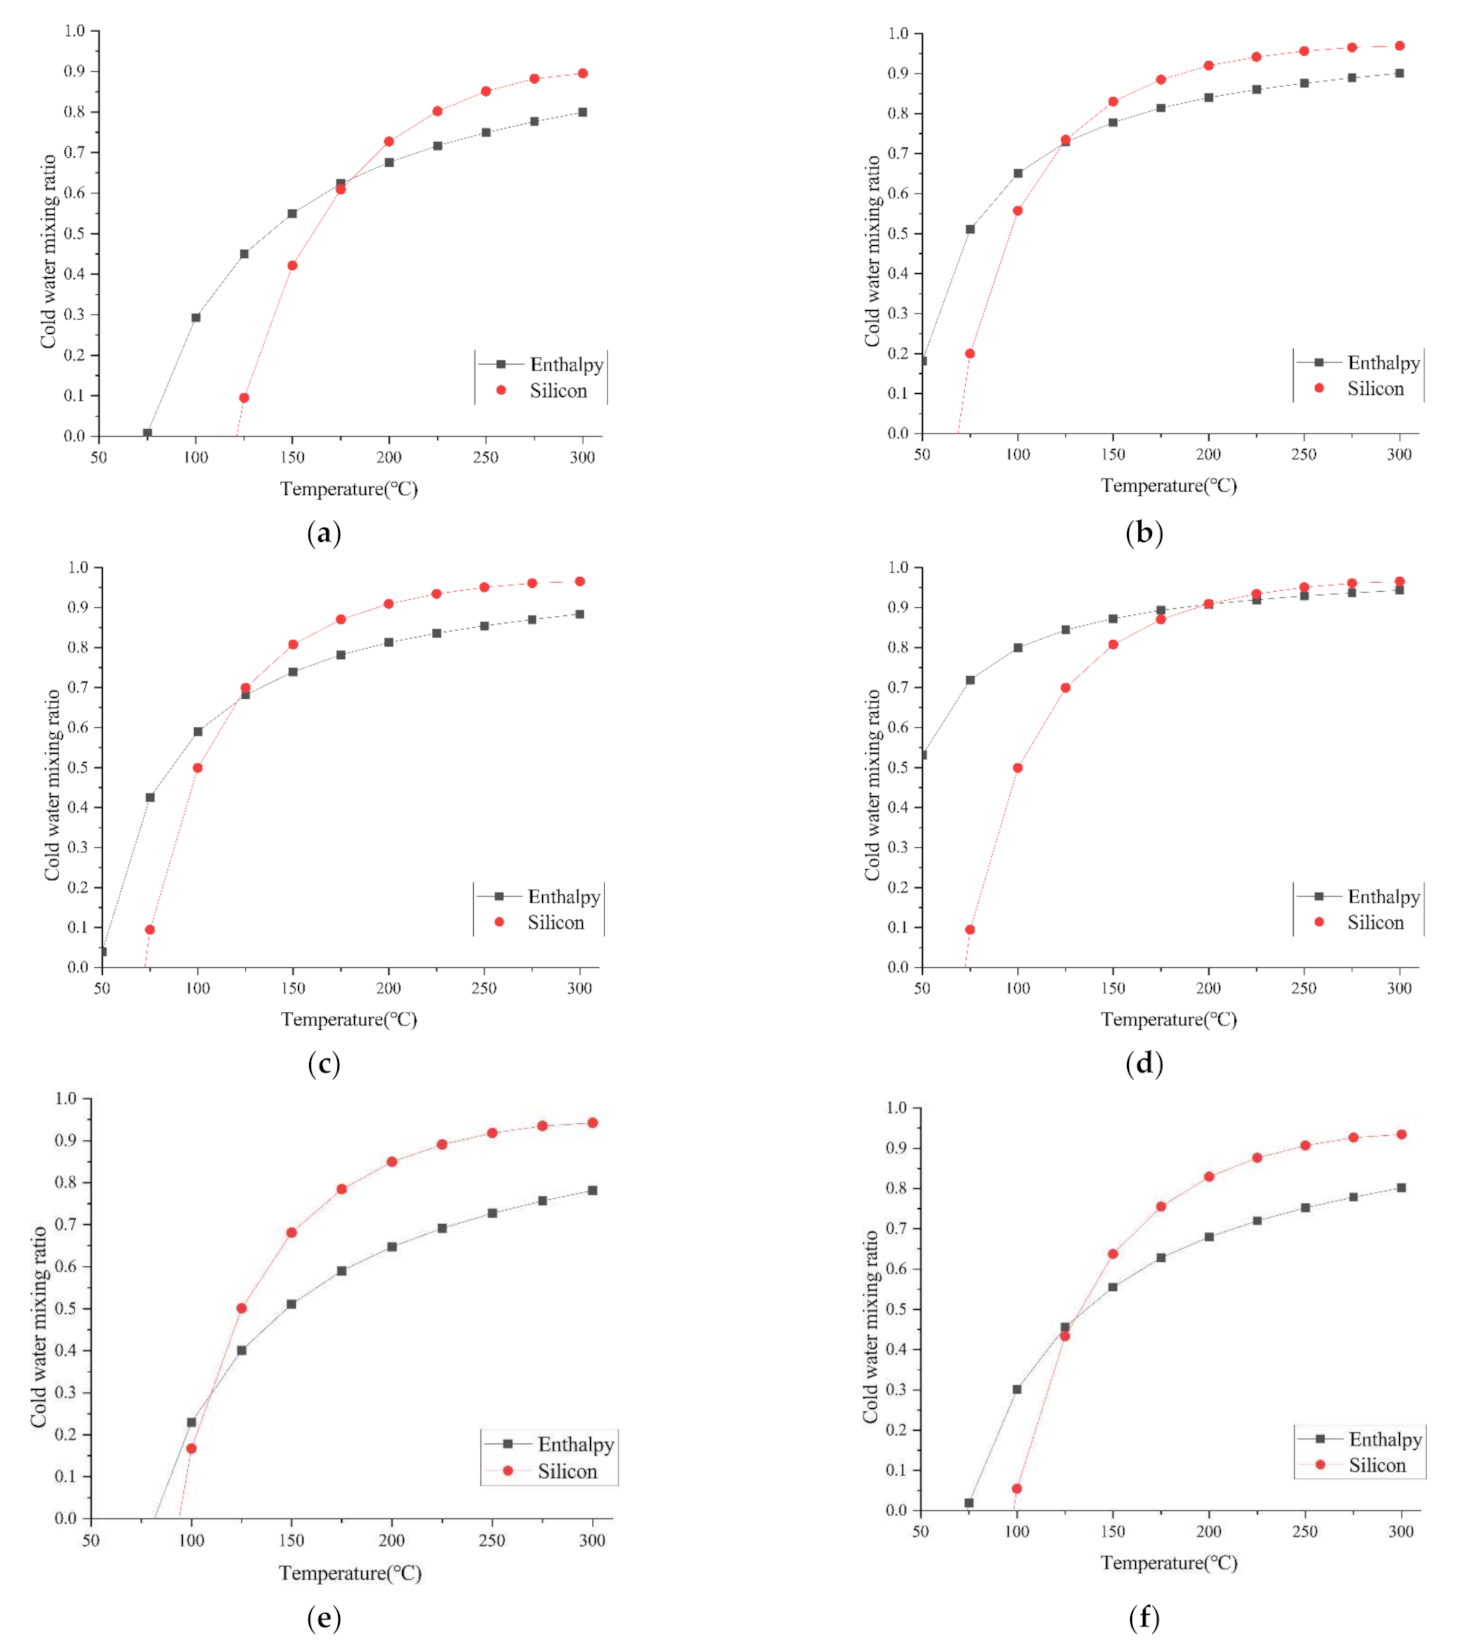
5.3.3. Cold Water Mixing Ratio
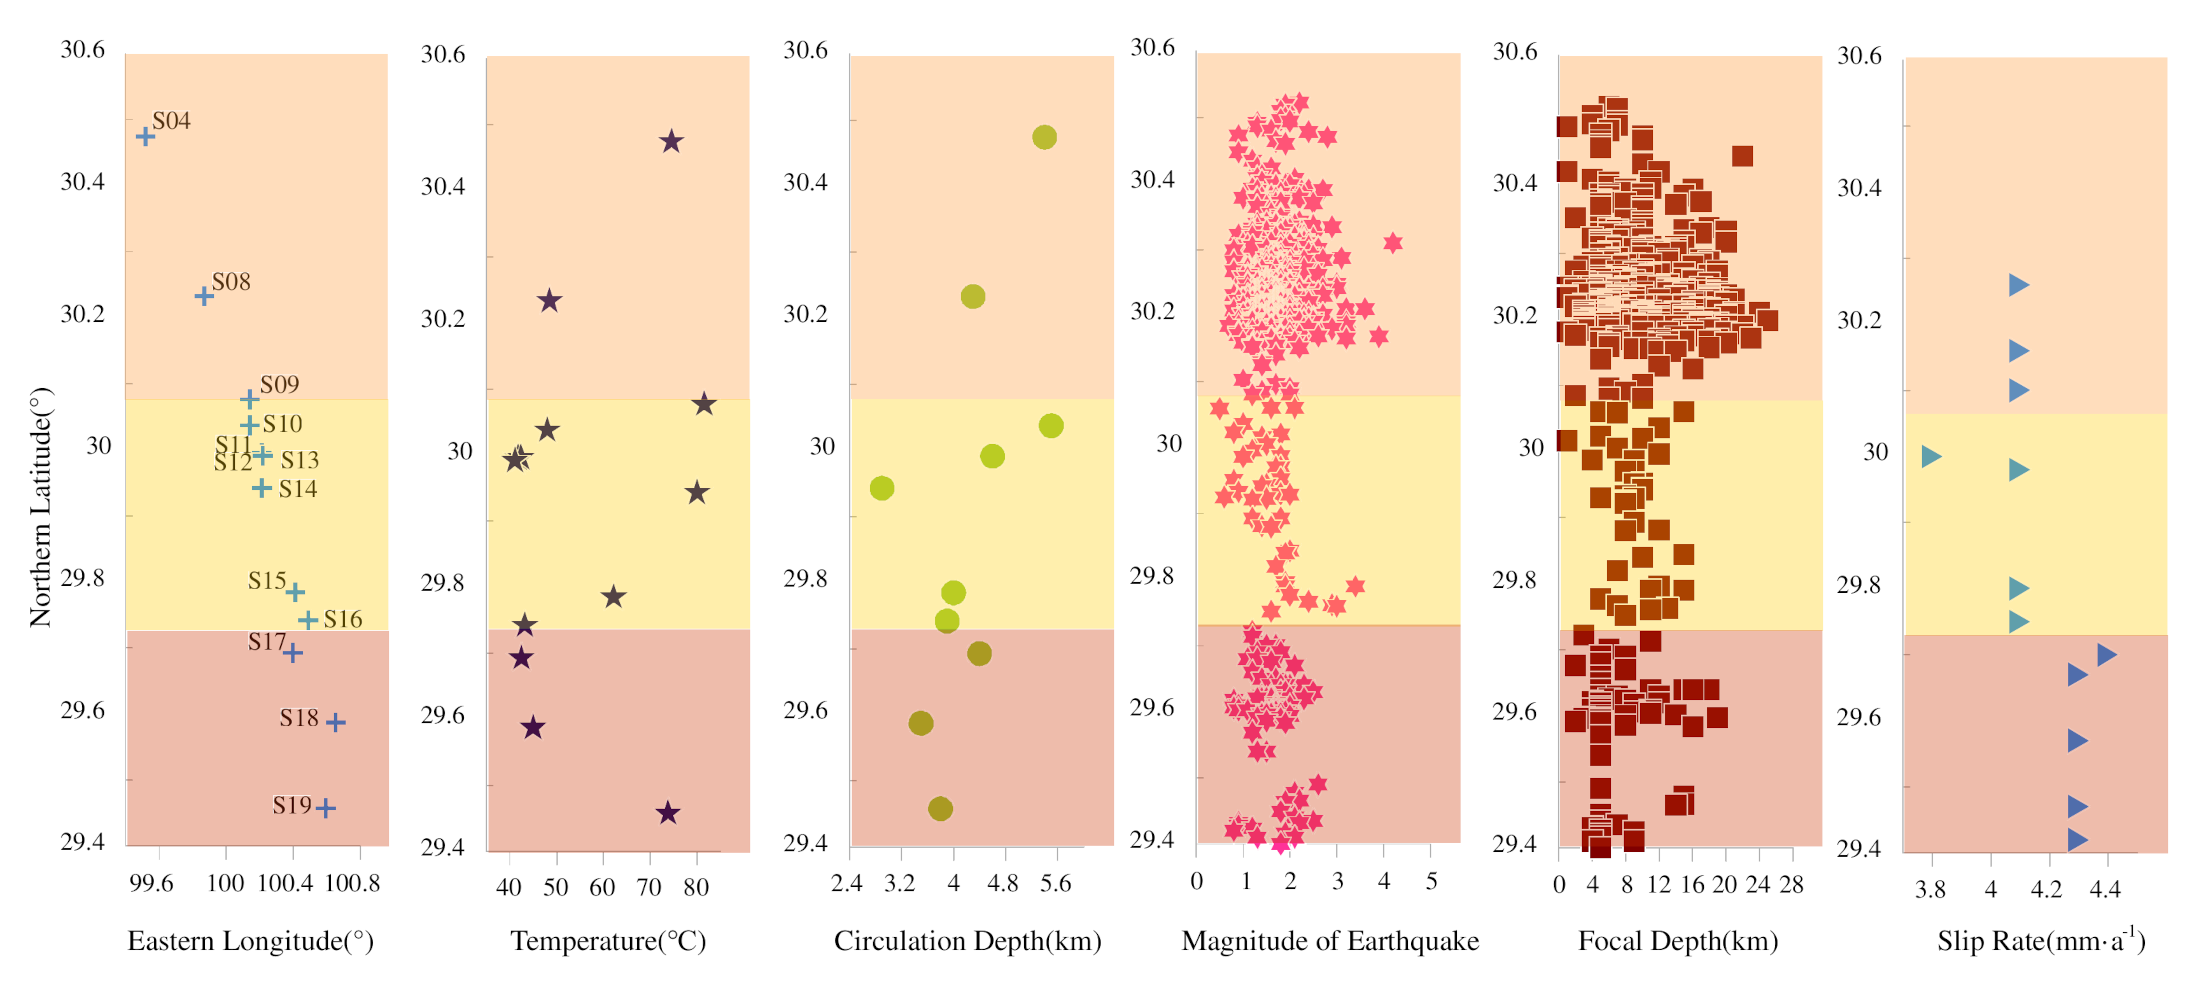
5.4. Spatial Distribution of Hydrogeochemical Characteristics in LFZ
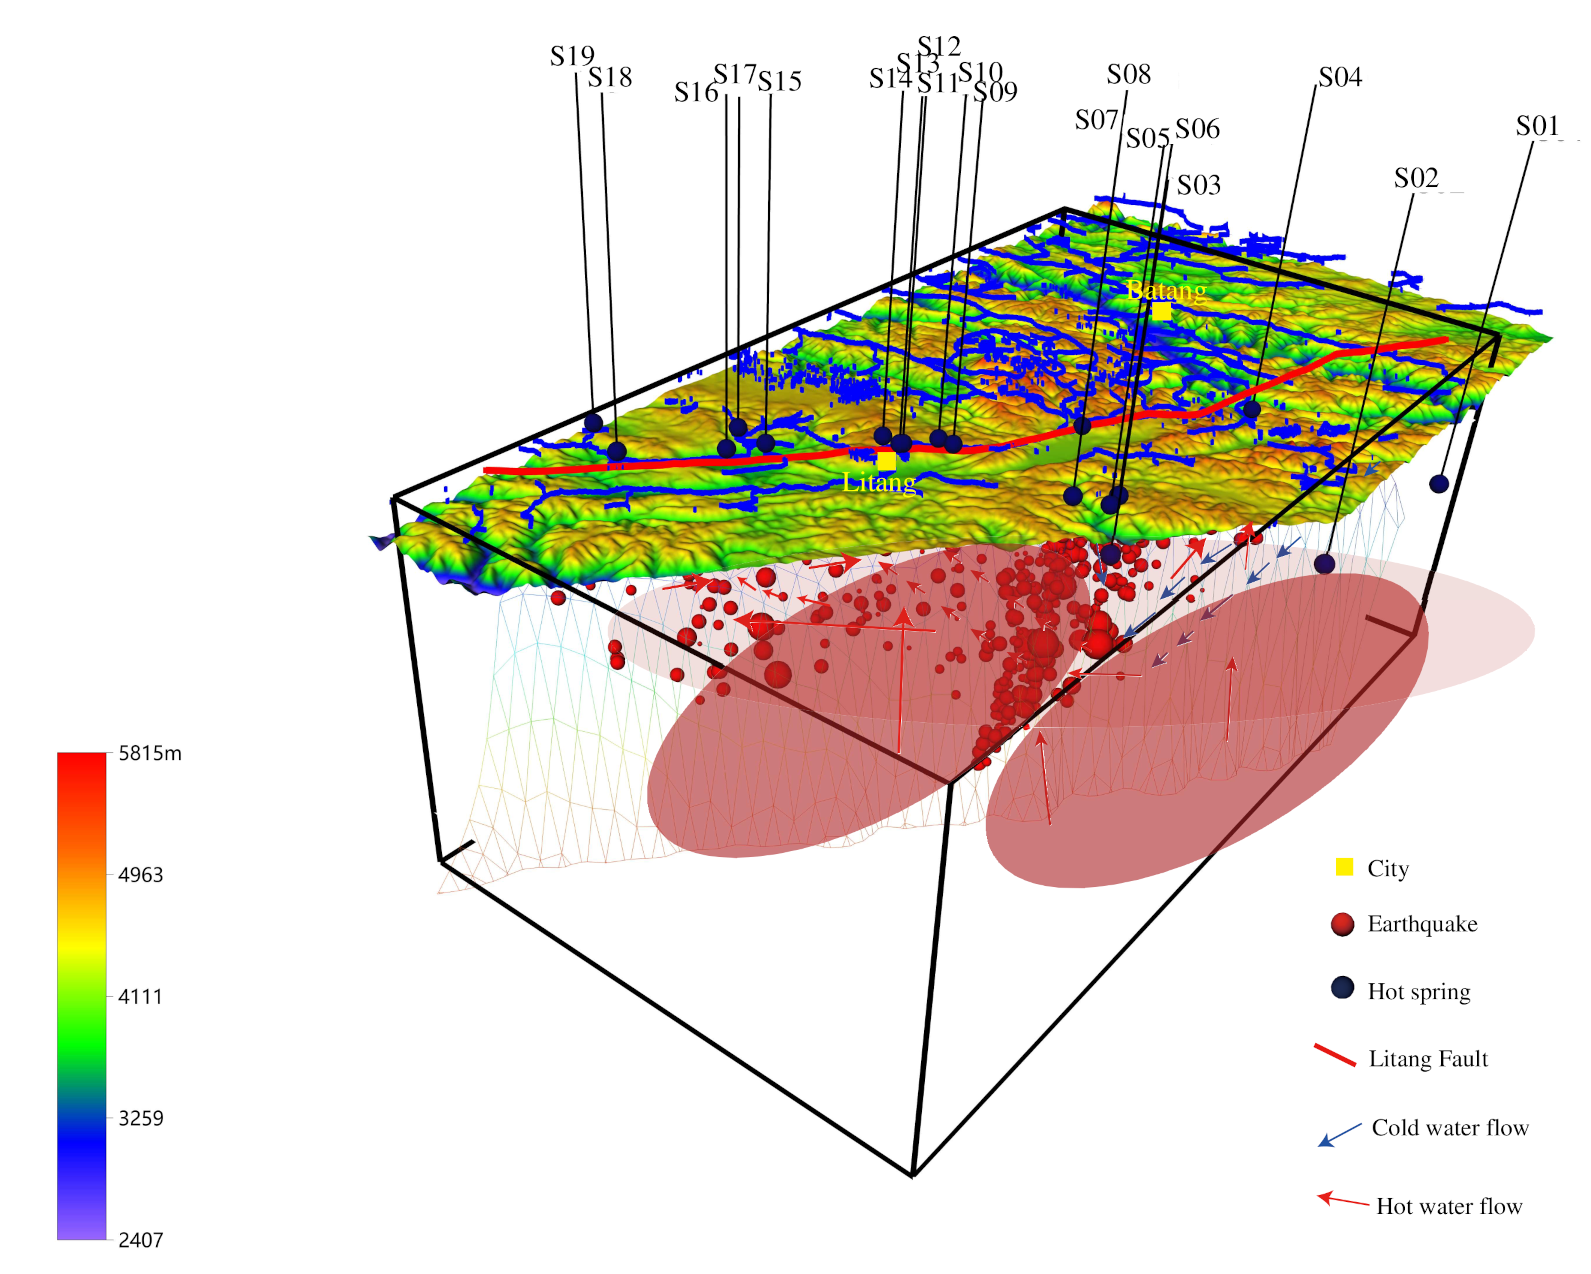
5.5. Conceptual Model of Fluid Circulation
6. Conclusions
- (1)
- The main hydrochemical type of hot spring water samples is HCO3−-Na+. The δ2H values range from −157.6‰ to −123.4‰ and δ18O values range from −24.5‰ to −15.4‰. Hot spring water in the Litang fault zone is mainly recharged by infiltrating precipitation, with recharge elevation of 4062~6018 m. The recharge area is mainly the high mountainous area in the west of Litang County.
- (2)
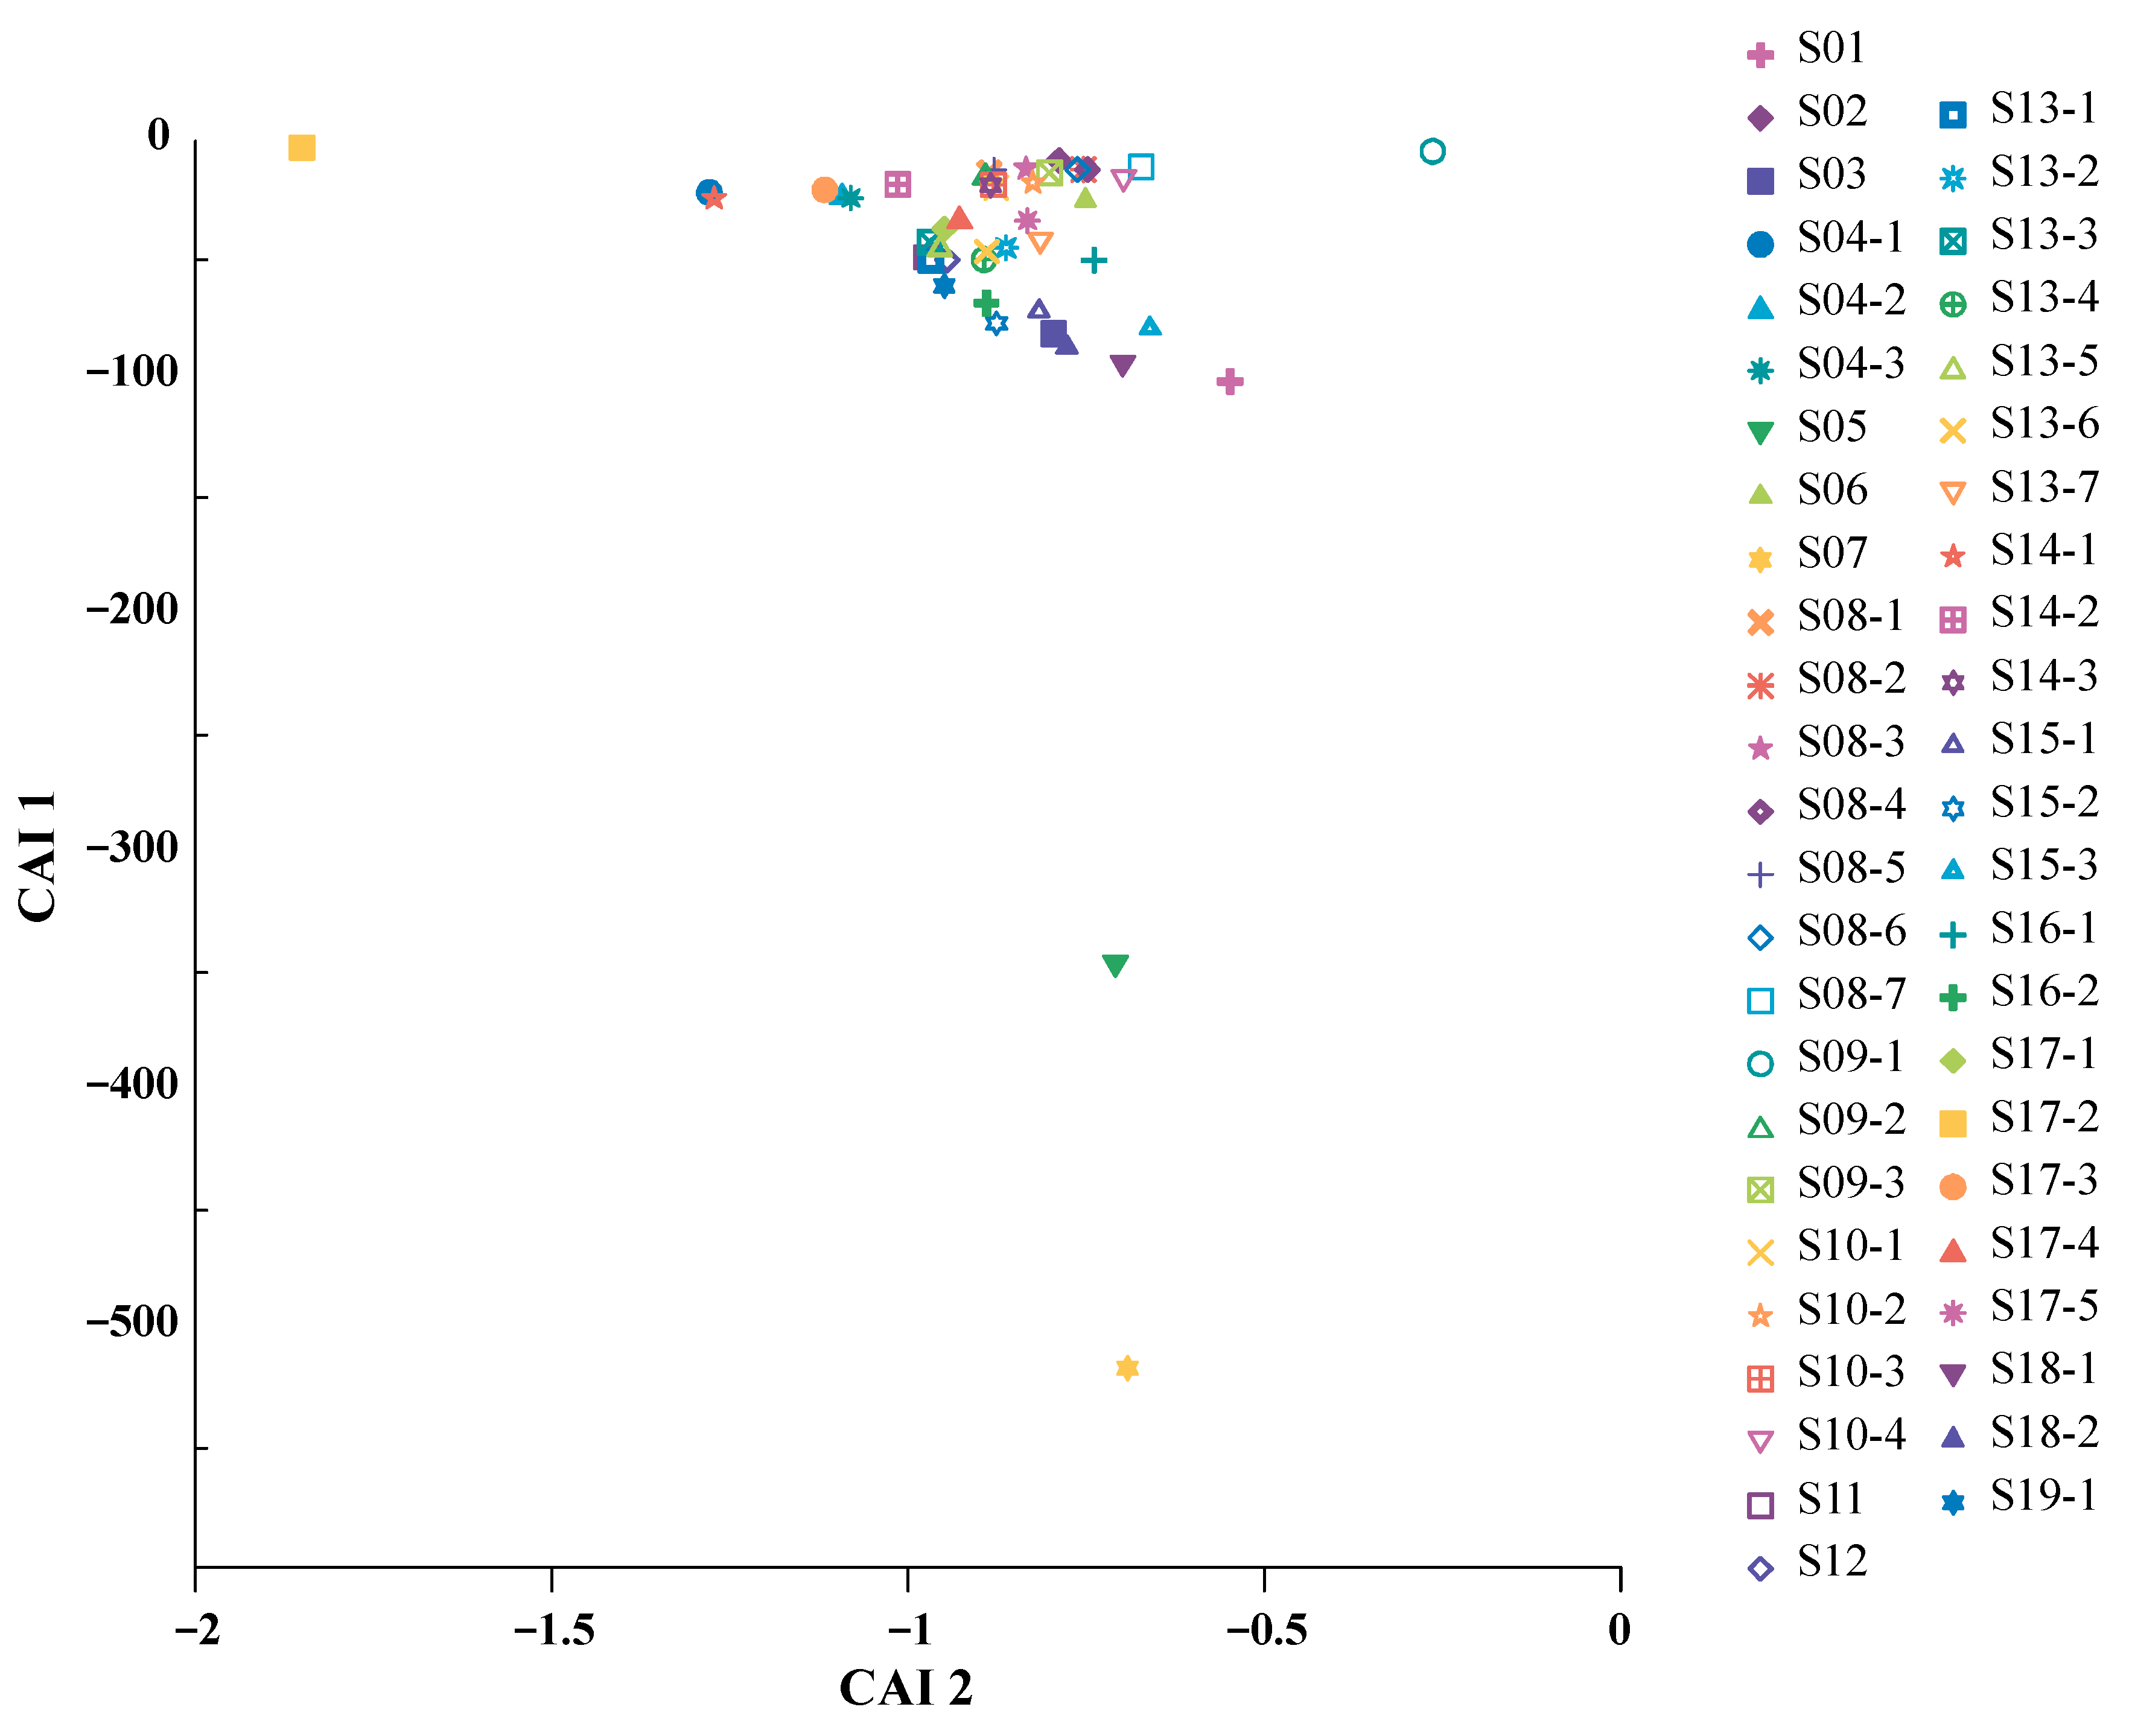
- Hydrochemical types of Litang hot springs are mainly controlled by the circulation of groundwater in deep fault system, and is related to the rock lithology of thermal reservoir and water–rock reaction areas. Both CAI 1 and CAI 2 are negative values, indicating that reverse cation exchange has occurred in water samples collected from LFZ. Ca2+ and Mg2+ produced by carbonate rock dissolution in groundwater exchange with Na+ and K+ in the surrounding rock of the tunnel. The adsorption of Ca2+ and the release of Na+ explain the increase in Na+ in water samples, which will also lead to the change of chemical composition of water.
- (3)
- Thermal reservoir temperatures of S04, S16, S08, S13, S14, and S19 hot springs are 175 °C, 125 °C, 125 °C, 200 °C, 113 °C, and 131 °C, respectively. The hot spring cold water mixing ratio of these hot springs is 0.32~0.89. The estimated lower limit range of circulation depth of the Litang fault hot spring is 2336~4167 m, and the upper limit range is 2504~5487 m.
- (4)
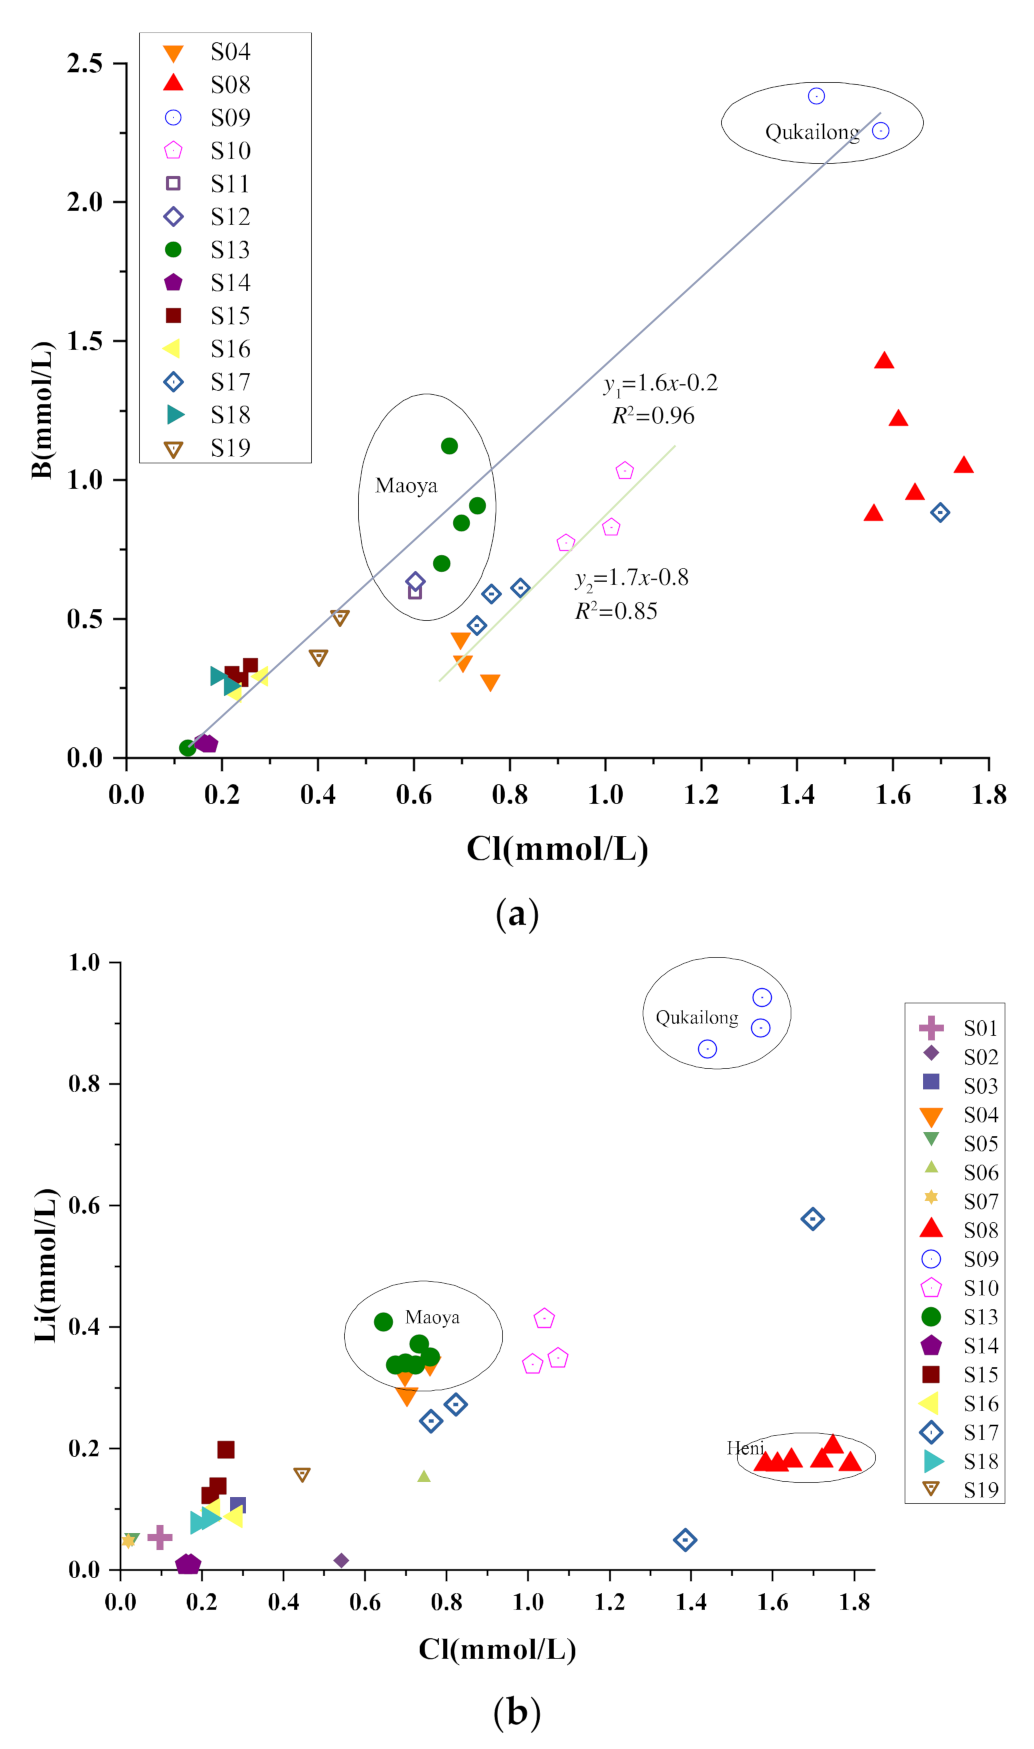
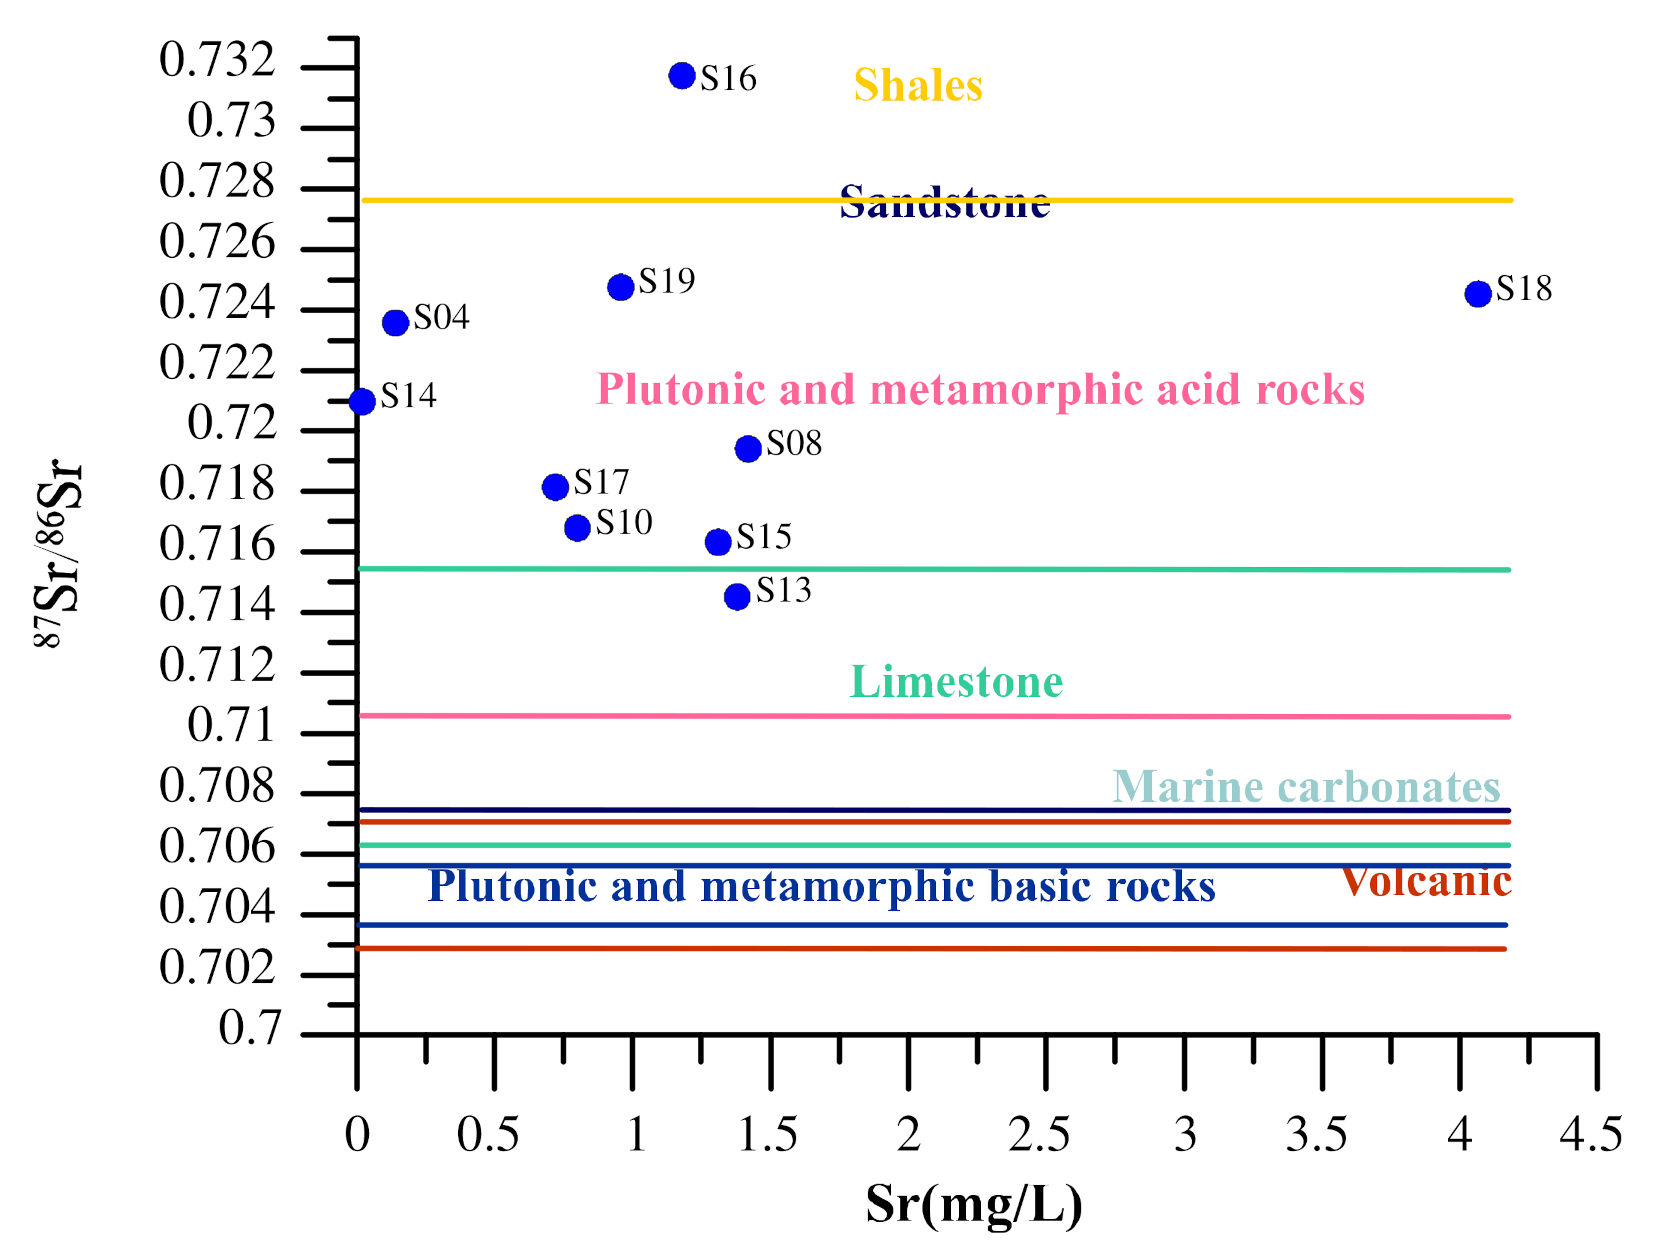
- The hot springs in the Litang fault zone attribute to three different heat sources. The B/Li ratios of S09 and S15 hot springs are 4.51~7.64, S11~S13 hot springs are 6.50~7.04, S16 hot spring is 7.07~8.54, S18 and S19 hot springs are 8.11~9.86, and S14 hot spring is 13.33~15.12. It shows that groundwater flows roughly from north to south. It is worth noting that although S15 and S14 hot springs are concentrated in spatial location, the source of S14 hot spring may be shallower than other hot springs, and groundwater may flow a long distance before reaching S14 hot spring. The B/Li ratio of S04 hot spring is 2.26~2.55, which is the lowest ratio in the region. The B/Li ratio of S17 hot spring is 5.62~8.67, which has changed greatly in 2016 (8.67) compared with the samples collected in 2010 (5.90), 2017 (6.41), and 2018 (5.62). The B/Li ratio of S10 hot spring is 6.89~7.19. The groundwater flows roughly from north to south, when the flow reaches the position of S17 spring, and turns north. The B/Li ratio of S08 hot spring is 13.93~20.75, and the concentration of Cl− is high, which may be from an independent reservoir source.
- (5)
- The deeper the circulation depth of hot spring water on the fault, the higher the thermal reservoir temperature, the stronger the seismic activity of the segment, which is closely related to the increase in pore fluid pressure, rock weakening and deep fluid upwelling.
Supplementary Materials
Author Contributions
Funding
Institutional Review Board Statement
Informed Consent Statement
Data Availability Statement
Conflicts of Interest
References
- Qiu, X.; Wang, Y.; Wang, Z.; Regenauer-Lieb, K.; Zhang, K.; Liu, J. Determining the origin, circulation path and residence time of geothermal groundwater using multiple isotopic techniques in the Heyuan Fault Zone of Southern China. J. Hydrol. 2018, 567, 339–350. [Google Scholar] [CrossRef]
- Blomgren, V.J.; Crossey, L.J.; Karlstrom, K.E.; Fischer, T.P.; Darrah, T.H. Hot spring hydrochemistry of the Rio Grande rift in northern New Mexico reveals a distal geochemical connection between Valles Caldera and Ojo Caliente. J. Volcanol. Geoth. Res. 2019, 387, 106663. [Google Scholar] [CrossRef]
- Hu, S.; He, L.; Wang, J. Heat flow in the continental area of China: A new data set. Earth Planet. Sci. Lett. 2000, 179, 407–419. [Google Scholar] [CrossRef]
- Tang, H.H.; Guo, L.H.; Fang, Y. Estimation of heat slow in southeastern margin of Tibetan Plateau and its analysis of the correlation with earthquake activity. Chinese J. Geophys. 2020, 63, 1056–1069. (In Chinese) [Google Scholar]
- Shi, Z.; Liao, F.; Wang, G.; Xu, Q.; Mu, W. Hydrogeochemical characteristics and evolution of hot springs in eastern Tibetan Plateau Geothermal Belt, Western China: Insight from multivariate statistical analysis. Geofluids 2017, 6546014. [Google Scholar] [CrossRef] [Green Version]
- Zhou, X.; Liu, L.; Chen, Z.; Cui, Y.; Du, J. Gas geochemistry of the hot spring in the Litang fault zone, Southeast Tibetan Plateau. Appl. Geochem. 2017, 79, 17–26. [Google Scholar] [CrossRef]
- Hou, Y.; Shi, Z.; Mu, W. Fluid geochemistry of fault zone hydrothermal system in the Yidun-Litang Area, Eastern Tibetan Plateau Geothermal Belt. Geofluids 2018, 6872563. [Google Scholar] [CrossRef] [Green Version]
- Li, J.; Sagoe, G.; Yang, G.; Liu, D.; Li, Y. The application of geochemistry to bicarbonate thermal springs with high reservoir temperature: A case study of the Batang geothermal field, western Sichuan Province, China. J. Volcanol. Geoth. Res. 2019, 371, 20–31. [Google Scholar] [CrossRef]
- Chen, Z.; Zhou, X.; Du, J.; Xie, C.; Liu, L.; Li, Y.; Liu, H.; Cui, Y. Hydrochemical characteristics of hot spring waters in the Kangding district related to the Lushan MS = 7.0 earthquake in Sichuan, China. Nat. Hazards Earth Syst. Sci. 2015, 15, 1149–1156. [Google Scholar] [CrossRef] [Green Version]
- Li, B.; Shi, Z.; Wang, G.; Liu, C. Earthquake-related hydrochemical changes in thermal springs in the Xianshuihe Fault zone, Western China. J. Hydrol. 2019, 579, 124175. [Google Scholar] [CrossRef]
- Tang, X.; Zhang, J.; Pang, Z.; Hu, S.; Tian, J.; Bao, S. The eastern Tibetan Plateau geothermal belt, western China: Geology, geophysics, genesis, and hydrothermal system. Tectonophysics 2017, 717, 433–448. [Google Scholar] [CrossRef]
- Zhang, J.; Li, W.Y.; Tang, X.C.; Tian, J.; Wang, Y.C.; Guo, Q.; Pang, Z.H. Geothermal data analysis at the high-temperature hydrothermal area in Western Sichuan. Sci. China Earth Sci. 2017, 60, 1507–1521. [Google Scholar] [CrossRef]
- Chevalier, M.-L.; Leloup, P.H.; Replumaz, A.; Pan, J.; Liu, D.; Li, H.; Gourbet, L.; Métois, M. Tectonic-geomorphology of the Litang fault system, SE Tibetan Plateau, and implication for regional seismic hazard. Tectonophysics 2016, 682, 278–292. [Google Scholar] [CrossRef]
- Deng, Q.; Zhang, P.; Ran, Y.; Yang, X.; Min, W.; Chu, Q. Basic characteristics of active tectonics of China. Sci. China Ser. D Earth Sci. 2003, 46, 356–372. [Google Scholar]
- Zhang, P. A review on active tectonics and deep crustal processes of the Western Sichuan region, eastern margin of the Tibetan Plateau. Tectonophysics 2016, 584, 7–22. [Google Scholar] [CrossRef]
- Reid, A.J.; Wilson, C.J.L.; Liu, S. Structural evidence for the Permo-Triassic tectonic evolution of the Yidun Arc, eastern Tibetan Plateau. J. Struct. Geol. 2005, 27, 119–137. [Google Scholar] [CrossRef]
- Liu, S., Jr.; Jackson, W.T.; Robinson, D.M.; Weislogel, A.L.; Jian, X. Cenozoic reactivation along the Late Triassic Ganzi-Litang suture, eastern Tibetan Plateau. Geosci. Front. 2020, 11, 1069–1080. [Google Scholar] [CrossRef]
- Yu, H.J.; Jiang, J.W.; Li, W.C. Controls of variable crustal thicknesses on Late Triassic mineralization in the Yidun Arc, Eastern Tibet. J. Asian Earth Sci. 2020, 195, 104285. [Google Scholar] [CrossRef]
- Wang, B.Q.; Wang, W.; Zhou, M. Provenance and tectonic setting of the Triassic Yidun Group, the Yidun Terrane, Tibet. Geosci. Front. 2013, 4, 765–777. [Google Scholar] [CrossRef] [Green Version]
- Li, W.C.; Yu, H.J.; Gao, X.; Liu, X.L.; Wang, J.H. Review of Mesozoic multiple magmatism and porphyry Cu–Mo (W) mineralization in the Yidun Arc, eastern Tibet Plateau. Ore Geol. Rev. 2017, 90, 795–812. [Google Scholar] [CrossRef]
- Xu, B.; Hou, Z.Q.; Griffin, W.L.; Zheng, Y.C.; Wang, T.; Guo, Z.; Hou, J.; Santosh, M.; O’Reilly, S.Y. Cenozoic lithospheric architecture and metallogenesis in Southeastern Tibet. Earth-Sci. Rev. 2021, 214, 103472. [Google Scholar] [CrossRef]
- Zhu, D.C.; Wang, Q.; Zhan, Q.Y.; Xie, J.C. Late Triassic tectonomagmatism of northern Sanjiang and associated several scientific problems. Sediment. Geol. Tethyan Geol. 2021. in press (In Chinese) [Google Scholar]
- Wu, T.; Xiao, L.; Wilde, S.A.; Ma, C.Q.; Li, Z.L.; Sun, Y.; Zhan, Q.Y. Zircon U–Pb age and Sr–Nd–Hf isotope geochemistry of the Ganluogou dioritic complex in the northern Triassic Yidun arc belt, Eastern Tibetan Plateau: Implications for the closure of the Garzê-Litang Ocean. Lithos 2016, 248–251, 94–108. [Google Scholar] [CrossRef]
- Wu, T.; Xiao, L.; Wilde, S.A.; Ma, C.Q.; Zhou, J.X. A mixed source for the Late Triassic Garzê-Daocheng granitic belt and its implications for the tectonic evolution of the Yidun arc belt, eastern Tibetan Plateau. Lithos 2017, 288–289, 214–230. [Google Scholar] [CrossRef] [Green Version]
- Gao, X.; Yang, L.Q.; Orovan, E.A. The lithospheric architecture of two subterranes in the eastern Yidun Terrane, East Tethys: Insights from Hf–Nd isotopic mapping. Gondwana Res. 2018, 62, 127–143. [Google Scholar] [CrossRef]
- Zhan, Q.Y.; Zhu, D.C.; Wang, Q.; Cawood, P.A.; Xie, J.C.; Liu, X.; Li, S.M.; Zhang, L.L.; Zhao, Z.D. Imaging the Late Triassic lithospheric architecture of the Yidun Terrane, eastern Tibetan Plateau: Observations and interpretations. Geol. Soc. Am. Bull. 2021, 133, 2279–2290. [Google Scholar] [CrossRef]
- Gong, X.; Yang, Z.; Meng, X.; Pan, X.; Wang, Q.; Zhang, L. Late Paleozoic to Mesozoic intrusions distribution in the north Sanjiang Orogenic Belt, Southwest China: Evidence from zircon U–Pb dating and geochemistry. Acta Geol. Sin. (Engl. Ed.) 2017, 91, 898–946. [Google Scholar] [CrossRef]
- Xu, X.; Wen, X.; Yu, G.; Zheng, R.; Luo, H.; Zheng, B. Average slip rate, earthquake rupturing segmentation and recurrence behavior on the Litang fault zone, western Sichuan Province, China. Sci. China Ser. D Earth Sci. 2005, 48, 1183–1196. [Google Scholar] [CrossRef]
- Zhang, Y.-Z.; Replumaz, A.; Wang, G.C.; Leloup, P.H.; Gautheron, C.; Bernet, M.; van der Beek, P.; Paquette, J.L.; Wang, A.; Zhang, K.-X.; et al. Timing and rate of exhumation along the Litang fault system, implication for fault reorganization in Southeast Tibet. Tectonics 2015, 34, 1219–1243. [Google Scholar] [CrossRef]
- Molenda, T. Impact of saline mine water: Development of a meromictic reservoir in Poland. Mine Water Environ. 2014, 33, 327–334. [Google Scholar] [CrossRef]
- Woith, H.; Wang, R.; Maiwald, U.; Pekdeger, A.; Zschau, J. On the origin of geochemical anomalies in groundwaters induced by the Adana 1998 earthquake. Chem. Geol. 2013, 339, 177–186. [Google Scholar] [CrossRef]
- Bian, Y.; Zhao, D. Genesis of geothermal waters in the Kangding geothermal field, Sichuan Province. Acta Geosci. Sin. 2018, 39, 491–497. (In Chinese) [Google Scholar]
- Kurdi, M.; Hezarkhani, R.; Eslamkish, T. Assessment of chemical properties and hydro-geochemical coefficients at the Qareh Sou Basin, Golestan Province, Iran. Environ. Earth Sci. 2014, 72, 3243–3249. [Google Scholar] [CrossRef]
- Craig, H. Isotopic variations in meteoric waters. Science 1961, 133, 1702–1703. [Google Scholar] [CrossRef]
- Li, L.; Garzione, G.N. Spatial distribution and controlling factors of stable isotopes in meteoric waters on the Tibetan Plateau: Implications for paleoelevation reconstruction. Earth Planet Sc. Lett. 2017, 460, 302–314. [Google Scholar] [CrossRef] [Green Version]
- Giggenbach, W.F. Isotopic shifts in waters from geothermal and volcanic systems along convergent plate boundaries and their origin. Earth Planet Sc. Lett. 1992, 113, 495–510. [Google Scholar] [CrossRef]
- Ma, Z.; Yu, J.; Su, Y.; Xie, J.; Jia, X.; Hu, Y. δ18O shifts of geothermal waters in the central of Weihe Basin, NW China. Environ. Earth Sci. 2010, 59, 995–1008. [Google Scholar] [CrossRef]
- Jeelani, G.; Kumar, U.S.; Kumar, B. Variation of δ18O and δD in precipitation and stream waters across the Kashmir Himalaya (India) to distinguish and estimate the seasonal sources of stream flow. J. Hydrol. 2013, 481, 157–165. [Google Scholar] [CrossRef]
- Blash, K.W.; Bryson, J.R. Distinguishing sources of ground water recharge by using delta2H and delta18O. Ground Water 2007, 45, 294–308. [Google Scholar] [CrossRef]
- Bowen, G.J.; Wilkinson, B. Spatial distribution of δ18O in meteoric precipitation. Geology 2002, 30, 315–318. [Google Scholar] [CrossRef]
- Bowen, G.J.; Revenaugh, J. Interpolating the isotopic composition of modern meteroric precipitation. Water Resour. Res. 2003, 39, 1–13. [Google Scholar] [CrossRef]
- Feng, S.; Liu, X.; Li, H. Spatial variation of δD and δO in lake water of western China and their controlling factors. J. Lake Sci. 2020, 32, 1199–1211. (In Chinese) [Google Scholar]
- Yang, X.X.; Xu, B.Q.; Yang, W.; Qu, D.M. The Indian monsoonal influence on altitude effect of δ18O in surface water on southeast Tibetan Plateau. Sci. China: Earth Sci. 2012, 55, 438–445. [Google Scholar] [CrossRef]
- Sidkina, E.S. Brines in the western part of the Tunguska Artesian Basin. Geochem. Int. 2015, 53, 735–747. [Google Scholar] [CrossRef]
- Piper, A.M. A graphic procedure in the geochemical interpretation of water-analyses. EOS, Trans., Am. Geophys. Union 1944, 25, 914–928. [Google Scholar] [CrossRef]
- Zhao, J.; Wang, G.; Zhang, C.; Xing, L.; Li, M.; Zhang, W. Genesis of geothermal fluid in typical geothermal fields in Western Sichuan, China. Acta Geol. Sin. (Engl. Ed.) 2021, 95, 873–882. [Google Scholar] [CrossRef]
- Apollaro, C.; Vespasiano, G.; De Rosa, R.; Marini, L. Use of mean residence time and flowrate of thermal waters to evaluate the volume of reservoir water contributing to the natural discharge and the related geothermal reservoir volume. Application to Northern Thailand hot springs. Geothermics 2015, 58, 62–74. [Google Scholar] [CrossRef]
- Apollaro, C.; Vespasiano, G.; Muto, F.; De Rosa, R.; Barca, D.; Marini, L. Use of mean residence time of water, flowrate, and equilibrium temperature indicated by water geothermometers to rank geothermal resources. Application to the thermal water circuits of Northern Calabria. J. Volcanol. Geotherm. Res. 2016, 328, 147–158. [Google Scholar] [CrossRef]
- Zhao, J.; Zhang, W.; Zhang, H.; Qu, Z.; Li, M.; Yue, G. Hydrogeochemical characteristics and genesis of the geothermal fields in Batang of Sichuan. Hydrogeol. Eng. Geol. 2019, 46, 81–89. (In Chinese) [Google Scholar]
- Peng, C.; Liu, Y.; Chen, H.; Yuan, Q.; Chen, Q.; Mei, S.; Wu, Z. Analysis of hydrogeochemical characteristics of tunnel groundwater based on multivariate statistical technology. Geofluids 2021, 2021, 4867942. [Google Scholar] [CrossRef]
- Long, D.; Huang, F.; Guan, Z. Analysis on the geotectonic environment and the forming factors of the hot spring in Maoya. Earthquake Res. Sichuan 2006, 118, 34–40. (In Chinese) [Google Scholar]
- Martínez-Florentino, T.A.K.; Esteller-Alberich, M.V.; Expósito, J.L.; Domínguez-Mariani, E.; Morales-Arredondo, J.I. Hydrogeochemistry and geothermometry of thermal springs in the eastern Trans-Mexican Volcanic Belt. Geothermics 2021, 96, 102176. [Google Scholar] [CrossRef]
- Apollaro, C.; Caracausi, A.; Paternoster, M.; Randazzo, P.; Aiuppa, A.; De Rosa, R.; Fuoco, I.; Mongelli, G.; Muto, F.; Vanni, E.; et al. Fluid geochemistry in a low-enthalpy geothermal field along a sector of southern Apennines chain (Italy). J. Geochem. Explor. 2020, 219, 106618. [Google Scholar] [CrossRef]
- Frondini, F. Geochemistry of regional aquifer systems hosted by carbonate-evaporite formations in Umbria and southern Tuscany (central Italy). Appl. Geochem. 2008, 23, 2091–2104. [Google Scholar] [CrossRef]
- Nicholson, K. Geothermal Fluids: Chemistry and Exploration Techniques; Springer: Berlin/Heidelberg, Germany; pp. 1–263.
- Kanduč, T.; Mori, N.; Kocman, D.; Stibilj, V.; Grassa, F. Hydrogeochemistry of Alpine springs from North Slovenia: Insights from stable isotopes. Chem. Geol. 2012, 300-301, 40–54. [Google Scholar] [CrossRef]
- Wang, B.Q.; Zhou, M.F.; Chen, W.T.; Gao, J.F.; Yan, D.P. Petrogenesis and tectonic implications of the Triassic volcanic rocks in the northern Yidun Terrane, Eastern Tibet. Lithos 2013, 175-176, 285–301. [Google Scholar] [CrossRef]
- Wang, B.; Zhou, X.; Zhou, Y.; Yan, Y.; Ouyang, S.; Liu, F.; Zhong, J. Hydrogeochemistry and precursory anomalies in thermal springs of Fujian (Southeastern China) associated with earthquakes in the Taiwan Strait. Water 2021, 13, 3523. [Google Scholar] [CrossRef]
- Chao, H.C.; You, C.F.; Liu, H.C.; Chung, C.H. Evidence for stable Sr isotope fractionation by silicate weathering in a small sedimentary watershed in southwestern Taiwan. Geochim. Cosmochim. Acta 2015, 165, 324–341. [Google Scholar] [CrossRef]
- Capo, R.C.; Stewart, B.W.; Chadwick, O.A. Strontium isotopes as tracers of ecosystem processes: Theory and methods. Geoderma 1998, 82, 197–225. [Google Scholar] [CrossRef]
- Hajj, F.; Poszwa, A.; Bouchez, J.; Guerold, F. Radiogenic and “stable” strontium isotopes in provenance studies: A review and first results on archaeological wood from shipwrecks. J. Archaeol. Sci. 2017, 86, 24–49. [Google Scholar] [CrossRef]
- Zhang, Z. 87Sr/86Sr data for some middle-late Proterozoic to early Cambrian carbonate rocks in China. Geol. Rev. 1995, 41, 349–354. (In Chinese) [Google Scholar]
- Tian, J.; Pang, Z.; Wang, Y.; Guo, Q. Fluid geochemistry of the Cuopu high temperature geothermal system in the eastern Himalayan syntaxis with implication on its genesis. Environ. Appl. Geochem. 2019, 110, 104422. [Google Scholar] [CrossRef]
- Tian, J.; Pang, Z.; Liao, D.; Zhou, X. Fluid geochemistry and its implications on the role of deep faults in the genesis of high temperature systems in the eastern edge of the Qinghai Tibet Plateau. Environ. Appl. Geochem. 2021, 131, 105036. [Google Scholar] [CrossRef]
- Harrington, G.A.; Herczeg, A.L. The importance of silicate weathering of a sedimentary aquifer in arid Central Australia indicated by very high 87Sr/86Sr ratios. Chem. Geol. 2003, 199, 281–292. [Google Scholar] [CrossRef]
- Dai, Z.; Sun, C. Sedimentary facies and paleogeography of the Upper Triassic Qugasi Formation in Yidun, Sichuan. Acta Geol. Sichuan 2008, 28, 266–271. (In Chinese) [Google Scholar]
- Wang, X.; Tang, Z. The first large-scale bioavailable Sr isotope map of China and its implication for provenance studies. Earth-Sci. Rev. 2020, 210, 103353. [Google Scholar] [CrossRef]
- Giggenbach, W.F. Geothermal solute equilibria. Derivation of Na-K-Mg-Ca geoindicators. Geochim. Cosmochim. Acta 1988, 52, 2749–2765. [Google Scholar] [CrossRef]
- Romano, P.; Liotta, M. Using and abusing Giggenbach ternary Na-K-Mg diagram. Chem. Geol. 2020, 541, 119577. [Google Scholar] [CrossRef]
- Guo, Q.; Pang, Z.; Wang, Y.; Tian, J. Fluid geochemistry and geothermometry applications of the Kangding high-temperature geothermal system in eastern Himalayas. Appl. Geochem. 2017, 81, 63–75. [Google Scholar] [CrossRef]
- Li, W.Y.; Zhang, J.; Tang, X.C.; Tian, J.; Wang, Y.C.; Guo, Q. The deep geothermal structure of high-temperature hydrothermal activity region in western Sichuan Plateau: A geophysical study. Chinese J. Geophys. 2018, 61, 2926–2936. (In Chinese) [Google Scholar]
- Fournier, R.O. Chemical geothermometers and mixing models for geothermal systems. Geothermics 1977, 5, 41–50. [Google Scholar] [CrossRef]
- Kharaka, Y.K.; Lico, M.S.; Lawl, L.M. Chemical geothermometers applied to formation waters, Gulf of Mexico and California basins: ABSTRACT. Am. Assoc. Pet. Geol. Bull. 1982, 66, 588–589. [Google Scholar]
- Kharaka, Y.K.; Mariner, R.H. Chemical geothermometers and their application to formation waters from sedimentary basins. In Thermal History of Sedimentary Basins; Naeser, N.D., McCulloh, T.H., Eds.; Springer: New York, NY, USA, 1989; pp. 99–117. [Google Scholar]
- Fournier, R.O.; Truesdell, A.H. An empirical Na-K-Ca geothermometer for natural waters. Geochim. Cosmochim. Acta 1973, 37, 1255–1275. [Google Scholar] [CrossRef]
- Wang, J.; Jin, M.; Jia, B.; Kang, F. Hydrochemical characteristics and geothermometry applications of thermal groundwater in northern Jinan, Shandong, China. Geothermics 2015, 57, 185–195. [Google Scholar] [CrossRef]
- Chiodini, G.; Frondini, F.; Marini, L. Theoretical geothermometers and indicators for aqueous solutions coming from hydrothermal systems of medium-low temperature hosted in carbonate-evaporite rocks. Application to the thermal springs of the Etruscan Swell, Italy. Appl. Geochem. 1995, 10, 337–346. [Google Scholar]
- Minissale, A.A.; Duchi, D. Geothermometry on fluids circulating in a carbonate reservoir in North-Centre Italy. J. Volcanol. Geoth. Res. 1988, 35, 237–252. [Google Scholar]
- Zhang, W.; Wang, G.; Zhao, J.; Liu, F. Geochemical characteristics of medium-high temperature geothermal fluids in West Sichuan and their geological implications. Geoscience 2021, 35, 188–198. (In Chinese) [Google Scholar]
- Reed, M.; Spycher, N. Calculation of pH and mineral equilibria in hydrothermal waters with application to geothermometry and studies of boiling and dilution. Geochim. Cosmochim. Acta 1984, 48, 1479–1492. [Google Scholar]
- Huang, X.; Sillanpää, M.; Gjessing, E.T.; Vogt, R.D. Water quality in the Tibetan Plateau: Major ions and trace elements in the headwaters of four major Asian rivers. Sci. Total Environ. 2009, 407, 6242–6254. [Google Scholar]
- Li, J.; Huang, S.; Wen, X. Discussing the temperature abnormal changes of spring water in Maoya. Acta Geol. Sichuan 2005, 25, 10–16. (In Chinese) [Google Scholar]
- Wintsch, R.P.; Christoffersen, R.; Kronenberg, A.K. Fluid-rock reaction weakening of fault zones. J. Geophys. Res.: Solid Earth 1995, 100, 13021–13032. [Google Scholar]
- Yan, Y.; Zhou, X.; Liao, L.; Tian, J.; Li, Y.; Shi, Z.; Liu, F.; Ouyang, S. Hydrogeochemical characteristic of geothermal water and precursory anomalies along the Xianshuihe Fault Zone, Southwestern China. Water 2022, 14, 550. [Google Scholar]
- Wei, Y.; Hu, Y. Formation of the hot springs in Kahui, Litang, Sichuan. J. Geol. Hazards Environ. Preserv. 2014, 25, 78–82. (In Chinese) [Google Scholar]


| Sampling ID | δ18O(‰) | δ2H(‰) | δ18O*(‰) | δ2H *(‰) | HO (m) | |
|---|---|---|---|---|---|---|
| S01 | −17.2 | −130.0 | −14.6 | −105 | 4798 | 4814 |
| S02 | −16.6 | −129.2 | −14.1 | −102 | 4902 | 4616 |
| S03 | −17.0 | −130.0 | −12.1 | −87 | 4660 | 4529 |
| S04 | −20.4 | −154.8 | −15.3 | −110 | 5953 | 5815 |
| S05 | −16.3 | −129.3 | −14.0 | −100 | 4869 | 4428 |
| S06 | −15.4 | −123.4 | −13.5 | −97 | 4518 | 4062 |
| S07 | −16.5 | −130.6 | −14.6 | −105 | 4999 | 4576 |
| S08 | −20.1 | −157.6 | −15.5 | −111 | 6174 | 5791 |
| S09 | −15.9 | −126.6 | −15.1 | −108 | 4883 | 4379 |
| S10 | −20.7 | −148.0 | −14.8 | −106 | 5719 | 5969 |
| S13 | −20.8 | −156.0 | −14.7 | −105 | 6075 | 6018 |
| S14 | −20.3 | −154.8 | −14.7 | −105 | 6019 | 5842 |
| S15 | −20.4 | −157.3 | −14.1 | −100 | 6094 | 5842 |
| S16 | −19.7 | −152.6 | −13.9 | −99 | 5861 | 5594 |
| S17 | −20.2 | −153.7 | −14.0 | −100 | 5893 | 5757 |
| S18 | −20.6 | −156.4 | −13.5 | −96 | 6018 | 5908 |
| S19 | −20.7 | −155.8 | −13.8 | −98 | 6003 | 5934 |
| Sample ID | Chalcedony No Steam Loss | Chalcedony Steam Loss | Quartz No Steam Loss | Quartz Steam Loss | Na/K | Na/Li | Li-Mg | Na-K-Ca | Ca/Mg |
|---|---|---|---|---|---|---|---|---|---|
| S01 | 27.3 | 34.1 | 59.5 | 65.5 | 168 | 174 | 59.8 | 140.9 | 36.7 |
| S02 | 50.9 | 54.3 | 82.1 | 85.4 | 168 | 121 | 57 | 140.9 | 153.0 |
| S03 | 38.8 | 44.1 | 70.6 | 75.3 | 147.3 | 160.5 | 81.4 | 125.5 | 46.3 |
| S04-2 | 91.5 | 88.0 | 119.9 | 118.1 | 210.7 | 258.3 | 210.7 | 172.2 | 143.6 |
| S05 | 40.2 | 45.2 | 71.9 | 76.4 | 202.1 | 160.7 | 69.9 | 165.8 | 81.8 |
| S06 | 55.2 | 57.9 | 86.1 | 88.9 | 225.8 | 194.5 | 85.3 | 182.9 | 15.7 |
| S07 | 33.3 | 39.3 | 65.3 | 70.6 | 199.9 | 159.1 | 66.9 | 164.3 | 65.8 |
| S08-5 | 38.8 | 44.1 | 70.6 | 75.3 | 257.8 | 206.4 | 85.5 | 205.1 | 11.5 |
| S10-3 | 29 | 35.6 | 61.1 | 66.9 | 197.3 | 262.7 | 113.1 | 162.5 | 36.9 |
| S13-5 | 38.8 | 44.1 | 70.6 | 75.3 | 185.9 | 219.1 | 110.8 | 154.2 | 30.7 |
| S14-2 | 61.1 | 62.9 | 91.7 | 93.8 | 170.3 | 138.1 | — | 142.6 | — |
| S15-2 | 27.3 | 34.1 | 59.5 | 65.5 | 194.2 | 193 | 81.1 | 160.3 | 24.9 |
| S16-2 | 33.8 | 39.8 | 65.8 | 71.1 | 263.5 | 185.2 | 80.8 | 208.9 | 60.2 |
| S17-4 | 26.5 | 33.4 | 58.7 | 64.7 | 237.1 | 213.4 | 95.9 | 190.8 | 13.5 |
| S18-2 | 27.5 | 34.3 | 59.7 | 65.7 | 280.4 | 168 | 70.3 | 220.3 | 51.0 |
| S19-2 | 67.1 | 67.9 | 97.4 | 98.7 | 255.3 | 184.3 | 95.9 | 203.5 | 4.0 |
| Sample ID | Reservoir Temperature (°C) | Air Temperature (°C) | Circulation Depth (m) |
|---|---|---|---|
| S01 | 174.0 | 3.0 | 3620 |
| S02 | 121.0 | 3.0 | 2504 |
| S03 | 160.5 | 3.0 | 3336 |
| S04-2 | 258.3 | 3.0 | 5395 |
| S05 | 160.7 | 3.0 | 3340 |
| S06 | 194.5 | 3.0 | 4052 |
| S07 | 159.1 | 3.0 | 3306 |
| S08-5 | 206.4 | 3.0 | 4302 |
| S10-3 | 262.7 | 3.0 | 5487 |
| S13-5 | 219.1 | 3.0 | 4569 |
| S14-2 | 138.1 | 3.0 | 2864 |
| S15-2 | 193.0 | 3.0 | 4020 |
| S16-2 | 185.2 | 3.0 | 3856 |
| S17-4 | 213.4 | 3.0 | 4449 |
| S18-2 | 168.0 | 3.0 | 3494 |
| S19-2 | 184.3 | 3.0 | 3837 |
Publisher’s Note: MDPI stays neutral with regard to jurisdictional claims in published maps and institutional affiliations. |
© 2022 by the authors. Licensee MDPI, Basel, Switzerland. This article is an open access article distributed under the terms and conditions of the Creative Commons Attribution (CC BY) license (https://creativecommons.org/licenses/by/4.0/).
Share and Cite
Zhou, R.; Zhou, X.; Li, Y.; He, M.; Li, J.; Dong, J.; Tian, J.; Li, K.; Yan, Y.; Ouyang, S.; et al. Hydrogeochemical and Isotopic Characteristics of the Hot Springs in the Litang Fault Zone, Southeast Qinghai–Tibet Plateau. Water 2022, 14, 1496. https://0-doi-org.brum.beds.ac.uk/10.3390/w14091496
Zhou R, Zhou X, Li Y, He M, Li J, Dong J, Tian J, Li K, Yan Y, Ouyang S, et al. Hydrogeochemical and Isotopic Characteristics of the Hot Springs in the Litang Fault Zone, Southeast Qinghai–Tibet Plateau. Water. 2022; 14(9):1496. https://0-doi-org.brum.beds.ac.uk/10.3390/w14091496
Chicago/Turabian StyleZhou, Rui, Xiaocheng Zhou, Ying Li, Miao He, Jingchao Li, Jinyuan Dong, Jiao Tian, Kaiyue Li, Yucong Yan, Shupei Ouyang, and et al. 2022. "Hydrogeochemical and Isotopic Characteristics of the Hot Springs in the Litang Fault Zone, Southeast Qinghai–Tibet Plateau" Water 14, no. 9: 1496. https://0-doi-org.brum.beds.ac.uk/10.3390/w14091496