
Estimating Typhoon-Induced Maximum Flood for Spillway Safety Assessment—Case Studies in Taiwan

Department of River & Harbor Engineering, National Taiwan Ocean University, Keelung 202, Taiwan
*
Author to whom correspondence should be addressed.
Water 2023, 15(17), 3040; https://0-doi-org.brum.beds.ac.uk/10.3390/w15173040
Submission received: 4 July 2023
/
Revised: 7 August 2023
/
Accepted: 18 August 2023
/
Published: 24 August 2023
(This article belongs to the Special Issue Hydroinformatic Tools and Spatial Analysis in Water Resources and Water Extreme Events Study)
Abstract
:Dam safety assessment is usually conducted regularly to investigate the risks associated with the dam and propose remedies to ensure effective reservoir operations. One crucial aspect of the evaluation involves performing hydrological analyses to determine if the existing spillway can successfully deliver the probable maximum flood (PMF) downstream. This study applied storm transposition and typhoon rainstorm methods for PMP estimations. The resulting PMP values were then used as input for runoff models to generate flood hydrographs for PMF determination. A modification for the storm transposition method was proposed to determine the barrier height considering the moisture inflow direction. In estimating the orographic rainfall in the typhoon rainstorm model, an effective terrain slope was suggested according to different windward directions based on DEM analysis. Shihmen Reservoir and Feitsui Reservoir, located in northern Taiwan, were used as examples to conduct the PMP and PMF analysis. The obtained PMPs were further compared with the results generated by Hershfield’s method to assess the reasonability of the estimation. The results show that the maximum deviation of the 24-h PMP values estimated by the three methods is within 30% in the Shihmen watershed and 16% in the Feitsui watershed. The PMF estimations in the two reservoir watersheds are larger than the design discharges of the existing spillways. Hence, extending the capacity of the existing spillways or constructing upstream bypasses to avoid catastrophic flooding downstream is required.
1. Introduction
One of the most important appurtenant structures in a dam is the spillway. A spillway is used to control the water release from the reservoir to the downstream. It should ensure that excess water will not damage parts of the dam structure and be able to drain the major floods to maintain the reservoir water level below the predetermined maximum level. The design capacity of a spillway for a low dam may depend on a frequency analysis. The probable maximum flood (PMF) is usually used for a high dam. It is all because if the spillway cannot drain the floodwater downstream successfully, a large amount of water stored in the upstream watershed of the reservoir would result in dam failures and induce catastrophic flood downstream, causing significant losses.
PMF is the theoretically largest flood resulting from the most severe meteorological and hydrologic conditions that would happen in a given area [1]. PMF is used as a safety assessment for the existing large dams. Similar to the definition of PMF, the probable maximum precipitation (PMP) is defined as the theoretically largest amount of precipitation that may fall on a given area within a specified duration [2]. PMF integrates the spatial and temporal distribution of PMP and the topographic characteristics of the upstream reservoir watershed. Hence, a hydrological analysis should be conducted to estimate the PMP first and then cooperate with a rainfall-runoff model to transfer the PMP into PMF.
Since the PMP/PMF probability is unknown, the estimation process is inconsistent with the existing hydrological conditions. Different methods have been proposed for PMP estimation, which can be broadly classified into two categories: statistical and deterministic approaches. Hershfield’s method [3,4,5] is a statistical approach for PMP estimation. This method can be applied to areas with sufficient precipitation records but a lack of other meteorological records (for example, humidity, wind speed, and dew point temperature). In this approach, the PMP value can be derived using the rainfall data from a meteorologically homogeneous zone through hydrological frequency analyses together with the regional generalized method. Due to the simplicity of performing the analyses, this method is the most widely used. It has become one of the standard methods suggested by the World Meteorological Organization [2] for PMP estimation.
Since historical precipitation data are usually not long enough to estimate the extreme hydrological situation at a specified location, deterministic approaches are proposed instead. Thompson and Tomlinson [6] applied the storm transposition method to estimate short-duration PMP (less than 6 h) for a catchment of less than 1000 km2 in New Zealand. Collier and Hardaker [7] estimated PMP in the U.K. using a convective storm model considering solar heating, orographic uplift, and mesoscale convergence. Svensson and Rakhecha [8] applied the storm transposition method to estimate PMP for the dams in the Hongru River basin of China to examine the safety of the dam design in comparison with earlier studies. Al-Mamun and Hashim [9] applied the storm transposition method to generate PMP isohyetal maps for Peninsular Malaysia. Fernando and Wickramasuriya [10] deducted 24-h point PMP values for seven meteorological stations of Sri Lanka using the hydrometeorological method and compared them with those generated using Hershfield’s method. Lee et al. [11] applied a regional climate model by adjusting initial and boundary conditions to reconstruct the severe storm event for PMP estimation in Korea. Afzali-Gorouh et al. [12] estimated 24-h PMP using statistical and hydrometeorological approaches in the humid climate of northern Iran. They concluded that the physical approach could provide the most reliable estimates for PMP. Liao et al. [13] developed a new storm separation technique using rainfall quantiles with rare return periods estimated via regional L-moments analysis to calculate the orographic intensification factors for PMP estimation. Considering typhoon is the primary reason for significant flooding in Taiwan, Wang et al. [14] developed a typhoon rainstorm model for PMP estimation. The complicated typhoon structure was simplified in this modeling, and only circulation and orographic rainfalls were considered. Wang [15] performed the typhoon rainstorm model to estimate the PMP to accomplish the spillway design. Liu et al. [16] evaluated the combined effect of typhoon cyclones and southwestern airflow to estimate PMP.
Due to global warming in recent years, climate variability has resulted in more frequent extreme typhoon storms in Southeast Asian countries. This study focuses on evaluating the adequacy of the existing spillways’ design discharge in two large reservoirs in Taiwan. The storm transposition method and typhoon rainstorm model were performed for the PMP estimation, and Hershfield’s method as well as the frequency analysis, were further applied to assess the reasonability of the estimations. The PMP values were input into two watershed runoff models for the PMF estimation. The estimated PMFs are then compared with the design discharge of the existing spillways to assess the dam’s safety during floods.
2. Storm Transposition Method for PMP Estimation
Extreme rainstorm records are usually insufficient for a specified location to estimate PMP. Thus, extreme rainstorm records in the nearby hydrological-similar areas are collected instead for analysis after performing a transposition process to enhance the reliability of the PMP analysis. The transposition processes consider the local moisture content in the atmosphere column at a specified location. Moisture maximization can be accompanied using the sea level dewpoint temperature in conjunction with an assumed saturated atmosphere above the sea level. Moreover, the barrier effect of the moving moist current blocked by high mountains at the observation and the target sites should be considered. Hence, the rainstorm records in the observation site can be transported to the target site for the PMP estimation.
2.1. Structure of Storm Transposition Method
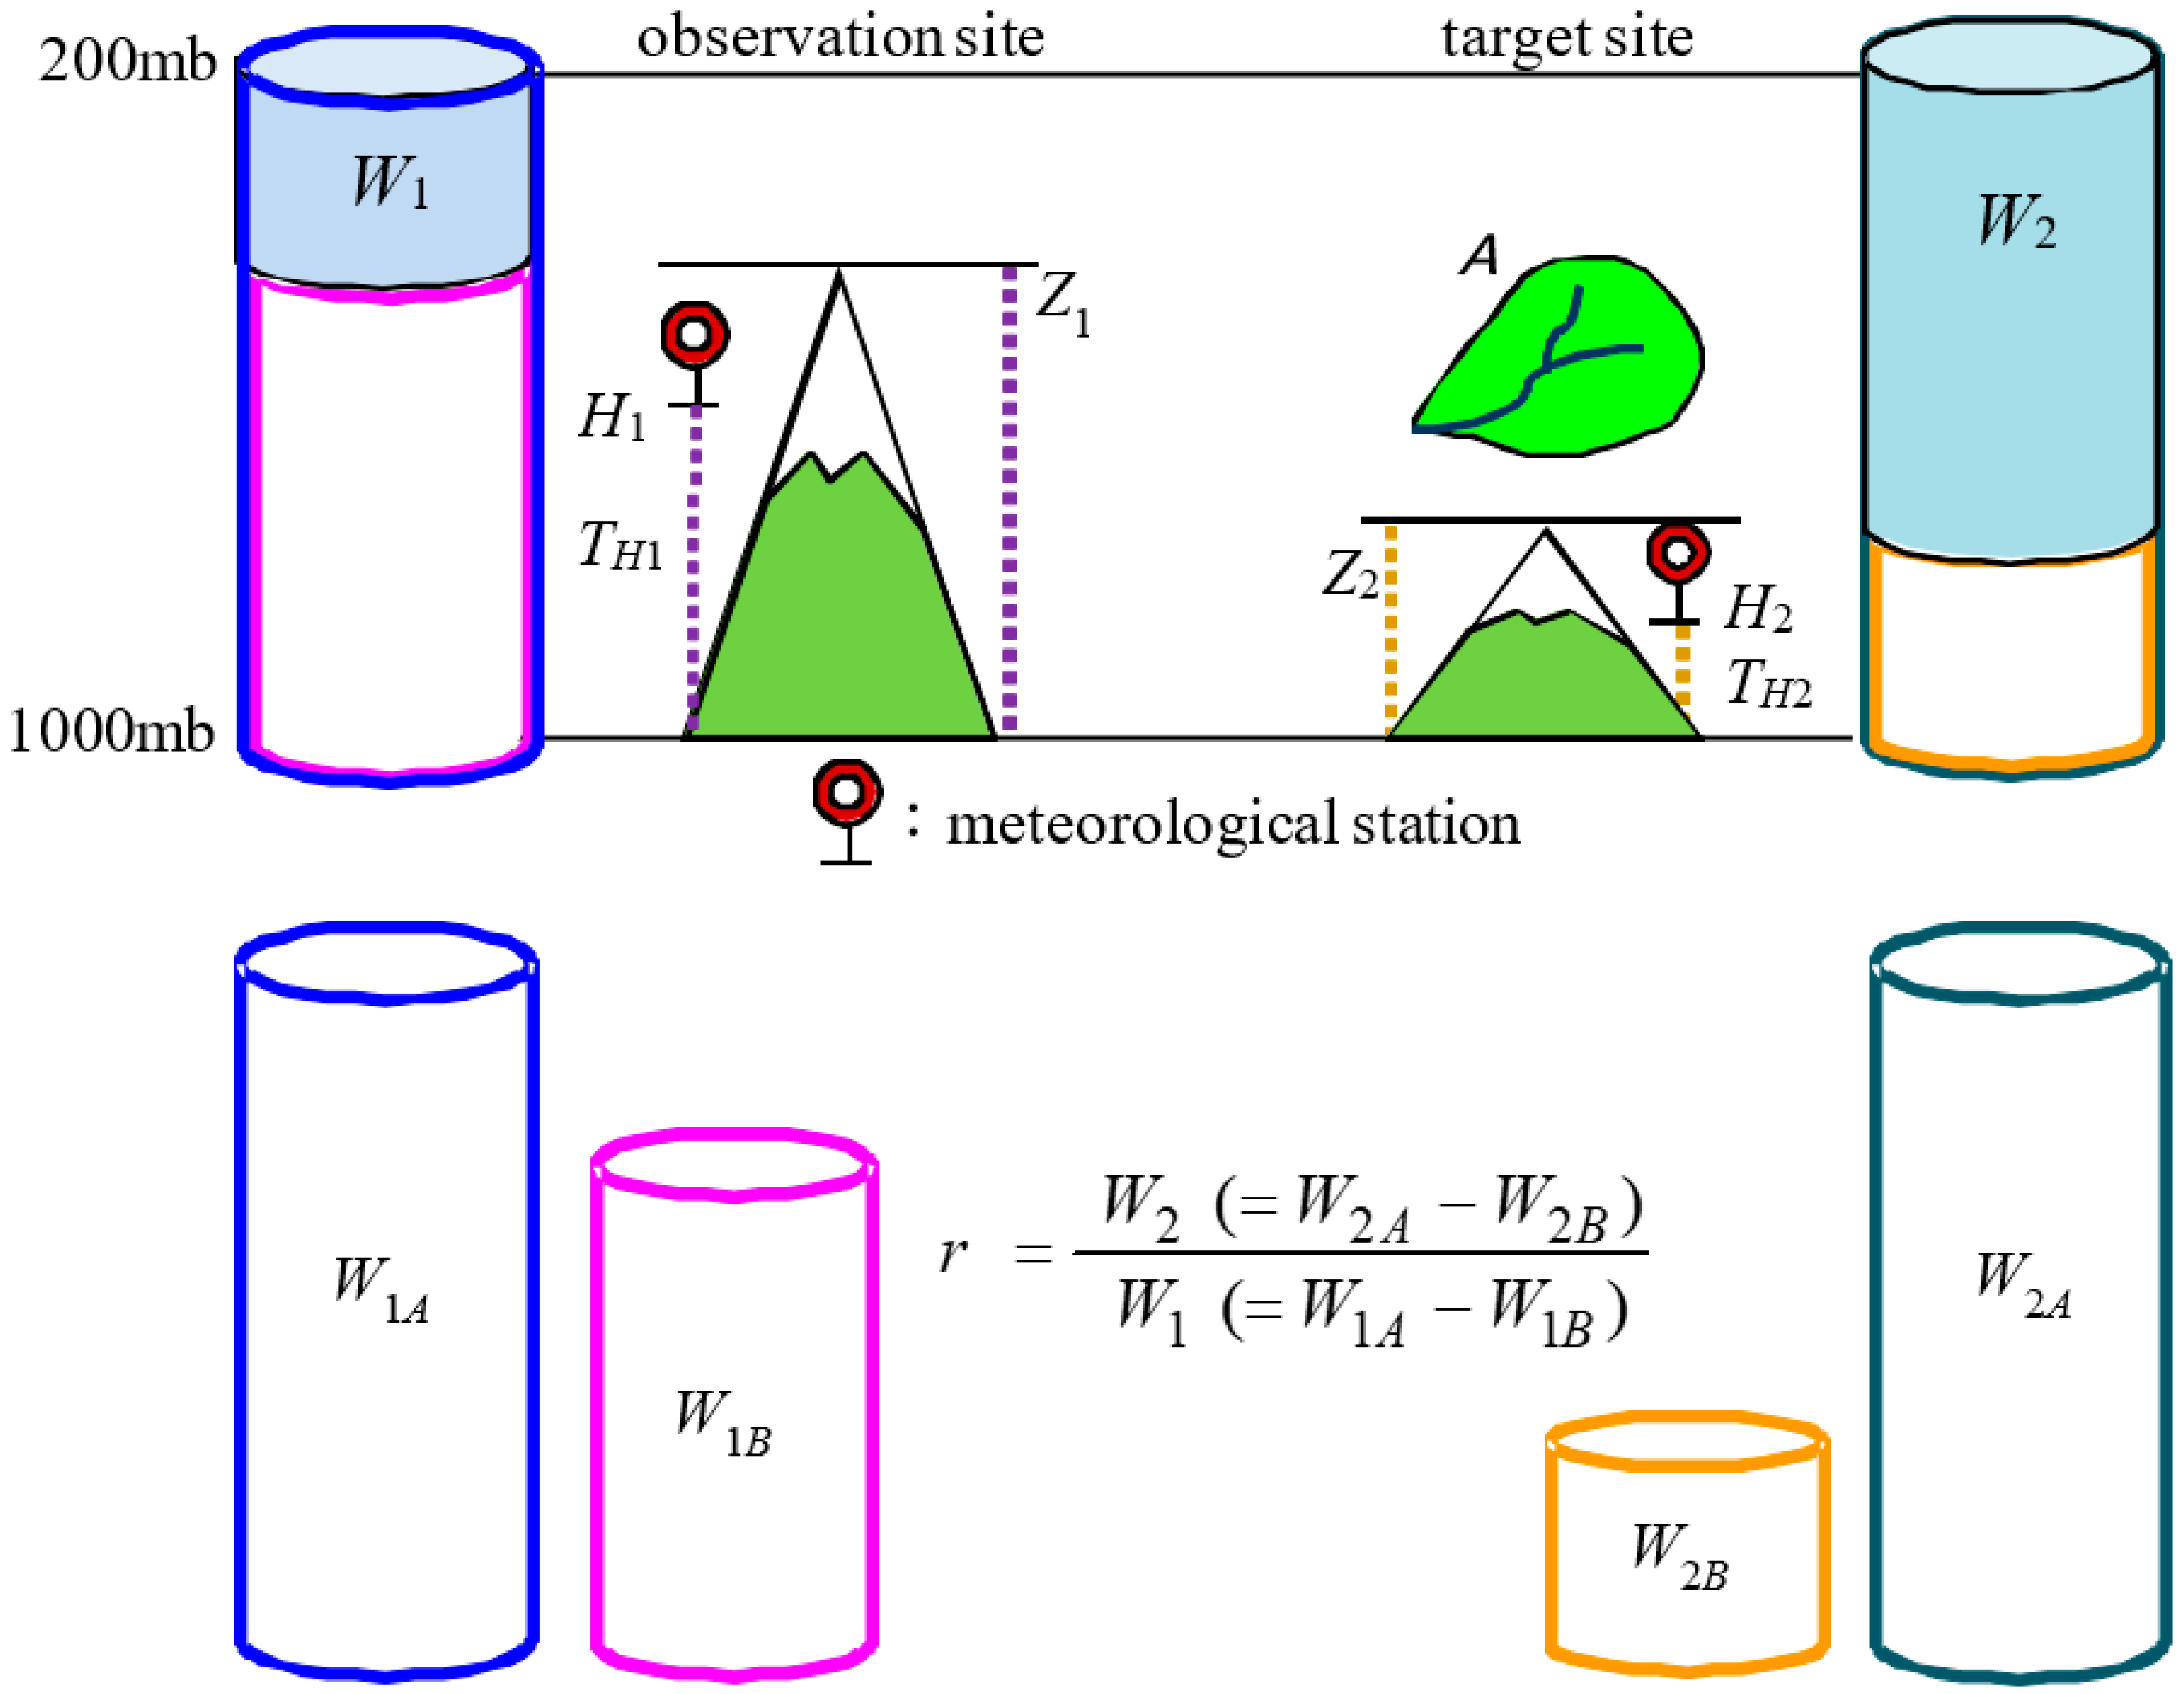
Figure 1 is a schematic diagram showing how to transpose the historically extreme storm records from the observation site (a meteorological station) near the storm center to the target site where a water resource project will be conducted. A prerequisite for the data transposition is that the meteorological and topographic characteristics are similar at the observation and target sites. Correction for the storm elevation is required if the storm elevation is not at the mean sea level. For the height of the storm less than 300 m, adjustment for storm elevation can be omitted [17,18].
As shown in Figure 1, W1A represents the precipitable water from the mean sea level (about 1000 mb) extending up to 10 km (about 200 mb). Considering the precipitable water due to the elevation variation between the meteorological station (the observation site) and the target site, an adjustment ratio is used to account for the moisture change in the atmosphere columns at different locations. The moisture adjustment ratio can be calculated as follows:
where r is the moisture adjustment ratio; W1A and W2A are the precipitable water from the sea level to the top of the atmosphere at the observation and the target sites, respectively. W1B is the precipitable water from the sea level (1000 mb) to the elevation of the observation site; W2B is the precipitable water from the sea level to the representative elevation of the target site. The representative elevation of the target site is usually selected as the lowest elevation of the projected watershed (Z2 in Figure 1), i.e., the watershed outlet, to maximize the moisture inflow to the target site.
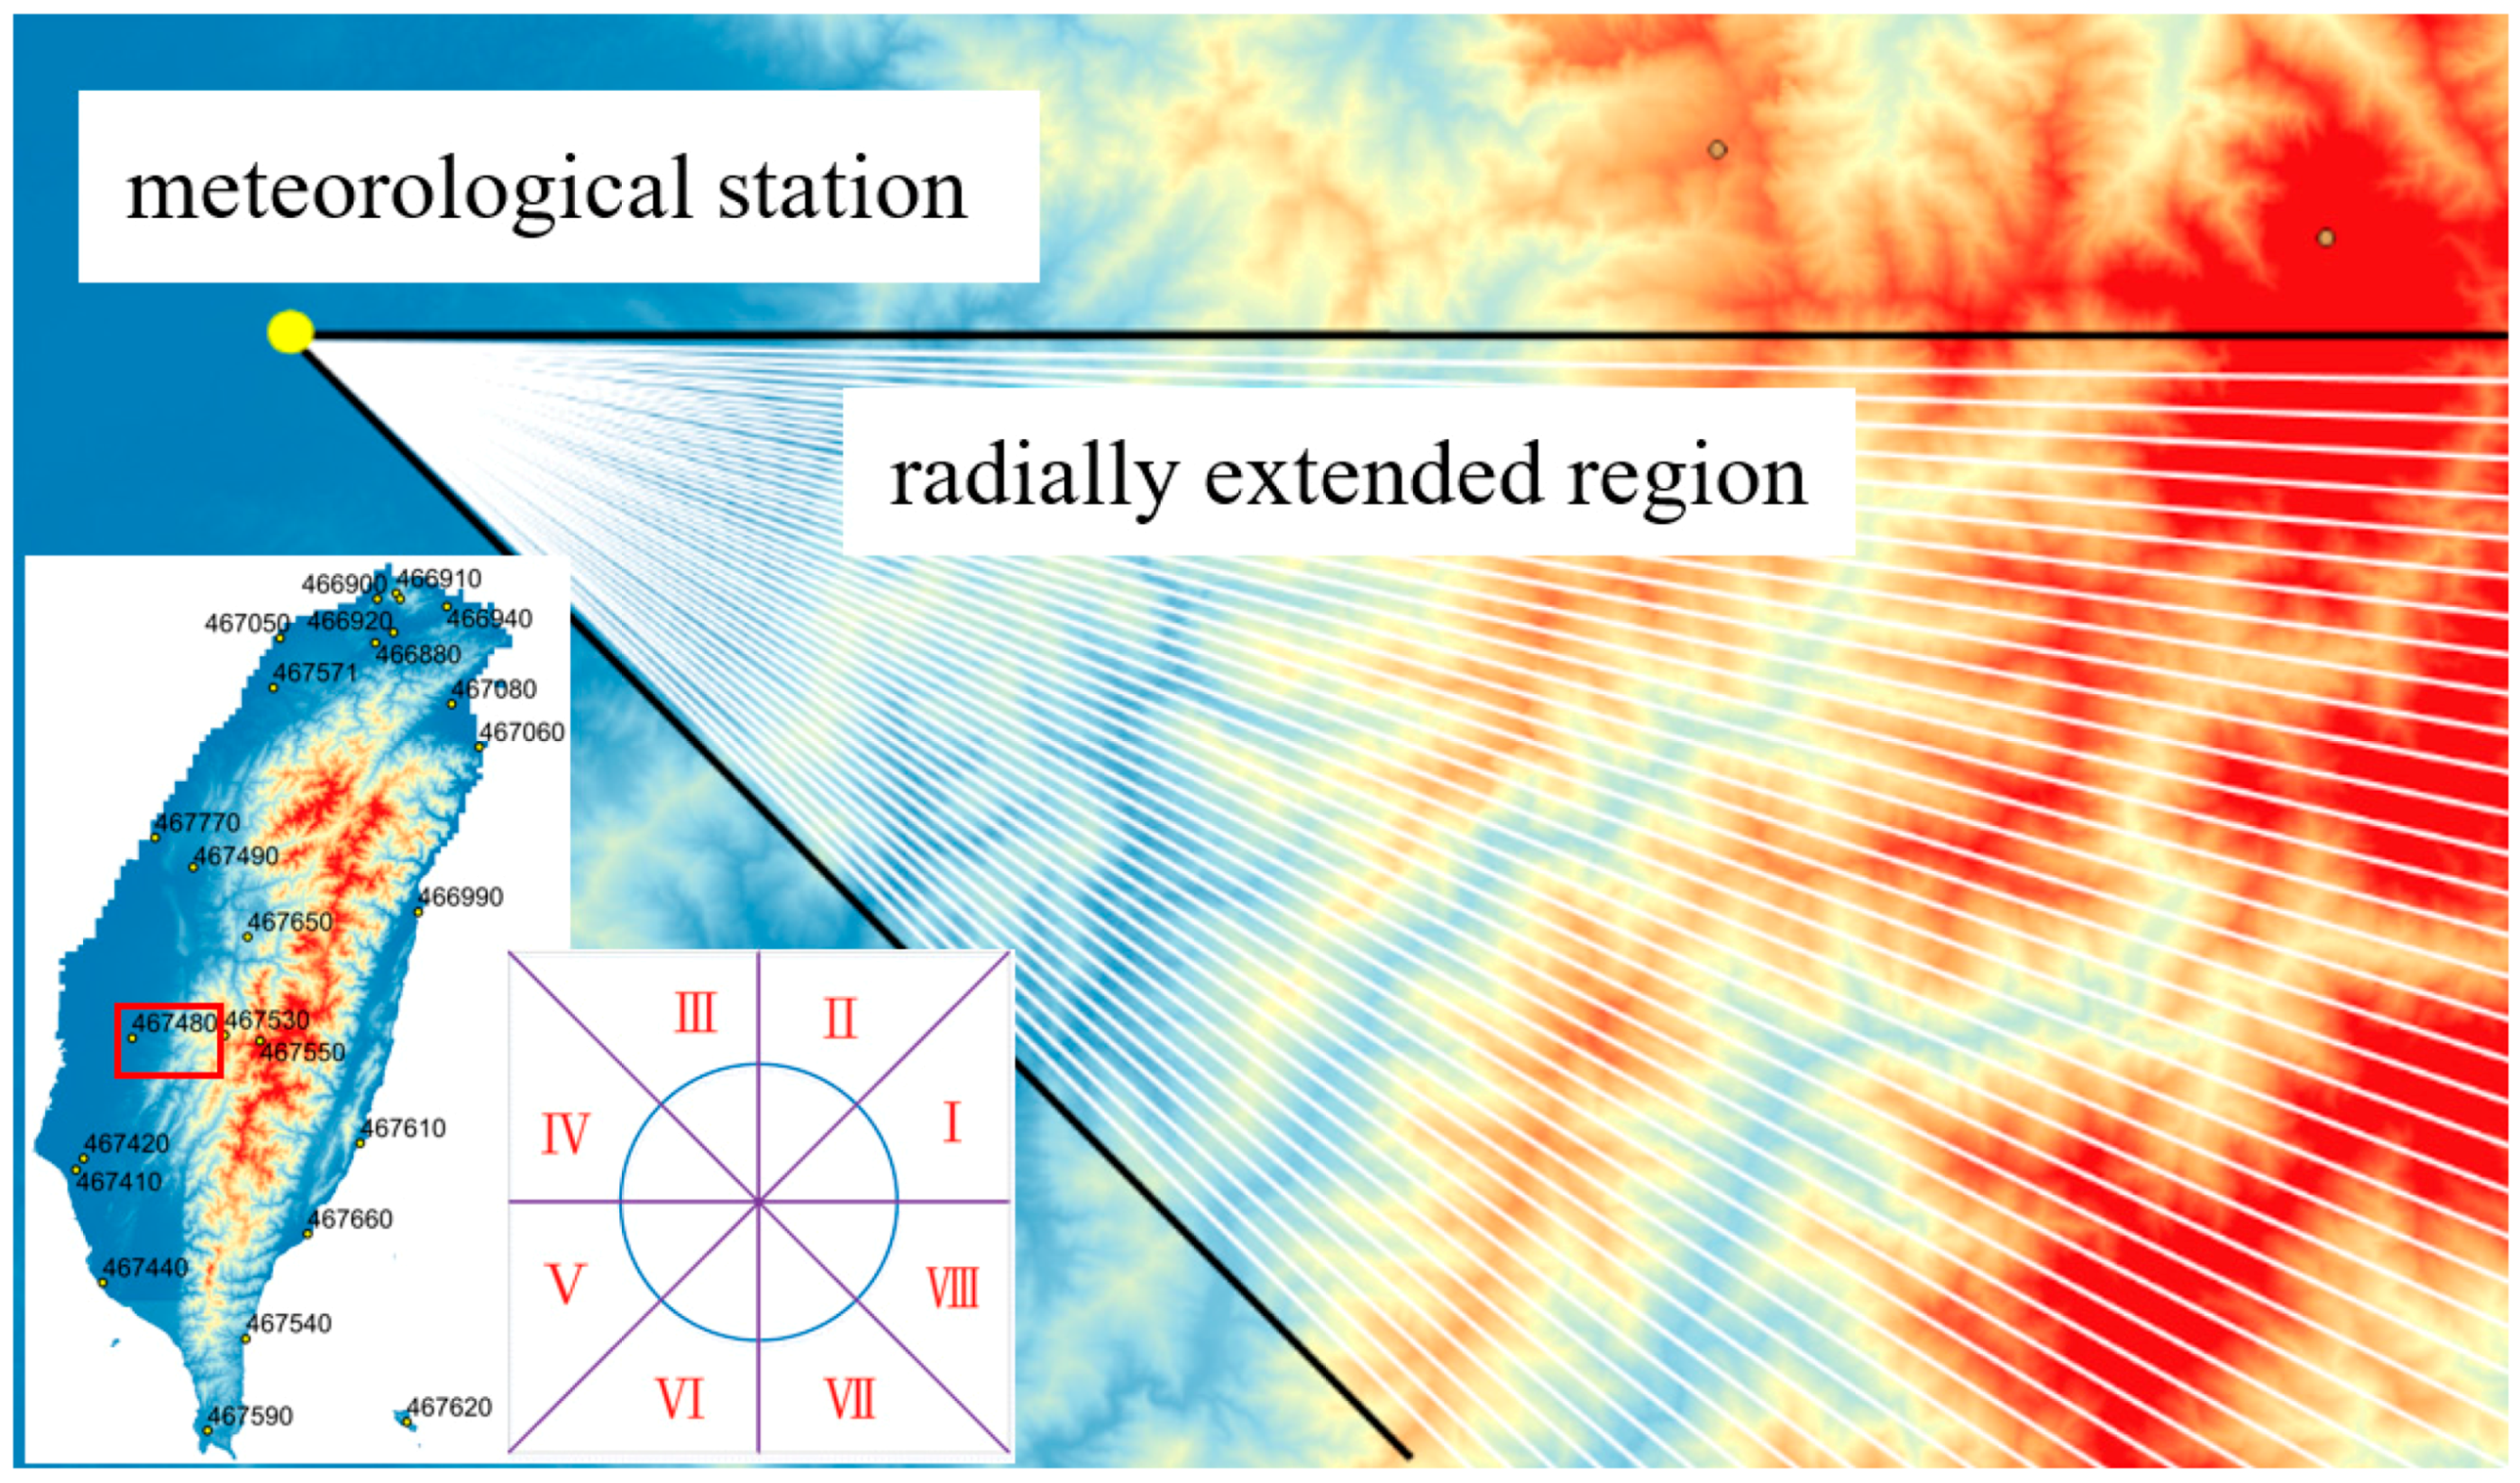
In cases where a mountain barrier lies between the storm area and the moisture source, the mean elevation of the ridge or crest is selected as the base of the atmosphere column, that is, Z1 in Figure 1. Determining the barrier height should consider the moisture inflow direction that is the typhoon track. As shown in Figure 2, the direction of the moisture current moving to the observation site is divided into eight azimuths. For example, azimuth VIII indicates that the observation site would receive typhoon moisture from the southeast-east. In this study, 45 straight lines are radially extended from the location of the observation site in this azimuth. The maximum elevation along a specified radial line for a distance of 50 km is recorded. As shown in this example figure for a typhoon moving from the azimuth VIII to the observation site, the average value of the 45 maximum elevations is recognized as the barrier height. Hence, the historically extreme rainfall transposing from the observation site to the target site can be emulated by multiplying the rainfall depth at the observation site by the moisture adjustment ratio.
Extreme rainstorm events can be sieved from historical records. The areal rainfall records for a specific rainstorm event are used to establish the depth-area-duration (DAD) curve, representing the spatial distribution of rainfall depth for different durations. The rainfall depth corresponding to the size of the target watershed shown in the DAD curve is then used to estimate PMP after maximizing the moisture according to the recorded highest dewpoint temperature and the local topography. In general, typhoon rainstorms in Taiwan usually last more than one day. Hence, the maximum dewpoint temperature is chosen as the highest value persisting for the 24-h duration. For a known elevation (or pressure) and the 24-h highest dewpoint temperature, the dewpoint temperature equivalent to sea level can be obtained from the pseudo-adiabatic chart provided by WMO. In general, for every 1000 ft decrease in elevation, the dewpoint temperature increases by approximately 2.6° F. The amount of precipitable water between the ground surface (1000 mb) and the indicated height is a function of the 1000 mb temperature, which can be found in the report by the World Meteorological Organization [2].
2.2. Procedure for PMP Estimation Using Storm Transposition Method
The analysis procedure for storm maximization, transposition, and enveloping for the PMP estimation can be summarized as follows:
- (1)
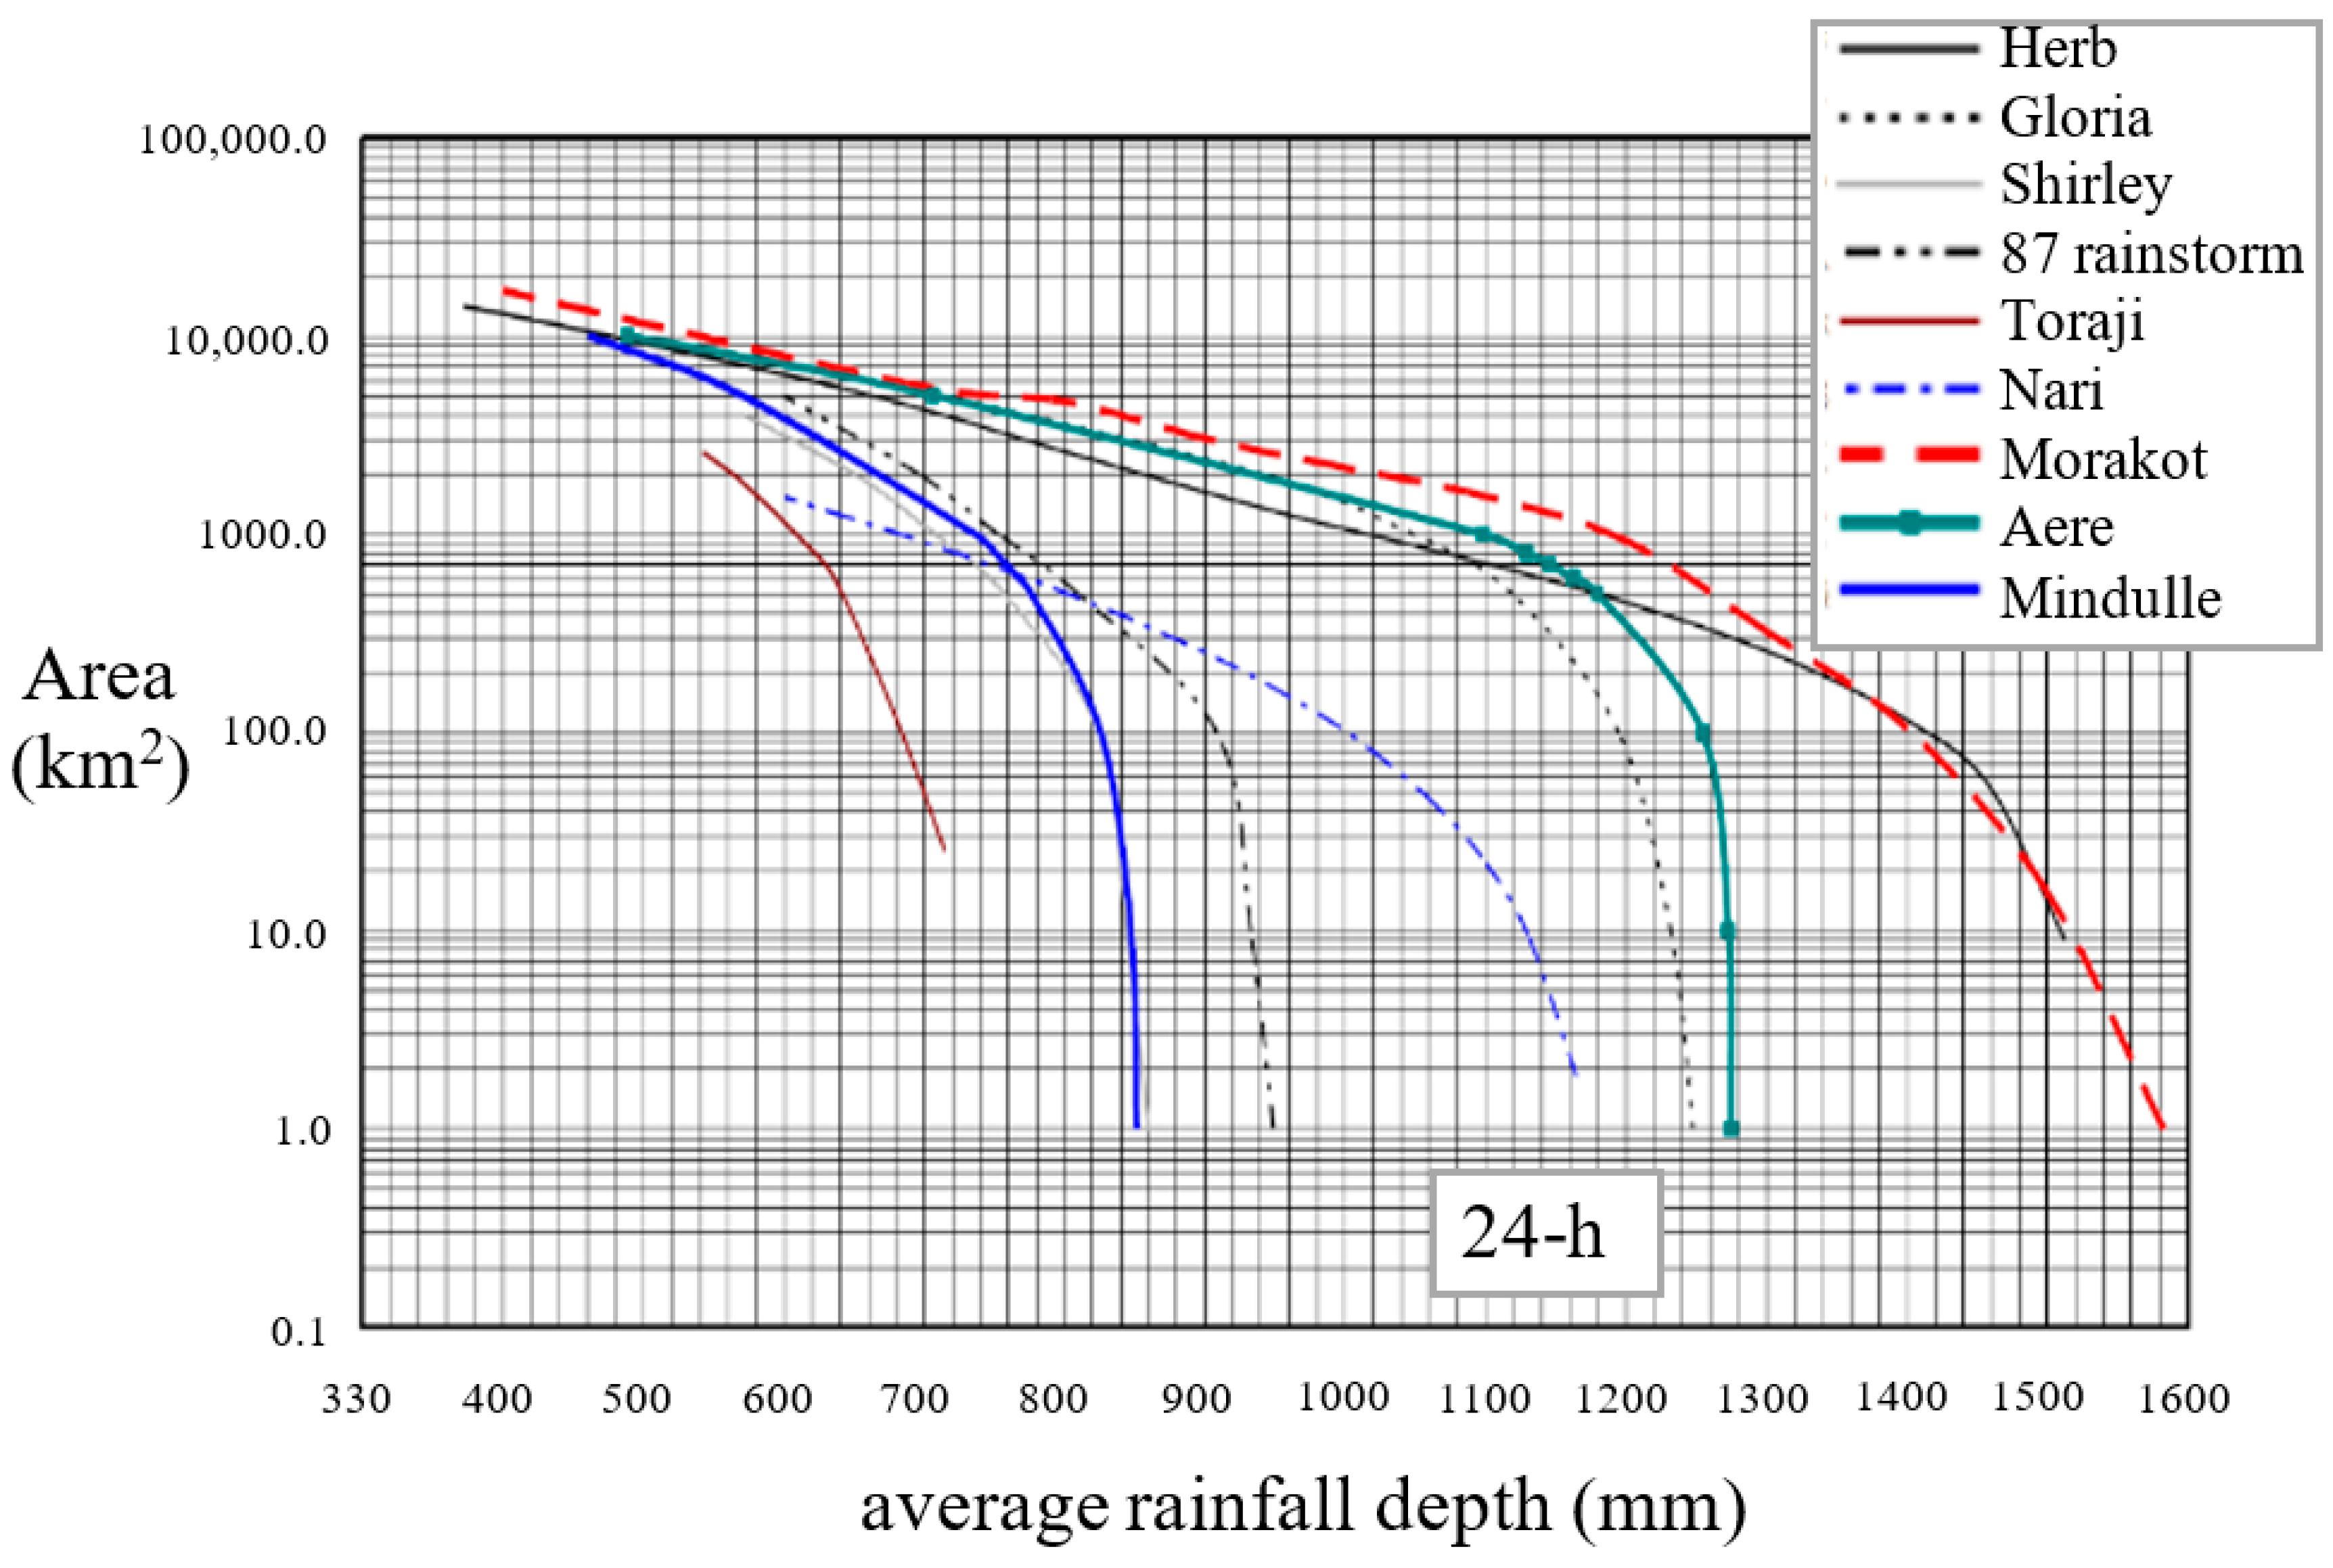
- Collect historical severe typhoon rainstorm records to develop rainfall depth-area-duration (DAD) curves for each typhoon event (as the examples shown in Figure 3);
- (2)
- Determine the inflow barrier height (Z2) according to the topography of the target watershed. The inflow barrier height can be assigned as the elevation of the watershed outlet (as shown in Figure 1).
- (3)
- Choose a meteorological station near the target site and find the 24-h highest dewpoint temperature (TH2) in the historical records. Using TH2 and the elevation of the meteorological station (H2) to determine the sea-level dewpoint temperature (T2).
- (4)
- According to the sea-level dewpoint temperature (T2) to estimate the precipitable water, W2A, in the atmosphere column between 1000 mb and 200 mb, and the precipitable water, W2B, between 1000 mb and the elevation at the watershed outlet (Z2). Then the precipitable water in the target watershed can be estimated by W2 = W2A − W2B;
- (5)
- Select a meteorological station near the ith typhoon rainstorm center. Determine the inflow barrier height (Z1)i of the event according to the typhoon track and the surrounding topography of the meteorological station;
- (6)
- Check the 24-h highest dewpoint temperature (TH1)i in the ith typhoon event. Using (TH1)i and the elevation of the meteorological station (H1) to determine the sea-level dewpoint temperature (T1)i.
- (7)
- According to the sea-level dewpoint temperature (T1)i, calculate the precipitable water (W1A)i in the atmosphere column between 1000 mb and 200 mb and calculate the precipitable water of the atmosphere column from 1000 mb to the barrier height (Z1)i in the ith typhoon event. Then the precipitable water at the meteorological station is ;
- (8)
- The moisture adjustment ratio of the ith typhoon event is ;
- (9)
- Determine the T-hr rainfall depth from the DAD curve in the ith typhoon event corresponding to the area of the target watershed, and then the T-hr precipitable water at the target site can be estimated by ;
- (10)
- Repeat Steps (5) to (9) to calculate the precipitable water of different durations in the ith typhoon event;
- (11)
- Repeat Steps (5) to (10) to calculate the precipitable water for all the typhoon events;
- (12)
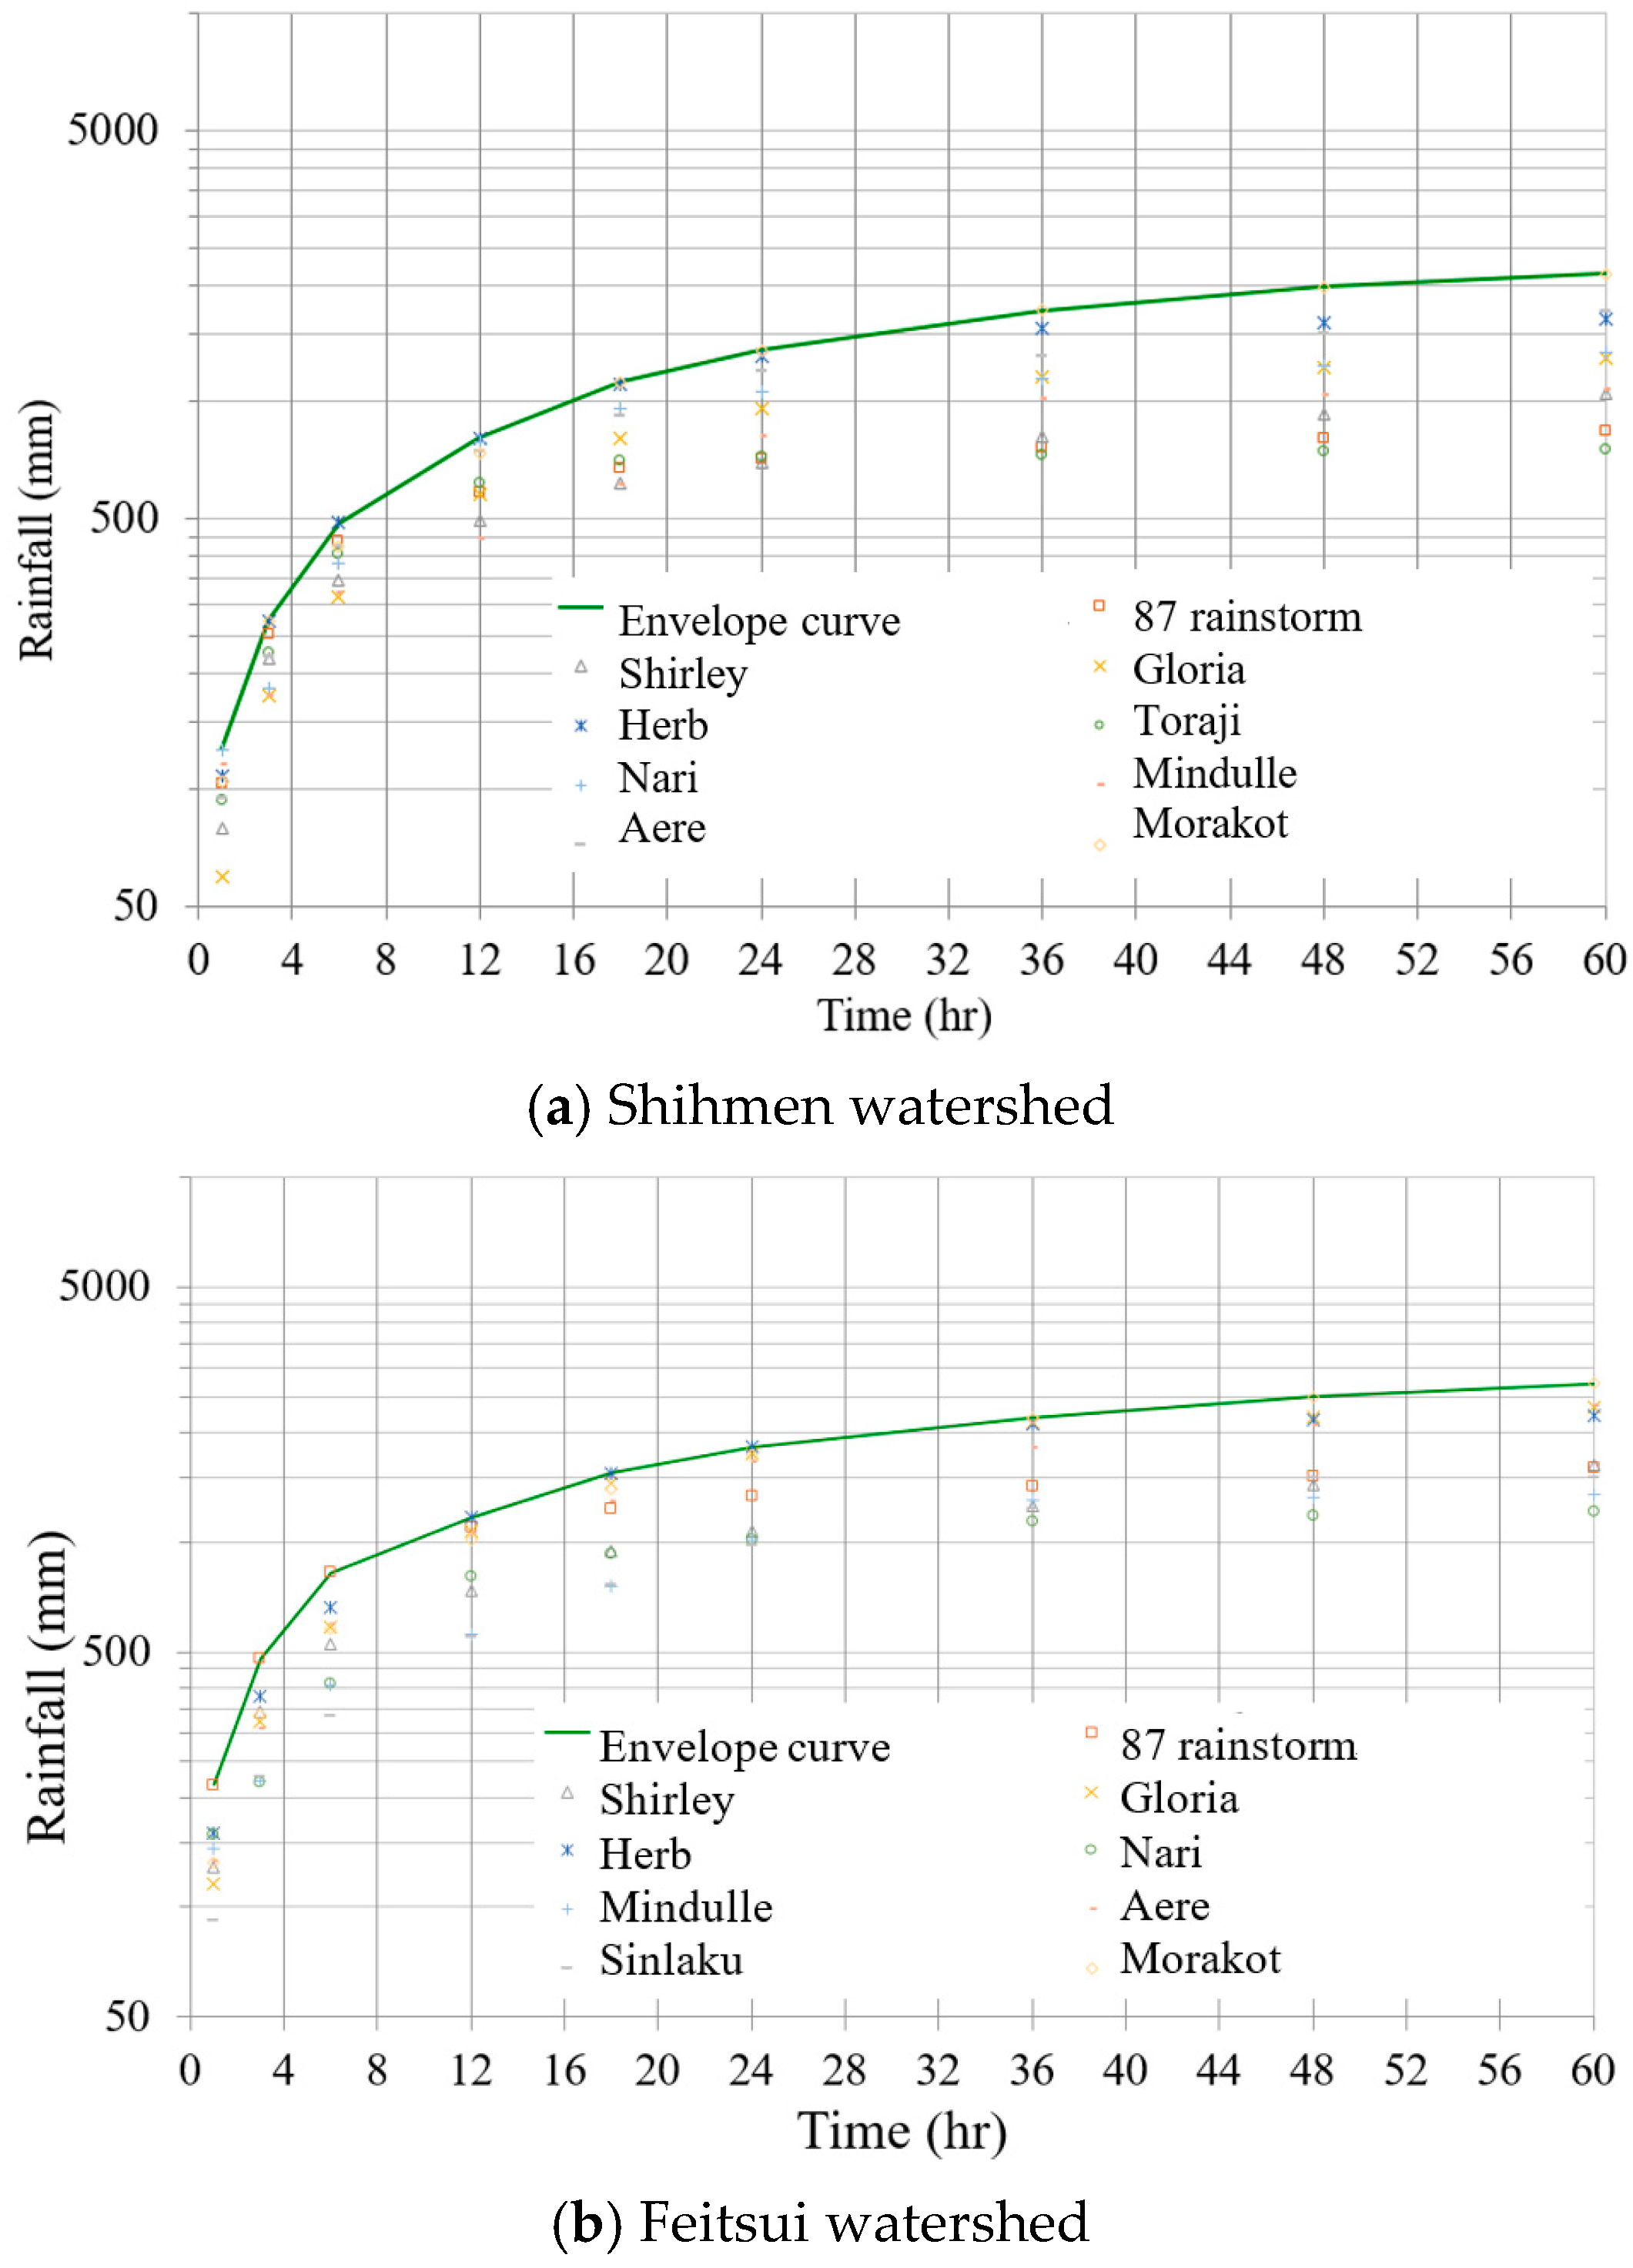
- Plot the precipitable water of different durations for all the selected severe typhoon events and develop an envelope curve at the target site (as the examples shown in Figure 4).
- (13)
- According to the envelope curve, the increment of the cumulated rainfall depth at each hour can be calculated. A design hyetograph can be developed by applying the alternative block method [19] using the calculated increments.
- (14)
- The PMP rainstorm hyetograph can be substituted into a rainfall-runoff model for runoff routing for the PMF estimation at the target watershed.
3. Typhoon Rainstorm Model for PMP Estimation
Taiwan is on the main path of western North Pacific tropical cyclones and is affected by typhoons at least once yearly. Requirements to form a typhoon are sufficiently warm sea surface temperatures, high humidity in the lower to middle levels of the troposphere, enough Coriolis force to develop a low-pressure center, low vertical wind shear, atmospheric instability, and a pre-existing low-level focus or disturbance. Given that most severe floods resulted from typhoon events in Taiwan, Wang et al. [14] developed a typhoon rainstorm model for the PMP estimation to fulfill the spillway design according to the quantity of PMF. In the modeling, the complicated typhoon structure has been simplified for temporal rainfall estimation, and only circulation and orographic rainfalls were considered. The circulation rainfall is caused by the high temperature and high humidity air parcel near the ground, which converges and lifts toward the center of the circulation, causing the vapor to cool and condense into rainfall particles. The circulation rainfall can be derived from the law of conservation of moisture. The typhoon structure is assumed as a symmetrical circulation, and the influence of steering flow is not considered. The orographic rainfall is the typhoon moisture current in progress, blocked by the mountains and forced to lift and condense to rain. The magnitude of the orographic rainfall depends on the mountain barrier slope, elevation, and orientation to form the dynamic lifting of the moisture current. The rainfall estimation in the typhoon rainstorm model is treated as the sum of the two types of rainfall as follows:
where is the total rainfall estimated by the typhoon rainstorm model (mm); is the rainfall caused by the circulation (mm); is the rainfall induced by the orographic effect (mm). The typhoon current is stratified in estimating the rainfall rate. The near-ground moisture is part of the circulation rain, while the rainfall between 850 mb and 550 mb is mainly orographic rainfall. Due to the moisture content being very small for pressure lower than 550 mb, it is ignored in the typhoon rainfall estimation.
3.1. Circulation Rainfall
The circulation rainfall can be derived from the law of conservation of moisture. Hence, the average rainfall per unit area between the two concentric circles with radiuses and can be derived as follows:
where Pc is the circulation rainfall rate per unit area. and are the radial wind speeds towards the typhoon center at and , respectively. Hs is the specific humidity; g is the acceleration of gravity; is the atmospheric pressure at the top of the atmosphere column; is the pressure at the bottom of the atmosphere column. Wang [15] recommended that and can be set as 850 mb and 1000 mb in Taiwan, respectively.
3.2. Orographic Rainfall
Orographic rainfall results from the dynamic lifting of moist currents over mountain barriers. The magnitude of the orographic rainfall depends on barrier slope, elevation, and orientation. The atmospheric troposphere is divided into several layers. The total amount of the orographic rainfall can be obtained by accumulating the rainfall depth in each layer as:
where Po is the total amount of orographic rainfall for all the layers; Vz is the vertical upward speed of the moisture current in the windward direction; is the thickness of the atmospheric layer; Rd is the dry gas constant; T is the temperature; is the variation rate of the vapor pressure due to elevation change; is the saturated vapor pressure. Wang et al. [14] suggested that the troposphere can be separated into two layers. The first layer is from 850 mb to 700 mb, and the second layer is from 700 mb to 550 mb. According to Equation (4), the upward speed in the windward direction is one of the main factors affecting the orographic rainfall, which is controlled by the wind speed and the terrain slope lifting along the windward path. The relationship between the effective terrain slope and the windward direction can be developed based on the DEM analysis to facilitate the orographic rainfall calculation.
3.3. Design Typhoon Rainstorm
The terrain slope lifting of the typhoon circulation played a significant role in determining the rainfall amount besides the rainfall variations with radius [20]. Hence, an appropriate design typhoon for PMP estimation should consider historical typhoon tracks and surrounding topographic conditions to strengthen the terrain effect in rainfall generation. This study analyzed the consecutive 24-h maximum rainfall depth using historical records. The first 10 largest consecutive 24-h rainfalls were selected. Then, the typhoon tracks corresponding to the periods occurring in the 24-h maximum rainfall were delineated and used to generate the design typhoon path by applying the least-square method. Figure 5a shows the design typhoon path for the Shihmen watershed. The bold red line is the analysis result using the least-square method based on the typhoon tracks of the three historically severe events. Figure 5b is the design typhoon path derived from three severe typhoons in the Feitsui watershed.
Besides the typhoon path to be determined in developing a design typhoon, the typhoon radius, speed, and water vapor content are essential factors to create an extreme rainstorm circumstance for PMP estimation. According to the historical typhoons that invaded Taiwan, the average speed of the typhoon center is about 12 knots per hour. For a slow-moving typhoon, the prolonged rainstorm will result in a large amount of rainwater in the watershed. Hence, a lower speed of 10 knots per hour (about 18.52 km/h) is adopted in the simulation of the design typhoon. Moreover, the following design typhoon calculations adopted the historical maximum water vapor content of 2.5 g/cm2 measured in Typhoon Galley in 1952 and the historical maximum typhoon radius of 777 km in Typhoon Ida in 1954. An empirical equation derived by [21] is adopted to estimate the wind speed of the design typhoon, which can be expressed as:
where Vdesign is the wind speed of the design typhoon; V7 and R7 are the maximum force 7 wind speed and radius, respectively; d is the distance from the basin’s center to the typhoon center.
3.4. Procedure for PMP Estimation Using Typhoon Rainstorm Method
The analysis procedure for PMP estimation using the typhoon rainstorm model can be described as follows:
- (1)
- Select historical typhoon events which had significant rainfall and caused large inflow in the target reservoir watershed;
- (2)
- Collect typhoon records from the nearby meteorological station, including typhoon track, wind direction, maximum force seven wind direction and speed, atmospheric pressure, temperature, rainfall depth, and radius of the typhoon circulation;
- (3)
- Analyze the effective slope for the target site according to the approach angle of the ith typhoon;
- (4)
- Estimate the total rainfall depth of the ith typhoon event by summing the circulation rainfall depth (Equation (3)) and the orographic rainfall depth (Equation (4));
- (5)
- Define a ratio to describe the deviation between the observed rainfall (Pobs) and the estimated rainfall in the ith typhoon event as ;
- (6)
- Repeat steps (3) to (5) to obtain the ratio for each typhoon event and to obtain an average adjustment ratio as ;
- (7)
- Determine the design typhoon path based on the selected historical severe typhoon tracks (the bold red line, as shown in Figure 5);
- (8)
- Determine the parameters of the design typhoon and then calculate the circulation rainfall depth (Pc) and orographic rainfall depth (Po) along the design typhoon path at each time step;
- (9)
- When the design typhoon circle covers the target watershed, use the average adjustment ratio () to adjust the estimated rainfall depth at each time step;
- (10)
- The adjusted-rainfall depth in the progress of the design typhoon is regarded as the PMP of the target watershed.
4. Probable Maximum Flood Analysis
PMF is the theoretically largest flood resulting from the most severe meteorological and hydrological conditions that would happen in a given area, which can be recognized as integrating the spatial and temporal distribution of PMP and the topographic characteristics of the watershed. Hence, a PMP analysis should be conducted first and then cooperate with rainfall-runoff models to transfer the PMP into PMF. Flow records are usually available for runoff model parameters calibration for existing dam sites. Nevertheless, flow records may be unavailable at a potential dam site for runoff analysis in the new water resources project. Hydrologists can then adopt synthetic unit hydrographs or geomorphology-based runoff models for flow analysis. Two runoff models, the dimensionless unit hydrograph (DUH) and the kinematic-wave-based geomorphologic IUH (KW-GIUH) [22], were used in this study to assess whether the capacity of the spillway can successfully drain the PMF downstream.
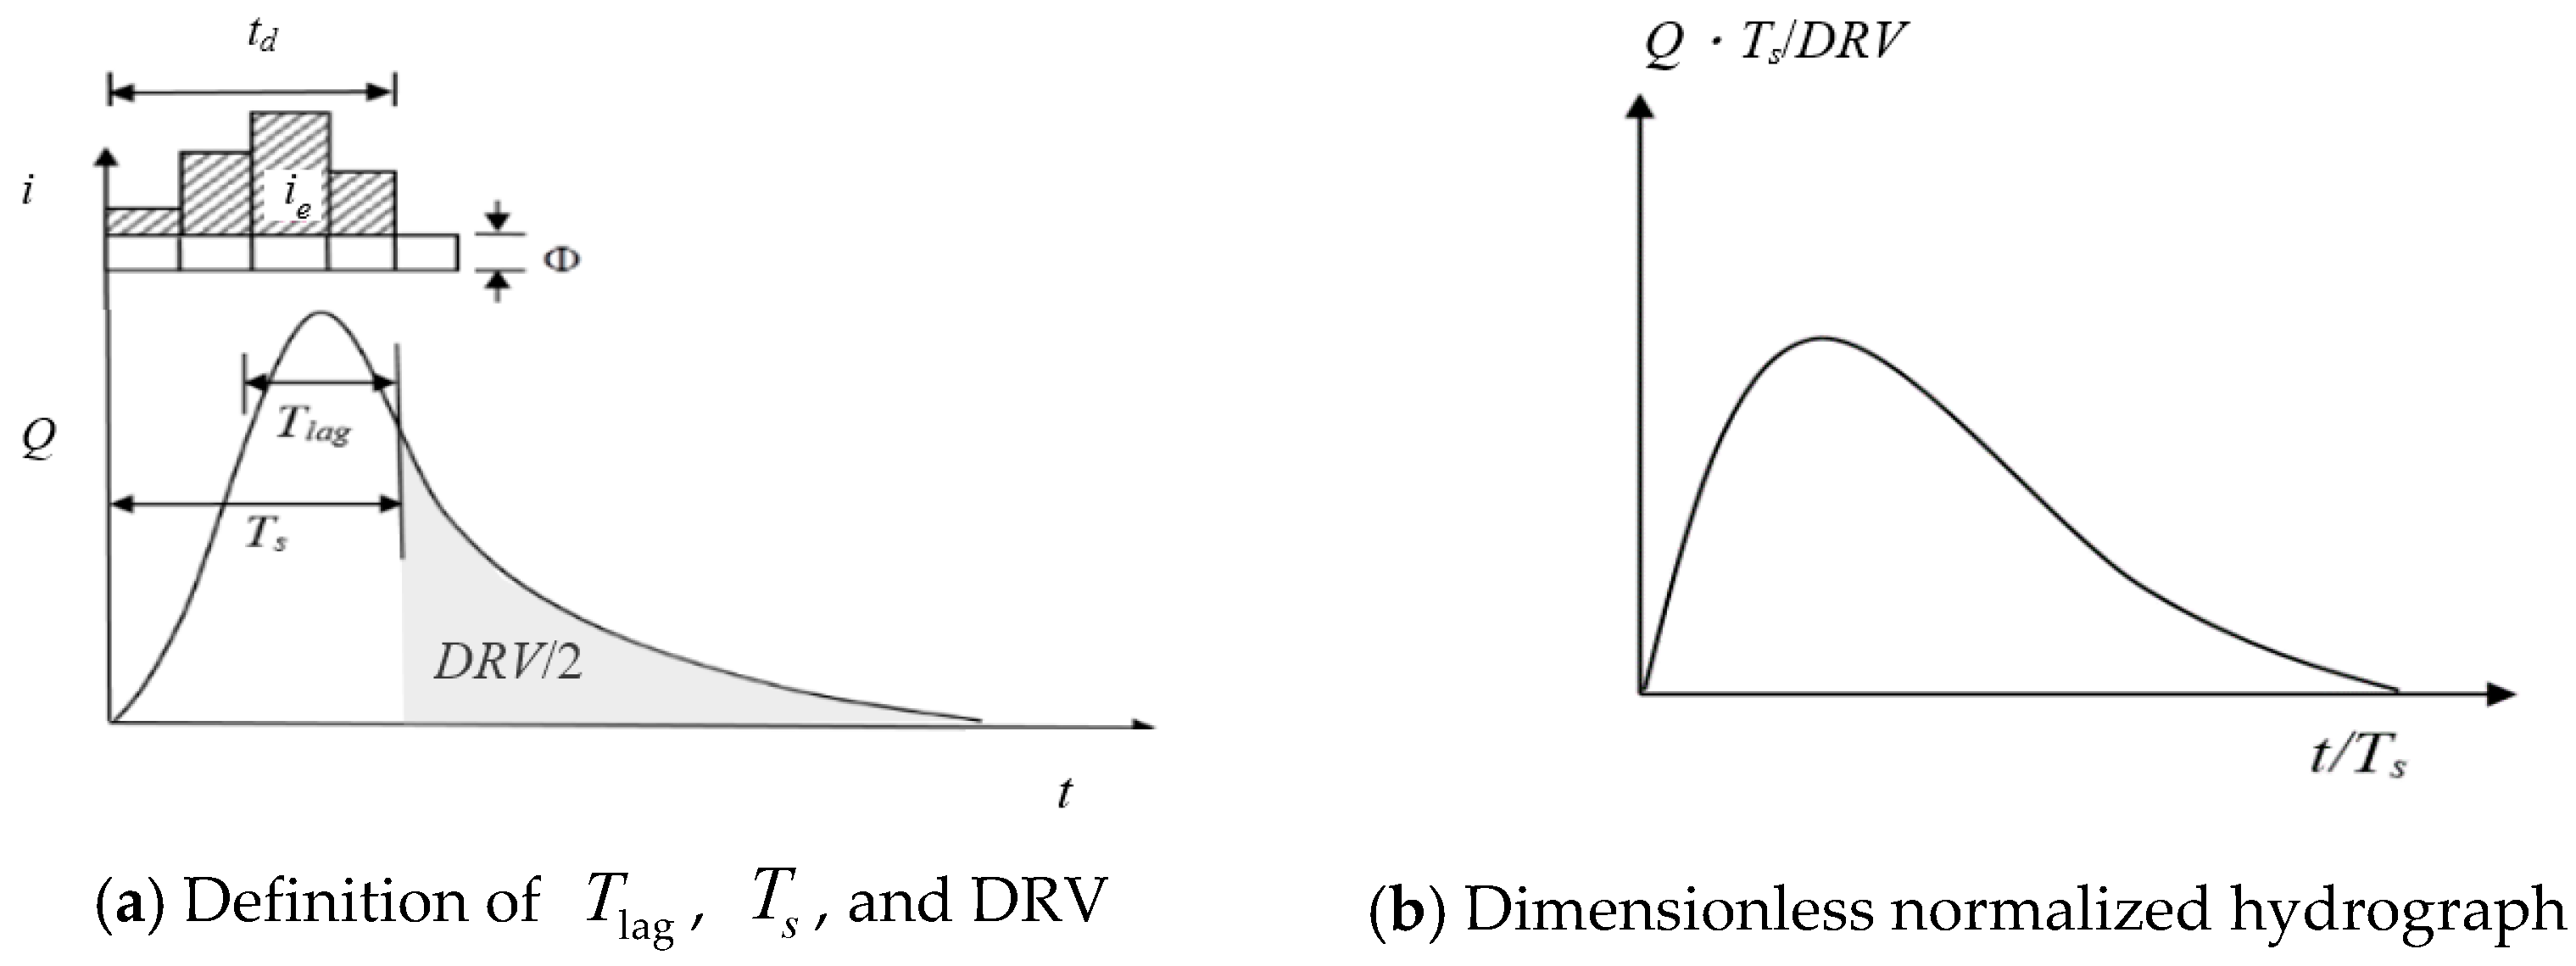
4.1. Dimensionless Unit Hydrograph Model
Based on available geomorphologic and hydrological data, the Water Resources Planning Institute of Taiwan developed a DUH model for runoff analysis in gauged and ungauged watersheds [23]. Two factors are used to describe the shape of the DUH in calculating the dimensionless quantities. The first factor is DRV which is the direct-runoff volume; another factor is the lag time which represents the time from the center of the effective rainfall to the time it reaches half of the direct-runoff volume (i.e., ). Hence, a characteristic time index of the watershed is defined as:
where is the characteristic time index, is the duration of the effective rainfall, and is the lag time.
Figure 6a shows the definition of the two factors in developing the DUH, and Figure 6b is a schematic diagram of the DUH, in which the x-axis is , and the y-axis is . Empirical formulas are usually developed to bridge the connection between the hydrologic response and geomorphologic factors to facilitate the application of DUH. The empirical lag time formula can be expressed as:
where Tlag is the lag time; L is the maximum travel distance along the mainstream; Lca is the distance of the centroid of the watershed to the gauging site along the mainstream; Sc is the average slope of the mainstream, and a and b are coefficients. The regression coefficients of a and b have been analyzed by the Taiwan Provincial Water Conservancy Bureau [23] for 23 major basins in Taiwan. Hence, the DUH can be applied to most watersheds in Taiwan for rainfall-runoff simulation.
4.2. Kinematic-Wave-Based Geomorphologic IUH Model
To preserve the accuracy of runoff simulation in watersheds, we further applied the kinematic-wave-based geomorphologic instantaneous unit hydrograph model (KW-GIUH) [22,24] to simulate the rainfall-runoff processes for hydrograph generating at the dam site. One advantage of the KW-GIUH model is the potential to derive the IUH using only the geomorphologic information obtainable from the study watershed instead of the information from neighboring watersheds. The KW-GIUH approach divides a watershed into different orders of overland areas and channels based on the Strahler ordering scheme. The IUH can be expressed as [25]:
where is the instantaneous unit hydrograph; is the travel time probability density function in state xj with a mean value of ; is the probability of a specified runoff path w; W is the runoff travel path space; and * denotes a convolution integral. Lee and Yen [22] suggested applying the kinematic-wave theory for runoff travel time estimations to alleviate the restriction of using empirical equations for runoff travel time estimation. The mean runoff travel time in the ith-order overland plane is [26]:
where No is the effective roughness coefficient for the overland planes; is the mean overland-flow length of the ith-order subwatershed; is the mean ith-order overland slope; ie is the rainfall excess intensity; and m is an exponent. The runoff travel time in the ith-order channel can be estimated by [22]:
in which Bi is the width of the ith-order channel; is the mean channel length of the ith-order subwatershed; nc is the roughness coefficient for channels; is the mean ith-order channel slope; and is the inflow depth of the ith-order channel due to water transported from upstream reaches, which can be determined from the watershed channel network structure. The merit of applying Equations (9) and (10) is that the hydrodynamic effect resulting from different rainfall intensities can be considered. Thus, the IUH can vary with different rainfall intensities and well reflect the overland and channel roughness conditions.
5. Case Studies of Shihmen and Feitsui Reservoir Watersheds
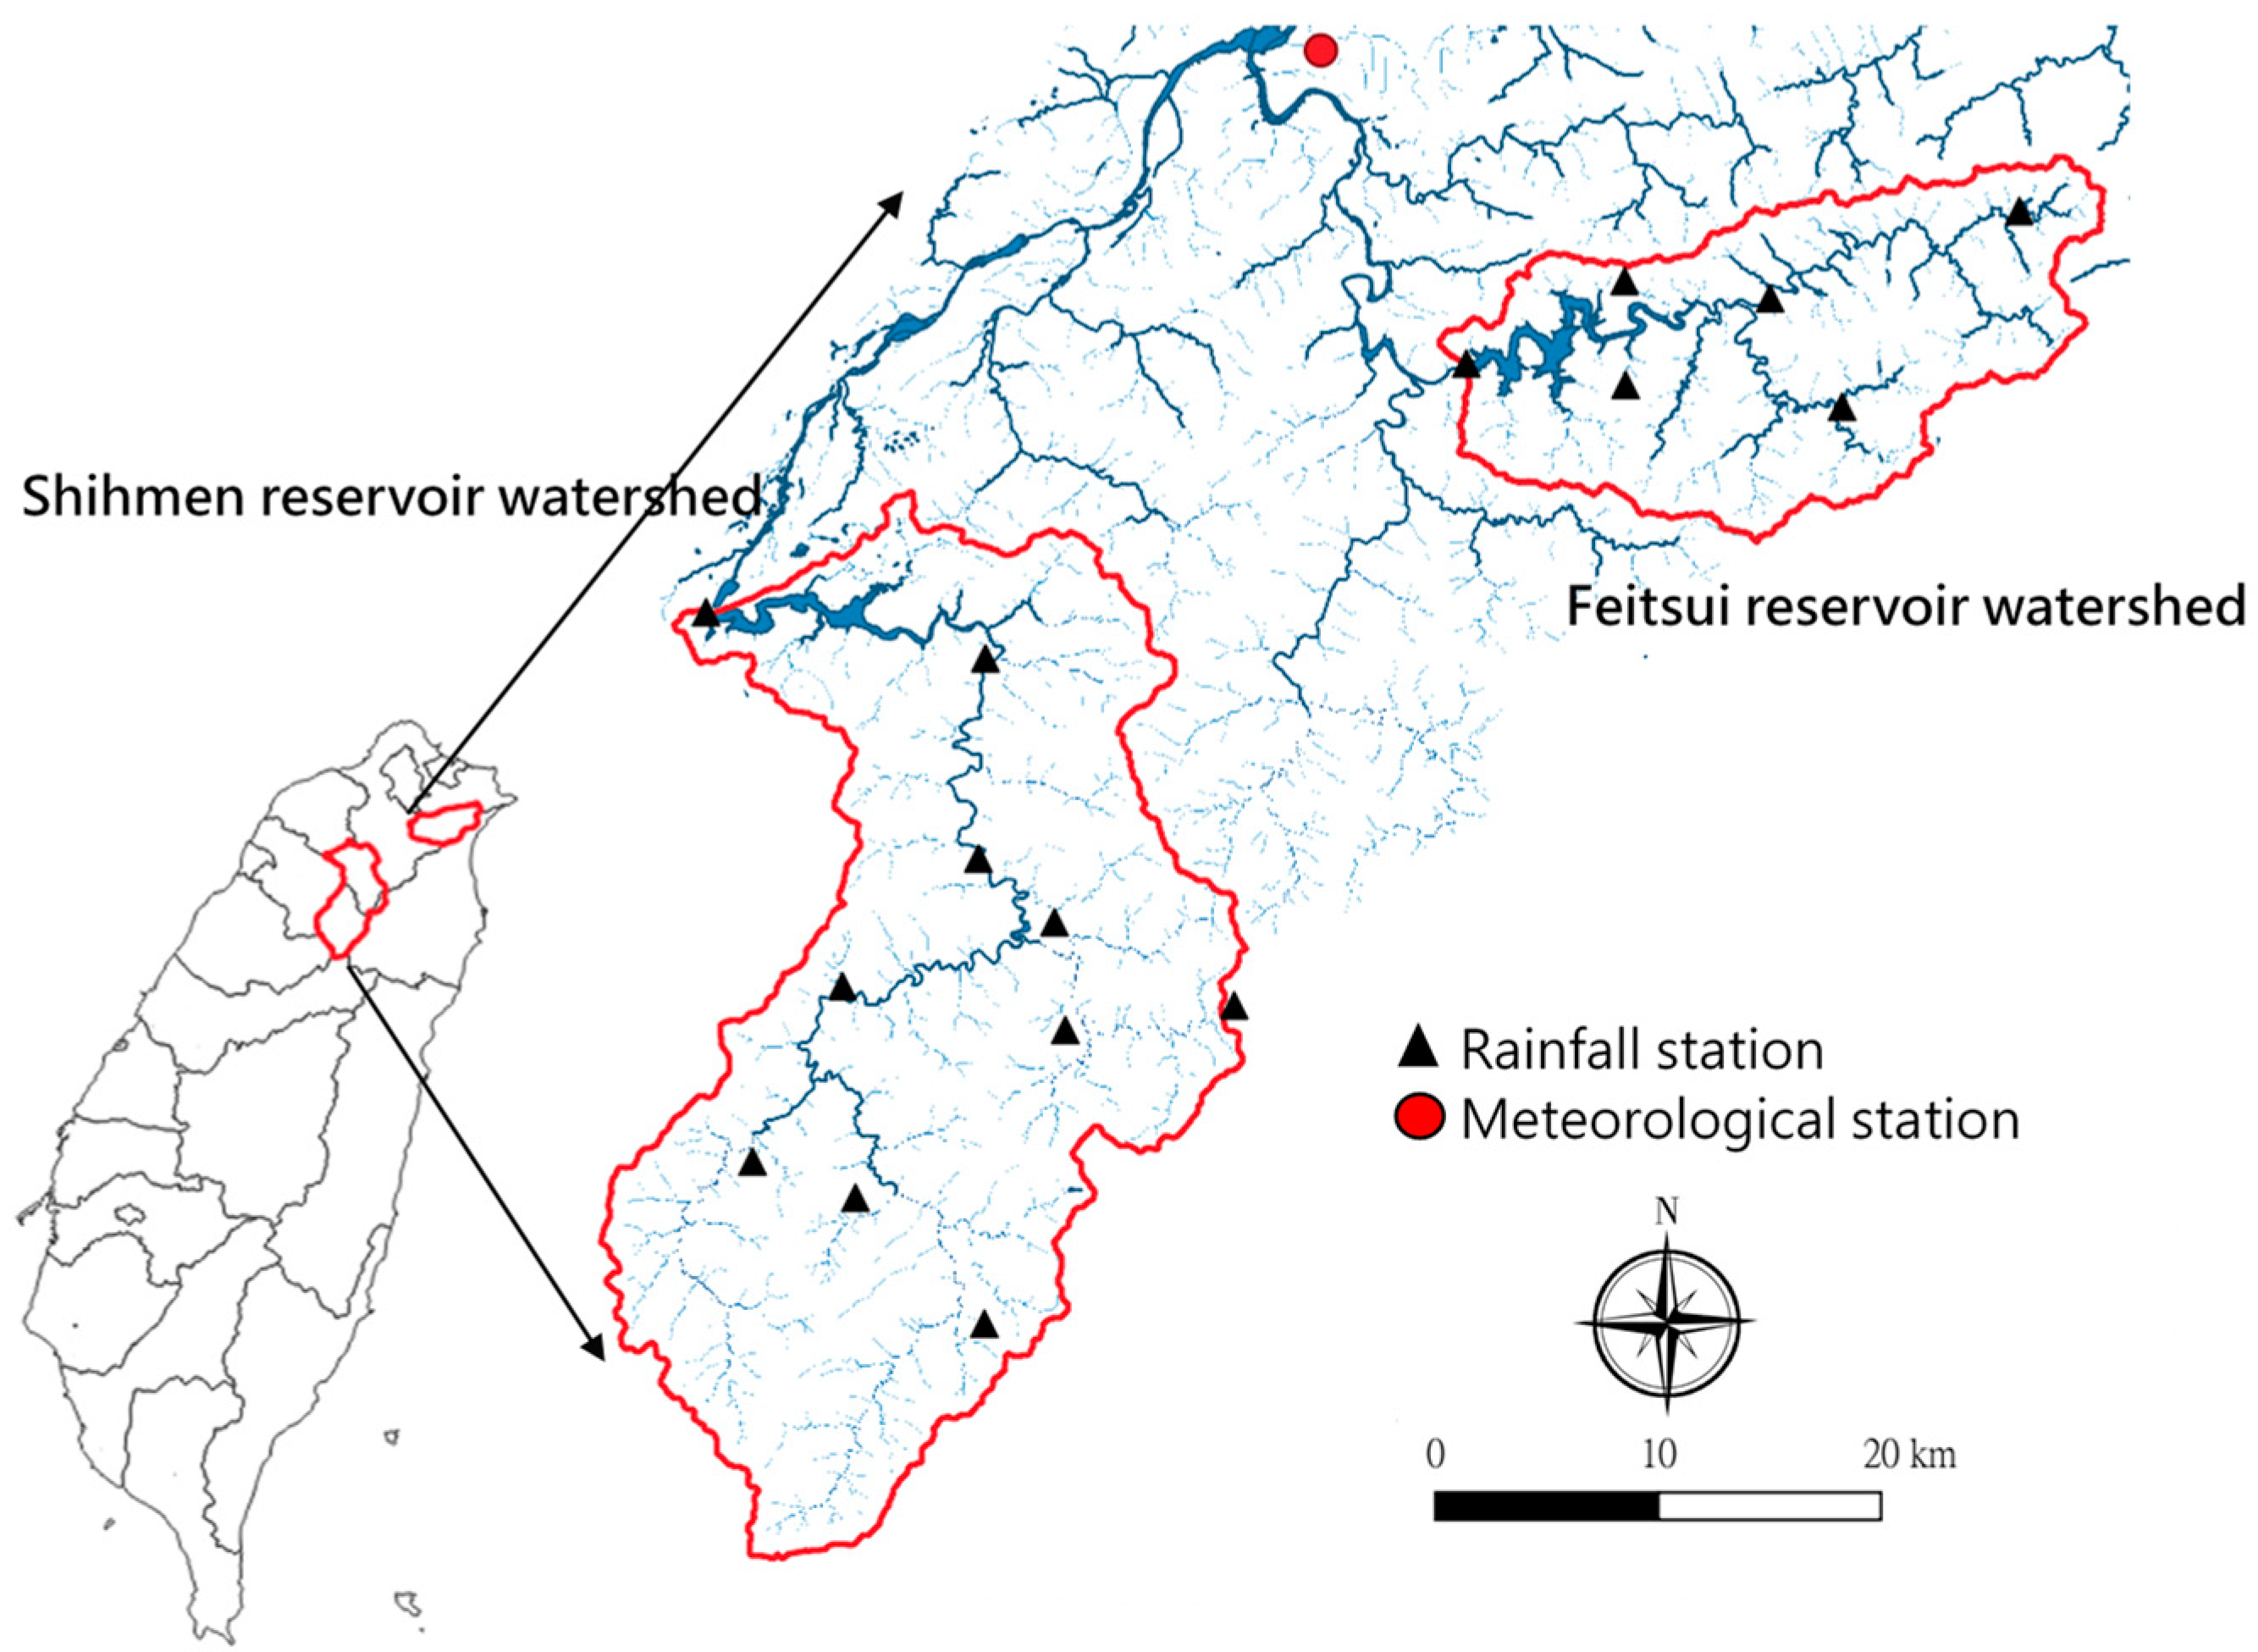
Digital elevation datasets and hydrological records from Shihmen and Feitsui reservoir watersheds were collected for analysis in this study. As shown in Figure 7, there are ten rain gauging stations in the Shihmen Reservoir watershed, six stations in the Feitsui Reservoir watershed, and a meteorological station located in the north of the watershed. Shihmen Reservoir is located in the upper reaches of the Dahan River, a tributary of the Danshui River, about 50 km from downtown Taipei. The dam height is 133.1 m, and the crest length is 360 m. The area of the reservoir watershed is 758.9 km2; the full water level area is about 8 km2, and the existing effective water storage capacity is m3. There are six spillways on the dam crest controlled by radial gates; the total design discharge of the spillway and sluiceway is 13,800 m3/s. The Shihmen Reservoir was initially built mainly for irrigation and flood control, and now it also supplies public water in New Taipei City, Taoyuan City, and Hsinchu County.
The Feitsui Reservoir is located on the Beishi River, a tributary of the Xindian River, about 30 km from downtown Taipei. The main dam is a concrete arch with a dam height of 122.5 m and a crest length of 510 m. The watershed area of Feitsui Reservoir is 302.38 km2; the full-water-level area is 1024 hectares, and the current water storage capacity is m3. Radial gates control eight spillways on the dam crest; the total design discharge of the spillway and sluiceway is 9870 m3/s. It mainly provides domestic water in the Taipei area. Detailed geomorphologic factors of the Shihmen and Feitsui reservoir watersheds are shown in Table 1.
5.1. Probable Maximum Precipitation Analysis
In estimating the PMP, meteorological data from nine severe typhoon events were collected from the Shihmen Reservoir and Feitsui Reservoir for analysis (as shown in Table 2). The 24-h rainfall depth-area-duration (DAD) curves of nine typhoons are demonstrated in Figure 3. Results of the 24-h PMP analysis using the storm transposition method and the typhoon rainstorm method are shown in Table 3. These results were also compared with the Hershfield [4,5] statistical approach to confirm the results’ reliability by using the above two methods. Hershfield’s approach can be expressed as:
where is the PMP estimation, and are the mean and standard deviation of a series of n annual maxima, and is a statistical variable fitting for the extreme hydrological data. The original analysis was based on the records of 24-h rainfall for 2700 stations in the United States [3]. Details of the adjustments for and considering the outliers, sample size, and duration can be found in the World Meteorological Organization [2].
As shown in Table 3, the maximum deviation of the 24-h PMP values estimated by the three methods is within 30% in the Shihmen watershed and 16% in the Feitsui Reservoir watershed, in which Km was set as 10.01 in Shihmen and 10.23 in Feitsui in performing Hershfiled’s method. The PMPs generated by the storm transposition method and typhoon rainstorm model for the Shihmen watershed are pretty close, and the Hershfield method provides the largest estimation. In the Feitsui watershed, the typhoon rainstorm model and the Hershfield method provide very close estimations; the PMP estimated by the storm transposition method gives the largest one. The large value of PMP by the storm transposition method may result from a low elevation at the outlet of the Feitsui watershed, which causes a high precipitable water in the atmosphere column. Previous studies showed that the ranges of PMP were 1375~2922 mm for Shihmen and 1476~1794 mm for Feitsui [27,28,29]. The difference in the PMP values between the previous studies and this research may be due to the selection of historical typhoon events and the meteorological stations. Moreover, the ways to determine the barrier height in the storm transposition method and to calculate the effective terrain slope in the typhoon rainstorm model have also affected the results.
Since the PMP value is a theoretical assumption, the actual upper limit of the rainfall is unknown. Hence, the PMP estimations are further compared with frequency analysis results based on available recorded data. According to worldwide records, the PMP can have a return period of 500,000,000 years, corresponding approximately to a frequency factor of 15 [30]. Since local geographic conditions would affect the PMP value, some suggested a 10,000 years return period for the PMP and PMF estimations [19]. There are ten rain gauging stations in the Shihmen Reservoir watershed. The records show that the largest observed rainfall was always found at the Baishi rain-gauging station. Hence, only the records (from 1987 to 2019) at Baishi were used for frequency analysis. Five probability distributions, including the normal, log-normal, Pearson type-III, log Pearson type-III, and extreme value type-I, were applied to fit the recorded data. The L-moments method was used to determine the distribution parameters. The Chi-square and Kolmogorov-Smirnov tests were adopted to identify the best fit of the proposed distribution assumptions. Since only 32 years of rainfall records are available, it limits the largest return period to be given with confidence. Based on the extreme value type-I distribution, the estimated 24-h rainfall depths are 1140 mm and 1592 mm for 100-yr and 1000-yr return periods, respectively. As shown in Table 3, the Hershfield method provides a PMP higher than the 1000-year return period rainfall depth in the Shihmen watershed. However, the PMP values generated by the storm transposition method and the typhoon rainstorm model are significantly lower than the 1000-year return period rainfall depth, so these values may be doubtful in practical applications.
There are six rain-gauging stations in the Feitsui watershed. Following the same analysis procedure, only the areal largest rainfall observed at the Pinglin rain-gauging station was used for frequency analysis, in which the records were from 1988 to 2019. The results show that the 24-h rainfall depths are 772 mm and 1036 mm for 100-yr and 1000-yr return periods, respectively, based on the extreme value type-I distribution. The PMP values estimated by the three methods are all higher than the 1000-year return period rainfall depth. The typhoon rainstorm model and Hershfield’s method provide very close estimations. The PMP assessed by the storm transposition method is the largest one in the Feitsui watershed.
5.2. Spillway Safety Assessment Based on Probable Maximum Flood Analysis
PMP can be used as inputs of rainfall-runoff models to produce PMF, which can be recognized as the basis for assessing the reliability of a spillway to drain the floodwater downstream. This study used DUH and KW-GIUH to generate the outflow hydrographs at the dam site. The peak discharge of the hydrograph is then used to evaluate the reliability of the existing structures. Through rainfall-runoff routing, the hydrograph peak would depend on the temporal distribution of the input hyetograph, the IUH shape, and the watershed size.
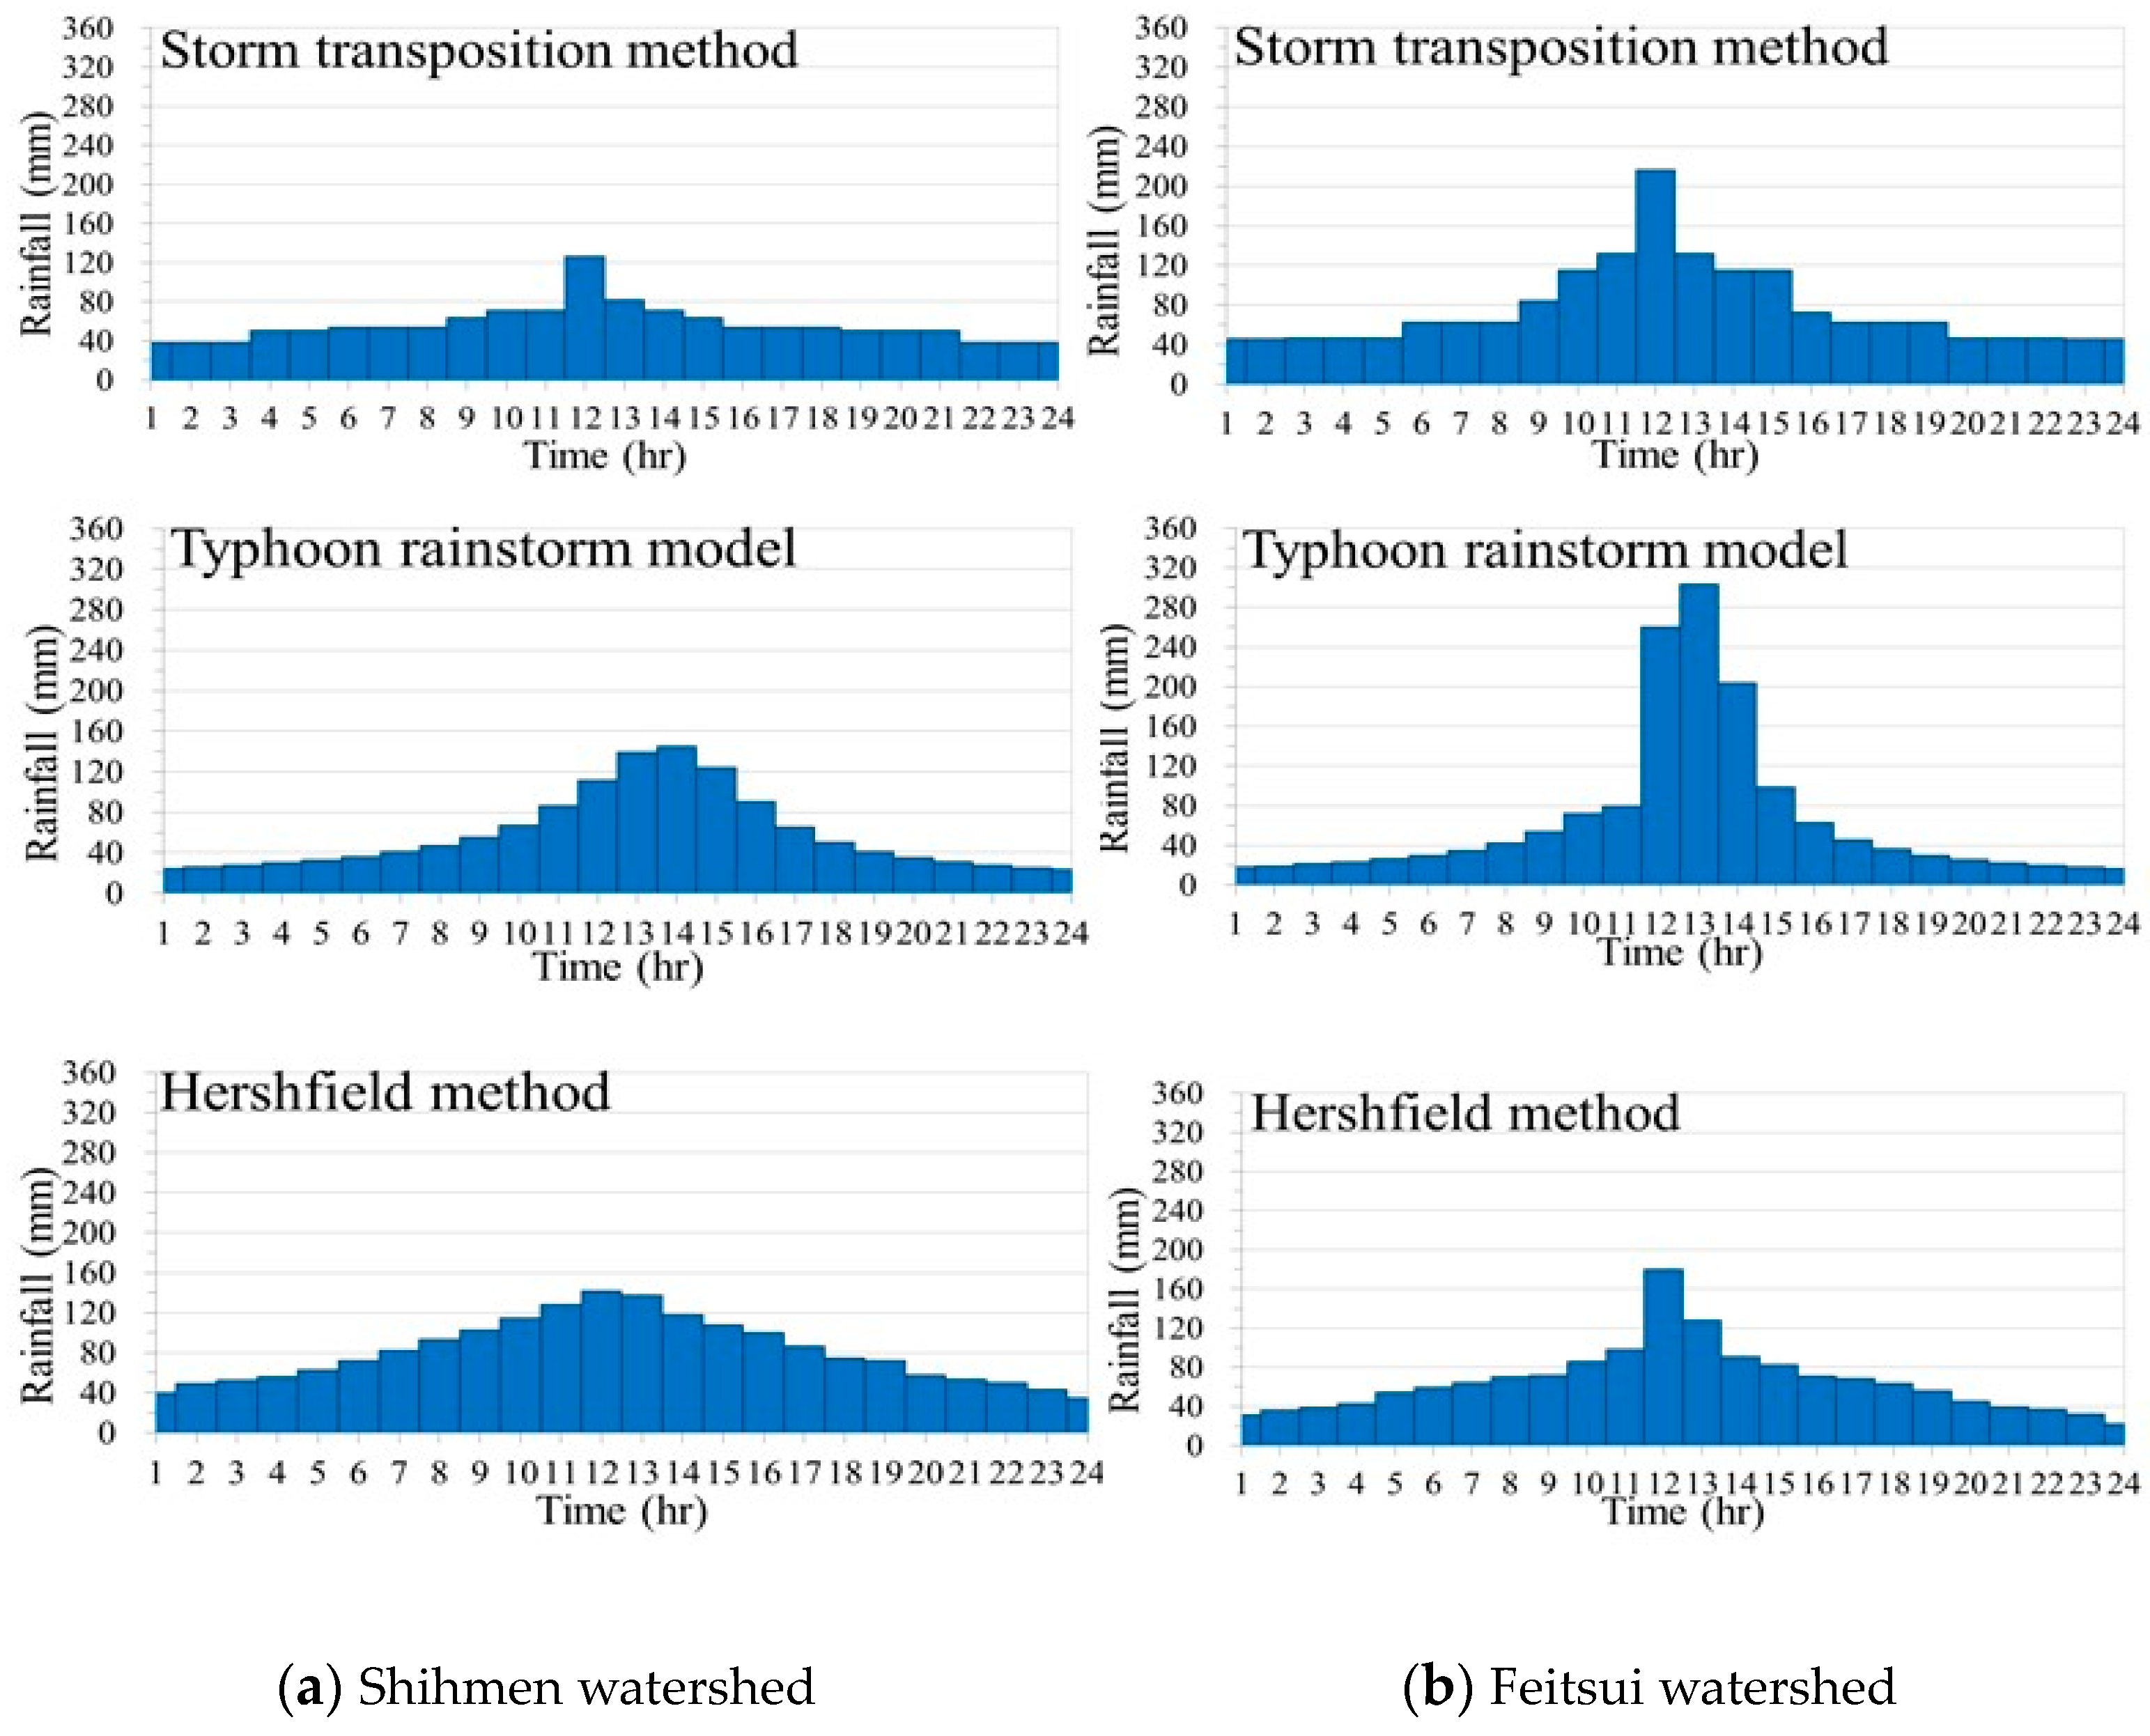
As shown in Figure 4, the envelope curve developed in the storm transposition method has afforded the cumulative PMP for different durations. Hence, the increment of the envelope curve at each hour can be used to derive the design hyetograph by applying the alternative-block method [19]. For the typhoon rainstorm model, the hourly hyetograph can be obtained while calculating the circulation and orographic rainfall at each hour. The PMP design hyetograph is the adjustment ratio multiplied by the hourly hyetograph as described in Section 3.4. Regarding Hershfield’s method, the 24-h total rainfall depth is distributed into a 24-h series according to a representative typhoon rainstorm. The representative typhoon rainstorm is derived based on the temporal distributions of the selected historical typhoon rainfalls [31]. The 24-h PMP design hyetograph generated by the three methods in the Shihmen and Feitsui watersheds is shown in Figure 8.
As shown in Figure 8, a centralized symmetric type of hyetographs can be obtained from the cumulative PMP envelop curve using the storm transposition method. Since the value of PMP in the Feitsui watershed is higher than that in the Shihmen watershed, a larger rainfall peak is found in the Feitsui watershed. In the typhoon rainstorm model, the PMP in the Feitsui watershed is also larger than in the Shihmen watershed. The temporal distribution of the PMP hyetograph depends on the circulation and orographic rainfalls generated along the design typhoon paths (shown in Figure 5). The temporal distribution of the PMP hyetograph in Hershfield’s method relies on the selected representative typhoon event. A more uniform distribution hyetograph in the Shihmen watershed was according to the rainfall records of Typhoon Herb and Typhoon Morakot. Typhoon Nari and Typhoon Morakot were the representative cases used in the Feitsui watershed for analysis.
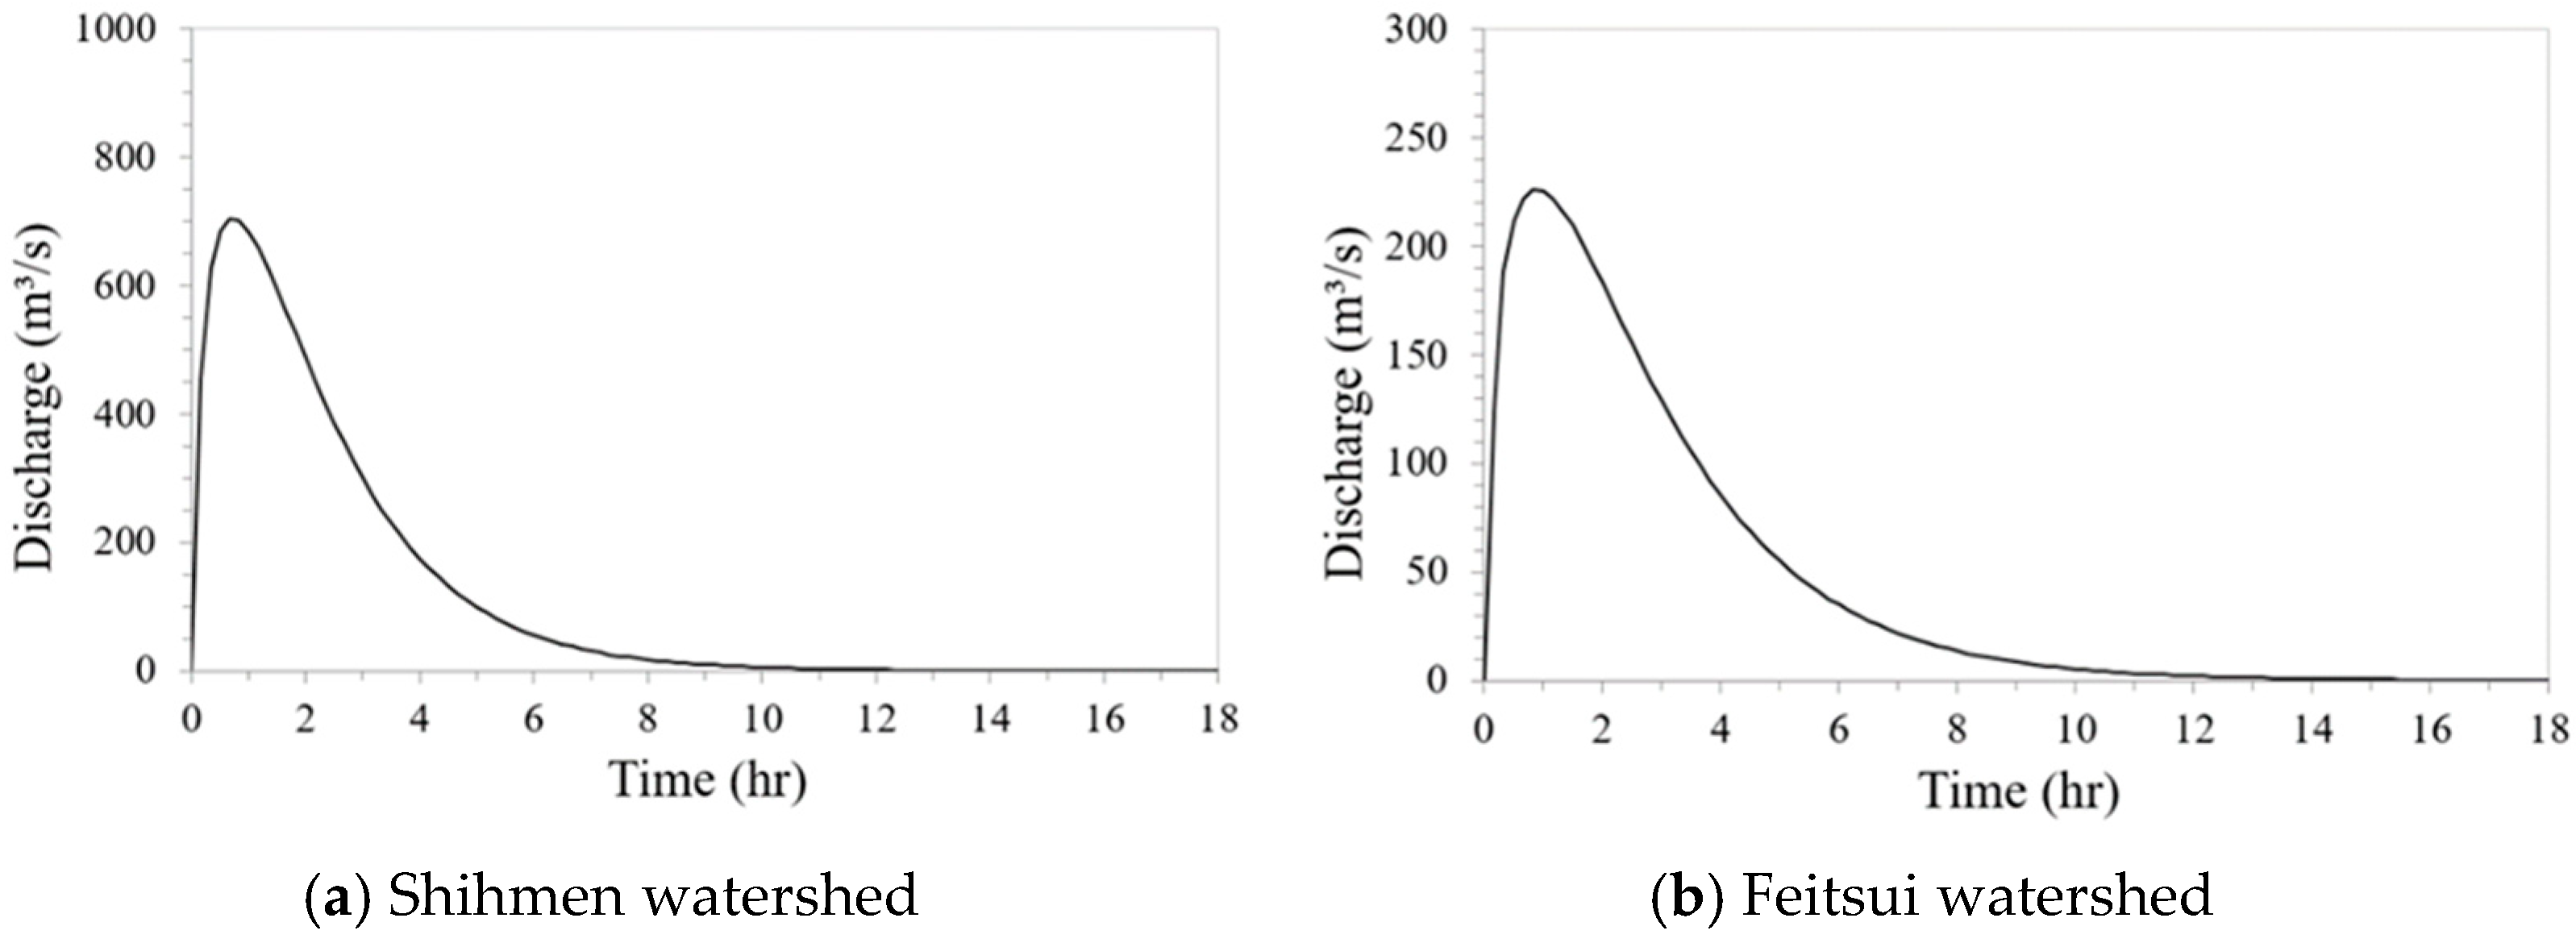
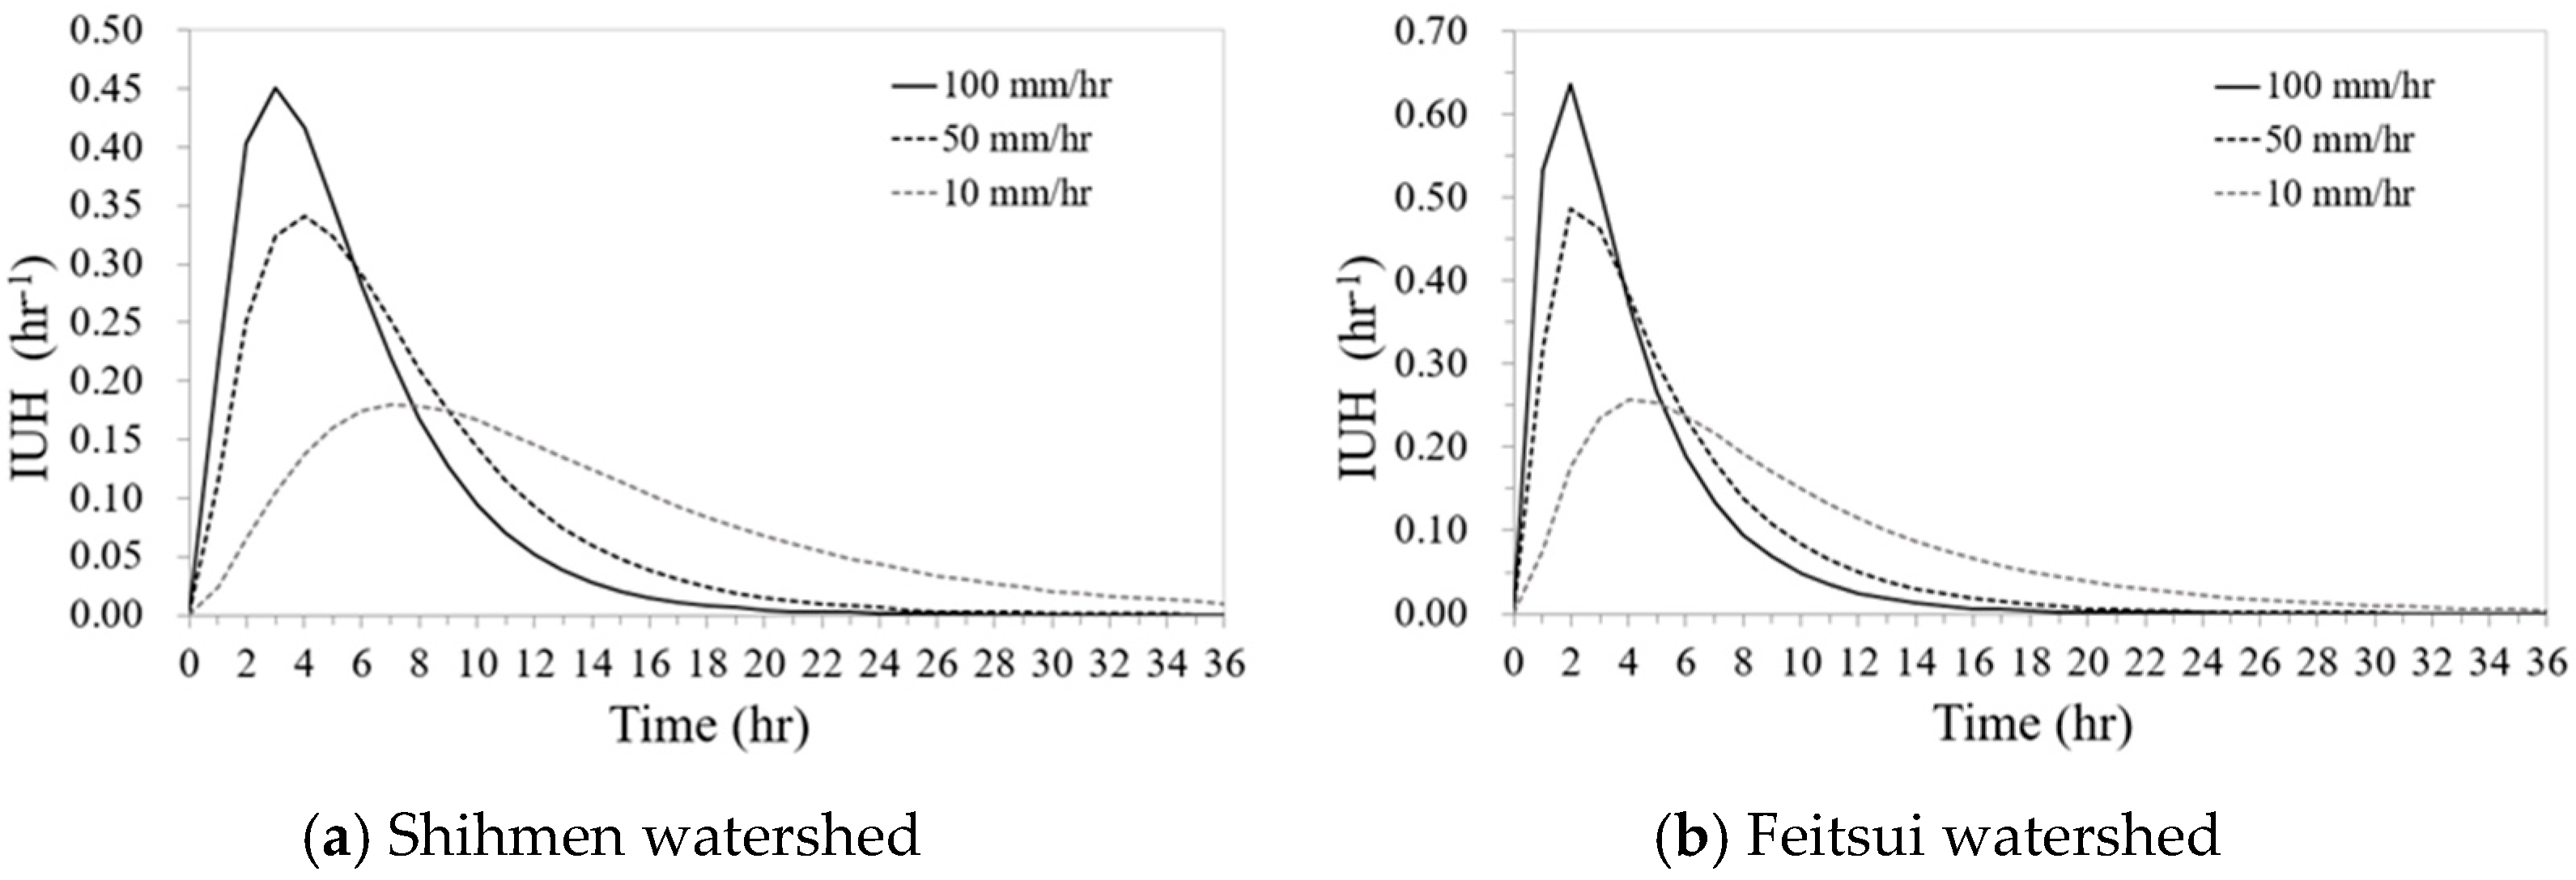
The 24-h PMP hyetographs generated using the three methods were then substituted into the DUH and KW-GIUH models to generate the flood hydrographs. Watershed geomorphologic factors, L, Lca, and Sc were substituted into Equation (7) to obtain the DUH (as shown in Figure 9). More detailed geomorphologic factors were derived using DEM and substituted into the KW-GIUH model. The applicability of using the KW-GIUH model for runoff simulation was verified through the flow records. In performing the model, the effective roughness coefficient for overland flow, No, and the channel-flow roughness coefficient, nc, were set as 6.0 and 0.05 in the Shihmen watershed, respectively; and they were 2.0 and 0.02 used in the Feitsui watershed. As shown in Equations (9) and (10), the runoff travel time depends on the rainfall intensity, which in turn changes the shape of the IUH (Equation (8)). A higher rainfall intensity will result in a larger peak discharge and a shorter time to peak discharge. On the contrary, a lower rainfall intensity will generate a hydrograph with a smaller peak discharge and a longer time to peak discharge. The IUHs corresponding to three different rainfall intensities (i = 10 mm/h, 50 mm/h, and 100 mm/h as examples) for the Shihmen and Feitsui watersheds are shown in Figure 10. As shown in Figure 10, the unit of the IUH is hr−1 because the IUH indicates the probability distribution of the hydrological response of the watershed receiving an instantaneous unit rainfall input (as shown in Equation (8)). The IUHs are then convoluting the PMP hyetographs to generate flow hydrographs for the PMF estimations.
Table 4 shows the PMF estimation using the PMP through a rainfall-runoff routing for the Shihmen and Feitsui watersheds. The values of PMF depend on the temporal distribution of the input PMP hyetograph, the IUH shape, and the watershed area. Since the size of the Shihmen watershed is about 2.5 times the Feitsui watershed, and the mainstream slope in Shihmen is also twice that in Feitsui to provide more rapidly concentrated flow, the values of PMF in the Shihmen watershed are about 1.2~2.5 times those in the Feitsui watershed.
Flow records near the Shihmen and Feitsui dam sites were collected for frequency analysis. The lengths of the records are 112 years (from 1907 to 2019) in the Shihmen watershed and 45 years (from 1974 to 2019) in the Feitsui watershed. The recorded maximum discharge was 8594 m3/s in the Shihmen watershed observed on 25 August 2004 and 4450 m3/s in the Feitsui watershed on 28 September 1974. As shown in Table 4, the discharges corresponding to the return periods of 100-yr and 1000-yr following the Pearson type-III distribution in the Shihmen watershed are 8678 m3/s and 11,988 m3/s, respectively. In the Feitsui watershed, 5586 m3/s and 7667 m3/s for the 100-yr and 1000-yr return periods follow the extreme value type-I distribution. The PMF values estimated by the three methods in the two watersheds are larger than the discharge corresponding to 1000-yr return periods.
As shown in Table 4, the peak discharges obtained by routing through KW-GIUH and DUH do not display too much difference. The variation of the PMF values mainly results from using different PMP estimation methods. In the Shihmen watershed, Hershfield’s method provides the largest PMF estimation, and the lowest PMF is estimated by the storm transposition method. On the contrary, Hershfield’s method provides the lowest PMF estimation, and the typhoon rainstorm model gives the largest estimation in the Feitsui watershed. The ranges of PMF were found within 14,500~27,267 m3/s for Shihmen in previous research [26,27,28], but no related report can be found for Feitsui. In the Shihmen Reservoir, all the PMF estimations are larger than the spillway design discharge (=14,100 m3/s) constructed in 1963. The same situation is found in the Feitsui Reservoir; the spillway design discharge (=9870 m3/s) is all smaller than the PMF estimations except for that generated by Hershfield’s method and routing with the DUH case.
It is noted that the PMFs reported in this study for the two reservoir watersheds are almost all larger than the design discharges of the existing spillways. Taipei City, the biggest metropolitan in Taiwan, is located downstream of these two reservoirs. Hence, extending the capacity of the existing spillways or constructing upstream bypasses to avoid catastrophic flooding downstream is required. Last year, a sediment sluicing tunnel was built at Amping (about 3.7 km upstream from the Shihmen dam), which delivers sediment-laden flow bypassing the reservoir directly into the tailwater to reduce sediment accumulation during the flood. The length of the tunnel is 3702 m, and the discharge capacity is 600 m3/s. The tunnel is expected to reduce sediment deposition by about 640,000 m3 per year, and the design flood discharge can increase from 14,100 m3/s to 14,700 m3/s. A second phase for sediment sluicing is an extra sluicing tunnel that will be constructed at Da-wan-ping, in which the design discharge is 1600 m3/s. Hence, the drainage capacity can be increased to 16,300 m3/s in the Shihmen Reservoir. However, no extra floodway is planned for the Feitsui Reservoir. Currently, the two reservoirs have established real-time flood warning systems to compensate for the insufficient spillway capacity. The early warning system can provide the incoming 6-h upstream inflow information for reservoir operation based on the next 6-h forecast rainfall provided by the Quantitative Precipitation Forecasts (QPF) system. It would allow timely action to prioritize releasing floodwater to mitigate the risk of excessive flooding in the spillways.
6. Conclusions
This study applied the storm transposition method and typhoon rainstorm model to estimate the 24-h probable maximum precipitation (PMP) in two large reservoir watersheds in northern Taiwan. We modified the way to determine the barrier height considering the moisture inflow direction in the storm transposition method. For the typhoon rainstorm model, we explored the effective terrain slope based on DEM analysis according to different windward directions to facilitate the calculation of orographic rainfall. Two runoff models, the dimensionless unit hydrograph (DUH) and the kinematic-wave-based geomorphologic IUH (KW-GIUH), were applied to transfer the PMP into PMF to fulfill the dam safety assessment.
The PMPs obtained by the storm transposition method and typhoon rainstorm model were compared with the results generated using Hershfield’s method. The maximum deviation of the PMP values estimated by the three methods is within 30% in the Shihmen watershed and 16% in the Feitsui watershed. The peak discharges obtained by routing through DUH and KW-GIUH do not display too much difference. The variation of the PMF values mainly results from using different PMP estimation methods. In the Shihmen watershed, the storm transposition method gives the lowest PMF estimation, and Hershfield’s method provides the largest value. On the contrary, the typhoon rainstorm model generates the largest PMF, and Hershfield’s method provides the lowest PMF in the Feitsui watershed. Nevertheless, it is noted that the PMFs estimated by using different methods are all larger than the design discharges of the existing spillways in Shihmen (Q = 14,100 m3/s) and in Feitsui (Q = 9870 m3/s), respectively. Since the biggest metropolitan of Taiwan is located downstream of the reservoirs, extending the capacity of the spillways and/or constructing upstream flood bypass channels should be urgent to avoid catastrophic flooding downstream.
Moreover, as shown in Section 2.2 and Section 3.4, procedures for performing the storm transposition method and typhoon rainstorm model are very complicated. The analytical procedure should be rerun to estimate PMP and PMF once a severe typhoon occurs. Hence, a GIS platform is considered required to integrate the historical rainstorm records, watershed geomorphologic factors, hydrological models, and PMP and PMF analysis procedures to facilitate the dam safety assessment. The advantage of using the GIS platform is that a large amount of data can be stored in the cloud and easily accessed by anyone through an online interface. An official GIS platform would improve the consistency of PMP and PMF estimations for watersheds across the country.
Author Contributions
Conceptualization, K.T.L. and Y.-H.H.; methodology, K.T.L., Y.-H.H. and J.Z.Y.; data curation, Y.-H.H. and J.Z.Y.; writing—original draft preparation, Y.-H.H. and J.Z.Y.; writing—review and editing, K.T.L. All authors have read and agreed to the published version of the manuscript.
Funding
This research has been supported through the grant by the Water Resources Planning Institute of Taiwan.
Data Availability Statement
Not applicable.
Conflicts of Interest
The authors declare no conflict of interest.
References
- Federal Energy Regulatory Commission. Engineering Guidelines, Chapter VIII. Determination of the Probable Maximum Flood; Federal Energy Regulatory Commission: Washington, DC, USA, 2001.
- World Meteorological Organization. Manual on Estimation of Probable Maximum Precipitation (PMP); WMO-No. 1045; World Meteorological Organization: Geneva, Switzerland, 2009. [Google Scholar]
- Hershfield, D.M. Rainfall Frequency Atlas of the United States; Technical Paper No. 40; Weather Bureau, United States Department of Commerce: Washington, DC, USA, 1961.
- Hershfield, D.M. Estimating the probable maximum precipitation. J. Hydraul. Div. 1961, 87, 99–116. [Google Scholar] [CrossRef]
- Hershfield, D.M. Method for Estimating Probable Maximum Precipitation. J. Am. Waterworks Assoc. 1965, 57, 965–972. [Google Scholar] [CrossRef]
- Thompson, C.S.; Tomlinson, A.I. Probable maximum precipitation in New Zealand for small areas and short durations. J. Hydrol. 1993, 31, 78–90. [Google Scholar]
- Collier, C.G.; Hardaker, P.J. Estimating probable maximum precipitation using a storm model approach. J. Hydrol. 1996, 183, 277–306. [Google Scholar] [CrossRef]
- Svensson, C.; Rakhecha, P.R. Estimation of probable maximum precipitation for dams in the Hongru River catchment, China. Theor. Appl. Climatol. 1998, 59, 79–91. [Google Scholar] [CrossRef]
- Al-Mamun, A.; Hashim, A. Generalized long duration probable maximum precipitation (PMP): Isohyetal map for Peninsular Malaysia. J. Spat. Hydrol. 2004, 4, 20–35. [Google Scholar]
- Fernando, W.C.D.K.; Wickramasuriya, S.S. The hydrometeorological estimation of probable maximum precipitation under varying scenarios in Sri Lanka. Int. J. Climatol. 2011, 31, 668–676. [Google Scholar] [CrossRef]
- Lee, J.; Choi, J.; Lee, O.; Yoon, J.; Kim, S. Estimation of probable maximum 1080 precipitation in Korea using a regional climate model. Water 2017, 9, 240. [Google Scholar] [CrossRef]
- Afzali-Gorouh, Z.; Bakhtiari, B.; Qaderi, K. Probable maximum precipitation estimation in a humid climate. Nat. Hazards Earth Syst. Sci. 2018, 18, 3109–3119. [Google Scholar] [CrossRef]
- Liao, Y.; Lin, B.; Chen, X.; Ding, H. A new look at storm separation technique in estimation of probable maximum precipitation in mountainous areas. Water 2020, 12, 1177. [Google Scholar] [CrossRef]
- Wang, S.D.; Liu, G.Y.; Qu, K.G.; Lin, Z.M.; Huang, Z.C.; Xie, W.Q. Research on the Maximum Possible Rainstorm at the Feicui Valley Dam Site; Air Force Meteorological Center Research Report No. 13; Air Force Meteorological Center: Taipei, Taiwan, 1977. [Google Scholar]
- Wang, S.D. Research on probable maximum precipitation (PMP) of major reservoirs in Taiwan. In Proceedings of the Second Symposium on Water Conservancy Engineering, Taipei, Taiwan, 4–7 September 1984; pp. 333–347. [Google Scholar]
- Liu, C.-C.; Yang, T.-C.; Kuo, C.-M.; Chen, J.-M.; Yu, P.-S. Estimating probable maximum precipitation by considering combined effect of typhoon and southwesterly air flow. Terr. Atmos. Ocean. Sci. 2016, 27, 991–1003. [Google Scholar] [CrossRef]
- Hart, T.L. Survey of Probable Maximum Precipitation Studies Using the Synoptic Method of Storm Transposition and Maximization. In Proceedings of the Workshop on Spillway Design, Melbourne, Australia, 7–9 October 1981; Conference Series No. 6, Australian Water Resources Council, Australian Department of National Development and Energy. Australian Government Publishing Service: Canberra, Australia, 1982. [Google Scholar]
- Schreiner, L.C.; Riedel, J.T. Probable Maximum Precipitation Estimates, United States East of the 105th Meridian; Hydrometeorological Rep. 51; U.S. Department of Commerce, National Oceanic and Atmospheric Administration: Washington, DC, USA, 1978.
- Chow, V.T.; Maidment, D.R.; Mays, L.W. Applied Hydrology; McGraw-Hill: New York, NY, USA, 1988. [Google Scholar]
- Lee, C.S.; Huang, L.R.; Shen, H.S.; Wang, S.T. A climatology model for forecasting typhoon rainfall in Taiwan. Nat. Hazards 2006, 37, 87–105. [Google Scholar] [CrossRef]
- Wu, Z.Y.; Xie, X.L.; Qiao, F.L.; Chen, Z.G.; Huang, Q.F. Analysis of precipitation characteristics in Zengwen Reservoir catchment area and research on precipitation forecast of typhoon. Atmos. Sci. 1981, 8, 1–18. [Google Scholar]
- Lee, K.T.; Yen, B.C. Geomorphology and kinematic-wave-based hydrograph deviation. J. Hydraul. Eng. 1997, 123, 73–80. [Google Scholar] [CrossRef]
- Taiwan Provincial Water Conservancy Bureau. Research on the Application of Taiwan Hydrological Data Computer Files—Dimensionless Unit Hydrograph Calculation of Major River Basins in Taiwan; Taiwan Provincial Water Conservancy Bureau: Taichung, Taiwan, 2002.
- Yen, B.C.; Lee, K.T. Unit hydrograph derivation for ungaged watersheds by stream order laws. J. Hydrol. Eng. 1997, 2, 1–9. [Google Scholar] [CrossRef]
- Rodriguez-Iturbe, I.; Valdes, J.B. The geomorphologic structure of hydrologic response. Water Resour. Res. 1979, 15, 1409–1420. [Google Scholar] [CrossRef]
- Henderson, F.M.; Wooding, R.A. Overland flow and groundwater flow from a steady rainfall of finite duration. J. Geophys. Res. 1964, 69, 1531–1540. [Google Scholar] [CrossRef]
- Chang, X. Exploring the Possible Maximum Flood Volume of Shihmen Reservoir with the Concept of Area Reduction Factor. Master’s Thesis, Department of Civil Engineering, National Central University, Taoyuan City, Taiwan, 2013. [Google Scholar]
- Northern Region Water Resources Office. Reservoir Safety Assessment Report; Northern Region Water Resources Office: Taipei, Taiwan, 2015. [Google Scholar]
- Northern Region Water Resources Office. Reservoir Safety Assessment Report; Northern Region Water Resources Office: Taipei, Taiwan, 2020. [Google Scholar]
- World Meteorological Organization. Manual for Estimation of Probable Maximum Precipitation; Operational Hydrology Report No. 1; World Meteorological Organization: Geneva, Switzerland, 1986.
- Water Resource Agency. Hydrological Design Application Manual; Water Resource Agency: Taipei, Taiwan, 2001.
Figure 1.
Schematic of the storm transposition method.

Figure 2.
Example of barrier height determining in the azimuth VIII.

Figure 3.
The 24-h rainfall depth-area-duration curves of the Shihmen and Feitsui watersheds.

Figure 4.
Envelope curve of PMP for severe typhoon rainstorms in Shihmen and Feitsui watersheds.

Figure 5.
Historically severe typhoon tracks and the design of typhoon paths in the Shihmen and Feitsui watersheds.
Figure 5.
Historically severe typhoon tracks and the design of typhoon paths in the Shihmen and Feitsui watersheds.

Figure 6.
Schematic diagram of the DUH.

Figure 7.
Location map of the Shihmen and Feitsui watersheds.

Figure 8.
Design hyetograph of 24-h PMP.

Figure 9.
Dimensionless unit hydrograph (DUH) in the Shihmen and Feitsui watersheds.

Figure 10.
Kinematic-wave-based geomorphologic IUH (KW-GIUH) in the Shihmen and Feitsui watersheds.


Table 1.
Geomorphologic factors and hydraulic structures of the reservoir watersheds.
| Watershed | Shihmen | Feitsui |
|---|---|---|
| Watershed area (km2) | 758.9 | 302.38 |
| Mainstream length (km) | 101.61 | 53.29 |
| Mainstream slope (m/m) | 0.02689 | 0.00969 |
| Watershed mean slope (m/m) | 0.4161 | 0.3022 |
| Watershed mean elevation (m) | 1408.1 | 477.5 |
| Watershed outlet elevation (m) | 224.2 | 69.9 |
| Dam height (m) | 133.1 | 122.5 |
| Reservoir storage (106 m3) | 2.02 | 3.35 |
| Design flood discharge (m3/s) | 13,800 | 9870 |
Table 2.
Meteorological data for analysis.
| Typhoon Rainstorm | Observation Stations | Target Basin | |||
|---|---|---|---|---|---|
| Station | Elevation (m) | Dewpoint (°C) | Sea-Level Dewpoint (°C) | Barrier Height/ Wind Azimuth | |
| 1959/08 T.D. | Tainan | 40.8 | 24.7 | 24.9 | 20.4 m (NNW) |
| 1960/07 Shirley | Taichung | 84.0 | 24.1 | 24.4 | 223.3 m (NNW) |
| 1963/09 Gloria | Taipei | 6.3 | 25.2 | 25.2 | 396.7 m (ENE) |
| 1996/07 Herb | Alishan | 2413.4 | 15.6 | 25.2 | 1206.7 m (NNW) |
| 2001/09 Nari | Chiayi | 26.9 | 24.1 | 24.2 | 1335.4 m (NNE) |
| 2004/06 Mindulle | Taichung | 84.0 | 23.5 | 23.8 | 499.3 m (SSW) |
| 2004/08 Aere | Hsinchu | 26.9 | 23.6 | 23.7 | 29.4 m (WNW) |
| 2008/09 Sinlaku | Taichung | 84.0 | 25.0 | 25.3 | 817.7 m (NNE) |
| 2009/08 Morakot | Alishan | 2413.4 | 16.5 | 26.1 | 1206.7 m (NNW) |
Note(s): (1) Both Shihmen and Feitsui reservoirs adopted Taipei station meteorological data for calculation. For the Taipei station: elevation = 6.3 m, dewpoint = 26.5 °C, sea-level dewpoint = 26.53 °C. (2) The barrier height (the elevation of the reservoir watershed outlet) of the Shihmen watershed is 1082 m, and it is 583 m for the Feitsui watershed.
Table 3.
Results of 24-h PMP analysis.
| Watershed | (mm) | PMP (mm) | |||
|---|---|---|---|---|---|
| 100-yr | 1000-yr | Storm Transposition Method | Typhoon Rainstorm Model | Hershfield’s Method | |
| Shihmen | 1140 | 1592 | 1359 | 1386 | 1934 |
| Feitsui | 772 | 1036 | 1823 | 1526 | 1576 |
Table 4.
Results of PMF analysis.
| Watershed | QT (m3/s) | PMF (m3/s) | ||||||
|---|---|---|---|---|---|---|---|---|
| Storm Transposition Method | Typhoon Rainstorm Model | Hershfield’s Method | ||||||
| 100-yr | 1000-yr | KW-GIUH | DUH | KW-GIUH | DUH | KW-GIUH | DUH | |
| Shihmen | 8678 | 11,988 | 17,107 | 16,582 | 25,023 | 23,235 | 26,962 | 24,163 |
| Feitsui | 5586 | 7667 | 14,168 | 10,950 | 15,949 | 14,630 | 11,435 | 9350 |
Note(s): Design discharge of the spillway: 14,100 m3/s (Shihmen), 9870 m3/s (Feitsui).
Disclaimer/Publisher’s Note: The statements, opinions and data contained in all publications are solely those of the individual author(s) and contributor(s) and not of MDPI and/or the editor(s). MDPI and/or the editor(s) disclaim responsibility for any injury to people or property resulting from any ideas, methods, instructions or products referred to in the content. |
© 2023 by the authors. Licensee MDPI, Basel, Switzerland. This article is an open access article distributed under the terms and conditions of the Creative Commons Attribution (CC BY) license (https://creativecommons.org/licenses/by/4.0/).
Share and Cite
MDPI and ACS Style
Lee, K.T.; Hsu, Y.-H.; Yang, J.Z. Estimating Typhoon-Induced Maximum Flood for Spillway Safety Assessment—Case Studies in Taiwan. Water 2023, 15, 3040. https://0-doi-org.brum.beds.ac.uk/10.3390/w15173040
AMA Style
Lee KT, Hsu Y-H, Yang JZ. Estimating Typhoon-Induced Maximum Flood for Spillway Safety Assessment—Case Studies in Taiwan. Water. 2023; 15(17):3040. https://0-doi-org.brum.beds.ac.uk/10.3390/w15173040
Chicago/Turabian StyleLee, Kwan Tun, Yu-Han Hsu, and Jing Zong Yang. 2023. "Estimating Typhoon-Induced Maximum Flood for Spillway Safety Assessment—Case Studies in Taiwan" Water 15, no. 17: 3040. https://0-doi-org.brum.beds.ac.uk/10.3390/w15173040
Note that from the first issue of 2016, this journal uses article numbers instead of page numbers. See further details here.