Article

Evaluation of Soundscapes in Urban Parks in Olsztyn (Poland) for Improvement of Landscape Design and Management

by
Agnieszka Jaszczak
1,*,
Natalia Małkowska
1,
Katarina Kristianova
2,
Sebastian Bernat
3 and
Ewelina Pochodyła
4
1
Department of Landscape Architecture, University of Warmia and Mazury, Prawochenskiego 17, 10-719 Olsztyn, Poland
2
Faculty of Architecture and Design, Slovak University of Technology in Bratislava, Namestie slobody 19, 812 45 Bratislava, Slovakia
3
Department of Spatial Management, Maria Curie-Skłodowska University, Krasnicka 2d, 20-718 Lublin, Poland
4
Department of Water Resources, Climatology and Environmental Management, University of Warmia and Mazury in Olsztyn, Plac Lodzki 2, 10-719 Olsztyn, Poland
*
Author to whom correspondence should be addressed.
Submission received: 27 November 2020 / Revised: 6 January 2021 / Accepted: 10 January 2021 / Published: 13 January 2021

Abstract

:
Soundscape analyses and noise measurements should be a part of pre-design works involved in planning green areas in city centers. The aim of the study was to conduct a multi-criteria analysis of the soundscape of three parks in Olsztyn (Poland) as a part of the landscape planning process to determine the directions of re-design of places most exposed to noise. The research included: 1. functional and spatial analysis of the park surroundings in reference to the city environment, 2. analysis of the acoustic map, 3. measurements of sound pressure levels (SPL) at selected points in two periods (leafless and leafy), 4. analysis of characteristic sounds, 5. interview with park users and preparation of a mental map. The results of research regarding the perception of the soundscape of all three parks by respondents differ slightly from the results of both the acoustic map and SPL measurements. The results also confirm the difference between SPL in the leafless and leafy period. Places most exposed to noise are located at the park boundaries along the main access roads, and at park entrances. Recommendations and sample solutions are proposed, based on two suggested design activities, namely the reduction of undesirable sounds, and introduction of desirable sounds to the parks.

1. Introduction

At the end of the 1960’s, Schafer established The World Soundscape Project that initiated the development of the interdisciplinary research trend of sound ecology [1,2,3]. The main intention of the project was to develop solutions aimed at creating or maintaining an ecologically sustainable sound space with consideration of the relationship between the sound environment and the community [2,4,5].
This article draws on the approach of landscape architecture and soundscape. Soundscape is a key term used in sound ecology. The work of Porteous and Mastin (1985) was devoted to soundscape themes as early as in the 1980s, although the term soundscape was used by Southworth (1969) in a study of urban space in Boston [6,7]. According to international standard ISO 12913-1:2014, it is a perceived physical environment construct, defined as “the acoustic environment as perceived or experienced and/or understood by a person or people in context” [8]. Acoustic indicators are not sufficient to describe it, because it results from complex relationships occurring between various sounds and human auditory perception [9]. As a multidimensional phenomenon, soundscape cannot be measured and described exclusively with numbers [10]. It is therefore important to investigate the subjective evaluation of noise nuisance. This requires learning about people’s sound preferences, and the relationships between certain characteristics of the acoustic environment and the perception of acoustic stimuli [11]. The concept of soundscape introduces a different approach to the analysis of the acoustic environment compared to the concept of noise [12]. Therefore, strategies should not be limited to managing and controlling noise in urban space. Interest in soundscape quality should also increase due to its impact on health, both physical and mental [13,14,15,16]. Soundscape is also increasingly popular in the field of landscape architecture, landscape planning, and design [17,18,19,20,21]. Studies on landscape aesthetics usually involve the analysis of the visual appeal of landscape, and ignore the impact of sounds and other stimuli. Nonetheless, sound increasingly frequently proves to contribute to a positive or negative judgment of “visible” landscapes, and cohesiveness between sound and image is considered to lead to a better assessment of landscapes [22,23,24,25,26,27].
Civilization changes have led to fast disappearance of tranquil areas and traditional soundscapes. The arrangement of communication, industrial, recreational, and service facilities, as well as transportation systems, directly affects the acoustic nature of space. It is not possible to completely eliminate sounds generated by transport, industry, services, etc., in urban areas. An attempt should be made, however, to protect places of high acoustic quality (including quiet areas). In accordance with the idea of sound ecology, the soundscape of cities should be optimized. The sound space should be friendly, aesthetically pleasing, orderly, and functional, and most importantly (if possible) without excessive noise [28].
According to Cerwén and Mossberg, safeguarding the quality of parks and other recreational spaces as quiet areas in the future is likely to emphasize the importance of balancing urban noise even more [29]. Research carried out by Brambilla et al. [30,31] in urban parks in Milan and Rome showed that sound pressure levels are often almost higher than the limits commonly used to define quiet areas.
The quality of urban soundscapes is closely related to the overall urban environmental quality [11,32,33,34]. Noise pollution is a growing problem in the environment of cities, and the design of urban soundscapes as part of sustainable urban landscapes should be taken into account by architects, landscape architects, and urban planners [32,33,35]. Experiments with the soundscape concept in the architectural design process provide new opportunities for progressive design solutions [36], and enable planners, architects, or engineers to assess the likely impact of different design alternatives on a place’s soundscape [5,35,37,38].
Legal protection against noise in Poland is currently based on the Environmental Protection Law Act (2001) [39] and the applicable ordinances compliant with the provisions of the Environmental Noise Directive [40]. With a few exceptions (e.g., criteria for delimiting quiet areas), the aforementioned Act is coherent, and introduces acoustic standards as well as a system of penalties for non-compliance with the law. So far, however, these regulations have not led to any improvement of the acoustic climate in Poland [41]. The current law concerning the protection and shaping of landscape is equivocal and imprecise, and has a generally declarative character. Government administration authorities have no instruments to enforce the law. The analysis of the “Environmental protection programs against noise” projects for Polish agglomerations has shown that protection against noise is often limited to enclosing main transportation arteries with acoustic screens or replacing window frames [42]. The particularly significant issues of spatial planning, separation of quiet areas, or acoustic design of public spaces is neglected. An important role in the protection of the sonic qualities of a landscape should be played by local planning and architectural and landscape design [43]. The important function of urban green areas in reducing noise is recognized by the European Environment Agency. It is referred to in two reports, namely Quiet areas in Europe—the environment unaffected by noise pollution, 2016 [44], and Noise in Europe, 2014 [45].
The aim of the article is a multi-criteria analysis of soundscape based on the example of three parks in Olsztyn (Poland) as a part of the landscape planning process to determine the direction of re-design of places most exposed to noise. Such analyses are usually omitted or treated marginally in the design process, although they may affect the way parks are designed, potentially resulting in reduction of noise nuisance. Users’ opinions regarding aesthetics or function are often taken into account in the design process, while no assessment is undertaken concerning noise or sound preferences.
The presented analyses contribute to expanding knowledge through the use of a simple, multi-criteria analysis process aimed at the identification and evaluation of the soundscape of parks in middle-sized Central and Eastern European cities as an element of design and planning. Importantly, while many studies on the topic of soundscape of parks are available globally, research from Central and Eastern Europe is still scarce, particularly that employing a multidimensional approach towards soundscape. The majority of studies focus only on noise measurements or on soundscape perception in transportation zones. Moreover, different geographic, spatial, and climate conditions of these regions should be emphasized to permit comparison with other regions around the globe in the future.

2. Literature Review

2.1. The Role of Green Infrastructure in Perception of Soundscape

Urban parks and the sound properties of greenery are important in the context of the soundscape quality of an urban environment. Urban parks are considered public spaces important for sustainable urban environments. They provide urban dwellers with places to improve their physical and mental health [46,47,48,49]. They are regarded as tranquil spaces with restorative effects [16,50,51]. Nonetheless, the environmental functions of urban parks involving improvement of the soundscape of the urban environment by reducing noise can be constrained by their size and location [52].
The spatial forms of greenery shaping positive features of the city’s local environment are important in the context of climate change [53,54] as well as noise reduction [55,56]. Urban soil and vegetation can attenuate noise pollution [57,58]. The same concerns green roofs [59] and vegetated surfaces of vertical greening systems [60,61].
Considering the role of greenery in improving the environment, the issue of reducing noise by introducing vegetation is naturally becoming a subject of discussion [62,63]. In this case, the role of greenery is determined by physiographic conditions, terrain, habitat, and climatic conditions, as well as the structure, form, and morphology of individual species. Single and low plantings provide small effects, while greater value is offered by group and compact plantings. Moreover, some researchers draw attention to the possibility of using a variety of combined techniques, e.g., barriers constituting walls constructed in various technologies in combination with vegetation [60,61]. Such technical and engineering solutions provide better results, particularly in the spaces of cities affected by transport noise pollution [63]. While such solutions seem to be expedient in industrial or transportation spaces, aesthetic and environmental issues make them less suited to the park space, although from the point of view of noise reduction they are obviously a basic necessity. With regard to the type of vegetation and its role in noise suppression, various authors have conducted laboratory and “in situ” studies [63,64].
Leaves have the ability to attenuate acoustic waves. The higher the density of greenery, the total surface of the leaves and area of the complex, the greater the damping value [65]. According to Zimny [66], a lawn is the type of vegetation characterized by the lowest acoustic wave absorption capacity due to the low height and low density of the vegetation [66].
According to Czerwieniec and Lewińska [67], hedges consisting of trees or shrubs are often planted in order to suppress noise. This type of acoustic barrier can suppress sounds depending on the density, height, width, and species used [67]. Results of research by Samara and Tsitsoni [64] showed higher noise reductions through a belt of trees than over grass-covered ground. To improve the contribution of vegetation to noise reduction, it should be sufficiently dense to prevent the observer from seeing the road through the vegetation. The level of ground vegetation should also be as high as possible. This is achieved through combining trees and shrubs [51,64,68,69,70,71,72]. According to research by Van Renterghem, the reduction of the level of noise nuisance by vegetation can reach 10 dB Lden [62].

2.2. Research Methods on Soundscapes

Several methods of quantitative and qualitative measurement and assessment of urban soundscapes have been developed [73,74,75,76,77,78,79,80]. This reflects the fact that the assessment of a sound environment cannot be determined by a simple measurement. ISO/TS 12913-3:2019 provides requirements and supportive information on analysis of data collected in situ through methods specified in ISO/TS 12913-2:2018 [81,82].
The human perception of noise is not absolute, and primarily relies on the meaning of sounds in relation to the sources emitting noise and the people exposed to it [32]. Therefore, the methods of measurement and assessment need to account for the subjective impact of noise in correlation with acoustic parameters, for both the negative and positive effects of noise in defining the acoustic quality of an urban environment [32].
As indicated by Kang et al. [10] referring to Fastl and Zwiker [83], psychoacoustics deals with the quantitative link between physical stimuli and the hearing sensations caused by them. Psychoacoustic parameters such as loudness, roughness, sharpness, or fluctuation strength permit the description of the character of an acoustic environment in detail and allow the relation of the physical phenomenon (acoustic environment) to the perceptual construct of the acoustic environment (soundscape). A hearing-related parameter [10] that has proved significant in several surveys [84] is the relative approach parameter, related to perceivable patterns in acoustic signals. On the other hand, researchers of soundscape focus on individual data regarding responses to the acoustic environment [10]. Four primary methods of soundscape research can be designated from the review by Aletta et al. [85]: soundwalks, laboratory experiments, narrative interviews, and behavioral observations. These four methods are predominantly associated with five data collection tools: questionnaires, semantic scales, interview protocols, physiological measurements, and observation protocols [85].
Along with the development of information technologies, mapping soundscapes has been enjoying growing interest in recent years. The numerous works addressing the issue [86,87,88,89] employ, among others, the ecological, humanistic, and acoustic approaches [43] [86,87,88,89].
Soundwalk, defined in ISO12913-2:2018 as “the method that implies a walk in an area with a focus on listening to the acoustic environment” [82], and described by Butler [90] as practice in cultural geography, is also used as a method of studying soundscapes (e.g., [78,91,92]).

3. Materials and Methods

The primary assumptions of the research were based on the following premises:
  • emphasis on the purposefulness of introducing soundscape analyses when designing green areas, including city parks
  • analysis of the degree and direction of noise in the park’s surroundings
  • analysis of the functional and spatial connections in relation to noise level based on the analysis of the acoustic map and own measurements
  • inclusion of noise and SPL measurements in leafy and leafless periods
  • involving park users in research as direct recipients of these spaces
  • indication of design guidelines and proposals for parks, based on the results of soundscape analyses in the park and generally accepted principles of designing green areas
Additional assumptions regarding the selection of the study area and parks were as follows:
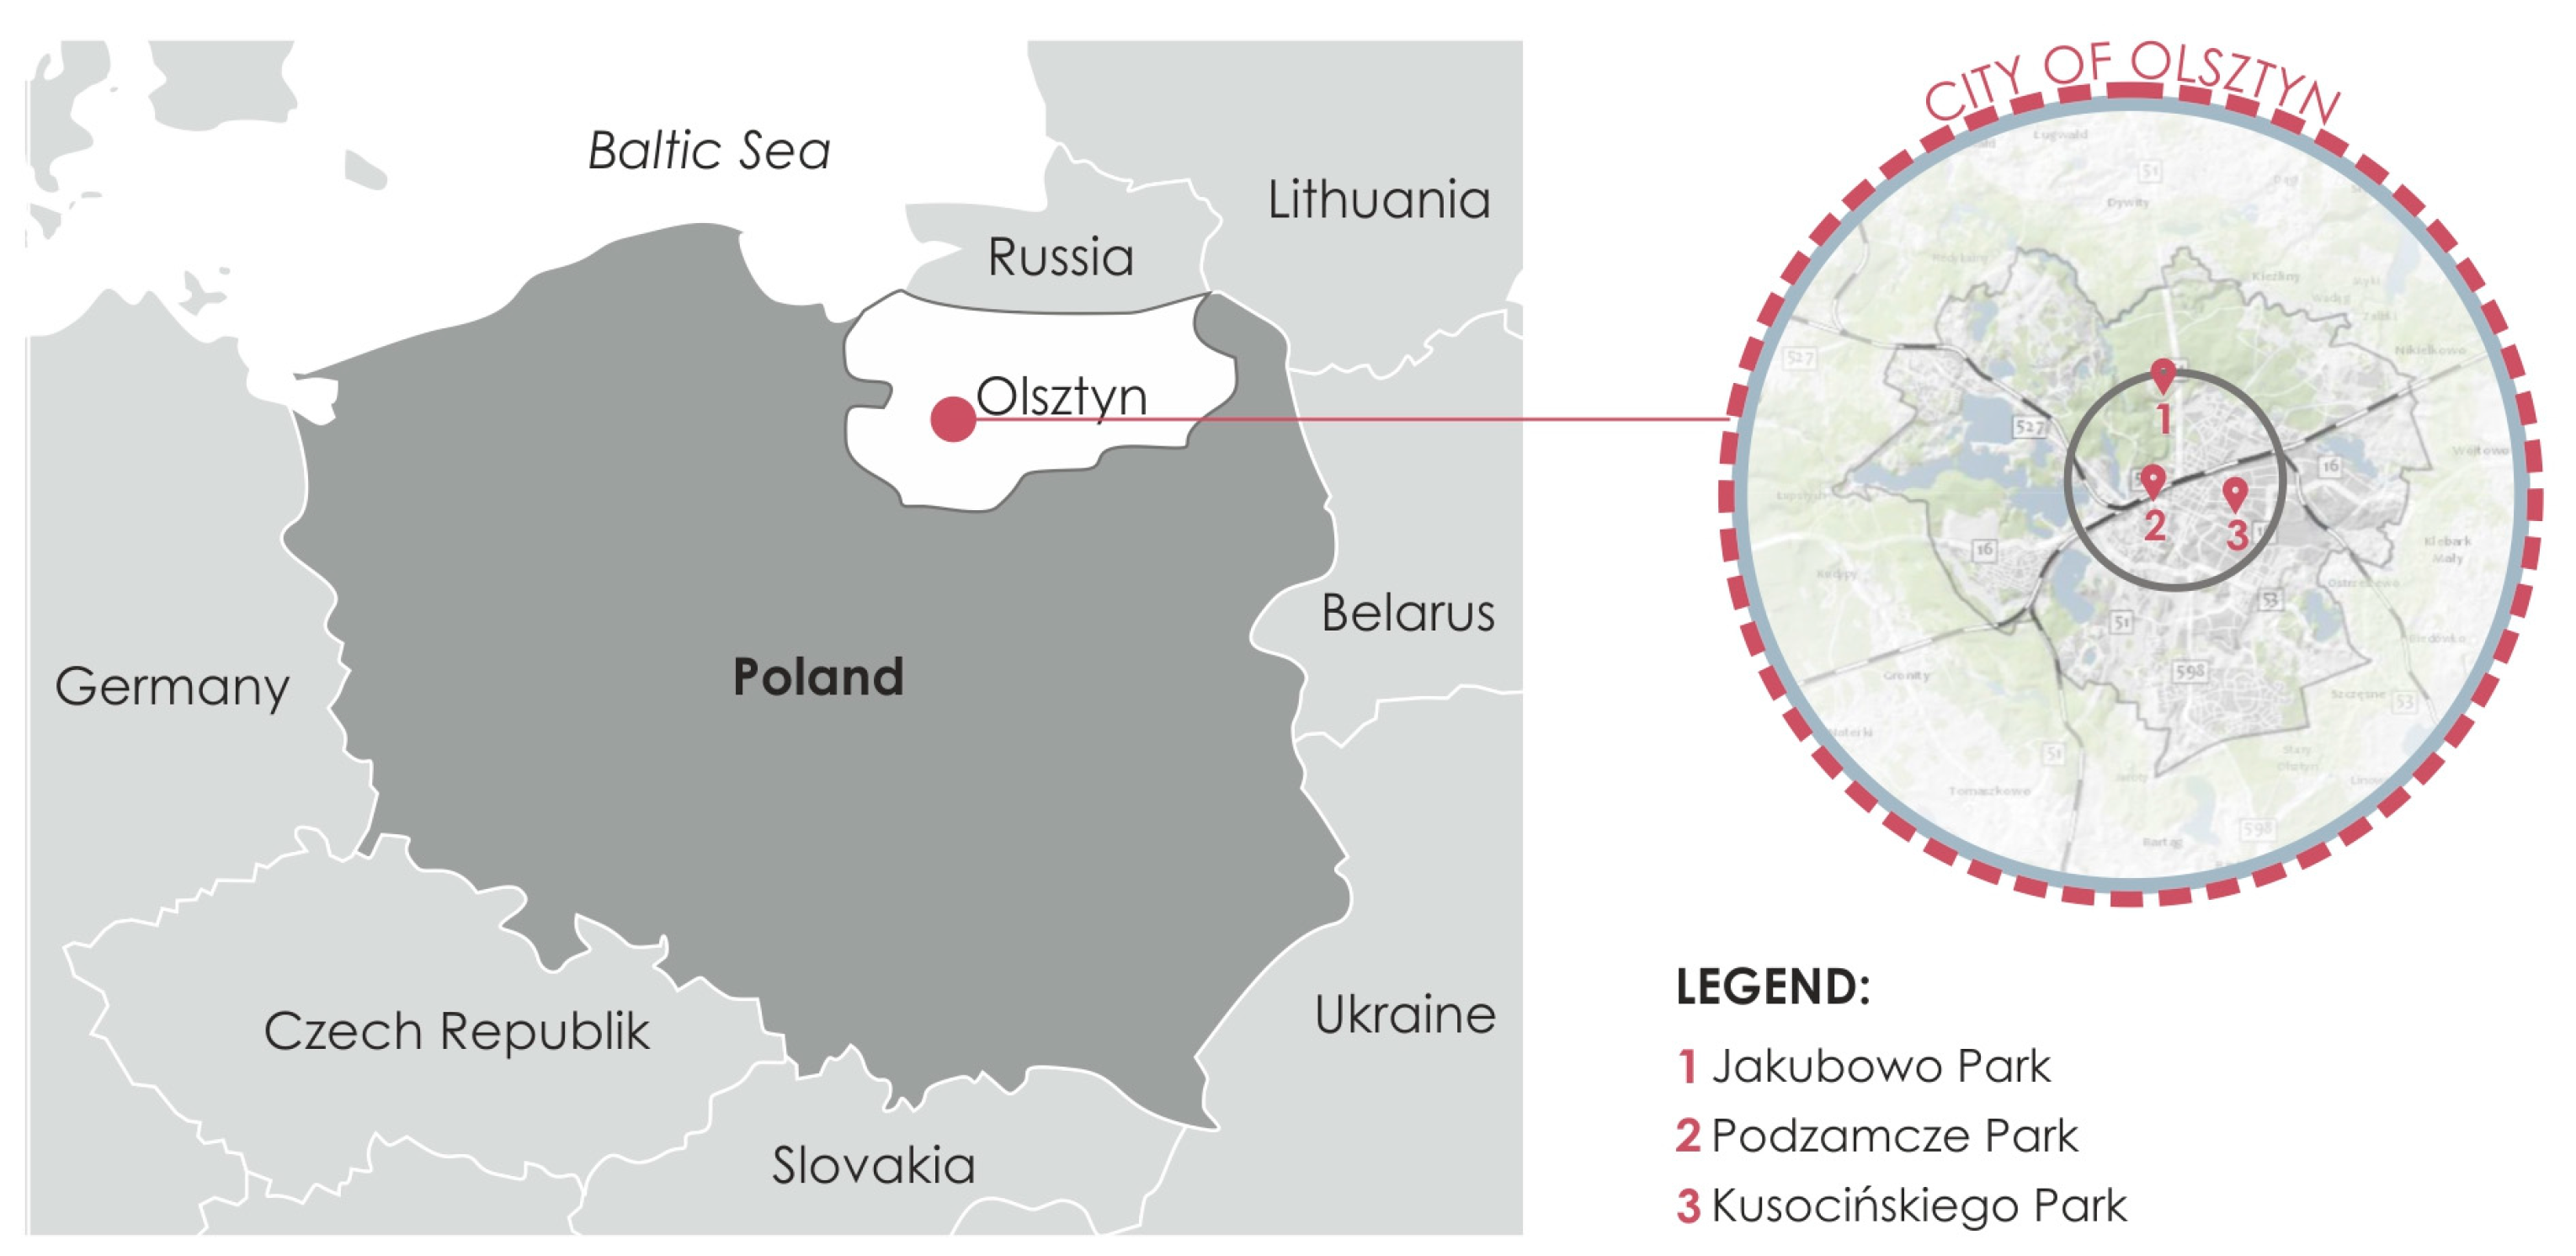
  • The research was carried out in Olsztyn, the largest city of the Warmia and Mazury region (with a population of 170,000). Olsztyn was deliberately chosen because of the specificity of its program strategies which prioritize environmental protection and reduction of noise levels, thereby improving the safety and health conditions of residents
  • The choice of research units, i.e., parks, was also determined by the fact that, in the development documents, the city of Olsztyn is declared to be a “Garden City”, environmentally friendly and quiet
  • As mentioned previously, studies in Olsztyn and throughout Poland regarding noise measurements and types of sounds, as well as analyses of sound perception were not taken into account when designing green areas, including parks. The study results may be helpful in the planning and design process, not only in the case of Olsztyn, but also in other cities of a similar structure.

3.1. The Study Area

The study was based on a preliminary analysis of the six largest parks in Olsztyn, Poland (Annex 1). The detailed analyses (discussed in this article) covered three selected parks. The choice of three parks was dictated by their location and function, and predominantly by the absence of disturbing elements, e.g., road or construction works, during the measurements (such disruptions occurred in the other three).
The study area covers three city parks in different parts of the city of Olsztyn in the Warmian-Masurian Voivodeship (Figure 1, Table 1).
The selection of parks for analysis was based on the following:
  • size of parks—they are the largest parks in the city in terms of surface area (from 8.6 ha to 17.4 ha), (see Table 1). The urban forest complex located in the northern part of the city, as well as smaller parks and squares, were excluded from the analysis due to their different nature and use.
  • location—all parks are located in the city center or just outside the city center, within a radius of 4 km from the geometric center.
  • accessibility—all parks are open to the public and frequently visited by inhabitants.
  • source of noise—the parks were selected for analysis based on the assumption that the main source of noise is generated by transport, particularly at park boundaries.
  • functional program—the parks were selected for analysis due to the diverse functional program offered by each of them.
All the analyzed parks have diversified functions, dominated by walking, followed by active sport and recreation, and finally a historical and aesthetic function. The parks are used by the residents daily throughout the year, and are publicly available. In all of the parks, vegetation structure is based on compact plantings of trees and shrubs, and large fragments of lawns, along with low vegetation.
The basic characteristics of the analyzed parks are presented in Table 1.

3.2. Methodological Stages of Research

The research consisted of an analysis of noise level by reference to the acoustic map, followed by SPL measurements in the leafless and leafy periods. These measurements were indicative, complementing the analysis of the acoustic map. The qualitative research consisted of the analysis of characteristic sounds at selected points in two periods (leafless and leafy). The research was supplemented with interviews with park users.
The aforementioned analyses were preceded by a simplified functional and spatial analysis of the park surroundings. Based on the results, the aim was to formulate guidelines and recommendations for landscape design and management targeted at the reduction of perceived noise, as well as improvement of soundscapes and therefore users’ comfort in parks.
The preliminary recognition of the study areas, photo inventory, and description of the elements that may affect the soundscape (vegetation, topography, usable zones, street furniture, etc.), as well as the analysis of functions in the areas located close to parks, were conducted in October 2017. This included a study of the acoustic map (noise map) created by BMT AGROSS, elaborated for the environmental noise protection program for the city of Olsztyn [93].
Analyses of SPL measurements and analyses of characteristic sounds were carried out in April 2018 (leafless period) and May 2018 (leafy period). The analysis of characteristic sounds employed a method of assessing the structure of the soundscape, modified for our research after Bernat [43]. This analysis was carried out at selected points during a walk by listening to and recording characteristic sounds.
In terms of climate and vegetation, the region of Warmia and Mazury is characterized by variable and transient climate. Weather conditions are largely variable both at a daily and an annual scale. Vegetation rapidly develops and becomes leafy after winter and early spring, sometimes lasting until mid-April (cooler period). In connection with this period of analysis, in mid-April the trees were in a leafless state, while at the end of May they were already in a leafy state, as illustrated by photographs taken in particular periods in all parks (due to the imposed limit, this article presents only one example, Figure 2).
Analyses of the soundscape of the parks were first carried out in a leafless state, and then in a leafy state. The examinations were performed in the afternoon (2 p.m.–4 p.m.) on working days (9–12 April 2018 and 22–24 May 2018), in moderate wind and sunny weather. No mass or other events that could interfere with the perception of the soundscape took place in the analyzed areas during the research.
The inclusion of analyses in both the leafy and leafless state during the research was intentional. Vegetation is assumed (based on the available research results of other authors) to be a moderate or neutral sound barrier in comparison to other technical and engineering solutions. While the use of noise barriers along highways is perfectly justified, noise suppression in the city center and nearby buildings by means of screens is difficult due to other functions of these spaces, high number of their users, spatial and conservation issues, or aesthetic reasons. It is therefore difficult to find an optimal solution for green areas bordering, e.g., car traffic. Therefore, the study refers to the need to propose solutions in the form of plant forms, considered not only from the point of view of noise reduction (even if the assumed effect is smaller), when compared to the commonly used acoustic road barriers. The use of plant forms, particularly in parks, is an obvious solution, but it is important to introduce the function of a “green” acoustic barrier. Such “green” barriers are also important from a psychological point of view in the context of perceiving sounds.

3.2.1. Analysis of the Acoustic Map

The study involved an analysis of the acoustic map of the city of Olsztyn [93]. The preparation of the acoustic map and disclosure of study results to residents is stipulated by the provisions of the Act from 27 April 2001, Environmental Protection Law, Journal of Laws of 2008, No. 25, item 150 [39]. Such an obligation results from the implementation of Directive 2002/49/EC [40]. The main objective of the implementation of the acoustic map is to obtain up-to-date information on the acoustic state of the environment with consideration of demographic data on the method of land development and use, and therefore “to create the basis for the development of Community measures to reduce noise from major sources, in particular from road rolling stock [93]”. The indicators for the implementation of the long-term anti-noise policy were introduced into Polish legislation by the ordinance of the Minister of the Environment of 14 June 2007 on permissible noise levels in the environment [94]. These are:
  • long-term average A-sound level expressed in decibels (dBA), determined during all days of the year, with consideration of the time of day, time of evening, and time of night, designated in the Act as LDEN,
  • long-term average A-weighted sound level expressed in decibels (dBA), determined during all nights of the year, designated in the Environmental Protection Law as LN.
The coefficient LDEN was adopted for the tests according to the assumptions of the acoustic map of Olsztyn. It was calculated as follows:
L DEN   =   10 lg   [ 12 24   10 0.1 L D + 4 24 10 0.1 ( L E + 5 )   +   8 24 10 0.1 ( L N + 10 ) ]
where:
LDEN—is the long-run A-weighted average sound level in decibels (dBA), determined during all days of the year, with consideration of the time of day (time period from 6.00 a.m. to 6.00 p.m.), time of the evening (time period from 6.00 p.m. to 10.00 p.m.), and time of night (time period from 10.00 p.m. to 6.00 a.m.).
LD—is the long-run A-weighted average sound level in decibels (dBA), determined during all times of the day in the year (time period from 6.00 a.m. to 6.00 p.m.),
LE—is the long-run average A-sound level in decibels (dBA), determined at all times of the evening in the year (time period from 6.00 p.m. to 10.00 p.m.),
LN—is the long-term average A-weighted sound level expressed in decibels (dBA), determined during all seasons of the year (understood as time period from 10.00 p.m. to 6.00 a.m.).
Indicator LDEN was calculated based on long-term measurements of average noise levels. The measurements were conducted 4 m above ground.

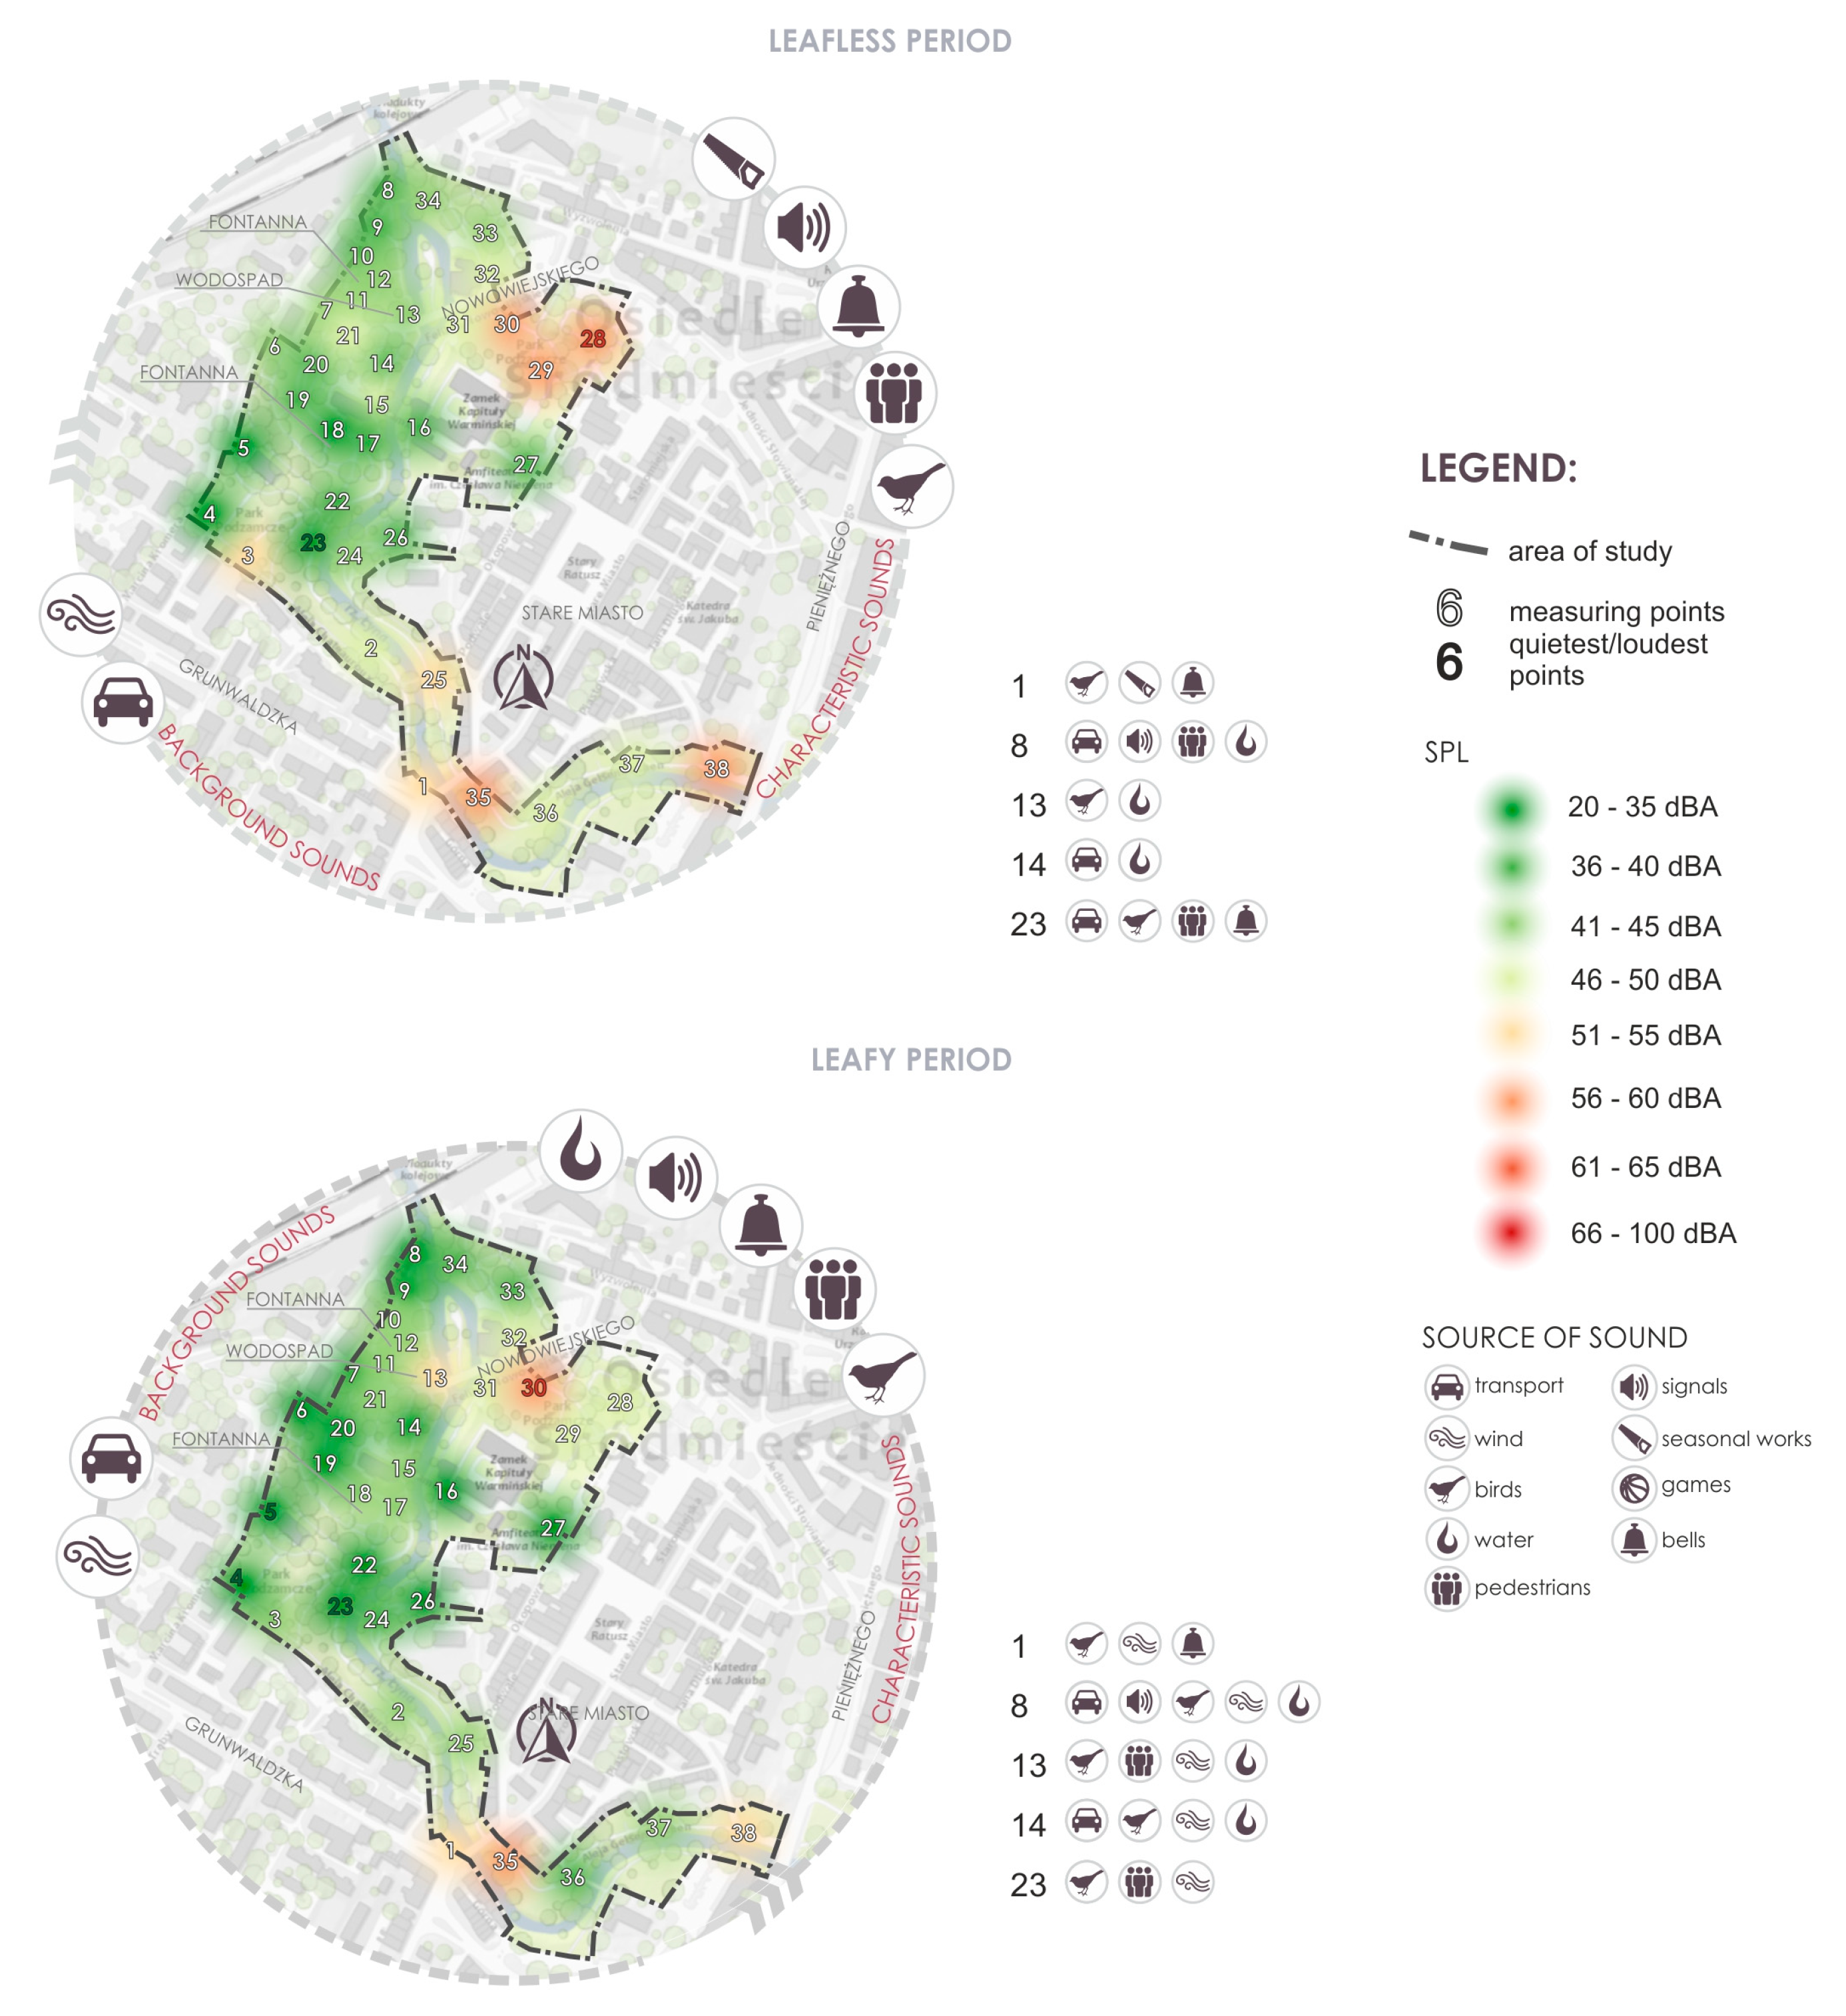
3.2.2. Test I. Evaluation of the Soundscape of Parks by the Authors in Selected Points in Terms of SPL (a) and Types of Characteristic Sounds (b) in Leafy and Leafless Period

Test I/a. The analyses of SPL aimed at determining which places in the parks are most exposed to noise. The sound pressure levels (SPL) as A-weighted continuous equivalent sound level (LAeq) were measured in dBA values at nodal points of communication routes and in characteristic places. To achieve reliable results, three measurements were carried out at each place and then averaged. Measurements were taken 1.2 m above the ground (reflecting the fact that park users do not only walk but also sit in the park, and that many park users are children). The intervals between the three measurements lasted 60 s. A Beha Amprobe 93517D sound level meter was used for the measurement. The results are presented in the form of a chart and in tables (Annex 2).
The obtained data revealed the quietest and loudest places, as well as the average SPL, for the entire park in leafy and leafless periods. The test procedure also aimed at determining which places in the park are most exposed to noise. Selected measurement points (Table 2) were designated throughout the park in characteristic places, from the park’s borders to its interior, to analyze the entire park space, including the interiors used by residents for a longer period of the day. In this way, the study was not limited to lanes and access roads, particularly those bordering on transport areas, but also included places of where users stayed longer in public spaces.
The analyses performed in two periods aimed at answering the question of whether and to what extent vegetation in a leafless and leafy state reduces noise in the park. The paired t-test was applied to estimate the occurrence of a statistically significant difference between average noise levels during leafless and leafy periods in selected parks (Annex 3).
Test I/b. Analysis of selected characteristic points (e.g., bridges, park entrances/exits, fountains, playgrounds, etc.) in each park in terms of sound structure aimed at specifying characteristic sounds as well as background sounds in given points, and evaluating their quality.
The results of Test I/a and Test I/b obtained in the selected points of a given park in a leafless and leafy state were collected in tables and presented in maps. In the maps, SPL is depicted by color, and the main characteristic sounds and background sounds are depicted in the form of pictograms.

3.2.3. Test II. Interviews with Park Users. Mental Maps

The concept of a mental map, i.e., a subjective image of geographical space in the human mind, unique for each observer, is based on individual experience and information level (mental landscape), and is well established in geography, behavioral sciences, and psychology. Many researchers emphasize that the spatial preferences of the population and related behaviors depend not so much on the objective characteristics of the environment as on their transformed subjective reflection in the mind of every human being (e.g., [95,96]). The mental map is unique for each person, because each person has an individual set of personal experiences and level of information. At the same time, however, certain similarities can be observed between the tastes of people in different groups.
Because public participation is a key element of soundscape design, the subjective opinion of park users was taken into account during the research. The purpose of the survey was to complement Test I, and its aim was to indicate how park users perceive the space of parks depending on noise level.
The study in the form of a walk and interview with respondents in the parks was conducted in the leafy period, on 22 May (Park Jakubowo), 23 May (Kusocińskiego Park), and 24 May (Park Podzamcze) 2018. In each park, 20 participants joined the study. The participants were aged 18–75. All of them were living in Olsztyn during that period. The respondents were selected randomly from among people walking in the park, and before starting the interview they were asked about the frequency of staying in the park. People participating in activities in the park at least once a week were selected for the interview. This criterion allowed for the assumption that they know the structure of the park. The study consisted of mapping areas which, according to the participants, are characterized by positive sounds, and places where unwanted sounds occur (noise). Each participant had the task of indicating these areas on the map. The route ran through the points previously marked for Test I.
The obtained data were digitized and then presented in the graphical form of a mental map.

3.2.4. Guidelines and Recommendations for the Landscape Design and Management of the Analyzed Parks

Based on the information obtained during the research, a set of guidelines and recommendations was developed aimed at the improvement of the quality of the sound environment of parks, including guidelines for plantings, spatial planning, and management.

4. Results

4.1. Structural and Spatial Analysis of the Park Surroundings in Relation to Noise Sources

The analyzed parks are located in the city center (Figure 3) and are therefore adjacent to transport zones (main city roads, railways, trams), service and residential buildings, public utility buildings, and urban infrastructure. Due to such locations, users of the parks (residents) can experience noise of varying intensity, particularly near the zones bordering roads.
The analysis of the acoustic map (parts for selected areas) with consideration of function showed the highest noise intensity caused by main roads right next to the park boundaries.
In the case of the Jabubowo Park (No. 1), this is Wojska Polskiego Street (eastern border of the park). In the case of the Podzamcze park (No. 2), this is Mochnackiego Street and Grunwaldzka Street (southern border of the park), Nowowiejskiego Street/Maria Konopnickiej Street (northern border of the park), and Pieniężnego street (eastern border of the park). In the case of the Kusocińskiego Park (No. 3), this is Dworcowa Street (cuts the park in half), Piłsudskiego Street (southern border of the park), and Leonharda Street (eastern border of the park) (Figure 3).
The residential function has a slightly smaller impact as a source of noise than transport. In the Jakubowo Park, sounds generated by a housing estate are primarily associated with the south-eastern zone, and in the Podzamcze Park is are partially associated with two places, to the south and north-east, as in the Kusocińskiego Park. As for natural forms of greenery, only the Jakubowo Park includes a fragmented border with a dense urban forest complex (north-western part). Both the forest wall (next to the Jakubowo Park) and water reservoirs in all three parks generate positive sounds (Figure 3).

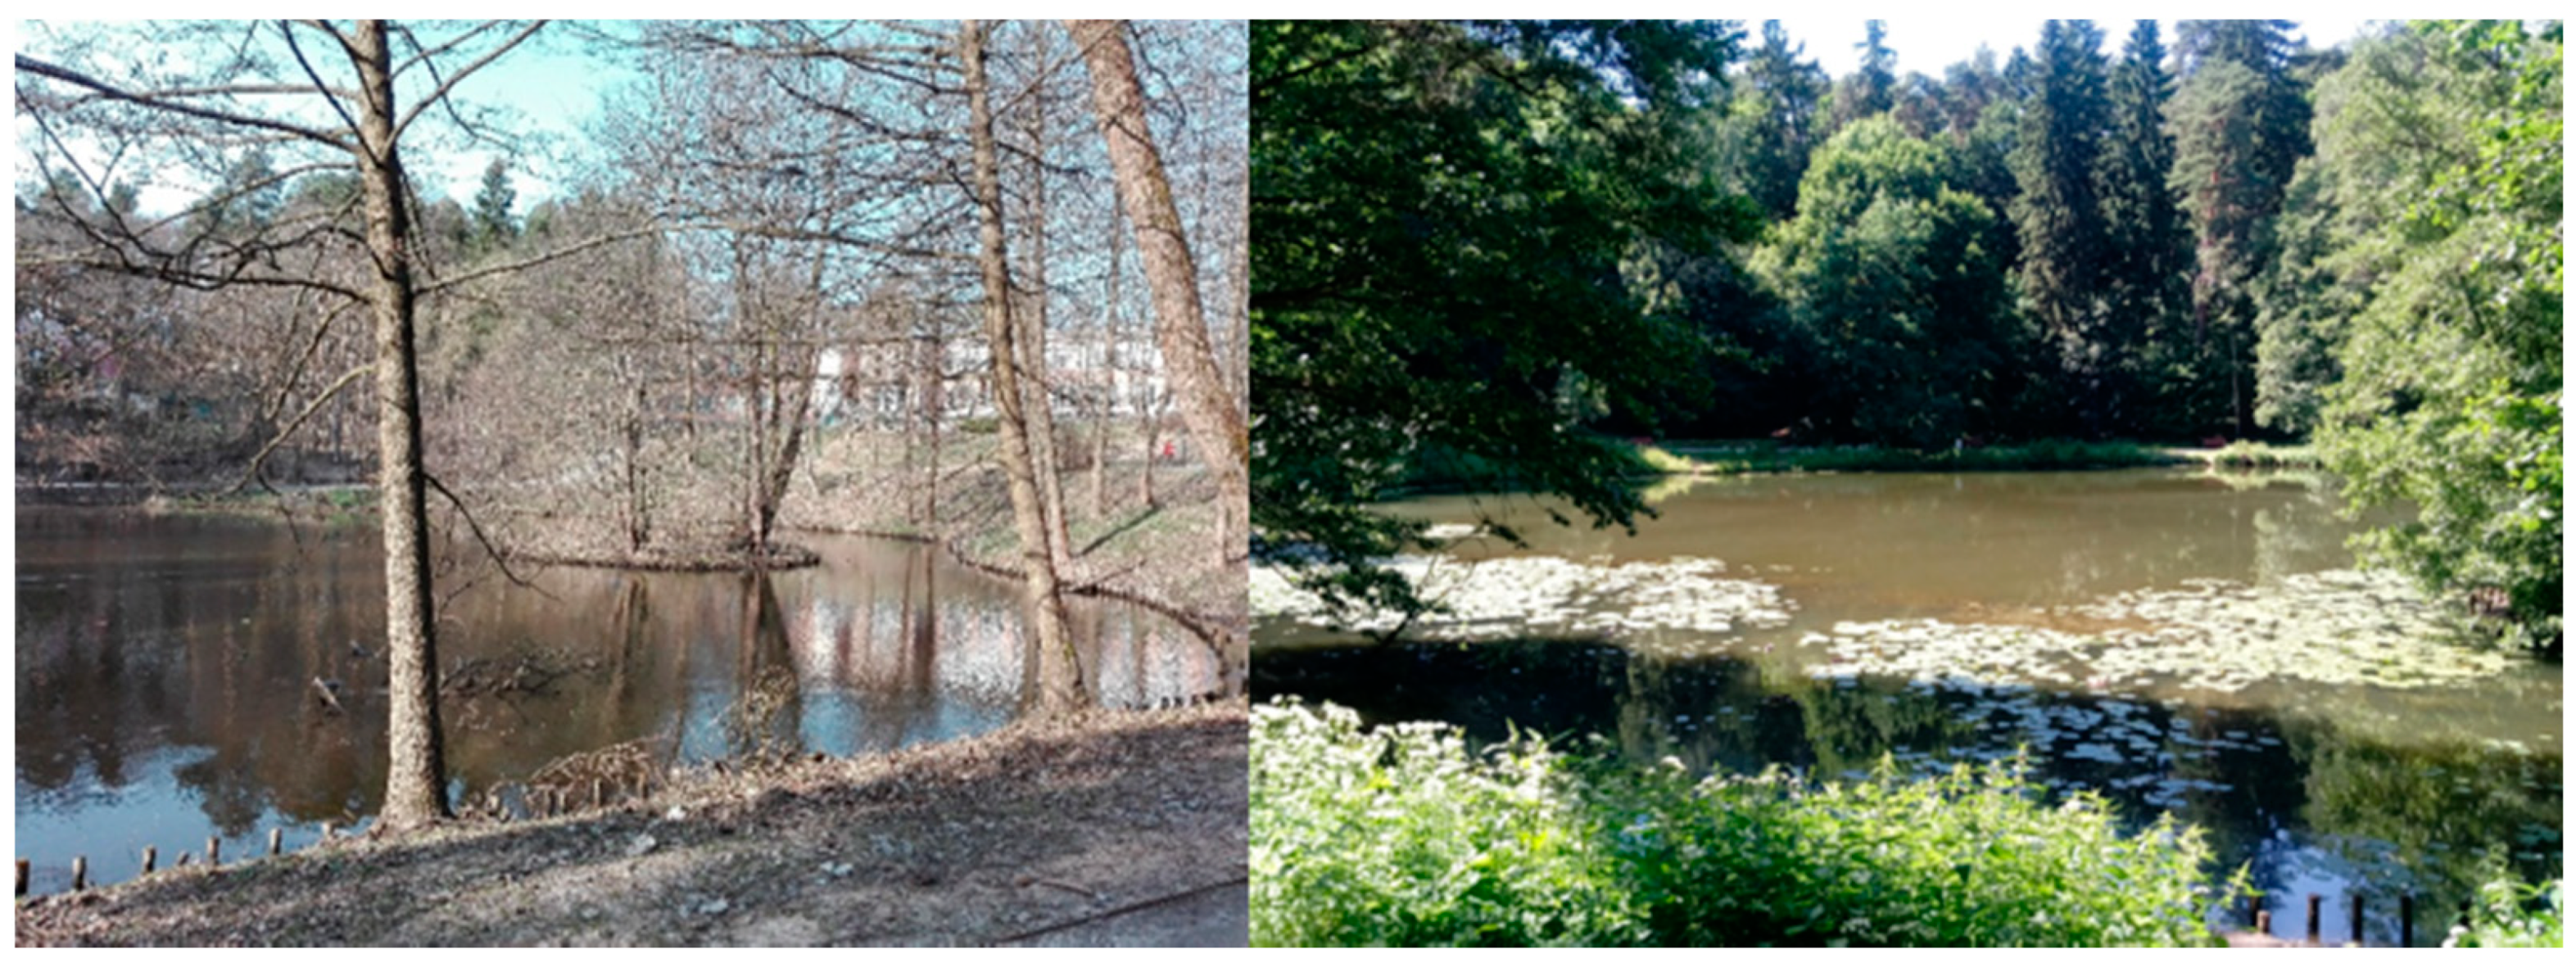
4.2. Analysis in the Jakubowo Park

4.2.1. Analysis of the Acoustic Map within the Boundaries of the Jakubowo Park

The analysis of the acoustic map [93] within the boundaries of the Jakubowo Park (Figure 4) shows the highest noise level occurring in a linear pattern along Wojska Polskiego Street. The noise level there oscillates between 66 dBA and 75 dBA at the eastern border of the park, and decreases towards the central part of the park to 56 dBA-60 dBA, and further towards the west. At the border with Radiowa Street, it reaches 51–55 dBA, and in the western part of the park and at the border with Parkowa Street, the value is the lowest, i.e., 46 dBA-50 dBA (Figure 4).

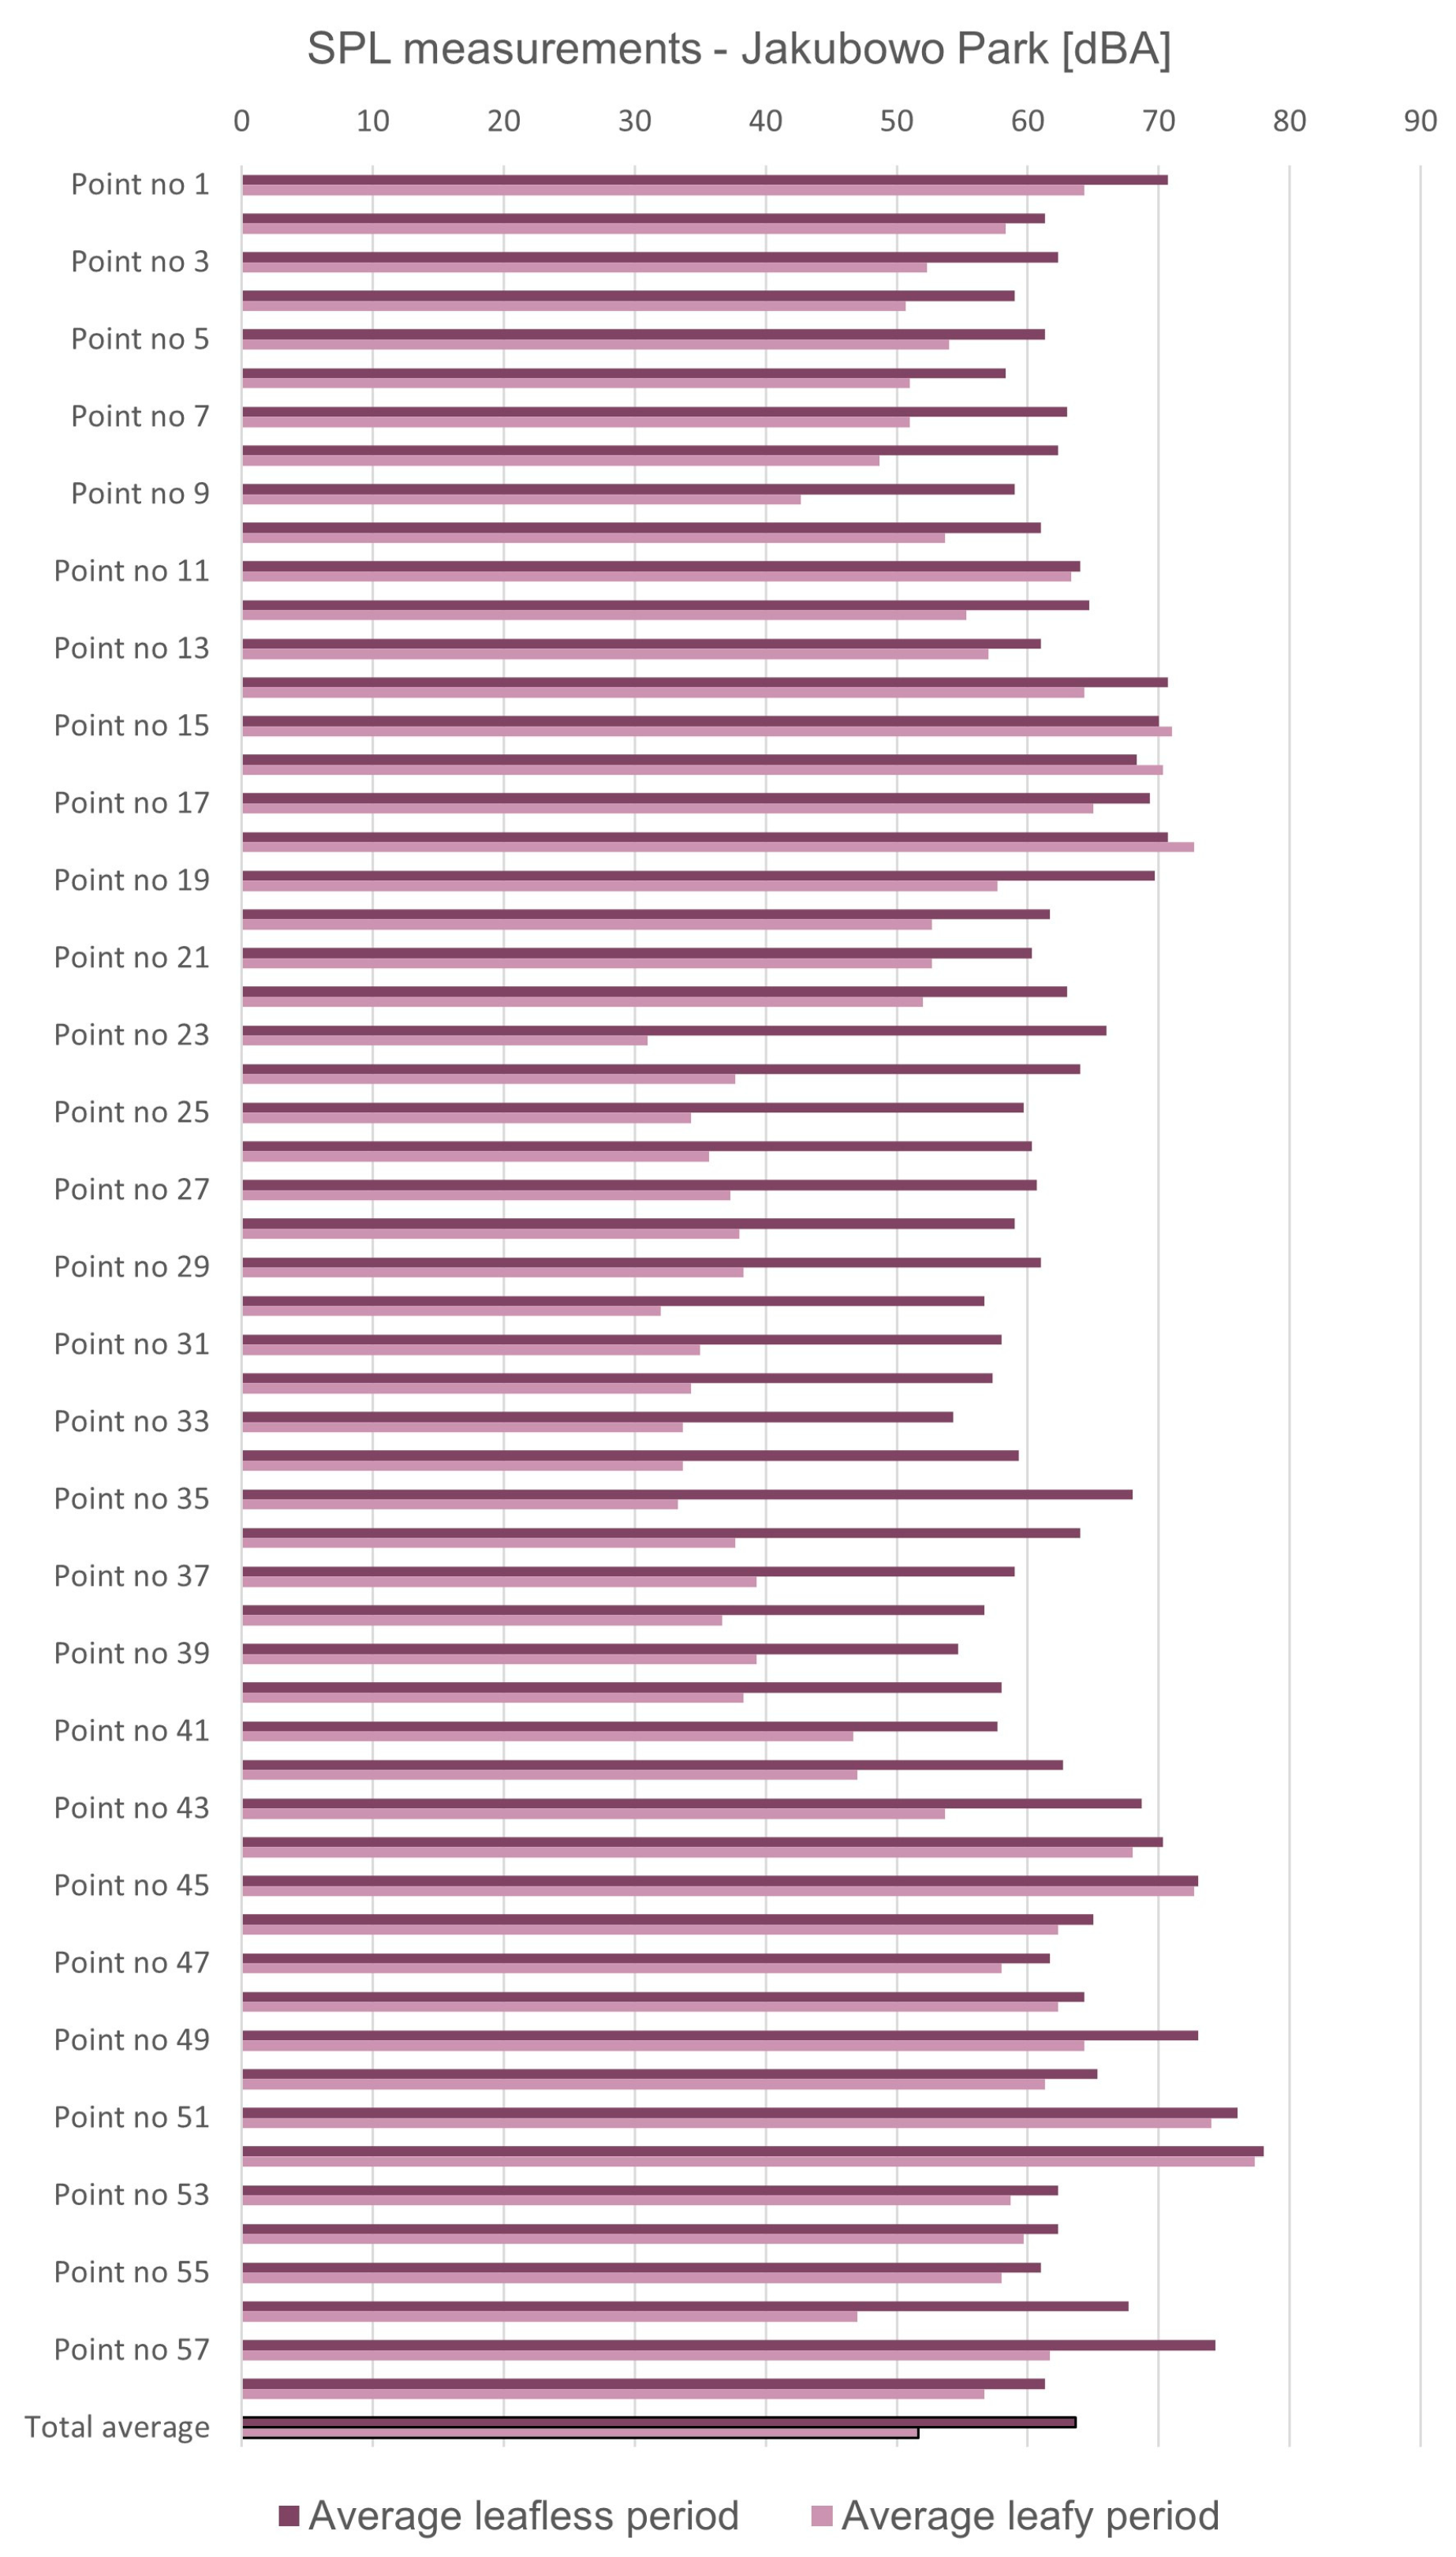
4.2.2. Test I. Results of Evaluation of SPL Measurements and Characteristic Sounds in the Jakubowo Park

For Test I/a, 58 points were selected for evaluation. Point 32 is perceived as the quietest in the leafless period, and point 52 as the loudest. In the leafy period, point 23 is the quietest, and point 52 is the loudest. Noise generated by car traffic in the leafless period is noticeable along the line from south to north (on the border with Wojska Polskiego St.) in points 14–17, 1, 19, 52, and 43–45, and in the leafy period in points 14–18, 52, 44, and 45. In the leafy period, a reduction in the noise level in points 23–37 is also observed, accounting for the largest difference between the leafless and leafy period (Figure 5). SPL measurements are provided in Figure 6.
For Test I/b, 4 points (5, 19, 23, and 24) were selected for the analysis in terms of sound structure (Figure 5). The comparison of the leafy and leafless periods shows that transportation is the dominant source of noise. Leafy period analyses indicate that noise levels have decreased along the western border of the study area. In both cases, the western part behind the slope is the quietest area in the park. The main source of noise is traffic that surrounds the park mostly from the east, near Wojska Polskiego Street. In Test I/b, this type of sound affected point No. 19 in the leafless period. The example of point 23 shows a significant difference in the change of perception of sounds in the leafless state due to ground works carried out in this part of the park and the resulting occurrence of this type of sound. Positive sounds are generated by trees (leaves, birdsongs; points 9, 23, 24) and water (point 5), particularly in the leafy period. The park is often visited by residents, but also by patients from a nearby hospital, who walk in the park along the paths from the east, resulting in reporting anthropological sounds (pedestrians, point 19, mostly in the leafy period).

Result of the Paired Samples t-test in the Jakubowo Park

With the assumed significance level (α = 0.05), the value p < 0.00001 was obtained as a result of the performed paired-samples t-test. A significant increase in the noise level in the leafless period was observed (M = 63.67, SD = 5.44) in comparison to the leafy period (M = 51.65, SD = 12.81), t(57) = −9.54, p < 0.00001. The result is significant at p < 0.05. (Annex 3).

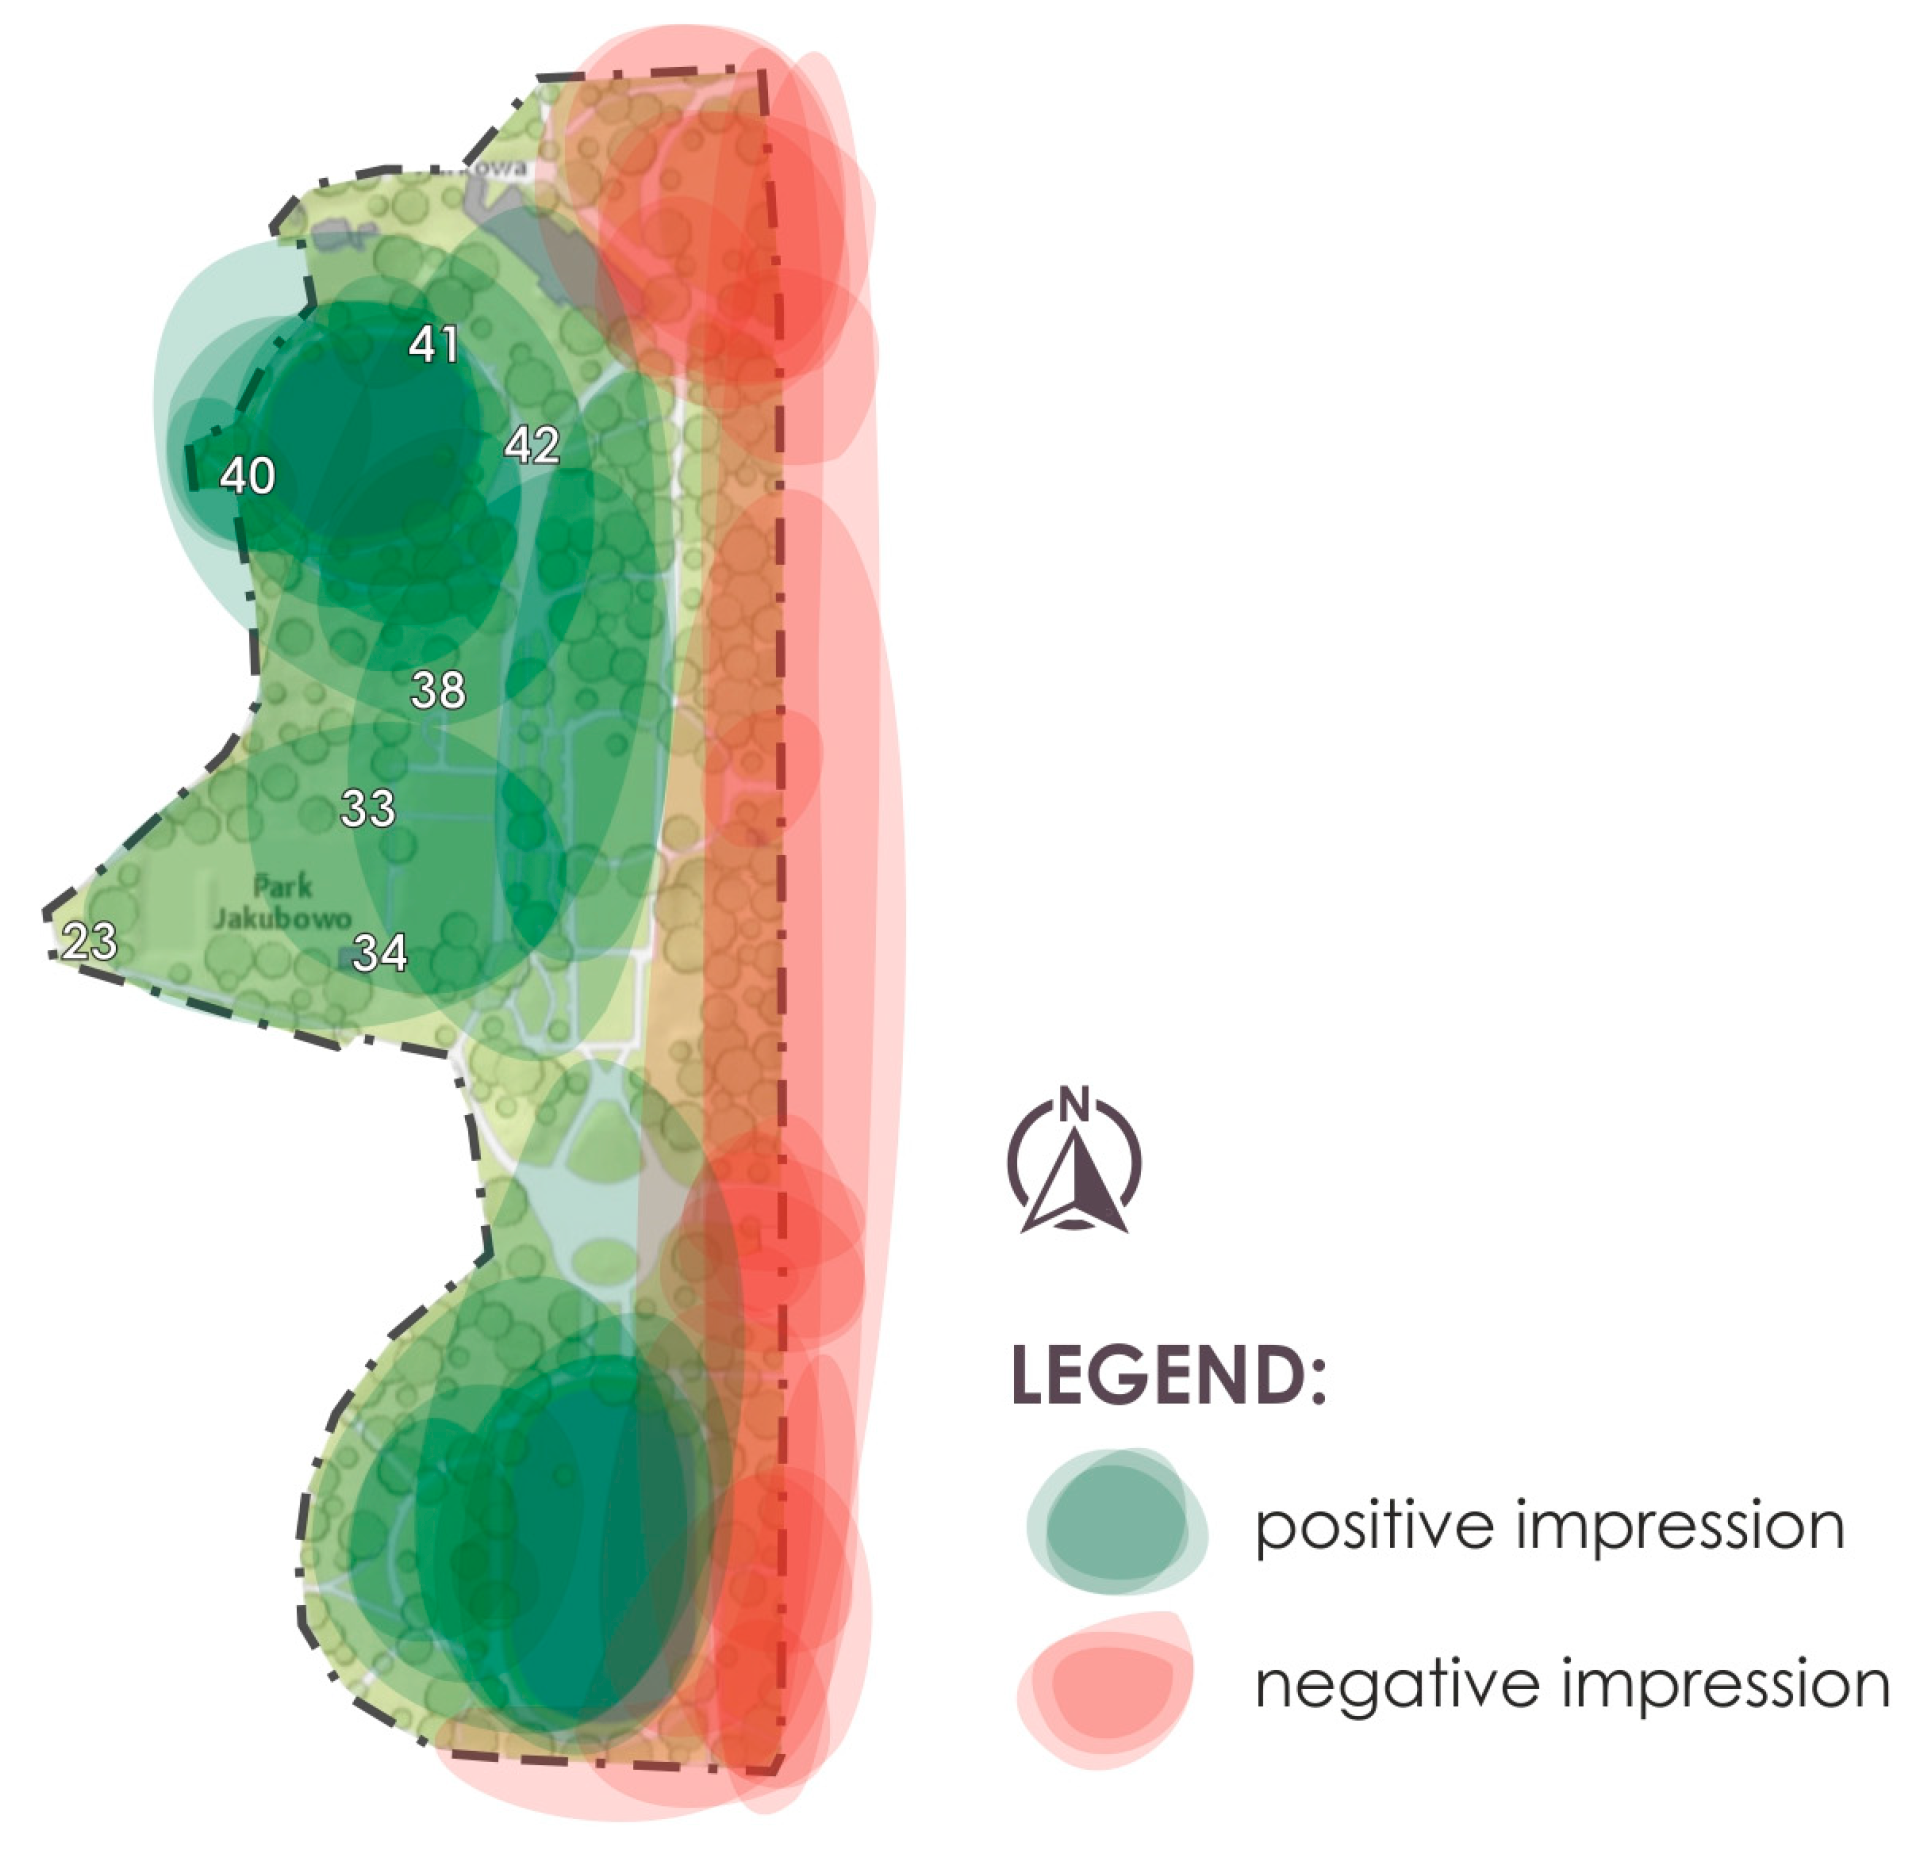
4.2.3. Test II. Interview with Park Users in the Jakubowo Park

The results of the interview with park users are depicted in a mental map (Figure 7). The study proves that people spending time in the Jakubowo Park recognize the area of the eastern part of the park bordering on Wojska Polskiego St. as the noisiest and most unpleasant. The western and central parts of the park proved to be the highest rated area in terms of sound quality (points 23, 33, 34, 38, 40). Positive rating was given to areas around water reservoirs (points 40–42). In the case of a positive assessment, participants referred to two aspects, namely the positive perception of water sounds and rustling of leaves (in tree stands, especially those near the water reservoir).

4.3. Analysis in the Kusocińskiego Park

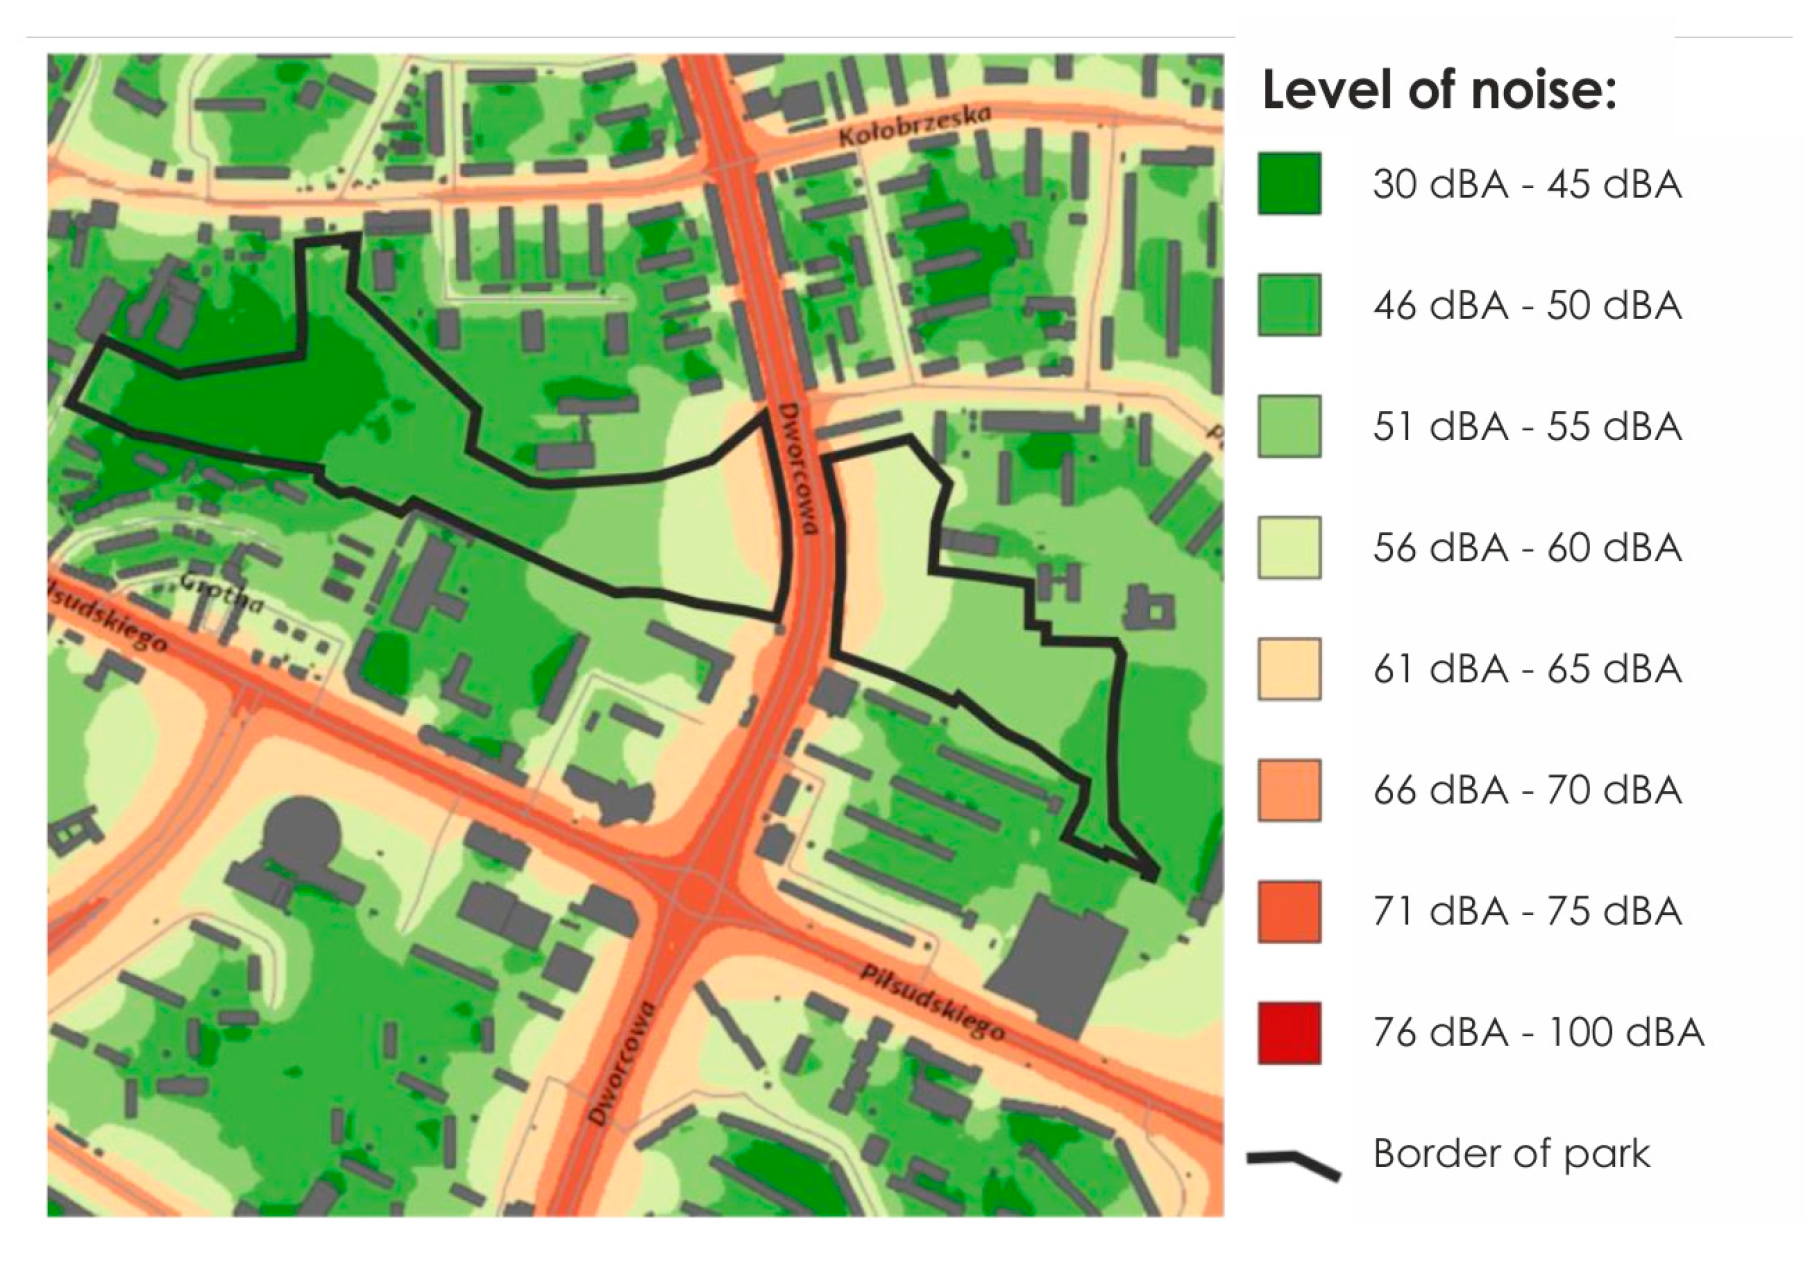
4.3.1. Analysis of the Acoustic Map within the Boundaries of the Kusocińskiego Park

The analysis of the acoustic map [93] (Figure 8) shows the highest noise level at Dworcowa Street (71 dBA–75 dBA). On both sides of the border with the street, the noise decreases (66 dBA–70 dBA), declining further to the east and west (61 dBA–65 dBA). From approximately the middle of both parts of the park to the west and east, the values are between 51 dBA–55 dBA. At the eastern border of the park, the values drop to 46 dBA–50 dBA, while the quietest area is located right at the western border of the park, with a noise level of 20 dBA–45 dBA (Figure 8).

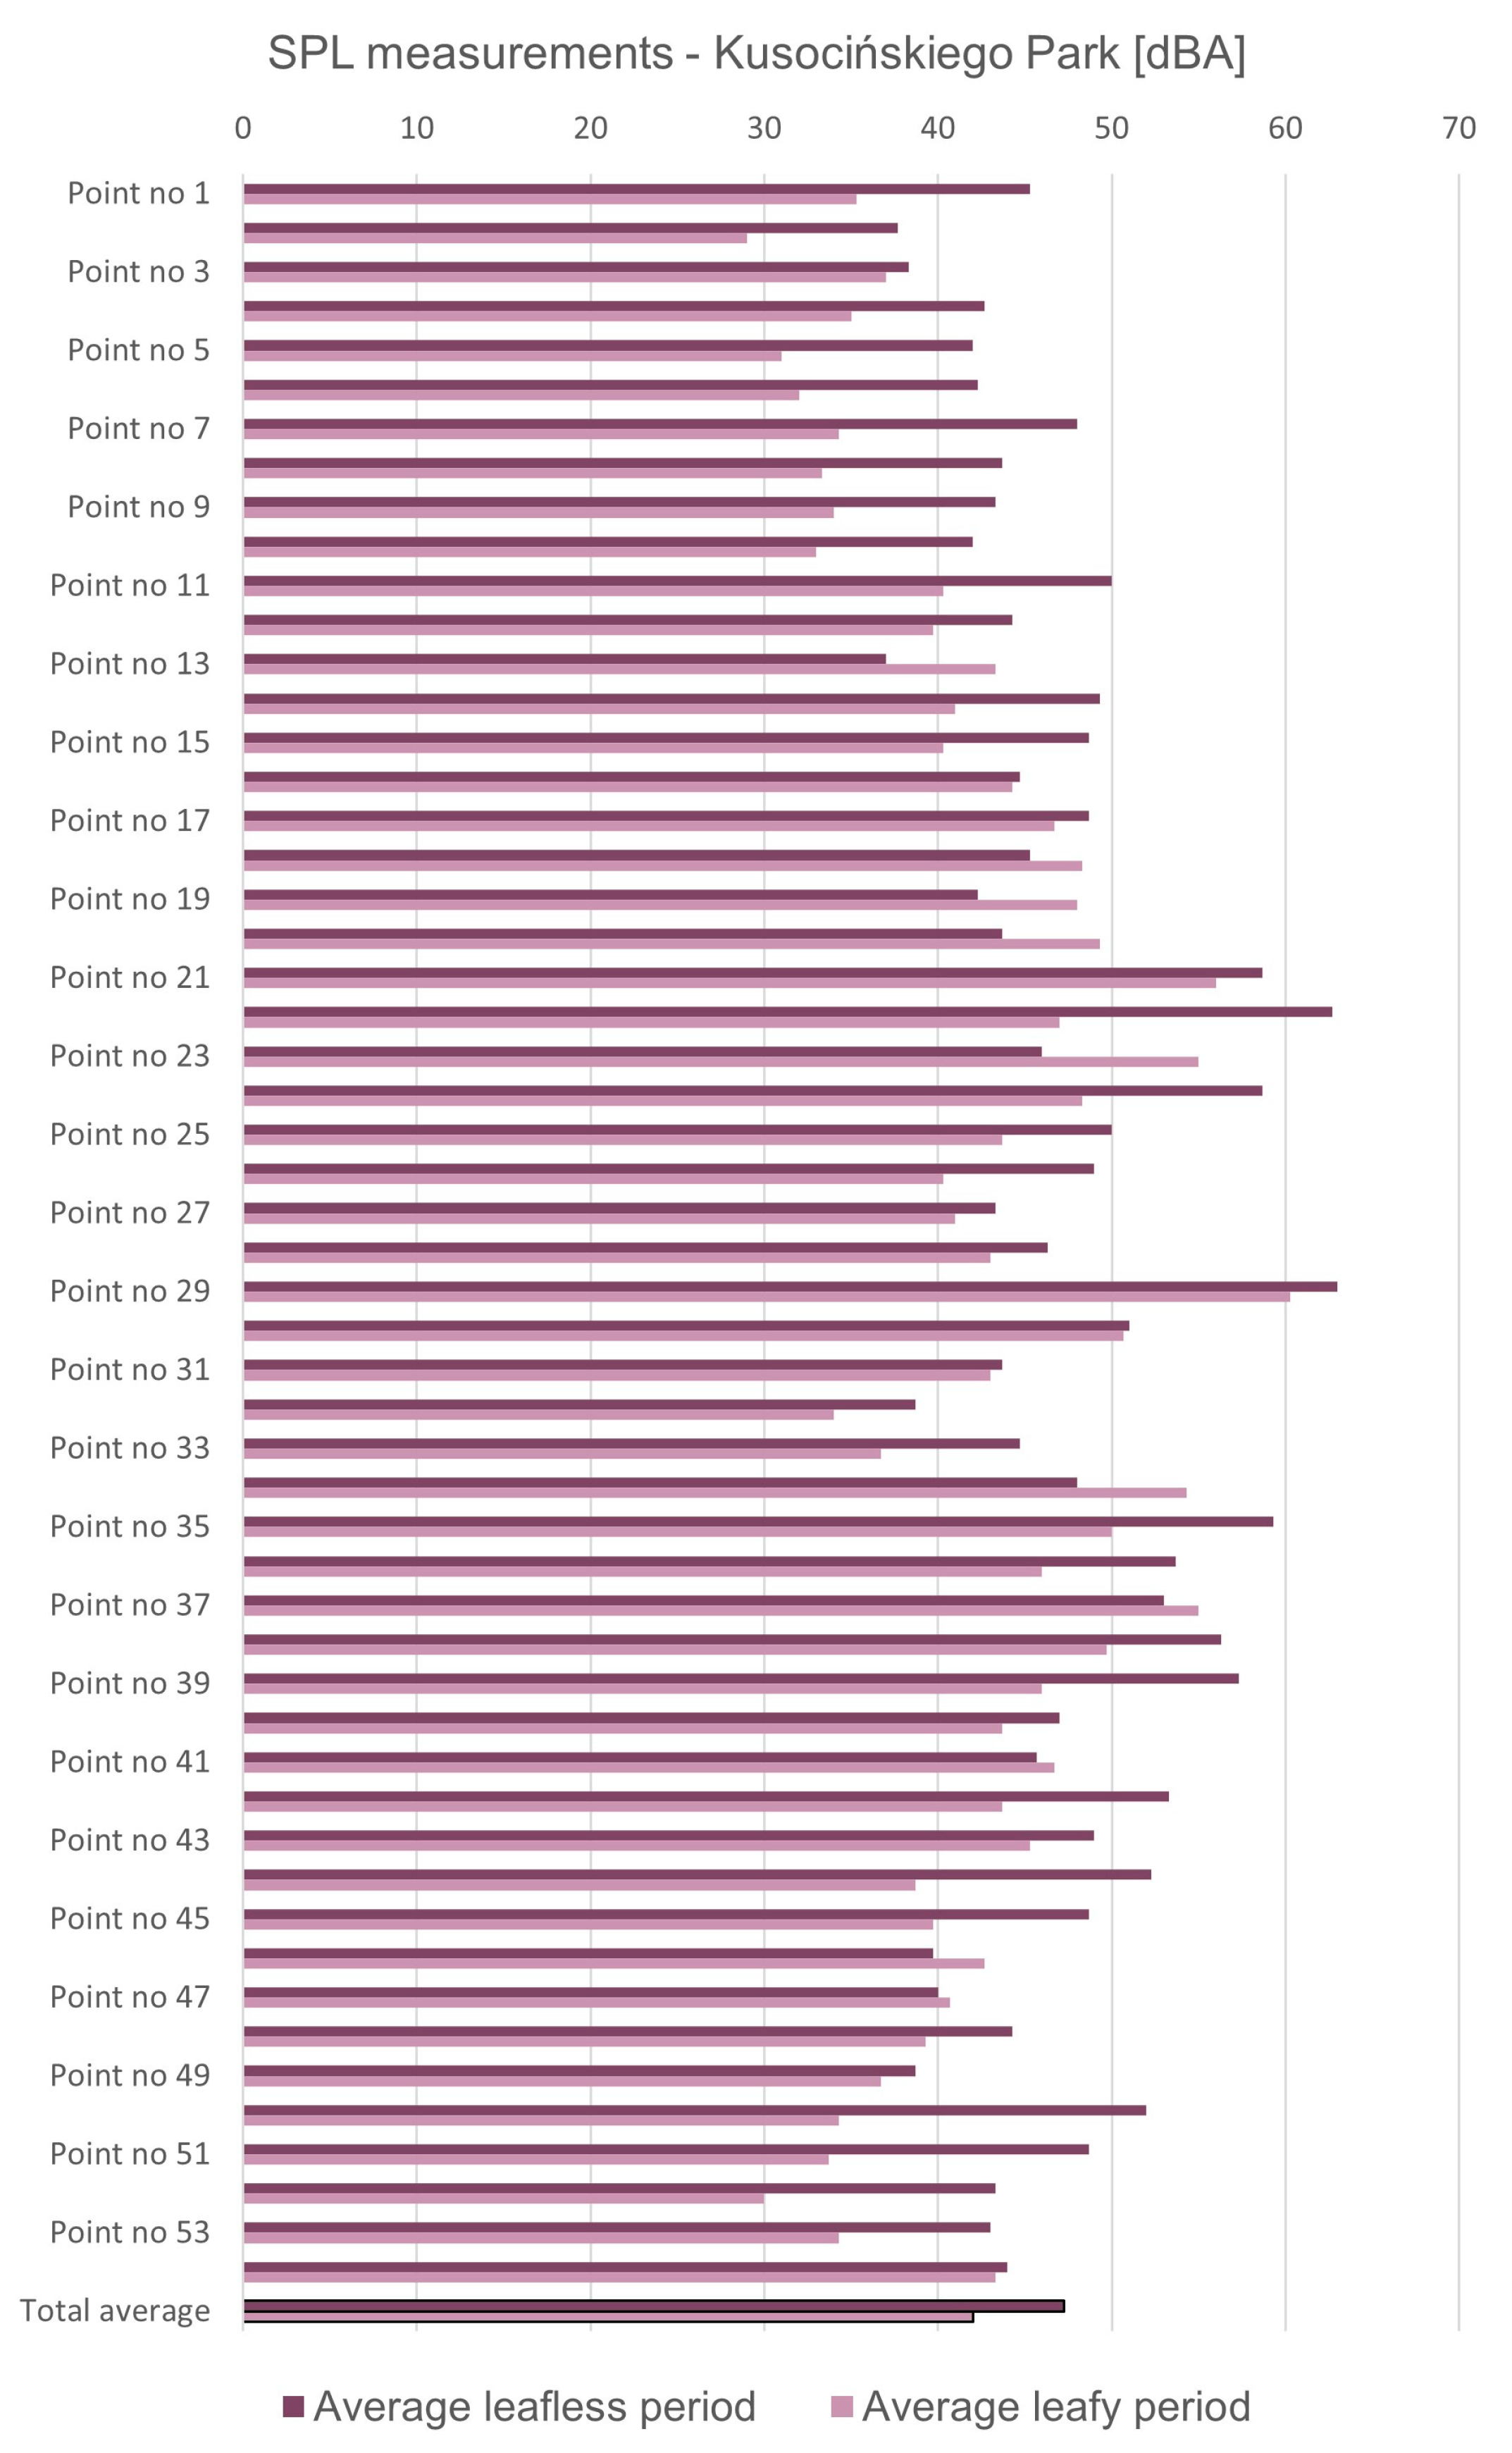
4.3.2. Test I. Results of Evaluation of SPL Measurements and Characteristic Sounds in the Kusocińskiego Park

In the Kusocińskiego Park, 54 points were selected for Test I/a. The test shows that in the leafless period, point No. 13 is the quietest, and point No. 29 is the loudest. In the leafy period, point 2 is the quietest, and point 29 is the loudest. In addition to the points listed above, in the leafless period the loudest area was located in the center, at the place where Dworcowa Street divides the park into two parts (points 21, 22, 38, 39), and across the street at points 24, 35–37. In these places (except point 21), a reduction of noise level in the leafy period is perceived. Moreover, larger differences between noise levels perceived in the leafless and leafy period are observed in points 7, 50, 51, 45, 7, and 11 (Figure 9). SPL measurements are provided in Figure 10.
For Test I/b, 4 points were selected for the analysis in terms of sound structure (Figure 9). The characteristic sounds in both periods are sounds of pedestrians, cars, and birdsongs. Traffic is the main source of unpleasant sounds in both periods (negatively perceived sounds are car noise and traffic signals). Test I/b reveals that noise is primarily noticeable in point 27 in the center of the park. Positive sounds are generated by trees (leaves, birdsongs; point 15) and wind (point 8, 13, 15) in the leafy period, less in the leafless period. In the leafy period, a positive sound of water is generated by the fountain on the water reservoir (point 15). The park is often visited in the summer season due to its central location (educational, service, sports, and large residential housing estates nearby). Therefore, anthropological sounds were reported in the leafy period in points 13, 15, 21 (pedestrians and skaters).

Result of the Paired Samples t-test in the Kusocińskiego Park

Assuming the significance level (α = 0.05), the value of p < 0.00001 was obtained as a result of the dependent sample t-test.
The noise level significantly increased in the leafless period (M = 47.27, SD =6.29) compared to the leafy period (M = 42.00, SD = 7.27), t(53) = −6.24, p < 0.00001. The result is significant at p < 0.05 (Annex 3).

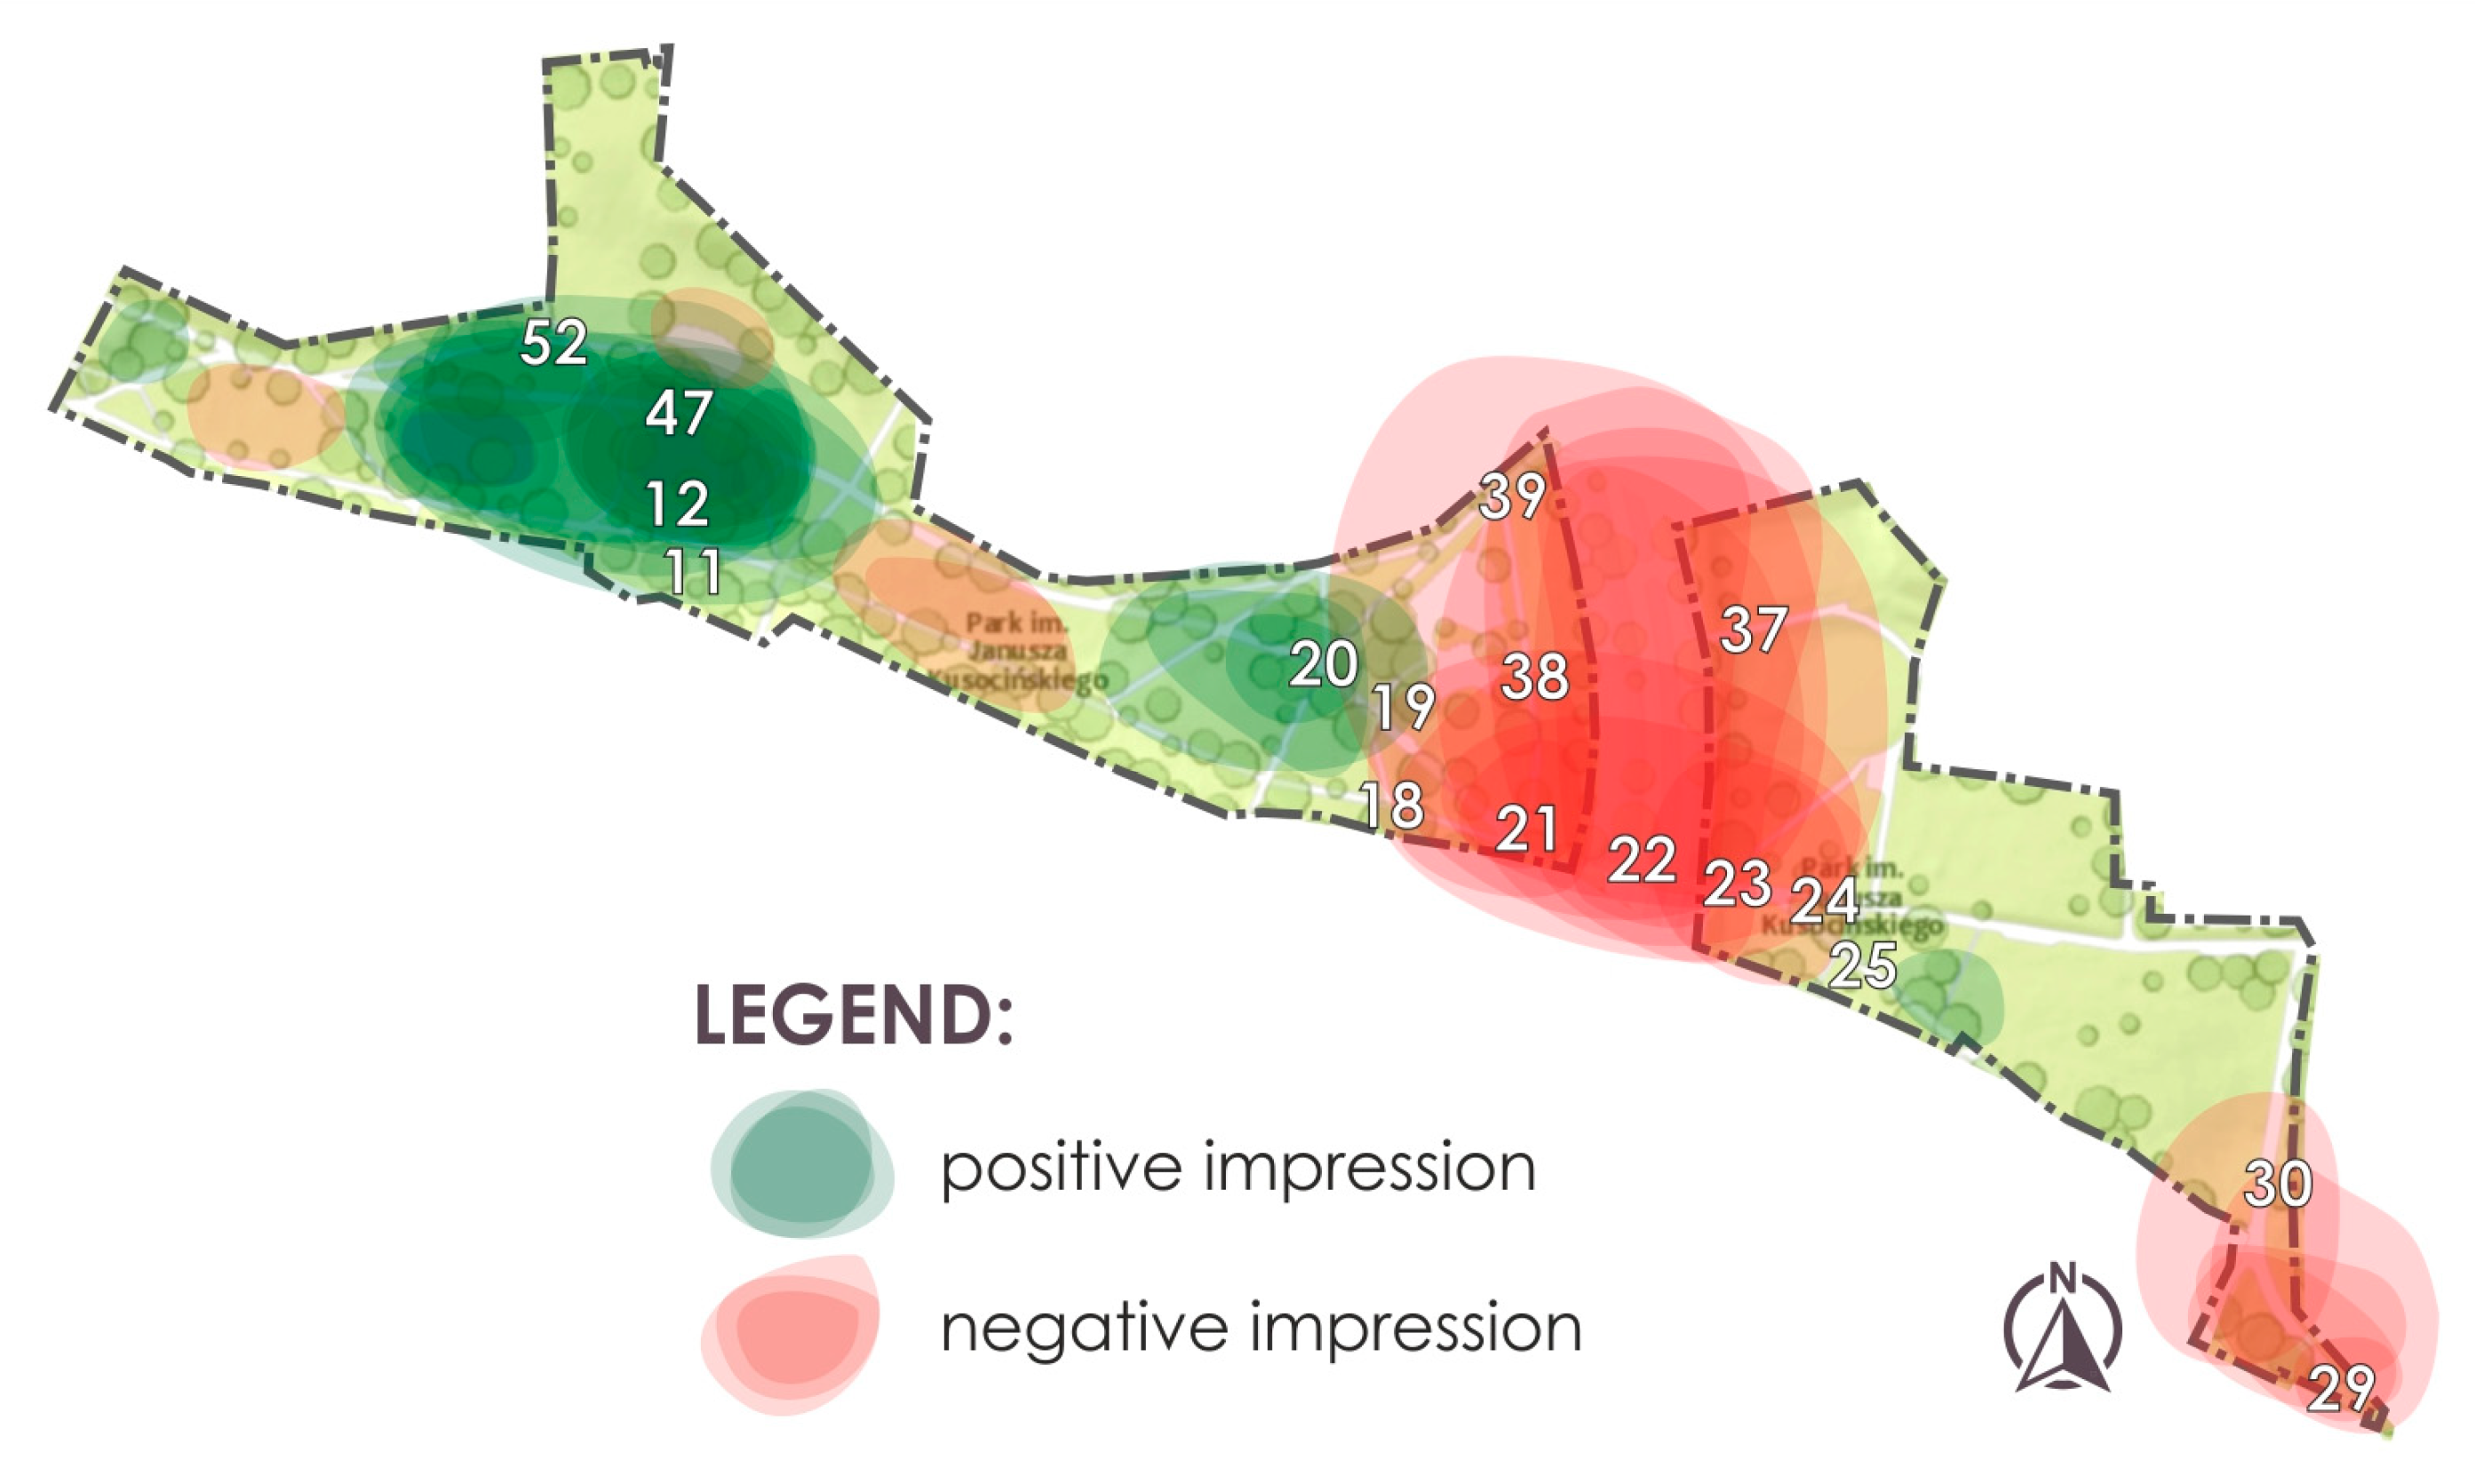
4.3.3. Test II. Interview with Park Users in the Kusocińskiego Park

Results of the interview with park users are depicted in a mental map (Figure 11). According to park users who participated in the study, the noisiest and most unpleasant place in the park is the area bordering on Dworcowa street (points 18–25, 37–39). The entrance from the side of sports center Aquasfera (points 29–30), as well as places of sports activities (sports field and skate park “Kusocin”) and playgrounds, were also negatively assessed (point 14).
The area near the water reservoir (point 15), and the place with a large area covered with high vegetation in the western part of the park (11, 12, 47, 52) were quiet places, free of noise, or characterized by positive sounds.

4.4. Analysis in the Podzamcze Park

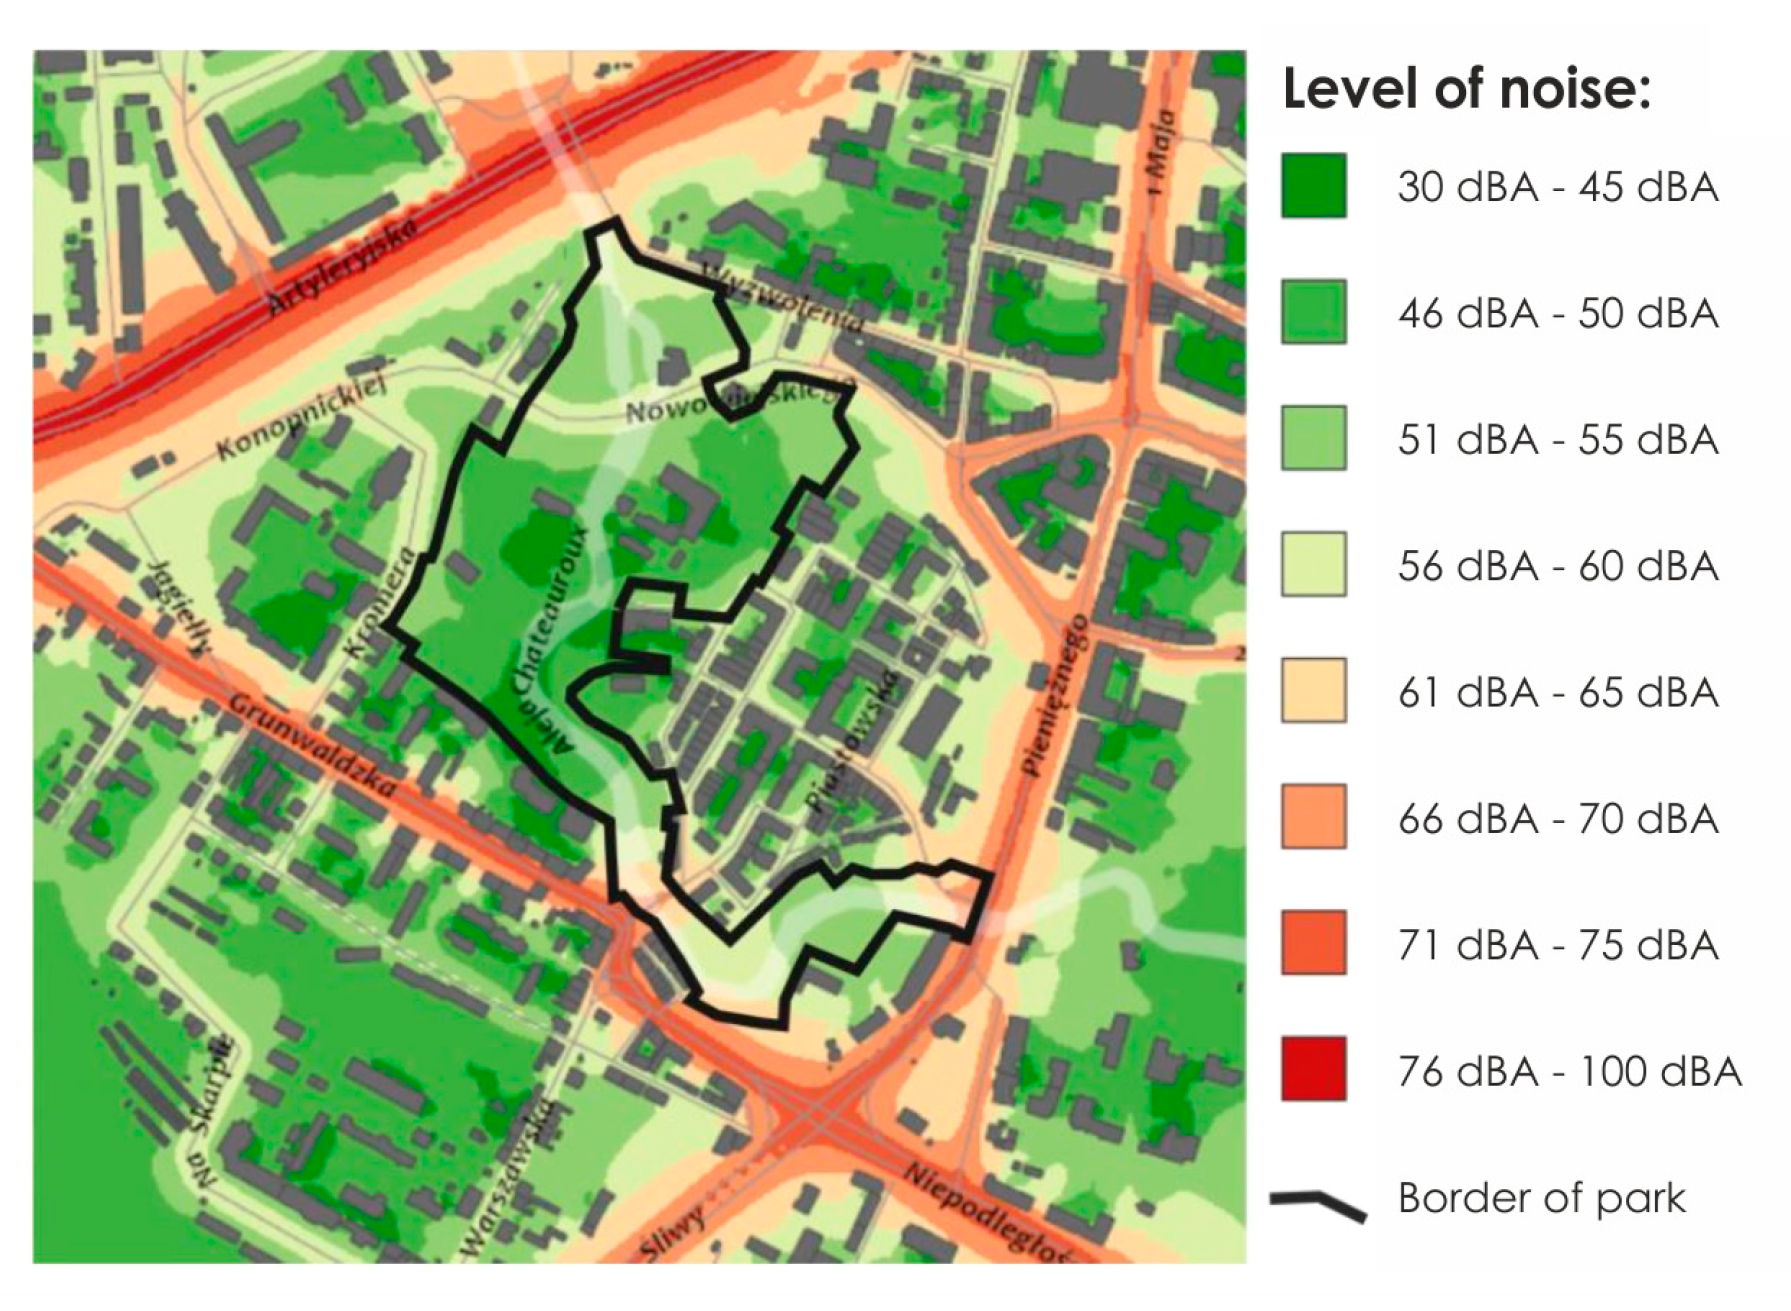
4.4.1. Analysis of the Acoustic Map within the Borders of the Podzamcze Park

The analysis of the acoustic map (Figure 12) shows the highest noise level in small parts of the park in the south-west at Pieniezny Street, and in the south at Grunwaldzka Street (66 dBA–70 dBA). In the middle of the park, especially along the Łyna River, where the vegetation is dense, the noise level is the lowest (in a range of 46 dBA–50 dBA and 30 dBA–45 dBA).

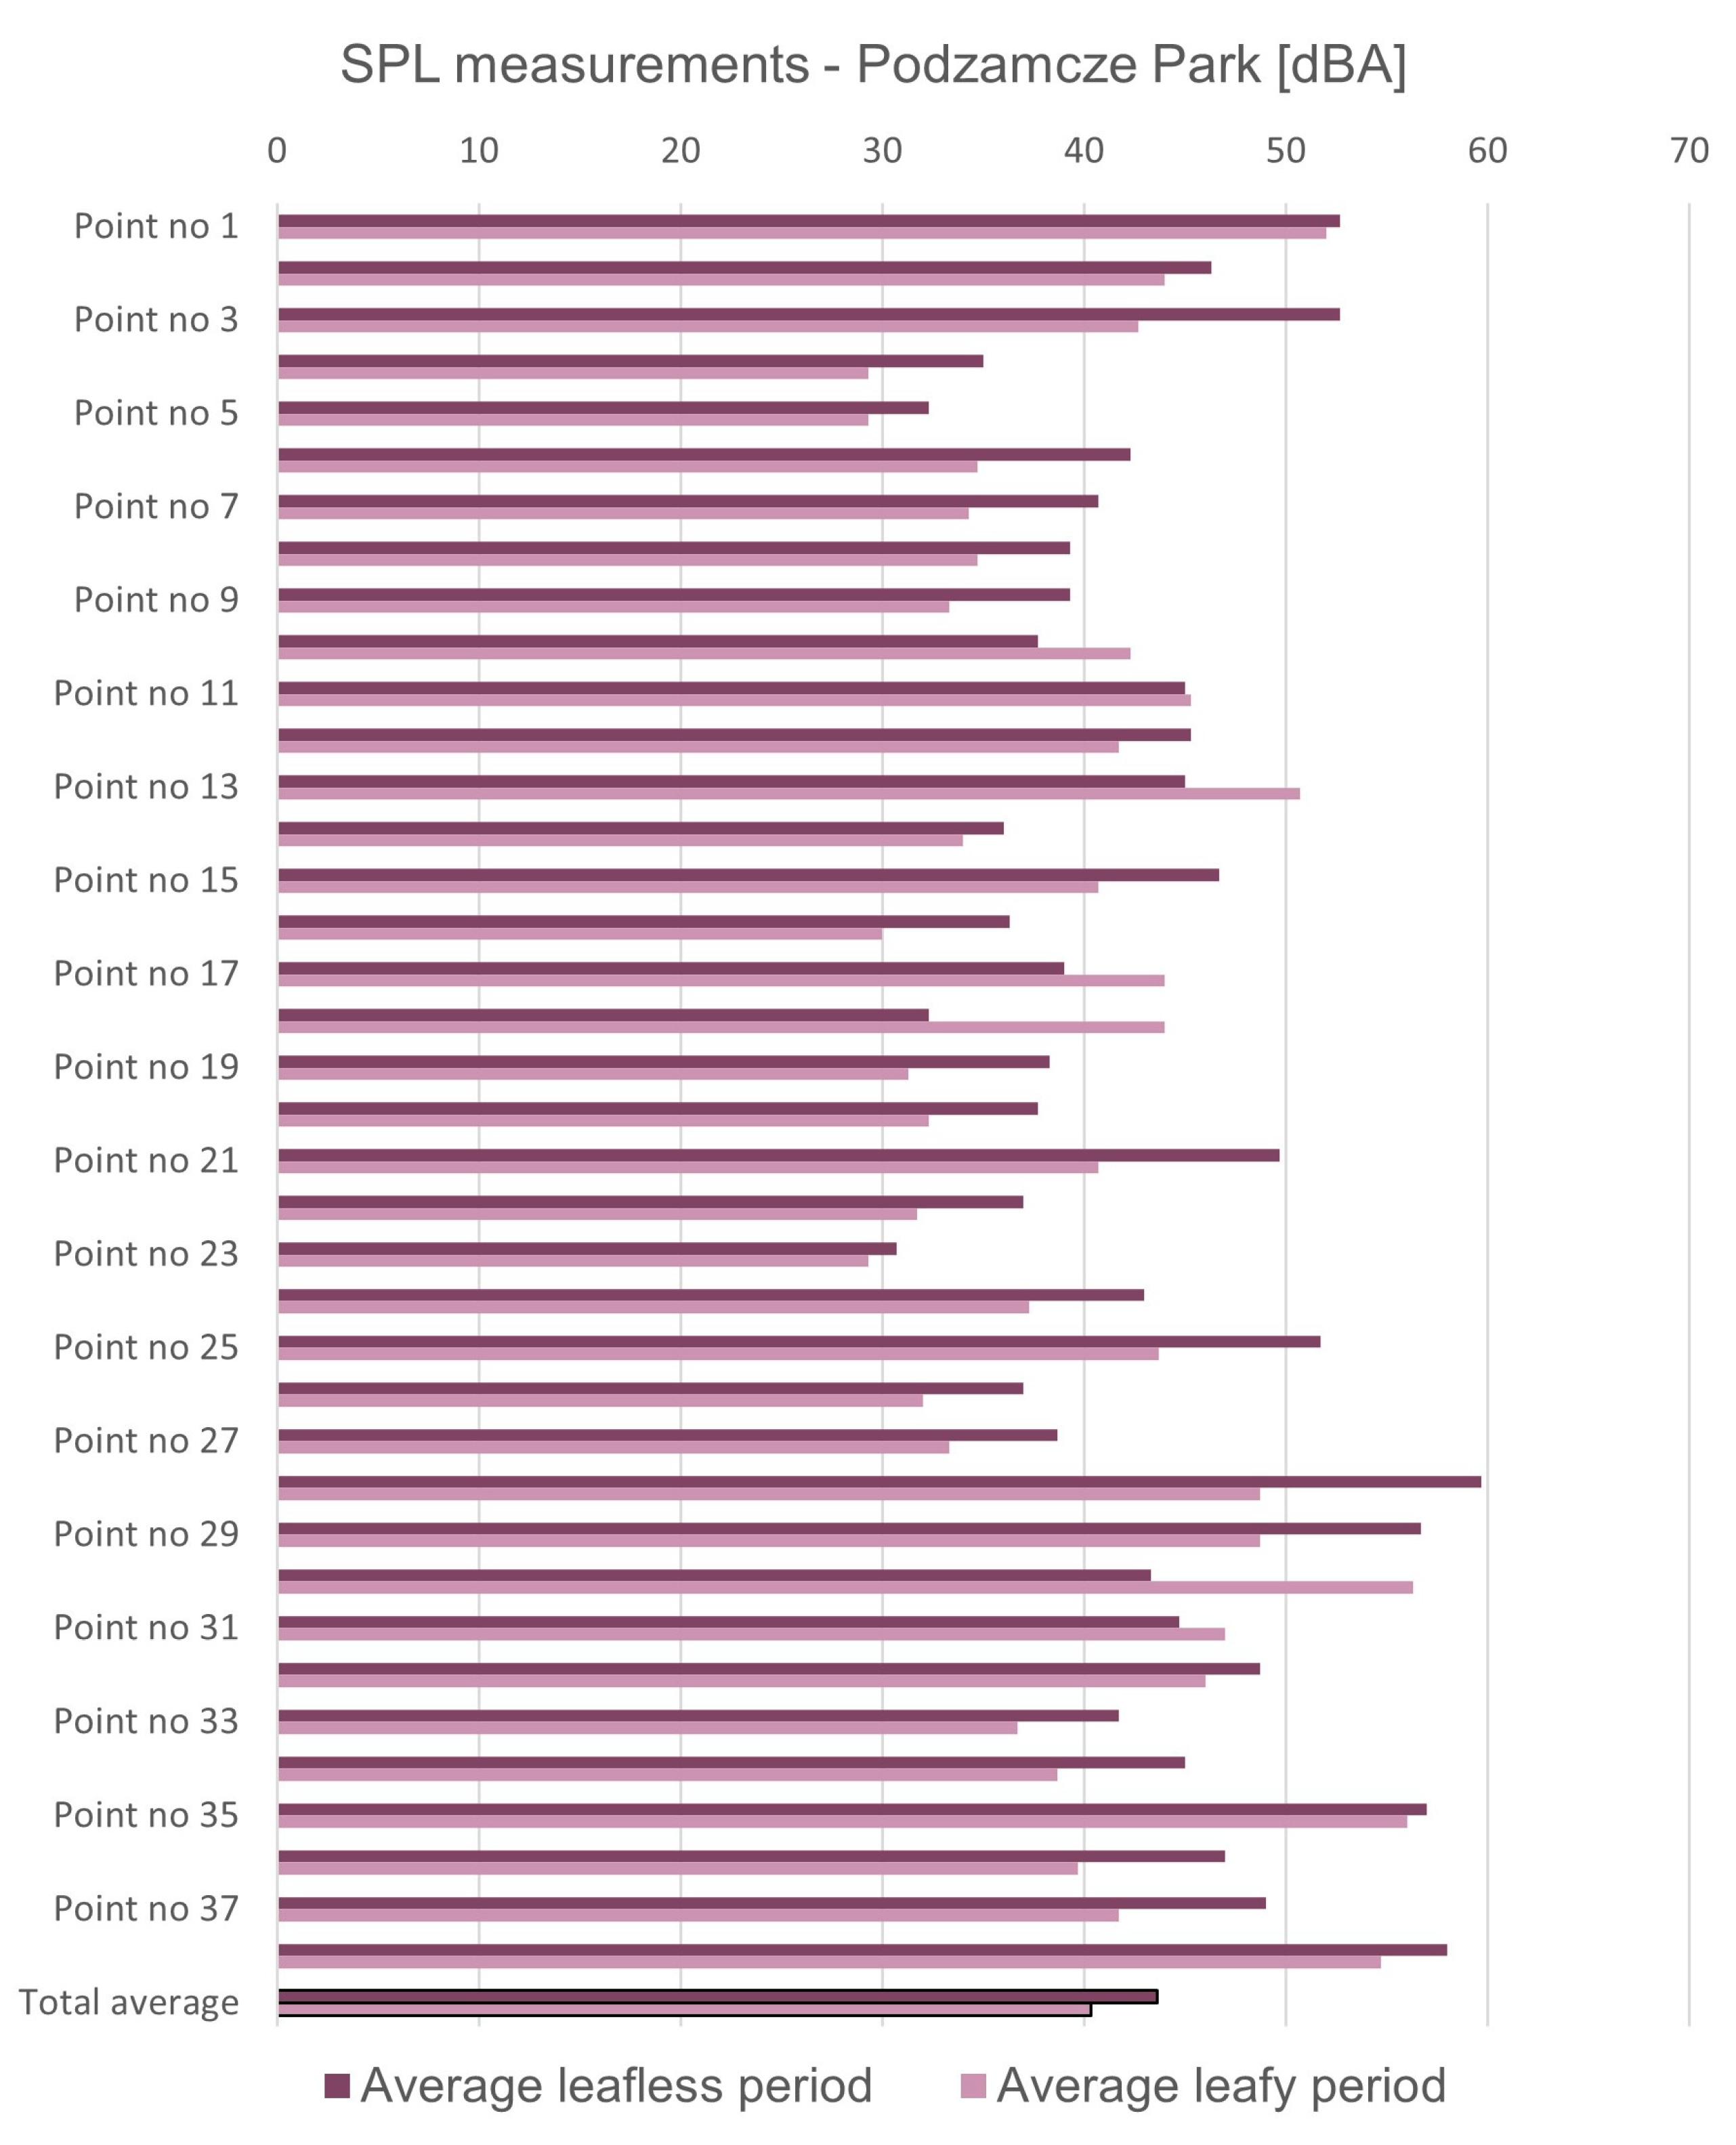
4.4.2. Test I. Results of Evaluation of SPL Measurements and Characteristic Sounds in the Podzamcze Park

In the Podzamcze Park, 38 measurement points were designated for Test I/a. In the leafless period, point 23 is the quietest, and point 28 is the loudest. In the leafy period, points 4, 5, and 23 are the quietest, and point 30 is the loudest. In the leafless period, the loudest area was located in the north-eastern (points 28–30) and south-eastern part of the park (points 35, 38). These places are near the largest road intersections in the city center and around the old town. In the leafy period in points 28 and 29, and 36, and 37, the perceived noise level decreased, while in point 30 it increased, and in point 35 it was almost at the same level. Larger differences between perceived noise levels in the leafless and leafy period are observed in points 3, 6, 21, 25, 28, 29. The analysis of both periods shows that in the leafless period, the loudest area was located near the car park at Nowowiejskiego Street (North-East), and near Grunwaldzka and Pieniężnego Streets. Results for the leafy period indicate a decrease in perceived noise levels throughout the park (Figure 13). SPL measurements are provided in Figure 14.
For test I/b, 5 points (1, 8, 13, 14, 23) were selected for the analysis in terms of sound structure (Figure 13). Characteristic sounds in both periods are sounds of pedestrians, cars, birdsongs, water, and church bells. Test I/b showed that noise is primarily noticeable in points 8 and 14 in both periods. Positive sounds are generated by trees (rustling of leaves) and birdsongs (points 1, 8, 13, 23) in both periods, and water (points 1, 8, 13, 14) in the leafy period, less in the leafless period. A positive sound of water is generated by the fountain and waterfall (point 14), as well as church bells (point 1). Anthropological sounds were reported in the leafy period in points 8, 13, and 14 (pedestrians).

Result of the Paired Samples t-test in the Podzamcze Park

With the assumed significance level (α = 0.05), the value p < 0.00001 was obtained as a result of the paired-samples t-test.
There was a significant increase in the noise level in the leafless period (M = 43.64, SD = 7.48) compared to the leafy period (M = 40.34, SD = 7.86), t(37) = −3.77, p = 0.00058. The result is significant at p < 0.05 (Annex 3).

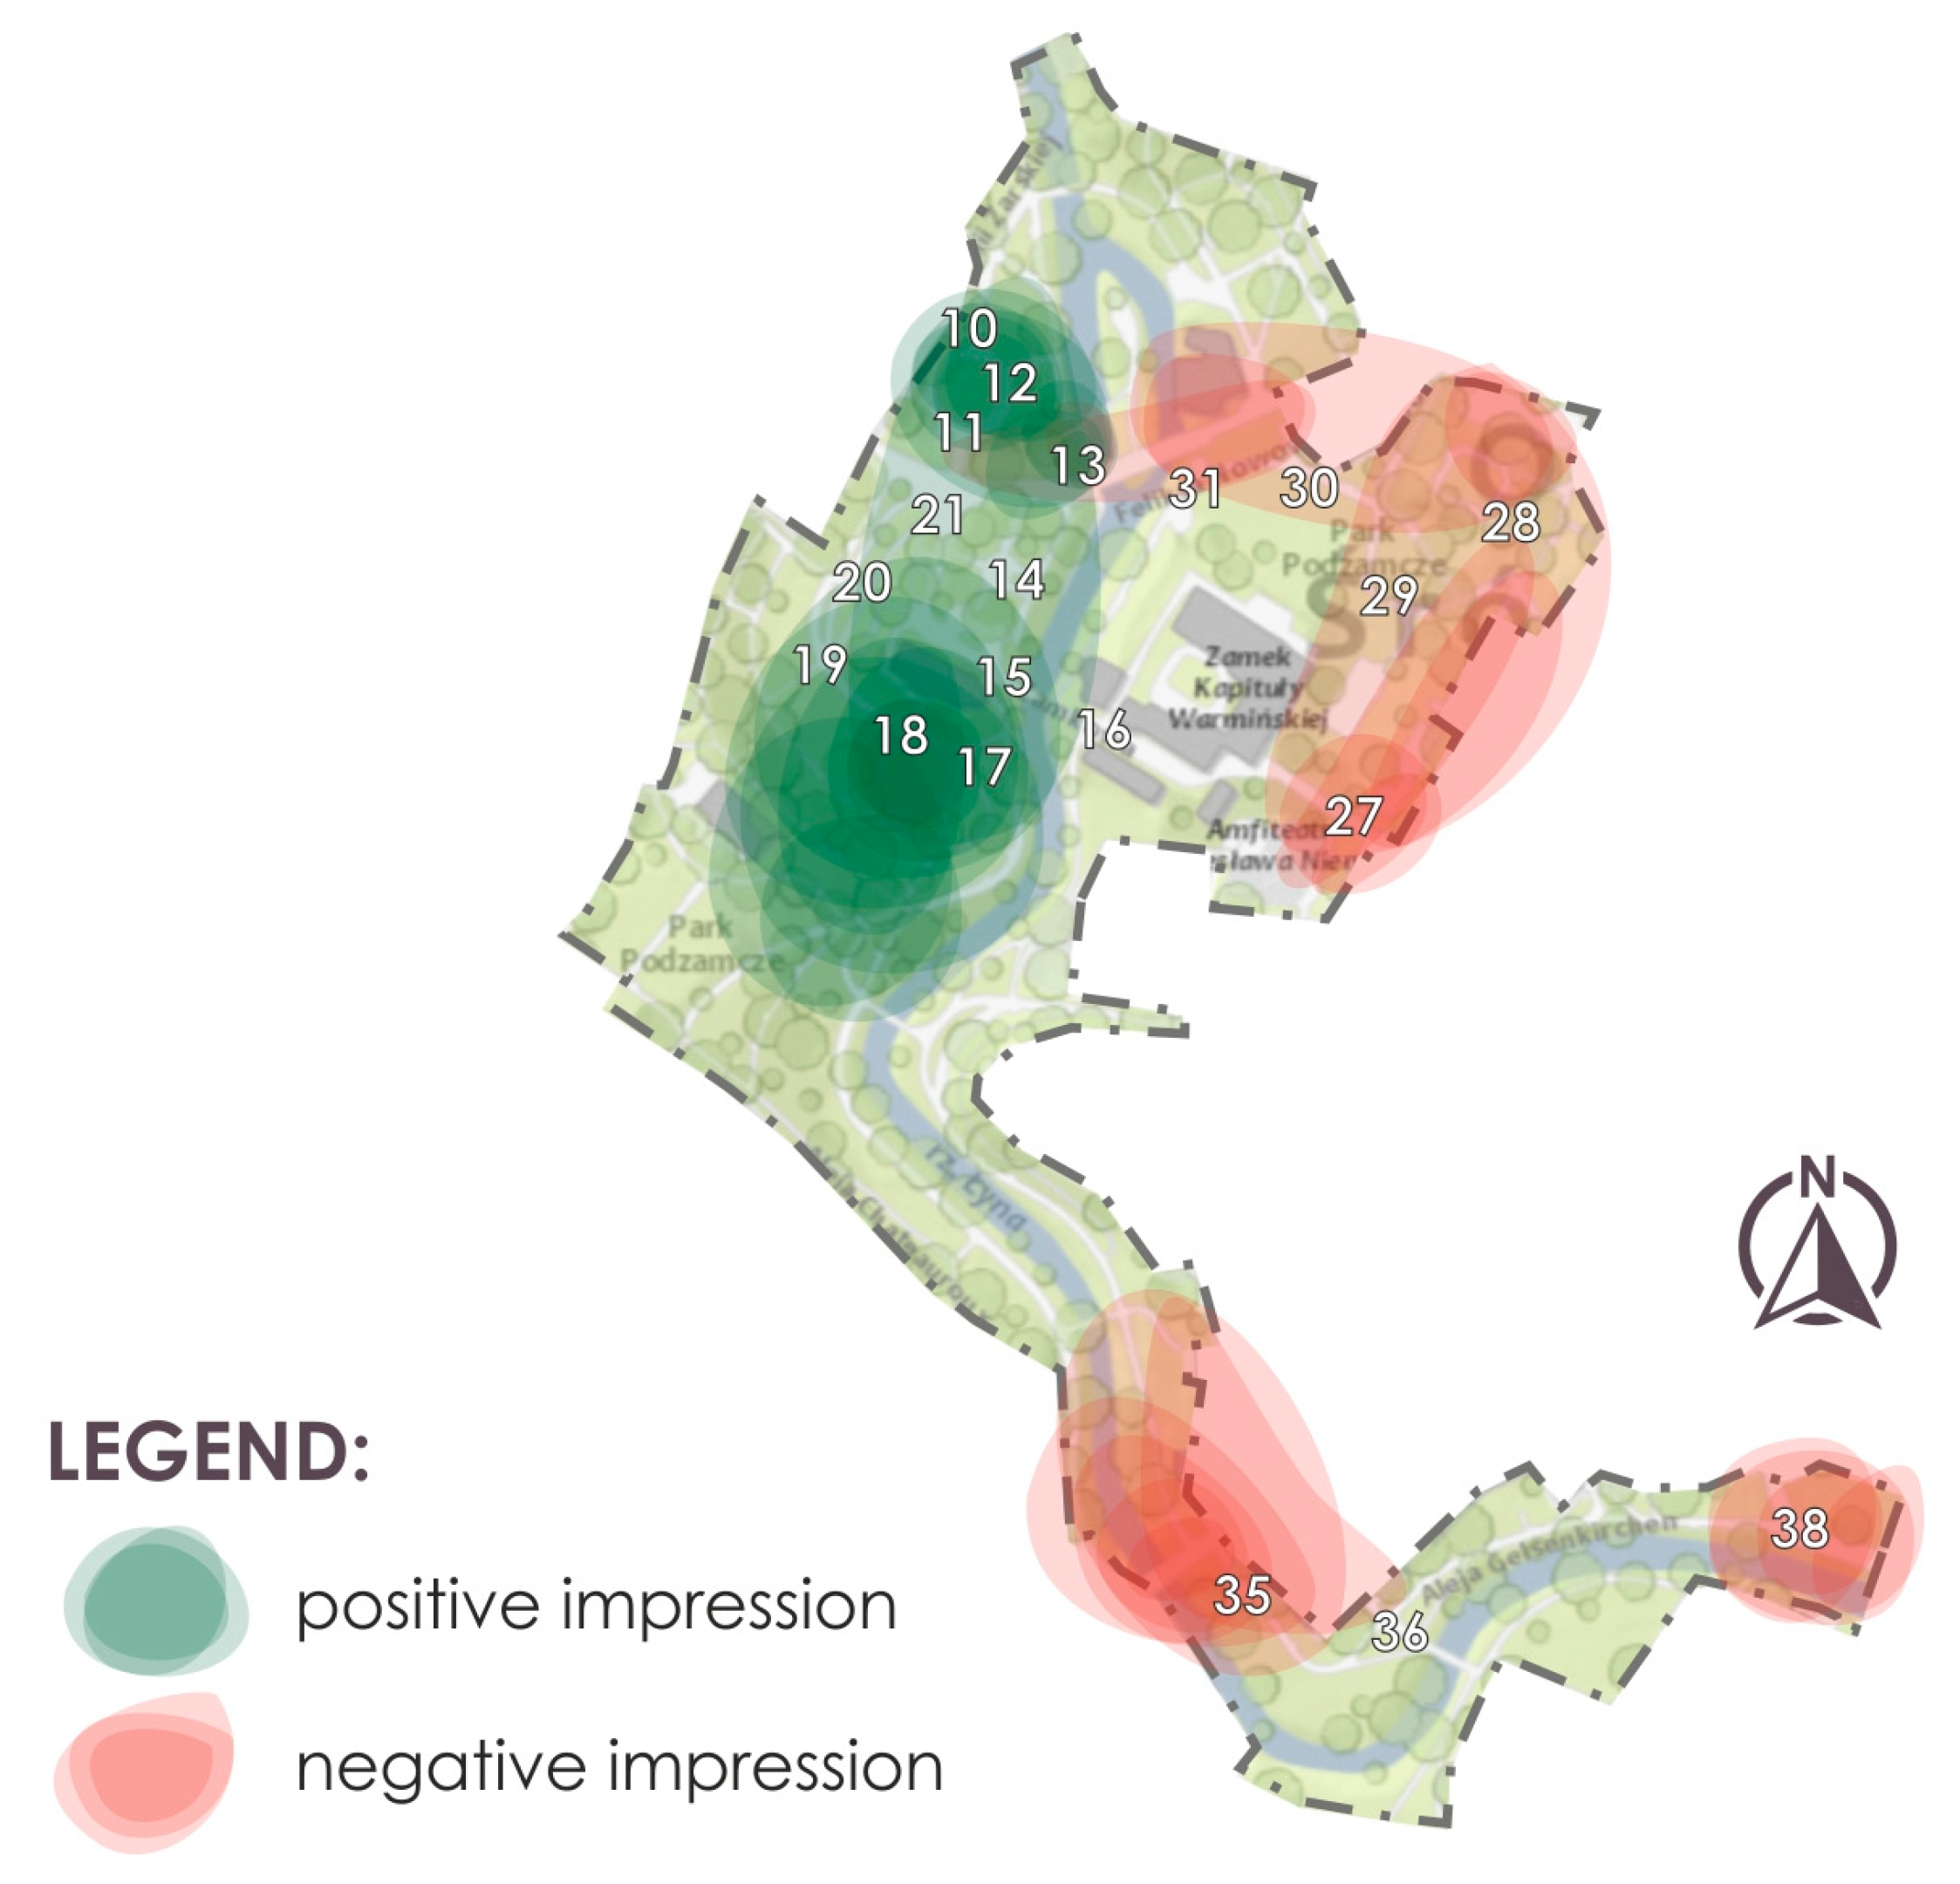
4.4.3. Test II. Interview with Park Users in the Podzamcze Park

Results of the interview with park users in the Podzamcze Park are depicted in the mental map (Figure 15). According to the users, the noisiest and unpleasant place in the park is the entrance from Grunwaldzka Street (points 35, 36), Pieniężnego Street (point 38), and Nowowiejski Street (point 27–30), and areas bordering on the old town (point 31). A waterfall and two fountains (points 10–13) and the center of the park (points 14–21) were considered quiet places free of noise, characterized by positive sounds.

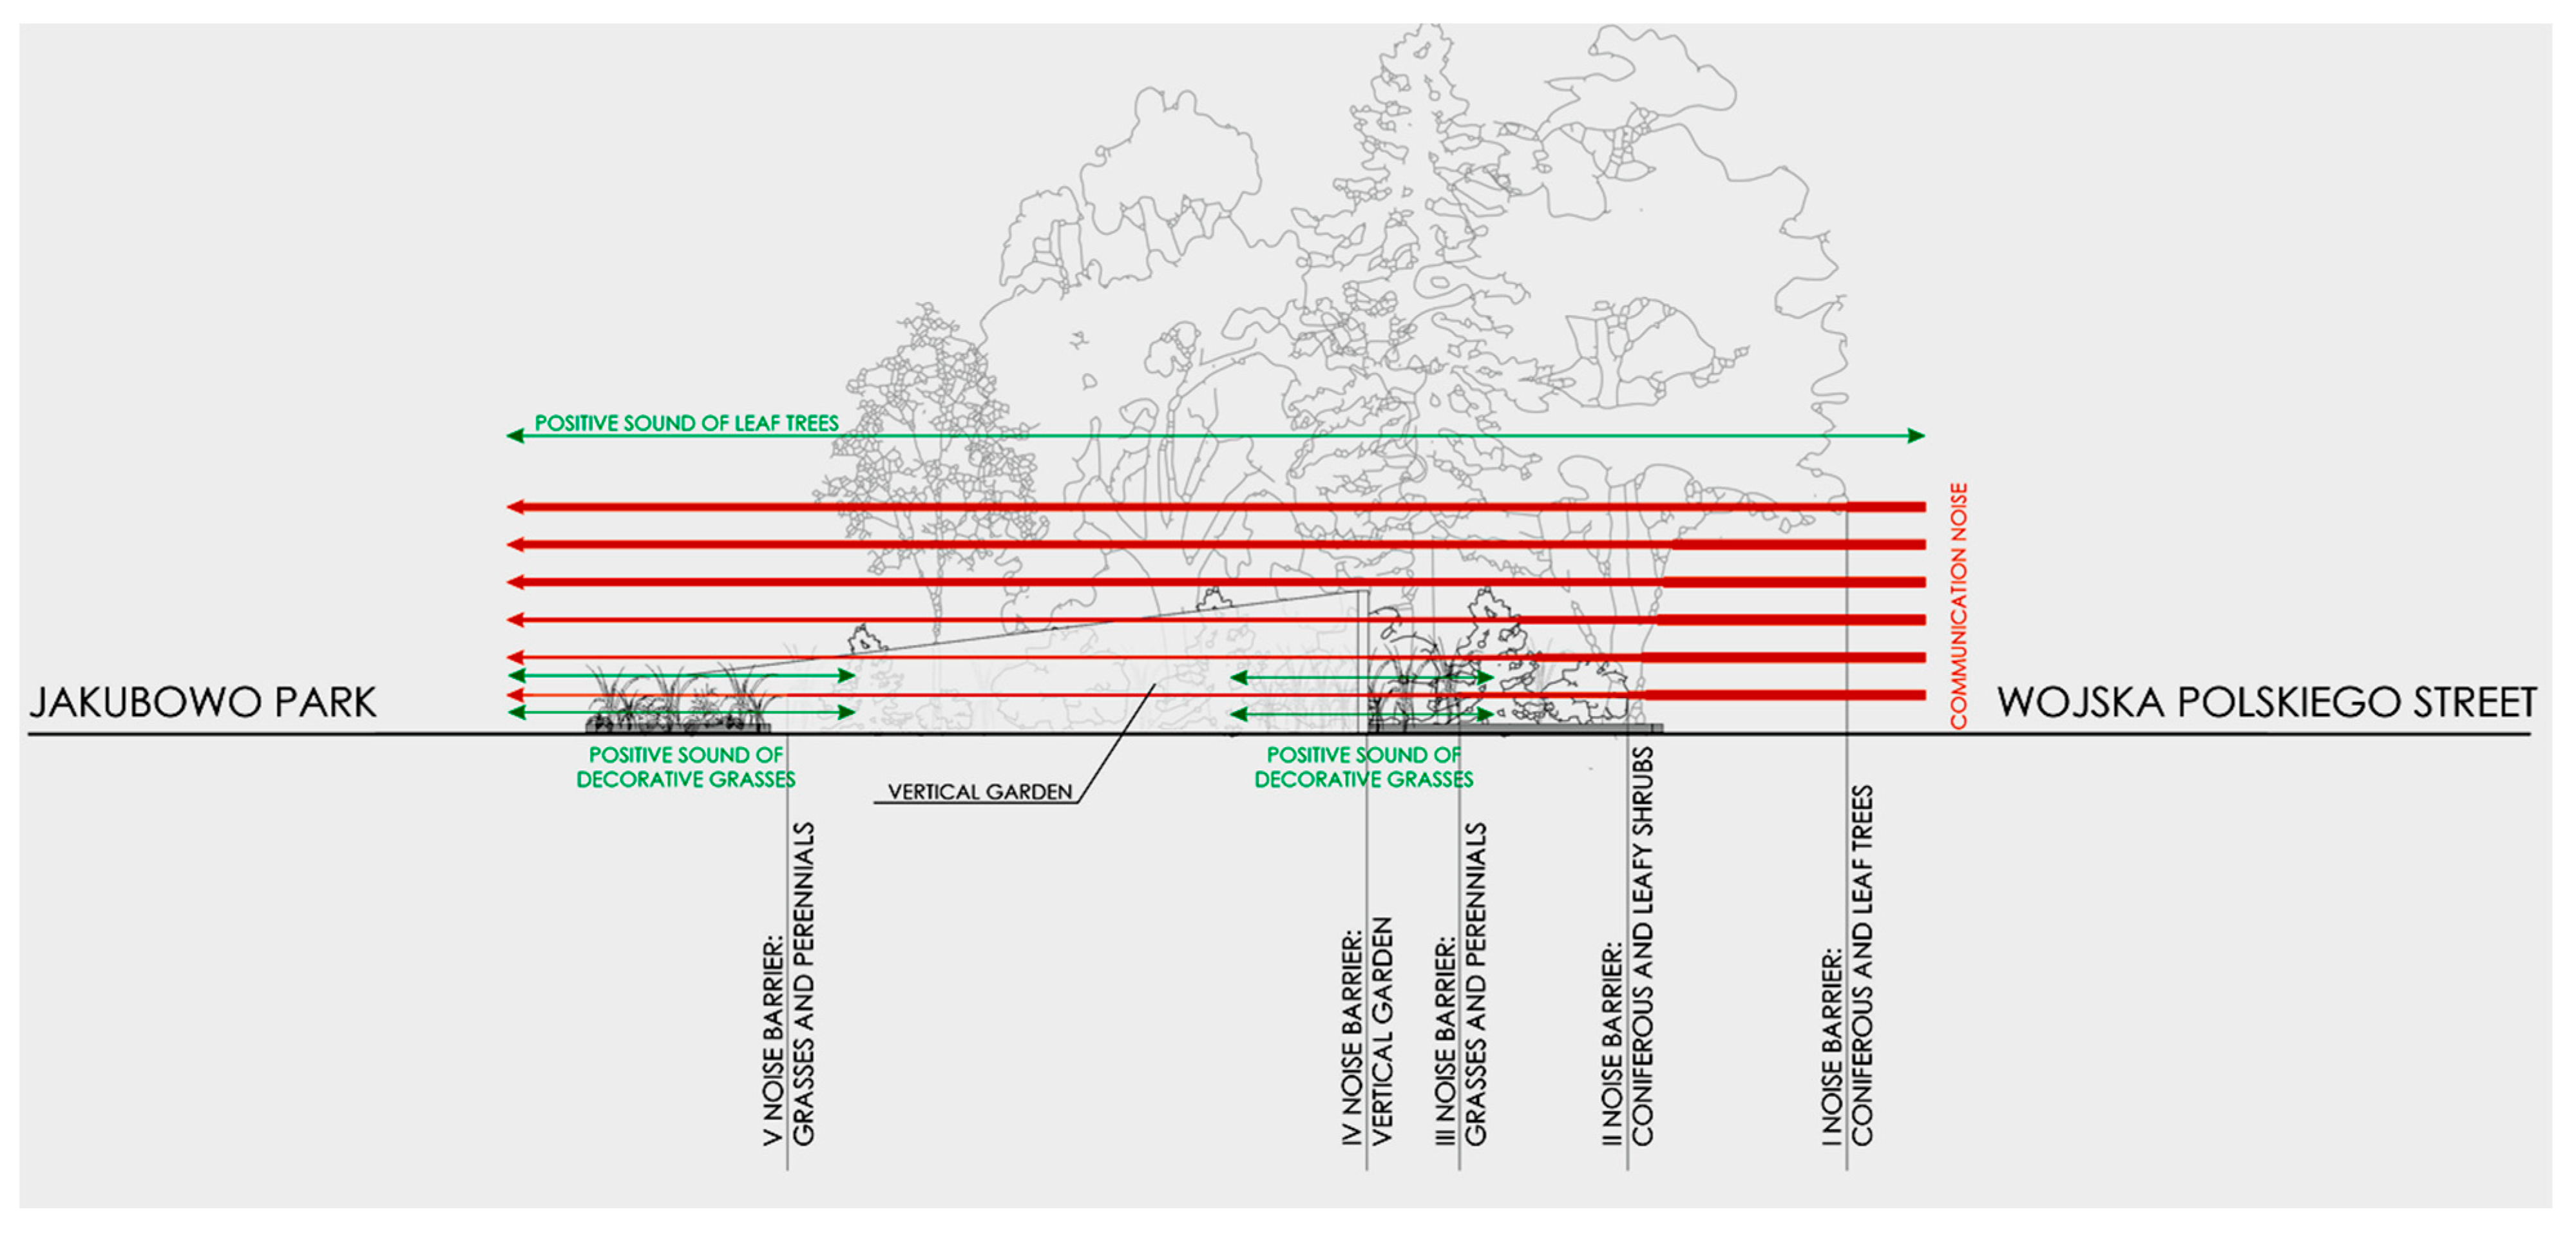
5. Guidelines and Recommendations

In order to formulate guidelines for future design, it becomes crucial to analyze the area in terms of the soundscape, as demonstrated by the results of our research. The significance of characteristic sounds, background noises, and information contained in them, identification of noise sources, quiet zones, and pleasant sounds provide the basis for the analysis of the sound of a given area [97].
Management recommendations and guidelines were formulated to preserve the existing valuable sounds, and to ensure that newly introduced sounds will be consistent with them. Revitalization of public spaces including soundscape improvement consists of shaping new sound quality, social, cultural, and economic revival and spatial reconstruction, restoration of harmony and identity of the place, and improvement of the quality of life. In the revitalization process, it is important to take into account the natural conditions of the area. Soundscape quality can be improved by among others removal of sound advertisements, promotion of bicycle and bus transport, separation of bicycle and walking paths, construction of bypasses, exclusion of traffic areas, installation of acoustic screens, establishment of green areas, including pocket parks and sensory gardens [97], as well as creating vertical walls, sound barriers from trees and shrubs, spatial installations, and sound walks [98,99,100]. In landscape design practice, the spatial arrangement of different elements should be perceived as improving the quality of soundscapes [18].
The recommendations are based on two pillars of the proposed design activities. The first concerns reduction of undesirable sounds, and the second the introduction of desirable sounds to the parks. A similar solution is proposed by Cerwén et al. [19]. We propose similar solutions for places located at the entrances to parks, bordering on main streets and located near the street space. Reduction of undesirable sounds is proposed to be obtained through, among others, the use of several sound barriers, assuming the use of various forms of vegetation (Figure 16). The introduction of desirable sounds is recommended, along with so-called visual masking, including the use of high-density vegetation as well as deciduous tree and shrub species, grasses, and perennials with leaves rustling in the wind (Figure 16). Planning such a structure, from dense plant forms right next to the street strip to less dense forms introducing additional sounds (closer to the center of the park), will obtain the effect of better perception of the soundscape. From an acoustic point of view, it is ideal to place a vertical screen as close to the source of noise (the road) as possible, although this is not always possible, as shown in Figure 16—its position is influenced by landscape design requirements regarding the shaping of the street space.
The following management guidelines and recommendations were developed for the improvement of the quality of the soundscape in the analyzed parks.
Jakubowo Park struggles with the problem of noise overload at its borders with main roads. This is not a positive factor, considering that the main function of the park is recreation and relaxation. Moreover, the park is used by patients from a nearby hospital, and such noise levels may not only be conducive to relaxation, but may worsen their health condition. The results also showed that the greenery (lower forms and transparent structure), particularly in the area adjacent to the transportation areas, provides an insufficient barrier to sounds. A noise barrier should be planted as close to the noise source as possible, along the borders with main roads. On the other hand, we propose to take into account the issues of safety and visibility, e.g., in the road lane and at the entrances to the park, as well as to refer to the principles adopted in landscape architecture. For this park, it is proposed to graduate vegetation depending on its density and height. The sound values of the park should be protected, especially around ponds and dense groups of trees.
Kusocińskiego Park is functionally diverse, attracting users of all ages. The park’s greenery is varied in terms of species and levels (perennials, shrubs, low trees, tall trees). This is a factor reducing the average perceived sound intensity in the leafy period. The improvement of the quality of the soundscape in the Kusocińskiego Park requires an increase in the density of trees and shrubs at the park’s borders (in its central and in south-eastern parts). Balancing this with safety issues associated with planning the vegetation at the borders of the park and near the street zone is a common problem. This park is divided by a street line creating a double risk related not only to noise, but also to direct road traffic (there are two large crossroads nearby). In this case, in addition to visual masking, we propose the application of the principles of traffic calming measure design.
Podzamcze Park. Traffic is the main source of unpleasant sounds. In some parts of the park, vegetation effectively reduces traffic noise and the buzz generated by the users of the old town. On the other hand, the north-eastern, eastern, and southern parts of the park lack dense tree stands. Fountains and a waterfall have undoubtedly improved the sound quality of the area. This part of the park, considering positively rated sounds in test II and the opinion of park users, should be protected. For the central part of the park, we suggest introducing elements that generate desirable sounds, including the use of shrub species, grasses, and perennials with leaves rustling in the wind.

6. Discussion

In the course of development of sound ecology, initiated by R. M. Schafer, numerous research projects have examined soundscapes, and various methods of research have been developed, including conducting acoustic measurements as well as phonographic recordings, soundwalks, and interviews [73,74,75,76,77,78,79,80,84,85,86,87,88,89,98,99]. A large library of descriptions and recordings of the soundscape of large and small cities, suburban areas, parks, and gardens has been created. Conscious soundscape design, aimed at improving the sound environments of built-up areas, is also extremely important in planning the space of parks.
The authors conducted the study by treating the space of city parks as places of necessary “oases of silence”, rest, and recreation for residents, places that should certainly not be polluted by noise.
The study results indicate a relationship between functions occurring in the strict city center and their noise source and the occurrence of characteristic sounds, particularly in areas bordering the analyzed parks. This is primarily related to the communication function in parts adjacent to the main streets, where traffic is heavy. The noise level is much higher there. Similar results were obtained in other cities in Poland, namely Bydgoszcz [101] and Kraków [102]. The residential and service function does not affect noise generation to such an extent as the transportation function, evident in the Podzamcze Park and Kusocińskiego Park. The above conclusions are confirmed by the analysis of the acoustic map and our own measurements, as well as interviews with park users. The noise level decreases with growing distance from the main noise source, i.e., the street, as also determined by Szczepańska et al. in zones of municipal housing estates in Olsztyn [103].
Regarding the perception of noise-related discomfort, results of the interviews with users presented in mental maps show that the area of noise perception is slightly larger than in the case of the first two tests (results from the acoustic map and measurements). On the other hand, when users are among compact greenery, the situation changes, although the measurements do not show large differences. This is probably due to the psychological influence of vegetation (people feel good and safe among greenery), as also observed by Brambilla and Maffei [104] and Van Renterghem [62], who showed the importance of the compliance of sounds heard in parks with the expectations of visitors and audiovisual interaction with regard to the sound pressure level. Moreover, the smell of trees may play an important role in the perception of noise [105]. This factor, however, was not taken into account in the research conducted in the parks in Olsztyn.
Results of the interview also confirm that the perception of sound by inhabitants is influenced by well-designed spaces with a large variety of species and plant forms. Such places were often marked as more sound-friendly.
Studies comparing conditions of leafless and leafy periods regarding the impact of vegetation on noise reduction are scarce. Our research revealed a significant difference between values obtained by measurements of sound pressure levels (SPL, LAeq) in the leafless and leafy periods in three parks in Olsztyn. Out of all three parks, the largest difference between the two periods was determined for the Jakubowo Park (12.02 dBA), and the smallest for the Podzamcze Park (3.31 dBA). This suggests that vegetation in the leafless state contributed to noise inhibition less than in the leafy state.
According to the results of the evaluation of characteristic sounds in all parks, background sounds in the leafless and leafy periods included the noise of the wind (positive feeling) and the noise of cars and traffic (negative feeling). Characteristic sounds in the leafless period were associated with seasonal works (Jakubowo Park, Podzamcze Park), pedestrians (all parks), cars (all parks), birdsongs (Kusocinskiego Park), and a waterfall (Podzamcze Park). Characteristic sounds in the leafy period, in addition to those occurring in the leafless period, are sounds generated by the leaves of trees (in all parks), sounds of water in fountains (Podzamcze Park and Kusocińskiego Park), and sounds of water in the water bodies (in all parks). The sounds of leafy trees and water are positive. The role of positive sounds of water and plant sounds is also emphasized by, among others, Liu et al. [70], and Van Renterghem et al. [72]. Van Renterghem et al. [72] point out that interactively composed natural soundscapes mask road noise. According to Axelsson et al. [106], however, the use of water sounds to mask street noise may affect the audibility of not only undesirable but also desirable sounds.
Our study results show that sounds are always present in all three parks include birdsongs and car and vehicle sounds. The research results confirm the necessity of park space design aimed at reducing noise levels, particularly in zones at the border with transport areas, and the introduction of elements generating positive sounds throughout the park, especially in its central parts.
Regarding the problem of the relation between the density of vegetation and potential for noise reduction, a wide variation of opinions is found concerning the effectiveness of plantings as noise attenuators. Many authors suggest the use of compact tree or hedge forms of high density [107,108,109,110,111]. According to Yasin et al. [112] citing Kragh [113], the distance between trees from 3 to 25 m has only a slight effect on noise. Authors of other studies also emphasize the role of evergreen species, especially in all-season conditions. For example, Samara and Tsitsoni [64] suggest planting evergreen shrubs along the roadside to create a living barrier of vegetation sufficiently dense to prevent any casual observer from seeing the road through the vegetation. Another solution is to design vegetation in strips in several rows. Such solutions are appropriate in spaces related to transport, but given the structure of city parks, especially in city centers, such solutions are not always possible due to the specificity of parks (style, history, relations with the environment), as well as for ecological (biodiversity) and aesthetic reasons (inclusion of colors, textures, and plant structures). Therefore, in our recommendations, we propose solutions taking into account the specificity of parks, and not only the density of vegetation (like visual masking [19] or vertical garden/vegetation walls).
The diversity of forms and species obtained through the use of trees and shrubs next to evergreen plants, and planning of low greenery (ornamental grasses, perennials) affects the perception of the soundscape by park users (the psychological aspect is discussed above, e.g., [19]). Although the measurements of the effect of noise reduction in such a situation may suggest otherwise, the potential user of the park may perceive the noise reduction. Therefore, when designing or revitalizing parks, it is worth taking into account the multidimensionality and complexity of planning. As stated by Samara and Tsitsoni [64], the efficiency of tree barriers depends not only on the expected acoustic results, but also on other factors such as safety, maintenance, aesthetics, cost, and acceptance by local communities. The plants used, and methods of manufacturing noise barriers can be combined in a variety of ways.

7. Conclusions

The objective of this study was to analyze the soundscape of three parks as a part of the landscape planning process to determine the directions of re-design of places most exposed to noise. The main conclusions are as follows:
  • Regarding the spatial and functional structure of the city center in Olsztyn and the surroundings of parks, a direct relation exists between the location of parks, functions of the environment, and noise sources, whereas the residential function has a slightly smaller impact than the transportation function.
  • The analysis of the acoustic map showed similar results as SPL measurements. Both analyses indicated a high risk of noise, especially close to the external borders of all three parks.
  • As confirmed by the conducted t-test, the results of SPL measurements in the leafless and leafy period showed that vegetation in the leafless period contributed to noise inhibition less than vegetation in the leafy period.
  • The analysis of characteristic sounds and background sounds in two periods showed variable perception of these sounds, whereas positive sounds (birds singing, water noise, wind noise) were perceived more intensively during the leafy period.
  • There is a relation between the visual and sound perception of parks from the psychological point of view, as confirmed by the results of interviews with park users.
  • The procedure of pre-design analyses in the field of soundscape planning presented in the study should be treated as a proposal to include this type of analysis in the design of urban spaces, particularly parks.
  • The study results also confirm the need to introduce additional analyses taking into account the soundscape in the case of revitalization or renovation of public spaces, including city parks.

Supplementary Materials

Author Contributions

Conceptualization A.J., methodology A.J., N.M., S.B., analysis N.M., investigation N.M., writing preparation and visualization A.J., N.M., K.K., S.B., E.P. All authors have read and agreed to the published version of the manuscript.

Funding

This research received no external funding.

Institutional Review Board Statement

Ethical review and approval were waived for this study, due to the fact that respondents and their privacy were not violated. Responses were recorded without any personal data.

Informed Consent Statement

Informed consent was obtained from all subjects involved in the study.

Acknowledgments

The authors would like to thank the Cost Action CA17133—Implementing nature based solutions for creating a resourceful circular city and the project APVV SK-PL-18-0022 LIVA—The Concept of livability in the context of small towns funded by NAWA—Polish National Agency for Academic Exchange and SRDA—Slovak Research and Development Agency for enabling the work and interaction between the researchers required for the article.

Conflicts of Interest

The authors declare no conflict of interest.

References

  1. Schafer, R.M. The New Soundscape; Associated Music Publishers: New York, NY, USA, 1969; pp. 6–13. [Google Scholar]
  2. Schafer, R.M. Our Sonic Environment and the Tuning of the World; Inner Traditions/Bear: New York, NY, USA, 1982; p. 15. [Google Scholar]
  3. Bernat, S. Krajobraz Dźwiękowy jako Przedmiot Zainteresowań Geografii; UMCS: Lublin, Poland, 2015; p. 14. [Google Scholar]
  4. Bernat, S. (Ed.) Dźwięk w Krajobrazie Jako Przedmiot Badań Interdyscyplinarnych; UMCS: Lublin, Poland, 2008; p. 14. [Google Scholar]
  5. Małkowska, N. Krajobraz Dźwiękowy-Analiza Przestrzeni Ulicznych na Przykładzie Parków w Olsztynie; Department of Landscape Architecture, University of Warmia and Mazury in Olsztyn: Olsztyn, Poland, 2018. [Google Scholar]
  6. Porteous, J.D.; Mastin, J.F. Soundscape. J. Archit. Plan. Res. 1985, 2, 169–186. [Google Scholar]
  7. Southworth, M. The sonic environment of cities. Environ. Behav. 1969, 1, 49–70. [Google Scholar]
  8. International Organization for Standardization. ISO 12913-1:2014 Acoustics—Soundscape—Part 1: Definition and Conceptual Framework; ISO: Geneva, Switzerland, 2014. [Google Scholar]
  9. Jeon, J.Y.; Hong, J.Y. Classification of urban park soundscapes through perceptions of the acoustical environments. Landsc. Urban Plan. 2015, 141, 100–111. [Google Scholar] [CrossRef]
  10. Kang, J.; Aletta, F.; Gjestland, T.T.; Brown, L.A.; Botteldooren, D.; Schulte-Fortkamp, B.; Lercher, P.; van Kamp, I.; Genuit, K.; Fiebig, A.; et al. Ten questions on the soundscapes of the built environment. Build. Environ. 2016, 108, 284–294. [Google Scholar] [CrossRef] [Green Version]
  11. Raimbault, M.; Dubois, D. Urban soundscapes: Experiences and knowledge. Cities 2005, 22, 339–350. [Google Scholar] [CrossRef]
  12. Brown, A.L.; Muhar, A. An approach to the acoustic design of outdoor space. J. Environ. Plan. Manag. 2004, 47, 827–842. [Google Scholar] [CrossRef] [Green Version]
  13. Meng, Q.; Kang, J. Effect of sound-related activities on human behaviours and acoustic comfort in urban open spaces. Sci. Total Environ. 2016, 573, 481–493. [Google Scholar] [CrossRef] [Green Version]
  14. Preis, A.; Kociński, J.; Hafke-Dys, H.; Wrzosek, M. Audio-visual interactions in environment assessment. Sci. Total Environ. 2015, 523, 191–200. [Google Scholar] [CrossRef]
  15. Basner, M.; Babisch, W.; Davis, A.; Brink, M.; Clark, C.; Janssen, S.; Stansfeld, S. Auditory and non-auditory effects of noise on health. Lancet 2014, 383, 1325–1332. [Google Scholar] [CrossRef] [Green Version]
  16. Aletta, F.; Oberman, T.; Kang, J. Associations between positive health-related effects and soundscapes perceptual constructs: A systematic review. Int. J. Environ. Res. Public Health 2018, 15, 2392. [Google Scholar] [CrossRef] [Green Version]
  17. Fowler, M.D. Soundscape as a design strategy for landscape architectural praxis. Des. Stud. 2013, 34, 111–128. [Google Scholar] [CrossRef]
  18. Liu, J.; Kang, J.; Behm, H.; Luo, T. Effects of landscape on soundscape perception: Soundwalks in city parks. Landsc. Urban Plan. 2014, 123, 30–40. [Google Scholar] [CrossRef] [Green Version]
  19. Cerwén, G.; Kreutzfeldt, J.; Wingren, C. Soundscape actions: A tool for noise treatment based on three workshops in landscape architecture. Front. Archit. Res. 2017, 6, 504–518. [Google Scholar] [CrossRef]
  20. Pouya, S. The Role of Landscape Architecture on Soundscape Experience. Turk. J. For. Sci. 2017, 1, 183–193. [Google Scholar] [CrossRef]
  21. Cerwén, G.; Wingren, C.; Qviström, M. Evaluating soundscape intentions in landscape architecture: A study of competition entries for a new cemetery in Järva, Stockholm. J. Environ. Plan. Manag. 2017, 60, 1253–1275. [Google Scholar] [CrossRef]
  22. Carles, J.L.; Barrio, I.L.; de Lucio, J.V. Sound influence on landscape values. Landsc. Urban Plan. 1999, 43, 191–200. [Google Scholar] [CrossRef]
  23. Viollon, S.; Lavandier, C.; Drake, C. Influence of visual setting on sound ratings in an urban environment. Appl. Acoust. 2002, 63, 493–511. [Google Scholar] [CrossRef]
  24. Wang, R.; Zhao, J. A good sound in the right place: Exploring the effects of auditory-visual combinations on aesthetic preference. Urban For. Urban Green. 2019, 43, 126356. [Google Scholar] [CrossRef]
  25. D’Alessandro, F.; Evangelisti, L.; Guattari, C.; Grazieschi, G.; Orsini, F. Influence of visual aspects and other features on the soundscape assessment of a University external area. Build. Acoust. 2018, 25, 199–217. [Google Scholar] [CrossRef]
  26. Zhang, S.; Zhao, X.; Zenz, Z.; Qiu, X. The Influence of Audio-Visual Interactions on Psychological Responses of Young People in Urban Green Areas: A Case Study in Two Parks in China. Int. J. Environ. Res. Public Health 2019, 16, 1845. [Google Scholar] [CrossRef] [Green Version]
  27. Watts, G.R.; Pheasant, R.J.; Horoshenkov, K.V. Predicting perceived tranquillity in urban parks and open spaces. Environ. Plan. B Plan. Des. 2011, 38, 585–594. [Google Scholar] [CrossRef]
  28. Nożyński, S. Zanurzeni w Mediach. Środowisko Audialne. Kilka Uwag na Temat Otoczenia Dźwiękowego; UAM: Poznań, Poland, 2016; pp. 185–193. [Google Scholar]
  29. Cerwén, G.; Mossberg, F. Implementation of quiet areas in Sweden. Int. J. Environ. Res. Public Health 2019, 16, 134. [Google Scholar] [CrossRef] [Green Version]
  30. Brambilla, G.; Gallo, V.; Zambon, G. The Soundscape Quality in Some Urban Parks in Milan, Italy. Int. J. Environ. Res. Public Health 2013, 10, 2348–2369. [Google Scholar] [CrossRef] [Green Version]
  31. Brambilla, G.; Gallo, V.; Asdrubali, F.; D’Alessandro, F. The perceived quality of soundscape in three urban parks in Rome. J. Acoust. Soc. Am. 2013, 134, 832–839. [Google Scholar] [CrossRef] [PubMed]
  32. Kang, J. Urban Sound Environment; CRC Press: London, UK, 2006. [Google Scholar]
  33. Rehan, R.M. The phonic identity of the city urban soundscape for sustainable spaces. HBRC J. 2016, 12, 337–349. [Google Scholar] [CrossRef] [Green Version]
  34. Jia, Y.; Ma, H.; Kang, J. Characteristics and evaluation of urban soundscapes worthy of preservation. J. Environ. Manag. 2020, 253, 109722. [Google Scholar] [CrossRef]
  35. Steele, D. Bridging the Gap from Soundscape Research to Urban Planning and Design Practice: How Do Professionals Conceptualize, Work with, and Seek Information about Sound? Ph.D. Thesis, McGill University, Montreal, QC, Canada, 2018. [Google Scholar]
  36. Kandemir, Ö.; Özçevik Bilen, A. An Experience in Architectural Design Studio Regarding the Concept of Soundscape. Megaron 2020, 15, 13–24. [Google Scholar] [CrossRef]
  37. Alves, S.; Estévez-Mauriz, L.; Aletta, F.; Echevarria-Sanchez, G.M.; Puyana Romero, V. Towards the integration of urban sound planning in urban development processes: The study of four test sites within the SONORUS project. Noise Mapp. 2015, 2, 57–85. [Google Scholar] [CrossRef]
  38. Jennings, P.; Cain, R. A framework for improving urban soundscapes. Appl. Acoust. 2013, 74, 293–299. [Google Scholar] [CrossRef] [Green Version]
  39. Environmental Protection Law Act from 27 April 2001. J. Laws 2008, No. 25, Item 150. Available online: https://esdac.jrc.ec.europa.eu (accessed on 10 September 2020).
  40. European Parliament and Council. Directive 2002/49/EC of the European Parliament and of the Council of 25 June 2002 Relating to the Assessment and Management of Environmental Noise; European Parliament and Council: Brussels, Belgium, 2002; Available online: https://eur-lex.europa.eu (accessed on 10 September 2020).
  41. Bernat, S. Analysis of Social Conflicts in Poland’s Soundscape as a Challenge to Socio-Acoustics. Arch. Acoust. 2016, 41, 415–426. [Google Scholar] [CrossRef] [Green Version]
  42. Bernat, S. Obszary ciche w aglomeracjach. In Obszary Metropolitalne We Współczesnym Środowisku Geograficznym: 58. Zjazd Polskiego Towarzystwa Geograficznego, Łódź 2010; Barwiński, M., Ed.; Uniwersytet Łódzki: Łódź, Poland, 2010; Volume 2, pp. 305–314. [Google Scholar]
  43. Bernat, S. Dźwięk w krajobrazie. Podejście Geograficzne; UMCS: Lublin, Poland, 2015; p. 234. [Google Scholar]
  44. European Environment Agency. Quiet Areas in Europe-the Environment Unaffected by Noise Pollution; EEA Report No 14/2016; European Environment Agency: Copenhagen, Denmark, 2016. [Google Scholar]
  45. European Environment Agency. Noise in Europe 2014; EEA Report No 10/2014; European Environment Agency: Copenhagen, Denmark, 2014. [Google Scholar]
  46. Chiesura, A. The role of urban parks for the sustainable city. Landsc. Urban Plan. 2004, 68, 129–138. [Google Scholar] [CrossRef]
  47. Konijnendijk, C.C.; Annerstedt, M.; Busse Nielsen, A.; Maruthaveeran, S. Benefits of Urban Parks a Systematic Review; International Federation of Parks and Recreation Administration: Copenhagen, Denmark; Alnarp, Sweden, 2013; pp. 1–70. [Google Scholar]
  48. Madureira, H.; Nunes, F.; Oliveira, J.V.; Cormier, L.; Madureira, T. Urban residents’ beliefs concerning green space benefits in four cities in France and Portugal. Urban For. Urban Green. 2015, 14, 56–64. [Google Scholar] [CrossRef]
  49. Jeon, J.Y.; Hong, J.Y.; Lavandier, C.; Lafon, J.; Axelsson, Ö.; Hurtig, M. A cross-national comparison in assessment of urban park soundscapes in France, Korea, and Sweden through laboratory experiments. Appl. Acoust. 2018, 133, 107–117. [Google Scholar] [CrossRef]
  50. Lam, K.; Ng, S.; Hui, W.; Chan, P. Environmental Quality of Urban Parks and Open Spaces in Hong Kong. Environ. Monit. Assess. 2005, 111, 55–73. [Google Scholar] [CrossRef] [PubMed]
  51. Payne, S.R. Are perceived soundscapes within urban parks restorative? J. Acoust. Soc. Am. 2008, 123, 3809. [Google Scholar] [CrossRef] [Green Version]
  52. Watts, G.; Pheasant, R.; Horoshenkov, K. Tranquil spaces in a metropolitan area. In Proceedings of the 20th International Congress on Acoustics, ICA 2010, Sydney, Australia, 23–27 August 2010. [Google Scholar]
  53. Szopińska, E.; Kazak, J.; Kempa, O.; Rubaszek, J. Spatial Form of Greenery in Strategic Environmental Management in the Context of Urban Adaptation to Climat Change. Pol. J. Environ. Stud. 2019, 28, 2845–2856. [Google Scholar] [CrossRef]
  54. Kiełkowska, J.; Tokarczyk-Dorociak, K.; Kazak, J.; Szewrański, S.; van Hoof, J. Urban Addaptation to Climat Change Plans and Policies–the Conceptual Framework of a Methodological Approach. J. Ecol. Eng. 2018, 19, 50–62. [Google Scholar] [CrossRef] [Green Version]
  55. Fang, C.; Ling, D. Investigation of the noise reduction provided by tree belts. Landsc. Urban Plan. 2003, 63, 187–195. [Google Scholar] [CrossRef]
  56. Lugten, M.; Karacaoglu, M.; White, K.; Kang, J.; Steemers, K. Improving the soundscape quality of urban areas exposed to aircraft noise by adding moving water and vegetation. J. Acoust. Soc. Am. 2018, 144, 2906. [Google Scholar] [CrossRef] [Green Version]
  57. Gómez-Baggethun, E.; Barton, D.N. Classifying and valuing ecosystem services for urban planning. Ecol. Econ. 2013, 86, 235–245. [Google Scholar] [CrossRef]
  58. Milliken, S. Ecosystem services in urban environments. In Nature Based Strategies for Urban and Building Sustainability; Pérez, G., Perini, K., Eds.; Butterworth-Heinemann: Oxford, UK, 2018; pp. 17–27. [Google Scholar]
  59. Rowe, D.B. Greenroofs as a means of pollution abatement. Environ. Pollut. 2011, 159, 2100–2110. [Google Scholar] [CrossRef] [PubMed] [Green Version]
  60. Azkorra, Z.; Pérez, G.; Coma, J.; Cabeza, L.F.; Bures, S.; Álvaro, J.E. Evaluation of green walls as a passive acoustic insulation system for buildings. Appl. Acoust. 2015, 89, 46–56. [Google Scholar] [CrossRef] [Green Version]
  61. Pérez, G.; Coma, J.; Barrenche, C.; de Gracia, A.; Urrestarazu, M.; Burés, S.; Cabeza, L.F. Acoustic insulation capacity of Vertical Greenery Systems for buildings. Appl. Acoust. 2016, 110, 218–226. [Google Scholar] [CrossRef] [Green Version]
  62. Van Renterghem, T. Towards explaining the positive effect of vegetation on the perception of environmental noise. Urban For. Urban Green. 2019, 40, 133–144. [Google Scholar] [CrossRef]
  63. Nilsson, M.E.; Bengtsson, J.; Klæboe, R. Environmental Methods for Transport Noise Reduction; CRC Press: Boca Raton, FL, USA, 2015. [Google Scholar]
  64. Samara, T.; Tsitsoni, T. The effects of vegetation on reducing traffic noise from a city ring road. Noise Control Eng. J. 2011, 59, 68–74. [Google Scholar] [CrossRef]
  65. Sadowski, J. Podstawy Akustyki Urbanistycznej; Arkady: Warszawa, Poland, 1982; pp. 1–306. [Google Scholar]
  66. Zimny, H. Ochrona i Kształtowanie Zieleni w Aglomeracjach Miejskich; LOP: Warszawa, Poland, 1978; pp. 14–73. [Google Scholar]
  67. Czerwieniec, M.; Lewińska, J. Zieleń w Mieście; Instytut Gospodarki Przestrzennej i Komunalnej: Kraków, Poland, 2000; pp. 40–41. [Google Scholar]
  68. Tse, M.S.; Chau, C.K.; Choy, Y.S.; Tsui, W.K.; Chan, C.N.; Tang, S.K. Perception of urban park soundscape. J. Acoust. Soc. Am. 2012, 131, 2762–2771. [Google Scholar] [CrossRef] [Green Version]
  69. Liu, J.; Kang, J. Soundscape design in city parks: Exploring the relationships between soundscape composition parameters and physical and psychoacoustic parameters. J. Environ. Eng. Landsc. Manag. 2015, 23, 102–112. [Google Scholar] [CrossRef] [Green Version]
  70. Liu, J.; Xiong, Y.; Wang, Y.; Luo, T. Soundscape effects on visiting experience in city park: A case study in Fuzhou, China. Urban For. Urban Green. 2018, 31, 38–47. [Google Scholar] [CrossRef]
  71. Jo, H.I.; Jeon, J.Y. The influence of human behavioral characteristics on soundscape perception in urban parks: Subjective and observational approaches. Landsc. Urban Plan. 2020, 203, 103890. [Google Scholar] [CrossRef]
  72. Van Renterghem, T.; Vanhecke, K.; Filipan, K.; Sun, K.; De Pessemier, T.; De Coensel, B.; Wout, J.; Botteldooren, D. Interactive soundscape augmentation by natural sounds in a noise polluted urban park. Landsc. Urban Plan. 2020, 194, 103705. [Google Scholar] [CrossRef]
  73. Axelsson, Ö. How to measure soundscape quality. In Proceedings of the Euronoise 2015, Maastricht, The Netherlands, 31 May–3 June 2015; pp. 1477–1481. [Google Scholar]
  74. Aletta, F.; Kang, J. Soundscape approach integrating noise mapping techniques: A case study in Brighton, UK. Noise Mapp. 2015, 2, 1–12. [Google Scholar] [CrossRef] [Green Version]
  75. Berglund, B.; Nilsson, M.E. On a tool for measuring soundscape quality in urban residential areas. Acta Acust. United Acust. 2006, 92, 938–944. [Google Scholar]
  76. Lavia, L.; Witchel, H.J.; Aletta, F.; Steffens, J.; Fiebig, A.; Kang, J.; Howes, C.; Healey, P.G. Non-Participant Observation Methods for Soundscape Design and Urban Planning. In Handbook of Research on Perception-Driven Approaches to Urban Assessment and Design; Aletta, F., Xiao, J., Eds.; IGI Global: Hershey, PA, USA, 2018; pp. 73–99. [Google Scholar]
  77. Mitchell, A.; Oberman, T.; Aletta, F.; Erfanian, M.; Kachlicka, M.; Lionello, M.; Kang, J. The Soundscape Indices (SSID) Protocol: A Method for Urban Soundscape Surveys—Questionnaires with Acoustical and Contextual Information. Appl. Sci. 2020, 10, 2397. [Google Scholar] [CrossRef] [Green Version]
  78. Jeon, J.Y.; Hong, J.Y.; Lee, P.J. Soundwalk approach to identify urban soundscapes individually. J. Acoust. Soc. Am. 2013, 134, 803–812. [Google Scholar] [CrossRef]
  79. Hong, J.Y.; Jeon, J.Y. Soundscape mapping in urban contexts using GIS techniques. In Proceedings of the INTERNOISE 2014-43rd International Congress on Noise Control Engineering: Improving the World through Noise Control, Melbourne, Australia, 16–19 November 2014. [Google Scholar]
  80. Kang, J.; Aletta, F.; Margaritis, E.; Yang, M. A model for implementing soundscape maps in smart cities. Noise Mapp. 2018, 5, 46–59. [Google Scholar] [CrossRef]
  81. International Organization for Standardization. ISO/TS 12913-3:2019 Acoustics—Soundscape—Part 3: Data Analysis; ISO: Geneva, Switzerland, 2019. [Google Scholar]
  82. International Organization for Standardization. ISO/TS 12913-2:2018 Acoustics—Soundscape—Part 2: Data Collection and Reporting Requirements; ISO: Geneva, Switzerland, 2018. [Google Scholar]
  83. Fastl, H.; Zwicker, E. Psychoacoustics-Facts and Models, 3rd ed.; Springer: Berlin, Germany, 2007. [Google Scholar]
  84. Fiebig, A.; Guidanti, S.; Goehrke, A. Psychoacoustic evaluation of traffic noise. In Proceedings of the NAG-DAGA 2009 Conference, Rotterdam, The Netherlands, 23–26 March 2009. [Google Scholar]
  85. Aletta, F.; Kang, J.; Axelsson, Ö. Soundscape descriptors and a conceptual framework for developing predictive soundscape models. Landsc. Urban Plan. 2016, 149, 65–74. [Google Scholar] [CrossRef]
  86. Papadimitriou, K.D.; Mazaris, A.D.; Kallimanis, A.S.; Pantis, J.D. Cartographic Representation of the Sonic Environment. Cartogr. J. 2009, 46, 126–135. [Google Scholar] [CrossRef]
  87. Vogiatzis, K.; Remy, N. From environmental noise abatement to soundscape creation through strategic noise mapping in medium urban agglomerations in South Europe. Sci. Total Environ. 2014, 482–483, 420–431. [Google Scholar] [CrossRef] [PubMed]
  88. McGregor, I.; Leplâtre, G.; Turner, P.; Flint, T. Soundscape Mapping: A Tool for Evaluating Sounds and Auditory Environment. In Proceedings of the 16th International Conference on Auditory Display (ICAD-2010), Washington, DC, USA, 9–15 June 2010. [Google Scholar]
  89. Marry, S. Assessment of Urban Soundscapes. Organ. Sound 2011, 16, 245–255. [Google Scholar] [CrossRef]
  90. Butler, T. A walk of art: The potential of the sound walk as practice in cultural geography. Soc. Cult. Geogr. 2006, 7, 889–908. [Google Scholar] [CrossRef]
  91. Adams, M.; Bruce, N.; Cain, R.; Jennings, P.; Carlyle, A.; Cusack, P.; Hume, K.; Plack, C. Soundwalking as a methodology for understanding soundscapes. In Proceedings of the Institute of Acoustics Spring Conference 2008, Reading, UK, 10–11 April 2008; pp. 552–558. [Google Scholar]
  92. Aletta, F.; Margaritis, E.; Filipan, K.; Romero, V.P.; Axelsson, Ö.; Kang, J. Characterization of the soundscape in Valley Gardens, Brighton, by a soundwalk prior to an urban design intervention. In Proceedings of the Euronoise Conference 2015, Maastricht, The Netherlands, 31 May–3 June 2015; pp. 1547–1552. [Google Scholar]
  93. Acoustic Map. Mapa Akustyczna. Available online: https://www.olsztyn.eu/urzad-miasta/aktualnosci/article/mapa-akustyczna.html (accessed on 2 May 2018).
  94. Ordinance of the Minister of the Environment of 14 June 2007 on the permissible noise levels in the environment. J. Laws 2014, item 112. Available online: www.infor.pl/akt-prawny/DZU.2014.013.0000112 (accessed on 10 September 2020).
  95. Tuan, Y.-F. Images and Mental Maps. Ann. Assoc. Am. Geogr. 1975, 65, 205–212. [Google Scholar] [CrossRef]
  96. Götz, N.; Holmén, J. Introduction to the theme issue: Mental maps: Geographical and historical perspectives. J. Cult. Geogr. 2018, 35, 157–161. [Google Scholar] [CrossRef] [Green Version]
  97. Bernat, S. Zarządzanie krajobrazem dźwiękowym miast. Prace Kulturoznawcze 2012, 13, 19–30. [Google Scholar]
  98. Oberman, T.; Jambrošić, K.; Horvat, M.; Bojanić Obad Šćitaroci, B. Using virtual soundwalk approach for assessing sound art soundscape interventions in public spaces. Appl. Sci. 2020, 10, 2102. [Google Scholar] [CrossRef] [Green Version]
  99. De Winne, J.; Filipan, K.; Moens, B.; Devos, P.; Leman, M.; Botteldooren, D.; De Coensel, B. The soundscape hackathon as a methodology to accelerate co-creation of the urban public space. Appl. Sci. 2020, 10, 1932. [Google Scholar] [CrossRef] [Green Version]
  100. Pawłowska, K. Dźwięk w krajobrazie jako przedmiot badań i środek wyrazu w sztuce ogrodowej i architekturze krajobrazu. Prace Kulturoznawcze 2012, 13, 31–55. [Google Scholar]
  101. Sztubecka, M.; Skiba, M.; Mrówczyńska, M.; Mathias, M. Noise as a Factor of Green Areas Soundscape Creation. Sustainability 2020, 12, 999. [Google Scholar] [CrossRef] [Green Version]
  102. Malec, M.; Klatka, S.; Kruk, E.; Ryczeket, M. An attempt to assess the impact of vegetation on the soundscape on example two urban parks in Krakow. Acta Sci. Pol. Form. Circumiectus 2017, 16, 167–178. [Google Scholar] [CrossRef] [Green Version]
  103. Szczepańska, A.; Senetra, A.; Wasilewicz-Pszczółkowska, M. The Influence of Traffic Noise on Apartment Prices on the Example of a European Urban Agglomeration. Sustainability 2020, 12, 801. [Google Scholar] [CrossRef] [Green Version]
  104. Brambilla, G.; Maffei, L. Responses to noise in urban parks and in rural quiet areas. Acta Acust. United Acust. 2006, 92, 881–886. [Google Scholar]
  105. Ba, M.; Kang, J. Effect of a fragrant tree on the perception of traffic noise. Build. Environ. 2019, 156, 147–155. [Google Scholar] [CrossRef]
  106. Axelsson, Ö.; Nilsson, M.E.; Hellström, B.; Lundén, P. A field experiment on the impact of sounds from a jet-and-basin fountain on soundscape quality in an urban park. Landsc. Urban Plan. 2014, 123, 49–60. [Google Scholar] [CrossRef] [Green Version]
  107. Peng, J.; Bullen, R.; Kean, S. The effects of vegetation on road traffic noise. In Proceedings of the 2014 INTER-NOISE and NOISE-CON Congress and Conference Proceedings, Melbourne, Australia, 16–19 November 2014. [Google Scholar]
  108. Pathak, V.; Tripathi, B.; Mishra, V. Dynamics of traffic noise in a tropical city Varanasi and its abatement through vegetation. Environ. Monit. Assess. 2008, 146, 67–75. [Google Scholar] [CrossRef] [PubMed]
  109. Nilsson, M.; Klæboe, R.; Bengtsson, J.; Forssén, J.; Hornikx, M.; Van der Aa, B.; Rådsten-Ekman, M.; Defrance, J.; Jean, P.; Koussa, F.; et al. Novel Solutions for Quieter and Greener Cities; HOSANNA, Alloffset AB: Bandhagen, Sweden, 2013. [Google Scholar]
  110. Fan, Y.; Bao, Z.; Zhu, Z.; Liu, J. The investigation of noise attenuation by plants and the corresponding noise-reducing spectrum. J. Environ. Health 2010, 72, 8–15. [Google Scholar] [PubMed]
  111. Önder, S.; Akay, A. Reduction of Traffic Noise Pollution Effects by Using Vegetation. J. Eng. Econ. Dev. 2015, 2, 23–35. [Google Scholar]
  112. Yasin, I.; Widaryanto, L.H.; Sutrisno, W. The technique of green belt bamboo constructions for highway noise effect reductions. J. Phys. Conf. Ser. 2020, 1456, 012006. [Google Scholar] [CrossRef] [Green Version]
  113. Kragh, J. Road Traffic Noise Attenuation by Belts of Trees. J. Sound Vib. 1981, 74, 235–241. [Google Scholar] [CrossRef]
Figure 1. Location of Poland, region of Warmia and Mazury, city of Olsztyn, and the selected parks.
Land 10 00066 g001
Figure 2. Vegetation in the Jakubowo park in two periods. Leafless (April 2018) and leafy period (May 2018).
Land 10 00066 g002
Figure 3. Location of the analyzed parks in the city center, and spatial analysis of the park surroundings in relation to noise sources.
Land 10 00066 g003
Figure 4. Acoustic map within boundaries of the Jakubowo park. Source: Own elaboration based on Acoustic Map of Olsztyn [93].
Land 10 00066 g004
Figure 5. Results of evaluation of the soundscape (SPL measurements and characteristic sounds) presented in a map of the Jakubowo Park in the leafless and leafy period. Traffic is the main source of noise. In the leafless period, point 32 is the quietest, and point 52 is the loudest. In the leafy period, point 23 is the quietest, and point 52 is the loudest. Characteristic sounds in the leafless and leafy period are described as pictograms for points 5, 19, 23, and 24.
Land 10 00066 g005
Figure 6. SPL measurements in dBA—Jakubowo Park.
Land 10 00066 g006
Figure 7. Mental map of the Jakubowo Park. Respondents identified noisy spaces (red) and noise-free and positive-sounding spaces (green).
Land 10 00066 g007
Figure 8. Acoustic map within the boundaries of the Kusocińskiego Park. Source: Own elaboration based on Acoustic Map of Olsztyn [93].
Land 10 00066 g008
Figure 9. Results of evaluation of the soundscape (SPL measurements and characteristic sounds) presented in the map of the Kusocińskiego Park in the leafless and leafy period. The loudest area is located near Dworcowa Street and the Aquasfera Water Recreation and Sports Center. The characteristic sounds are described by pictograms in points 8, 13, 15, and 21.
Land 10 00066 g009
Figure 10. SPL measurements dBA—Kusocińskiego Park.
Land 10 00066 g010
Figure 11. Mental map of the Kusocińskiego Park. Respondents identified noisy spaces (red) and noise-free and positive-sounding spaces (green).
Land 10 00066 g011
Figure 12. Acoustic map within the boundaries of the Podzamcze Park. Source: Own elaboration based on Acoustic Map of Olsztyn [93].
Land 10 00066 g012
Figure 13. Results of evaluation of the soundscape (SPL measurements and characteristic sounds) presented in the map of the Podzamcze Park in the leafless and leafy period. The loudest areas are located on busy streets and near the car park. In the leafless period, point No. 23 is the quietest, and point No. 28 is the loudest. In the leafy period, points 4, 5, and 23 are the quietest, and point No. 30 is the loudest. Characteristic sounds are described by pictograms for points 1, 8, 13, 14, 23.
Land 10 00066 g013
Figure 14. SPL measurements dBA—Podzamcze Park.
Land 10 00066 g014
Figure 15. Mental map of the Podzamcze Park. Respondents identified noisy spaces (red) and noise-free and positive-sounding spaces (green).
Land 10 00066 g015
Figure 16. Model example for the Jakubowo park: a plant barrier solution in different zones depending on the distance from the main street, and introduction of positive sounds. Source: authors.
Land 10 00066 g016
Table 1. Basic characteristics of the examined parks.
NoParkLocation in the CityTotal Area (ha)Forms of GreeneryTypePark’s Equipment
1JakubowoNorthern part of the center9.3Including a part of City Forest, old trees, greenery of 2 nature reservesRecreation and sports area Archeological sites, bicycle paths, hiking trails, rope park, tennis court, forest stadium
2KusocińskiegoCentral East17.4Abundance of high vegetation and lawn surface, shrubs, addition of perennialsRecreation and leisure function Fountain, two ponds, skate park
3PodzamczeHistoric center8.6Old trees, aquatic vegetation on the banks of water reservoirs, river, plant compositions in representative placesRecreation and historic function near Lyna River, known as castle park Numerous sculptures, fountains, waterfall, bust of Nicolaus Copernicus (from 1916)
Table 2. Numbers of characteristic points selected for Test I/a, and I/b.
ParkNo. of Points Selected for Test I/a
(No. of Points Selected for Test I/b)
Selected Points in Parks for Test I/b
Jakubowo (JP)58(4)5, 19,23, 24
Kusocińskiego (KSP)54(4)8,13,15, 21
Podzamcze (PP)38(5)1, 8, 13, 14, 23
Publisher’s Note: MDPI stays neutral with regard to jurisdictional claims in published maps and institutional affiliations.

