
Land Use Optimization and Simulation of Low-Carbon-Oriented—A Case Study of Jinhua, China

1
College of Geoscience and Surveying Engineering, China University of Mining & Technology (Beijing), Beijing 100083, China
2
China Institute of Geo-Environment Monitoring, Beijing 100081, China
*
Author to whom correspondence should be addressed.
Land 2021, 10(10), 1020; https://0-doi-org.brum.beds.ac.uk/10.3390/land10101020
Submission received: 26 August 2021
/
Revised: 23 September 2021
/
Accepted: 24 September 2021
/
Published: 28 September 2021
(This article belongs to the Special Issue Land Use Conflict Detection and Multi-Objective Optimization Based on the Productivity, Sustainability, and Livability Perspective)
Abstract
:Land-use change is an important contributor to atmospheric carbon emissions. Taking Jinhua city in eastern China as an example, this study analyzed the effects on carbon emissions by land-use changes from 2005 to 2018. Then, carbon emissions that will be produced in Jinhua in 2030 were predicted based on the land-use pattern predicted by the CA-Markov model. Finally, a low-carbon optimized land-use pattern more consistent with the law of urban development was proposed based on the prediction and planning model used in this study. The results show that (1) from 2005 to 2018, the area of land used for construction in Jinhua continued to increase, while woodland and cultivated land areas decreased. Carbon emissions from land use rose at a high rate. By 2018, carbon emissions had increased by 1.9 times compared to 2015. (2) During the 2010–2015 period, the total concentration of carbon emissions decreased due to decreases in both the rate of growth in construction land and the rate of decline in a woodland area, as well as an adjustment of the energy structure and the use of polluting fertilizer and pesticide treatments. (3) The carbon emissions produced with an optimal land-use pattern in 2030 are predicted to reduce by 19%. The acreage of woodland in Jinhua’s middle basin occupied by construction land and cultivated land is predicted to reduce. The additional construction land will be concentrated around the main axis of the Jinhua-Yiwu metropolitan area and will exhibit a characteristic ribbon-form with more distinct clusters. The optimized land-use pattern is more conducive to carbon reduction and more in line with the strategy of regional development in the study area. The results of this study can be used as technical support to optimize the land-use spatial pattern and reduce urban land’s contribution to carbon emissions.
1. Introduction
As human social and economic activities consume large amounts of resources, the concentration of greenhouse gas emissions produced is growing rapidly. The resulting climate warming problem has become a global issue that is critically related to the sustainable development of human society. The International Energy Agency (IEA) [1] showed that, in the past 30 years, the total carbon emissions produced in China have continued to rise. By 2018, the total carbon emissions had reached 9.5 billion tons. This concentration is still rising, albeit at a low speed, so the peak value of carbon emissions has not yet been reached. Therefore, in September 2020, at the United Nations General Assembly, China renewed its commitment to increase its intended nationally determined contributions and strive to achieve peak carbon dioxide emissions by 2030. “To widely promote green ways of working and living and to reduce carbon emissions placidly after peaking” [2] was listed as one of the important Chinese economic and social development goals for the 14th Five-Year period.
As the natural carrier of carbon emissions from terrestrial ecosystems and the spatial carrier of emissions from human economic and social carbon activities [3], land use is closely related to atmospheric carbon emissions. The fifth assessment report of the Intergovernmental Panel on Climate Change (IPCC) shows that land-use change accounts for about one-third of manmade carbon emissions, and land-use changes play an important role in the increase in the global atmospheric carbon dioxide concentration [4]. Choices regarding land-use structure by humans significantly impact atmospheric greenhouse gas emissions [5]. Determining how to adjust spatial patterns of land use to achieve carbon emission reduction targets is currently a research hotspot. Houghton et al. [6] summarized and analyzed 13 methods for calculating net carbon emissions caused by land-use changes. Lai [3] researched the mechanisms, characteristics, and factors contributing to the production of carbon emissions due to land-use changes in China over the past 20 years. Meanwhile, a comprehensive inventory of carbon emissions produced through land use based on land use type was developed, and a linear programming model was used to optimize land use planning to reduce carbon emissions. Liu et al. [7] constructed the LUCC (Land Use and Land Cover Change)-climate-ecosystem research system to study the effects of land-use changes on the global climate, and their results can help to determine the impacts of large-scale LUCC factors on climate change through the initiation of a budget change regarding greenhouse gases and through changes in land surface and atmosphere processes. Zhu et al. [8] developed a land-use and land-cover transfer matrix based on digital land use maps and then assigned a carbon density score to each land-use type. Finally, they quantified the spatio-temporal patterns of LUCC carbon emissions produced from 1970 to 1990 and from 1990 to 2010 in Zhejiang Province. Yang et al. [9] researched the characteristics of spatio-temporal variation in carbon storage for different land-use spatial patterns using two different scenarios in the Yellow River Basin based on the CA–Markov model and the carbon storage module of the InVEST model.
Most studies in this field have focused on analyzing and evaluating the effects of carbon emissions produced with various land-use patterns. Li et al. [10] analyzed the effects of land use patterns on carbon emissions in Jiangsu province. Zhao et al. [11] measured and analyzed the effects of land uses on carbon emissions and their spatial patterns in the Hunan province. Sun et al. [12] estimated the carbon emission intensity on land-use patterns of 31 provinces in China, revealing its rules of spatial-temporal evolution and discussing its spatial association at provincial scale with the methods of spatial autocorrelation. The law of carbon emissions produced with land-use changes and existing problems in different areas have been revealed clearly. However, a few studies have forecasted the variation trend in future carbon emissions from the perspective of the spatiotemporal pattern of land use and predicted the optimized land-use pattern with the consideration of planning objectives.
This study used Jinhua City as an example. The aim here was to provide a theoretic basis for optimization of the territorial spatial pattern and to help carbon dioxide emissions reach their peak:
- (1)
- the carbon emissions produced from land use and the transfer matrix of land use were calculated. Based on this, an explicit carbon flow model was used to calculate carbon transfer between different land-use types. It contributed to revealing the spatio-temporal variation rules of land-use carbon emissions.
- (2)
- we simulated the land-use spatial pattern that will be present in Jinhua under a natural change scenario in 2030 using the CA–Markov model and predicted the carbon emission change characteristics. Based on this, suggestions for carbon emission reduction from the perspective of land-use change can be proposed.
- (3)
- the low-carbon quantitative structure obtained from multiple linear programming models and optimization-oriented driving factors were added to the FLUS model to optimize the land-use spatial pattern in Jinhua in 2030. The simulation results meet both the requirements of urban development and carbon emission reduction, providing a reference for the future green development of land use in Jinhua city.
2. Study Area
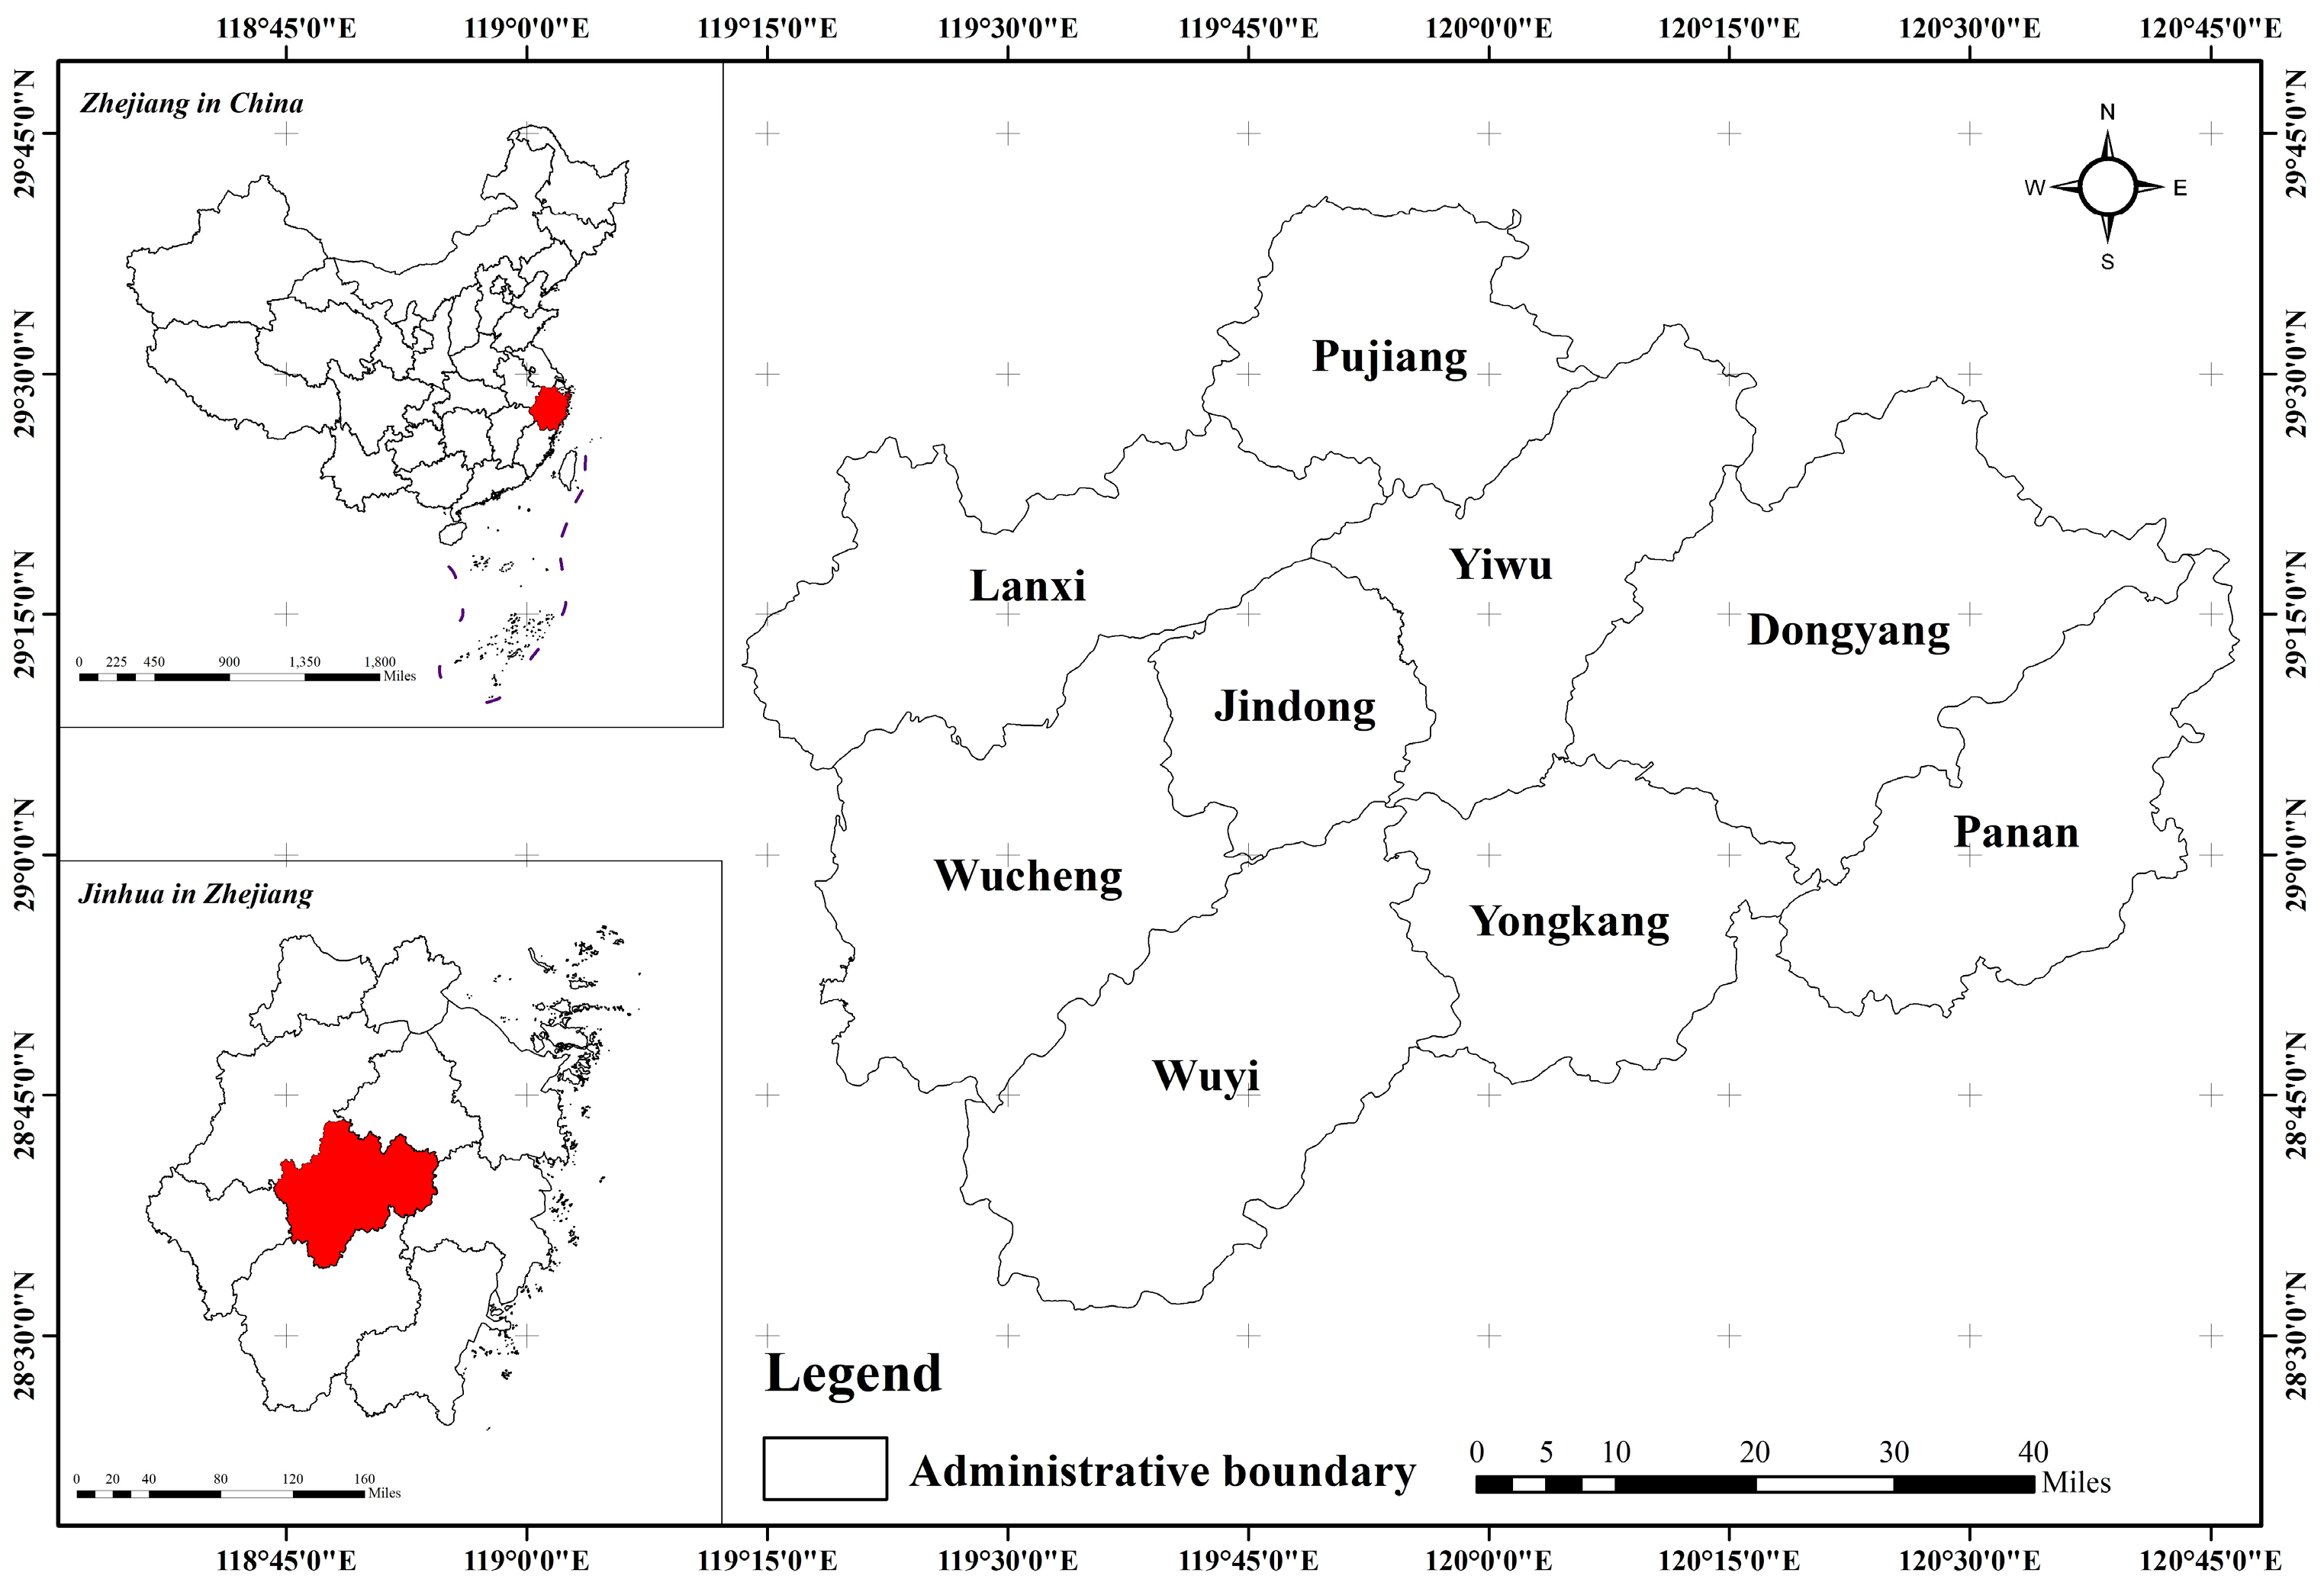
This study used Jinhua City, which is located at the intersection of Dongyang River, Wuyi River, and Jinhua River (Figure 1), as an example. Jinhua is adjacent to Taizhou in the east, Lishui in the south, Hengzhou in the west, and Shaoxing and Hangzhou in the north. Jinhua is surrounded by three mountains and contains three rivers. Most of the mountains in Jinhua are 500–1000 m high, distributed on the north and south sides. The terrain is high in the north and south while low in the middle. The total land area of Jinhua was 10,942 . The population was approximately 0.71 million [13], and its GDP was CNY 4703.95 billion in 2020 [14]. As one of the important bases for advanced manufacturing industries south of the Yangtze River Delta and the central city of the central Zhejiang urban agglomeration, Jinhua’s economy has been developing rapidly and relies on large-scale professional trading markets such as Yiwu International Trade City and Yongkang Hardware Technology City. National strategies, such as the integrated development of the Yangtze River Delta, have brought unprecedented opportunities for development here. However, in recent years, problems such as the extensive utilization of land resources, unscientific spatial layout, and low-performance level have emerged, leading to a massive expansion of construction land to provide land guarantees for economic construction. As of 2020, the total urban and rural land area exceeded that outlined in the planning objectives, and the per capita land acreage far exceeded the upper limit set by the national standard. A series of ecological and environmental problems have also emerged, including air pollution and intensification of the urban greenhouse effect. Therefore, the aim of this study was to explore the law of land-use carbon emissions in Jinhua City and to predict and optimize the future spatial land-use pattern. The research results could have significant benefits in terms of providing suggestions for reaching the carbon peak, which is vital for promoting progress in ecological civilization in Jinhua City.
3. Materials and Method
3.1. Data Acquisition
The data sets used in this study were as follows: (1) land use and cover raster images (30 m) in 2005, 2010, 2015, and 2018 from Data Center for Resources and Environmental Sciences, Chinese Academy of Sciences (RESDC) [15], which were reclassified into six categories of cultivated land, woodland, grassland, water area, construction land, and unused land based on the Land-Use and Land-Cover Change (LUCC) classification system; (2) population density data in 2018 from Worldpop project data sets and Gross Domestic Product (GDP) distribution data in 2015 from the Resource and Environment Data Center of the Chinese Academy of Sciences; and (3) data on energy consumption and agricultural material use including pesticide, chemical fertilizer, and agricultural film from 2005–2018 from Jinhua Statistical Yearbooks of corresponding years. The calculation parameters related to energy consumption were taken from the 2006 IPCC National Greenhouse Gas Inventory Guidelines and the General Principles for the Calculation of total Production Consumption.
3.2. Methodology
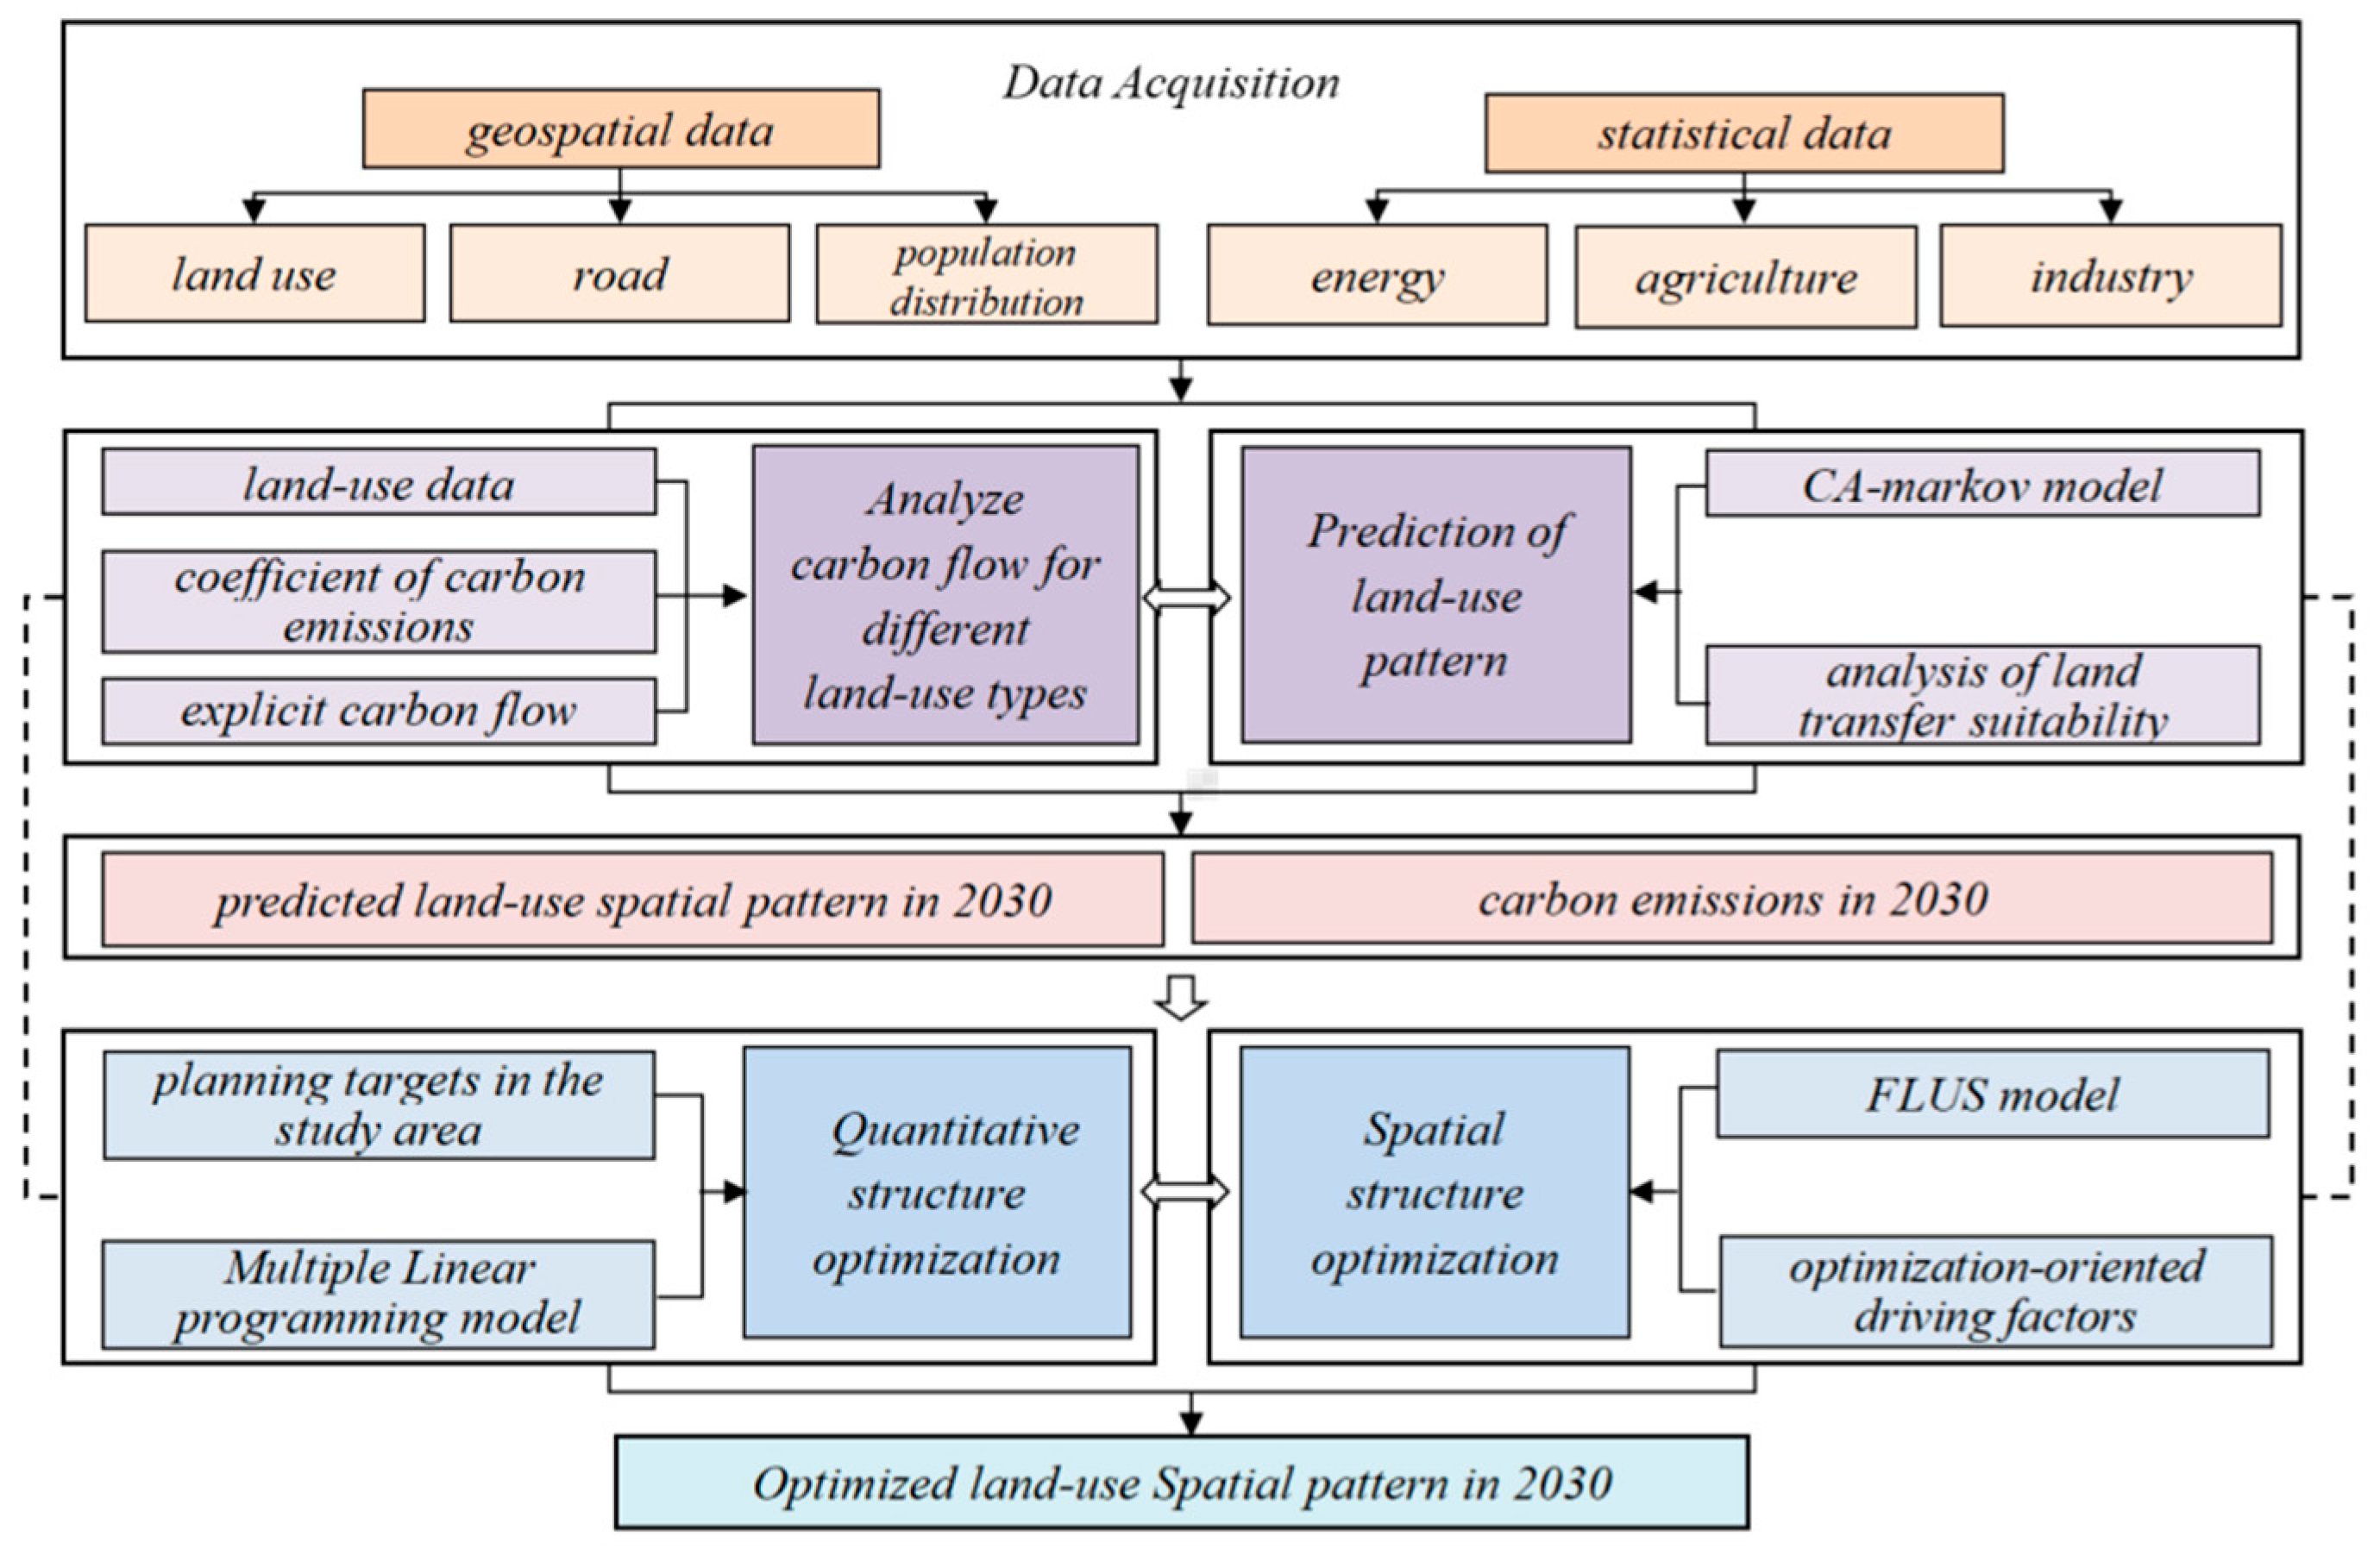
The aim of this study was to contribute to optimizing the spatial pattern of land use under the guidance of low carbon. We used the carbon emissions estimation model and land-use change forecast model. With the consideration of low-carbon objectives and strategies for regional development, the optimized land-use spatial pattern in 2030 in Jinhua was obtained (Figure 2).
3.3. Accounting Model Used to Assess “Carbon Flow”
3.3.1. Calculation of Carbon Emissions
(1) To determine the carbon emissions produced from construction land, this study mainly considered the carbon emissions produced through energy consumption by the industrial and mining enterprises and the transportation industry. In accordance with the reference method proposed in the 2006 IPCC Guidelines for National Greenhouse Gas Inventories, the carbon emissions from construction land were calculated as follows:
where represents the quantity of standard coal converted from every kind of energy source (); represents the consumption of every kind of energy (); and represents the standard coal conversion coefficient from each energy source (),
where represents the standard coal emission factor (); represents the carbon content of fossil energy (); represents the carbon oxidation factor; is the carbon content per molecule (); is the unit conversion factor; and 29.3076 () is the low calorific value of standard coal per kg according to the general rules of the GB/T2589-1990 comprehensive energy consumption calculation.
For cultivated land, because carbon emissions are produced over a long time scale, changes in crop yield have little impact on carbon absorption and emissions by the ecosystem [16]. Thus, only human-induced carbon emissions from agricultural activities were considered. This included carbon emissions caused by the powering of agricultural machinery, through the use of fertilizers and pesticides, and through agricultural irrigation. In accordance with Tristram O West [17] and the Institute of Agricultural Resources and Eco-Environment Performance of Nanjing University, the carbon emissions produced from cultivated land were calculated as follows:
where represents the consumption of nitrogen fertilizer; represents the consumption of phosphate fertilizer; represents the consumption of potassium fertilizer; are conversion coefficients of types of fertilizer; represents the total power needed for agricultural machinery; represents the consumption of pesticides; represents the consumption of agricultural film; represents the area of agricultural irrigation; represents the area of crop planting; and are conversion coefficients.
(2) Carbon emissions from other land-use types were calculated using the following direct carbon emission coefficient method:
where represents the carbon emissions produced from different land-use types; represents the area taken up by each land-use type; and represents the carbon emission coefficient of each land-use type.
In terms of the carbon emission coefficients of woodland and grassland, based on the fact that the main vegetation type present in Jinhua is evergreen coniferous forest mixed with a small amount of evergreen broad-leaved forest [18], we referred to the relational expression from the research results of Fang et al. [19] and Lai [3] and selected −0.374 tC/ha∙a as the carbon emission coefficient for woodland in Jinhua and −0.021 t/ha∙a as the carbon emission coefficient of grassland.
Regarding the water carbon emission coefficient, according to the research results of Duan et al. [20], the carbon sink capacity of the lake wetland in the Eastern Lake Area where Jinhua is located is −0.567 tC/ha∙a. According to the research results of Lai Li, the carbon sink capacity of the tidal flat is −0.236 tC/ha∙a. The secondary classification of waters in the LUCC classification system includes lakes, rivers, canals, reservoirs, ponds, tidal flats, and beaches. For comprehensive consideration of the carbon sink capacity of different types of water and the average carbon sink capacity of waters across the country, the carbon sink coefficient of the study was taken as −0.28 tC/ha∙a [21].
Regarding the carbon emission coefficient of unused land, unused land includes sandy land, Gobi, saline-alkali land, marshland, bare land, and bare rock land. Among these, the carbon emissions are low except for swamps, which have a strong carbon sink capacity. In accordance with the research results of Lai [3], the carbon sink coefficient was taken as −0.005 tC/ha∙a.
3.3.2. Analysis of Carbon Flow for Different Land-Use Types
In order to better explore the law of carbon transfer between different land-use types and evaluate the impacts of carbon emissions from land-use changes more accurately, an explicit carbon flow model was introduced [22]:
where represents the transfer of carbon from land type to land type ; is defined as the carbon metabolism density during the process of conversion from land type to land type represents the acreage over which the conversion occurs and represent the carbon flow density of land type and the land type respectively, which is equivalent to the land carbon emission coefficient. and represent the carbon flow of land type and the land type , respectively, which is equivalent to the land carbon emissions. If , the land type conversion is a positive process with an increase in the carbon sink. If , the land type transfer is a negative process with a reduction in the carbon sink or an increase in carbon emissions.
3.4. CA–Markov Model
3.4.1. Principles of the CA–Markov Model
The Markov chain model is a Markov model with a discrete time and state. It is often used to analyze the law of land-use changes. Cellular Automaton (CA) can be used to simulate the process of natural changes with the influence of the surrounding space. In this study, CA was utilized to simulate changes in any pixels in the land-use image affected by the state of themselves and their neighboring pixels.
The traditional Markov model has difficulty predicting spatial changes in land-use patterns. The CA model focuses on partial interactions between cells, which has obvious limitations [23]. The CA–Markov model has the advantages of both the Markov model and the Cellular Automata, as spatial neighboring elements and rules of spatial distribution conversion are added to the Markov chain model. It can be used to predict spatial changes of the land-use pattern with full consideration of spatial parameters.
3.4.2. Prediction Process Used by the CA–Markov Model
The CA–Markov module in IDRISI systematically integrates the Markov chain model with the CA model. The Multi-Criteria Evaluation module can be used for the prediction of land-use spatial patterns and the analysis of land transfer suitability. We simulated the land-use pattern with the following steps:
- (1)
- First, earlier and later land-use images were input into the Markov module to construct a probability matrix of conversion between different land-use types.
- (2)
- Then, we analyzed the land transfer suitability. This study mainly analyzed the suitability of the spatial distribution of construction land, because the expansion of construction land is fast and is greatly affected by human factors. First, we selected the driving factors. The driving factors include constraints and influencing factors. Constraints are expressed in the form of Boolean maps in which areas to be excluded from consideration have the value 0 and those to be considered have the value 1. Here we set existing construction land, water, and nature reserve as constraints. Water includes lake, river, beach, reservoir, and pit. Nature reserve includes ecosystem type reserves, biological species reserves, and natural heritage reserves. Influencing factors enhance or detract from the suitability of a location for the objective. All influencing factor images must be measured on the same scale. In this study, the scale 0–255 is used where 0 is not at all suitable and 255 is perfectly suitable. Then the weights of the influencing factors are produced follows the logic under the Analytical Hierarchy Process (AHP). That is, we should provide a series of pairwise comparisons of the relative importance of factors to the suitability of pixels for the activity being evaluated. (Table 1). Second, the constraints were transformed into a binary image. That is, areas with a construction land spatial distribution probability of zero were assigned a value of 0. The factors were transformed into standard data in the range of 0–255 using the Fuzzy module, and the fuzzy set membership function was applied to evaluate the effects of factors on suitability. Finally, the MCE module was used to generate a construction land transition suitability image.
- (3)
- Finally, the land-use spatial pattern in 2030 was predicted. We selected default 5 × 5 filters as the neighborhood scale, which is suitable for most simulation processes to ensure accuracy and also avoid running the simulation too far into the future. Then the number of iterations was set to 8. Land-use images from 2000 and 2010 were regarded as earlier and later images, respectively. We input the land-use transfer matrix and Transition suitability image collection so that we obtained a predicted land-use image for 2018. Then, the Crosstab module was applied to compare this with the actual image of land use in 2018 to get a kappa coefficient of 0.9243, indicating that the simulation effect was good. Therefore, the actual land-use image in 2018 could be served as the early image to simulate the land-use image in 2030 using the method above.
3.5. Low-Carbon Optimization Model of Land Use
3.5.1. Multiple Linear Programming Model
Linear programming is a mathematical method that is used to solve the extremum of a linear objective function under constrained conditions. It provides a scientific basis for the rational utilization of limited resources. In this study, the carbon emission calculation model was added to the multivariate linear programming model to achieve the goal of minimizing carbon emissions. The constraint conditions were set according to the actual situation in the study area. The general linear programming model used was as follows:
where represents the total carbon emissions; represents the carbon emission intensity of different land types; and represents the decision variable, that is, the acreage of different land types.
With the goal of minimizing carbon emissions from land use in Jinhua by 2030, a multiple linear programming model was built. Cultivated land, woodland, grassland, water area, construction land, and unused land were selected as decision variables , and the carbon emission coefficient from land use in 2018 was selected as The planning model developed was as follows:
For the selection of decision variable constraints, we mainly referred to the Fourteenth Five-Year Plan and Long-Range Objectives Through the Year 2035 (hereinafter referred to as the Outline), National Land Planning Outline 2016–2030 (hereinafter referred to as the Plan) with consideration of Jinhua’s socio-economic development and status of land-use. The specific constraint conditions are as follows:
- (1)
- With the rapid development of the economy and the acceleration of urbanization in Jinhua, it is inevitable that the areas of cultivated land and woodland will reduce due to the expansion of construction land. So, it is necessary to strengthen the protection of cultivated land resources, strictly maintain the red line of cultivated land, and strictly control the use of cultivated land for non-agricultural construction. The national cultivated land reserves in 2020 and 2030 should not be less than 1.865 billion mu and 1.825 billion mu, respectively. Therefore, the annual rate of decrement in cultivated land should not exceed 0.2%.
- (2)
- Since 2005, the area of woodland in Jinhua was in a state of negative growth. In order to prevent woodland from becoming occupied without limit, the annual rate of decrement in woodland should not be greater than the rate of decrement over the last decade (0.31%), which was set as the lower limit. In addition, the Plan points out that the national forest coverage rate is predicted to increase from 21.66% in 2015 to more than 24% by 2030. To achieve this goal, the annual rate of growth in woodland areas needs to reach 1%. This represents the ideal state of land conversion in Jinhua, so it was set as the upper limit.
- (3)
- The acreage of water, grassland, and unused land have been decreasing to varying degrees over the last 10 years. The Plan points out that it is necessary to strengthen the protection and restoration of water source conservation areas to consolidate the achievements related to the grain for green and the return of farmland to lake strategies. Therefore, the annual rate of deceleration in grassland, water, and unused land areas should not exceed the deceleration rate from the past decade.
- (4)
- In the past decade, the annual GDP growth rate in Jinhua was close to 10%, and the annual population growth rate over the past ten years was 2.78% according to the seventh census. This led to a rapid expansion of construction land. The Outline points out that we will continue to promote economic construction. Thus, the area of construction land will inevitably continue to increase in the future. At the same time, intensive and economic use of land should be strengthened. The Plan points out that the land-use intensity in 2030 should be restricted to 4.62% based on a level of 4.02% in 2015. Thus, the growth rate of the construction land area should be capped at 0.93% with consideration of the socio-economic situation present in Jinhua.
According to the analysis above, we set the following constraint conditions for the decision variables set:
3.5.2. Low-Carbon Space Optimization
The FLUS model is used to simulate changes and future patterns of land use, which can aid in spatial optimization and assist decision-making [24]. The model uses the artificial neural network (ANN) to calculate the transition probability of each land type and then integrates the system dynamics model (SD) and the Cellular Automaton model (CA) for further analysis. The self-adaptive inertia and competition mechanism are used in the CA model to deal with complex competition and interactions between different land-use types [25]. In this study, the low-carbon land-use allocation plan was used as the quantitative target for land-use type change in the FLUS model. After that, with the consideration of planning targets in the study area’s territorial space, we added the following optimization-oriented driving factors (Table 2): First, the probability of land around the main axis of the Jinhua-Yiwu metropolitan area converting to construction land was improved by taking the Jinhua-Yiwu Expressway as a driving factor in order to promote the intensive use of land resources. Second, the hilly area in the central basin was taken as a constraint in order to create a green ecological zone in the central basin area. Through the above method, the spatial pattern of land use after low-carbon optimization was simulated.
4. Results
4.1. Spatio-Temporal Patterns of Land Use in Jinhua
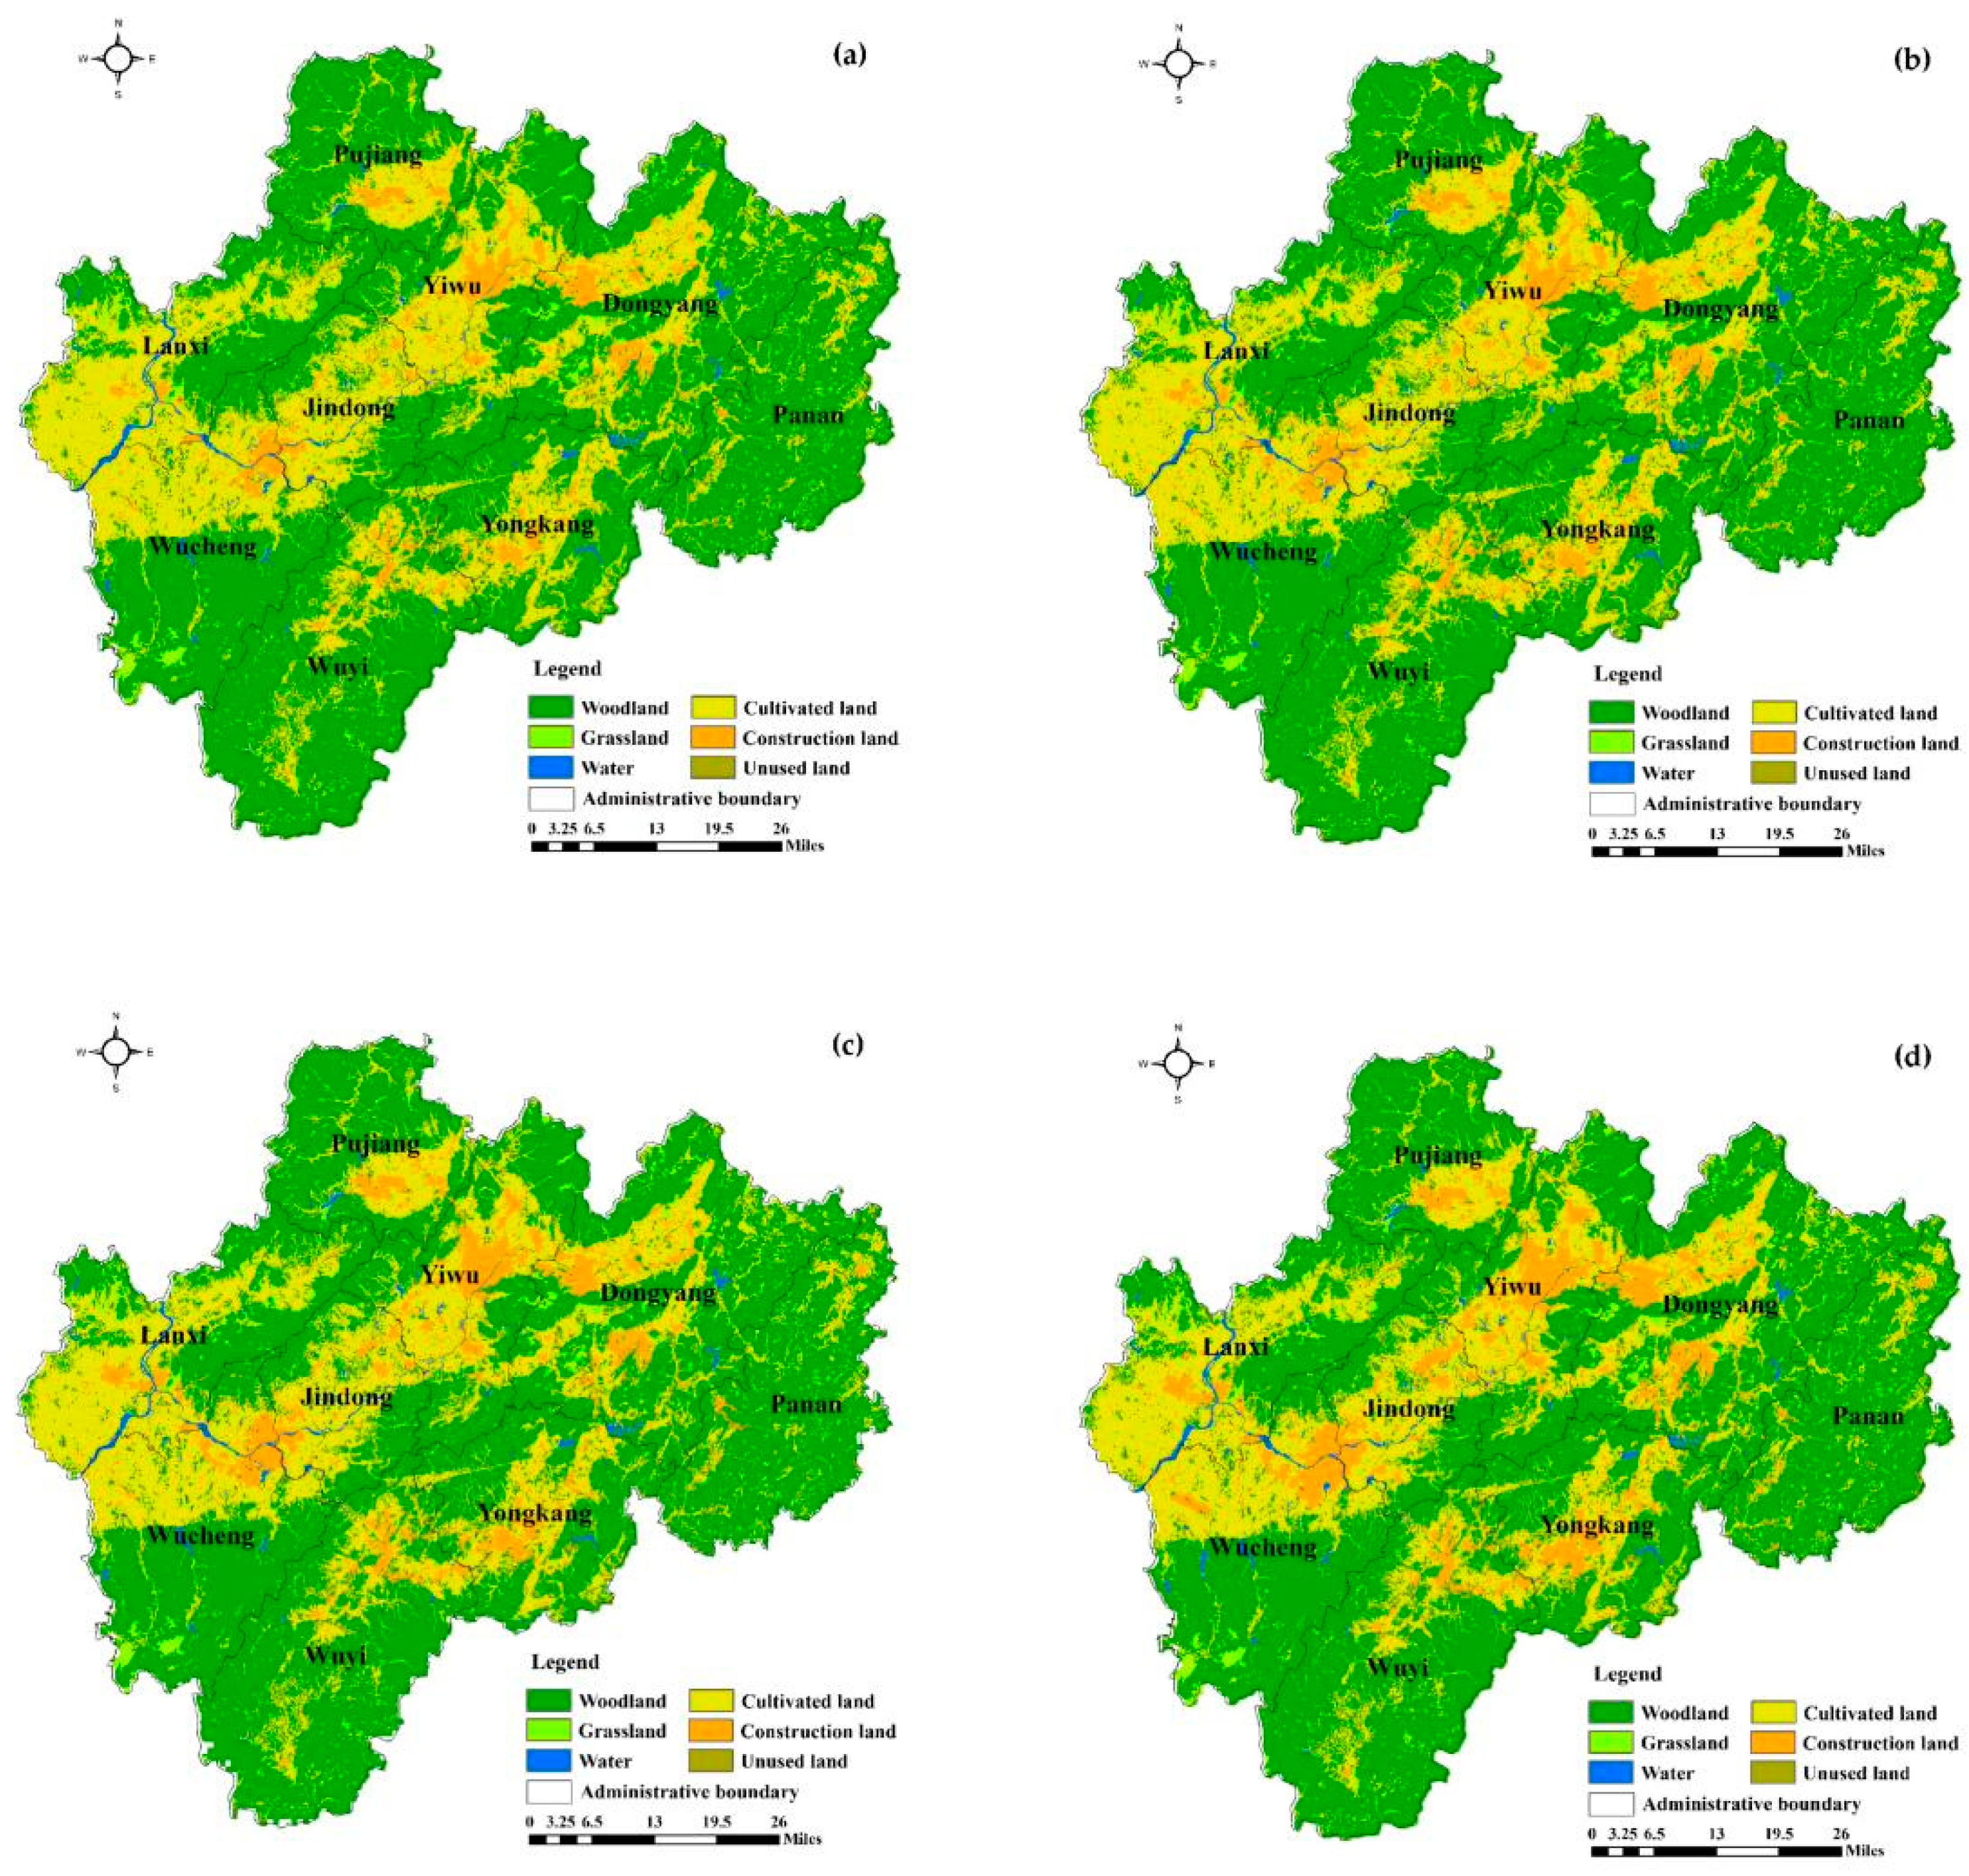
According to the land-use images from 2005 to 2018 (Figure 3), transfer matrix and area changes of different land-use types in Jinhua City were obtained (Table 3, Table 4, Table 5 and Table 6). During the 2005–2018 period, the main land-use type present in Jinhua City was woodland, followed by cultivated land. During three periods, 2005–2010, 2010–2015, and 2015–2018, the total land transfer area gradually increased, reaching a maximum of 58,554 ha in the third period. This area was much larger than that present in the first two periods, indicating that the degree of land use evolution in the study area has intensified in recent years. A total of 34.6% of the converted land area represented the transfer-out of construction land, and 31.9% represented the transfer-in of cultivated land. Other land types also changed to different degrees. The acreage of cultivated land continued to decrease at a relatively stable rate, and the proportion converted to woodland increased, while the proportion converted to construction land decreased, thanks to the Grain for Green strategy. The acreage of woodland continued to decrease, with the decrement rate being the smallest in 2010–2015 and the largest in 2015–2018: 0.03% and 0.61% respectively. The area converted from woodland to cultivated land gradually increased. The acreage of construction land continued to grow rapidly. More than 80% of new construction land came from the transfer of cultivated land. The growth rate of construction land declined slightly from 2010 to 2015, but after 2015, it entered a period of rapid expansion and the proportion of woodland occupation increased correspondingly. The acreage of water and grassland changed from positive growth to negative growth after 2010 with increases in the decrement rates. As a whole, cultivated land and woodland gradually reached a balance between occupation and compensation from 2005 to 2018. However, the expansion rate of construction was high, which seriously reduced the space of the areas absorbing carbon such as woodland, grassland, and water.
4.2. “Carbon Flow” of Land-Use in Jinhua
Through calculations, the land-use carbon sinks, carbon sources, and total carbon emissions from Jinhua City from 2005 to 2018 were determined (Table 7). From 2005 to 2018, the total carbon emissions first decreased and then increased. The growth rate reached up to 121.3% from 2005 to 2010, and there was slight negative growth from 2010 to 2015 when carbon emissions reduced by 4.3%. The growth rate of carbon emissions from 2015 to 2018 was 35.7%, a significant slow down when compared with the first stage. As for the main carbon sources, the average carbon emission intensities of cultivated land and construction land were 6.1% and 13.9% lower, respectively, in 2018 compared to 2005.
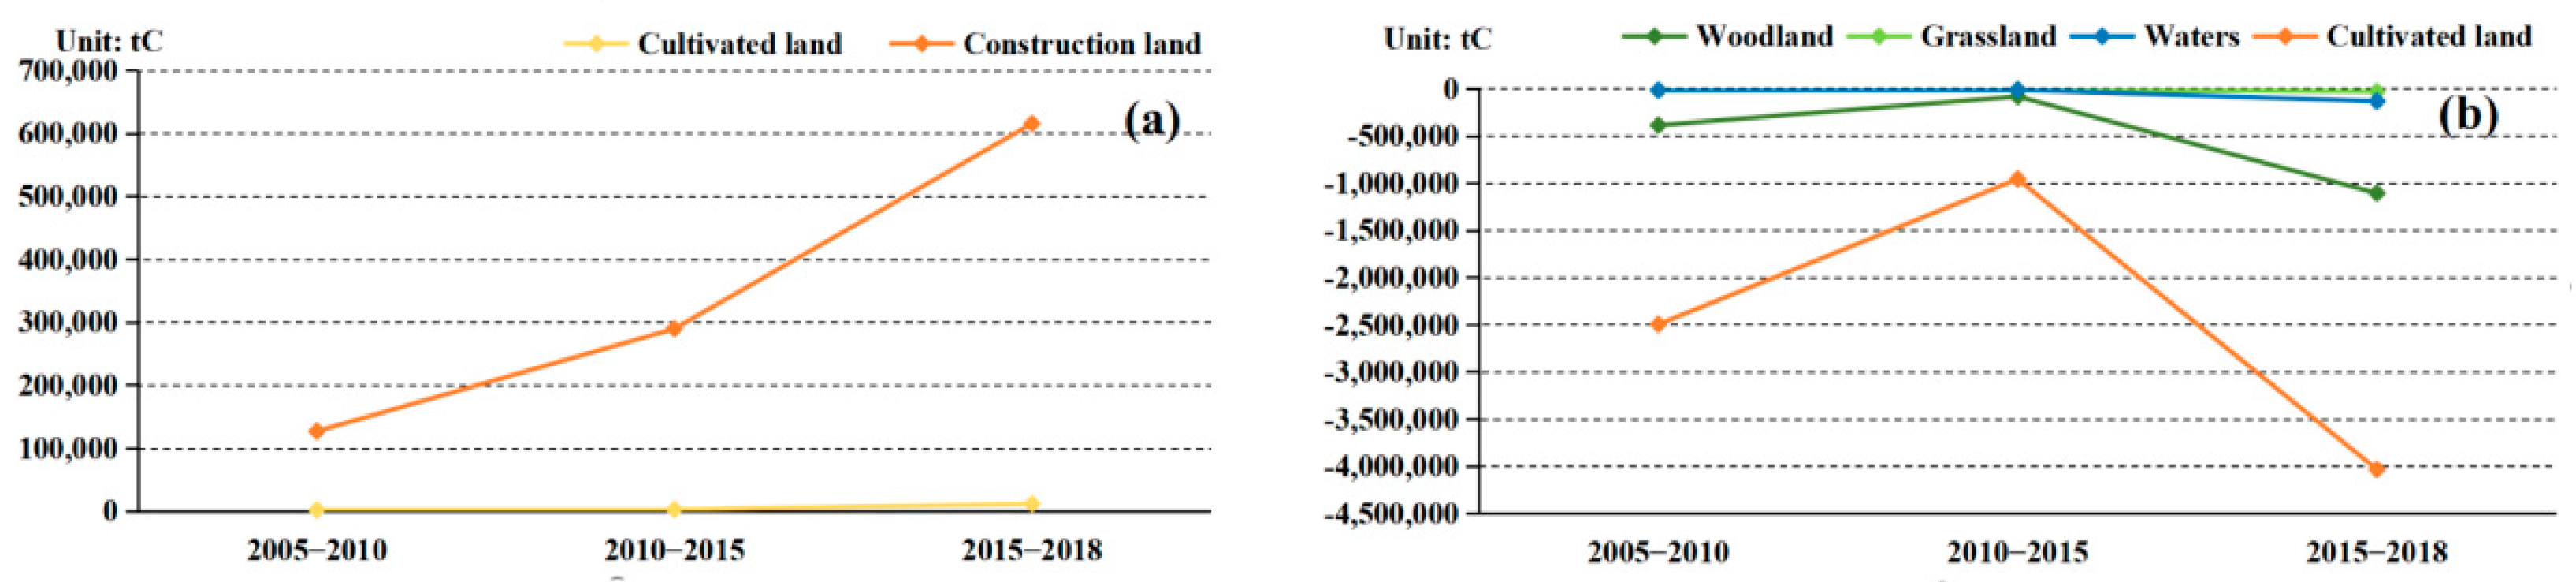
Through the explicit carbon flow model, the law of carbon transfer between different land-use types in Jinhua from 2005 to 2018 was determined (Table 8, Figure 4). The results show that the carbon flow was negative in all three periods, which had an adverse effect on the reduction of regional carbon emissions. The positive carbon flow achieved in the process of land transfer has mainly come from the carbon sink formed by the conversion of construction land to other land types. This accounts for more than 98% of the positive carbon flow. Secondly, the positive carbon flow caused by the transfer of construction land continued to grow at a high rate. This indicates that the restoration of brownfield land and the construction of green mines in Jinhua have made a difference to ecological civilization construction. Negative carbon flow has mainly come from the carbon emissions generated by the conversion of other land-use types to construction land. During the period from 2010 to 2015, due to using clean energy sources instead of high-pollution and high-carbon emission energy sources and the treatment of pesticide and fertilizer pollutants, the carbon emission intensity of construction land and cultivated land was under control. Thus, the level of negative carbon flow was low and reached a minimum value. After that, the negative carbon flow started to increase at a high speed. Overall, during the 2005–2018 period, although the positive carbon flow gradually increased, the amount of negative carbon flow was always much greater than the amount of positive flow, indicating that the problem of extensive construction land expansion and the corresponding increase in negative carbon flow still existed. Thus, the spatial pattern of land use was not yet optimal. This shows that if the land-use spatial pattern continues to develop according to the current evolution law, the imbalance in regional carbon metabolism will be further aggravated.
4.3. Prediction of the Land-Use Spatial Pattern
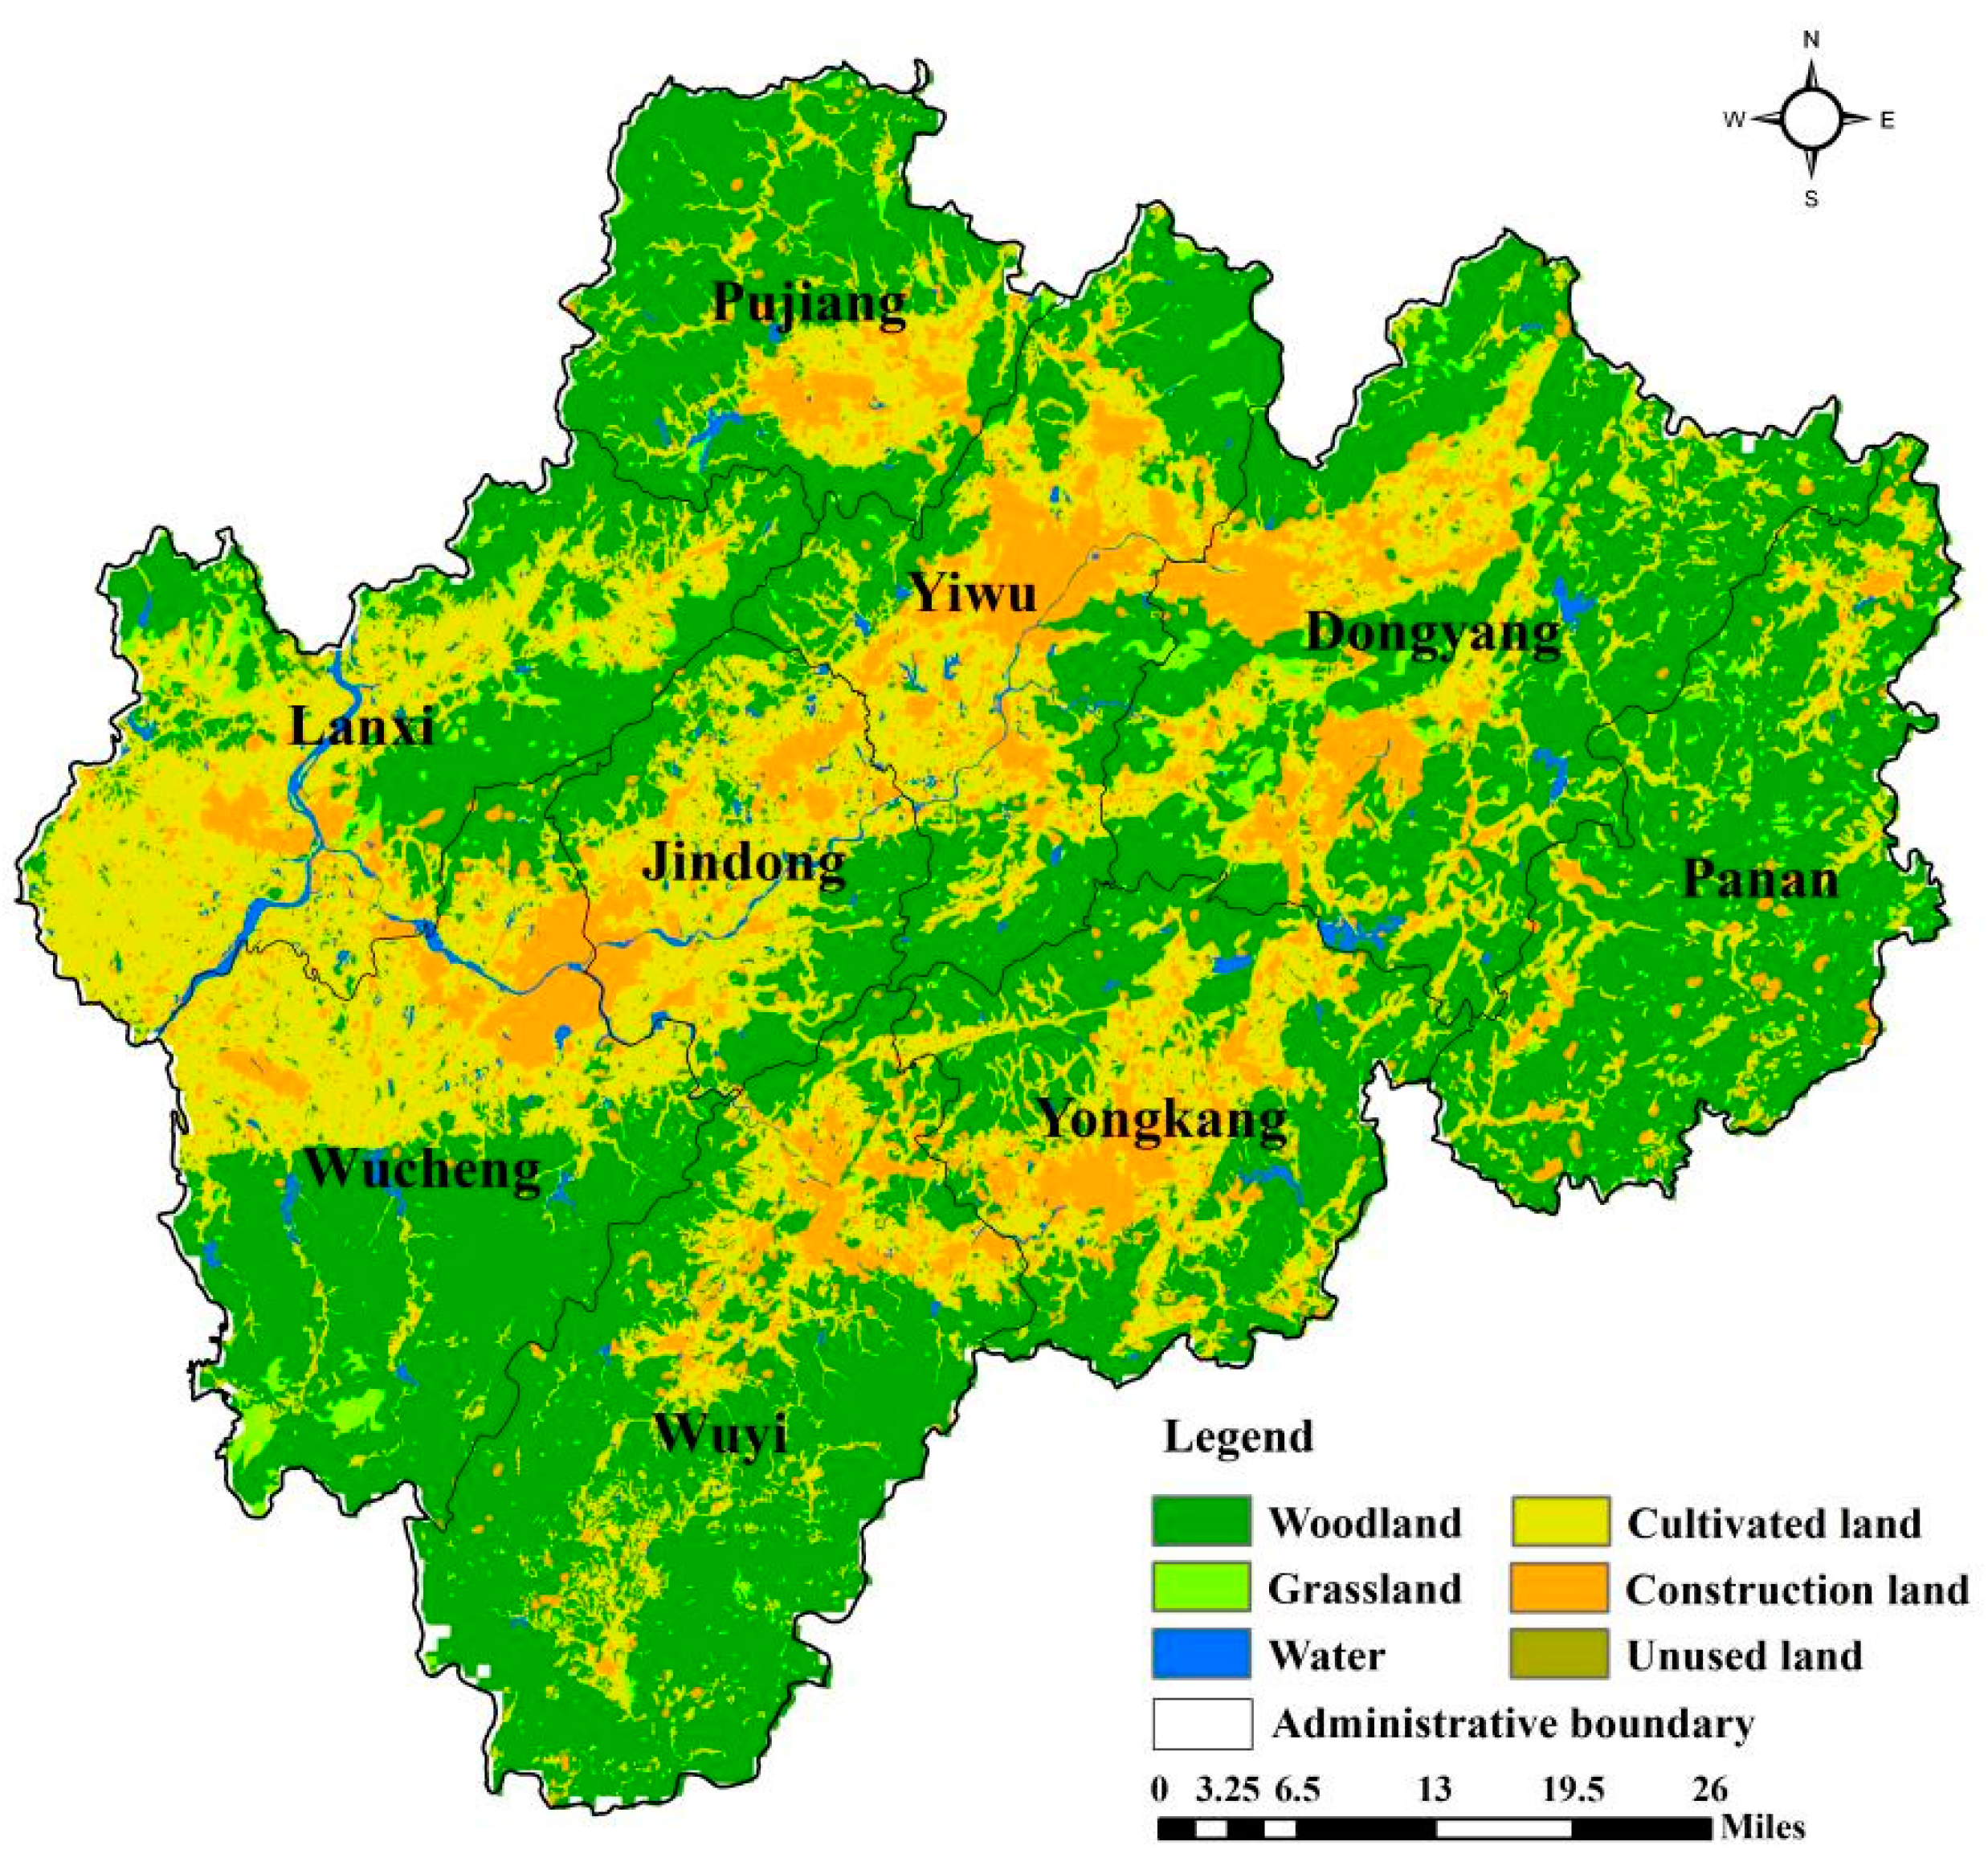
The predicted pattern of land use for 2030 shows that if the original land-use evolution law remains unchanged, the acreage of forest land will decrease by 53,586 ha and the acreage of construction land will increase by 25,719 ha compared to 2018. The acreage of cultivated land, grassland, and water areas is also predicted to increase by 20,796, 3656, and 1637 ha, respectively. The construction land area changed the most, reaching a growth rate of 29%, while the rate of decrement in the woodland area reached 8.2%. According to the land use transfer matrix, 28% of the reduced woodland area was converted into construction land and 61% was converted into cultivated land. A total of 47% of the increase in construction land came from cultivated land and 52% came from the conversion of woodland. As for the spatial pattern of land use, the predicted results for 2030 (Figure 5) show that the majority of new construction land is likely to be concentrated in the flat central corridor, mainly due to a radiant expansion of the existing construction land to the cultivated land around it. In the east and south, Yongkang and Dongyang have relatively larger areas of new construction land. The intensity of land development on the secondary development axis of the central Zhejiang urban agglomeration is greater.
Based on the forecasted results for the land-use pattern in 2030, carbon emissions were predicted. The carbon sources are expected to increase by 29.6% by 2030. Carbon sinks are predicted to reduce by 7.8%, and total carbon emissions are predicted to increase by 30% compared to 2018. Compared with the 2005-2018 period, the growth rate of carbon emissions is predicted to drop significantly but still remain at a relatively high level. With the gradual decrease in the average carbon emissions intensity of construction land after 2015, the continued rapid growth of carbon emissions will be largely due to the unreasonable spatial layout of land use, which needs to be adjusted and optimized.
4.4. Optimization of the Land-Use Spatial Pattern
Through the linear programming model, we determined the land-use structure plan after low-carbon optimization (Table 9). In terms of quantity, in the optimized scheme, the construction land area is reduced by 18% compared with the predicted scheme, and the grassland, water area, and unused land areas reduce in accordance with the law of land use evolution in Jinhua. The woodland area increases by 11%, indicating that improving the forest coverage is an important way to increase carbon sinks to achieve carbon reduction and promote the green development mechanism. As for the direction of transfer, 59% of the additional construction land from 2018 to 2030 comes from cultivated land and 38% comes from forestland. In the optimized land-use pattern, the proportion of construction land converted from woodland is smaller than in the predicted result.
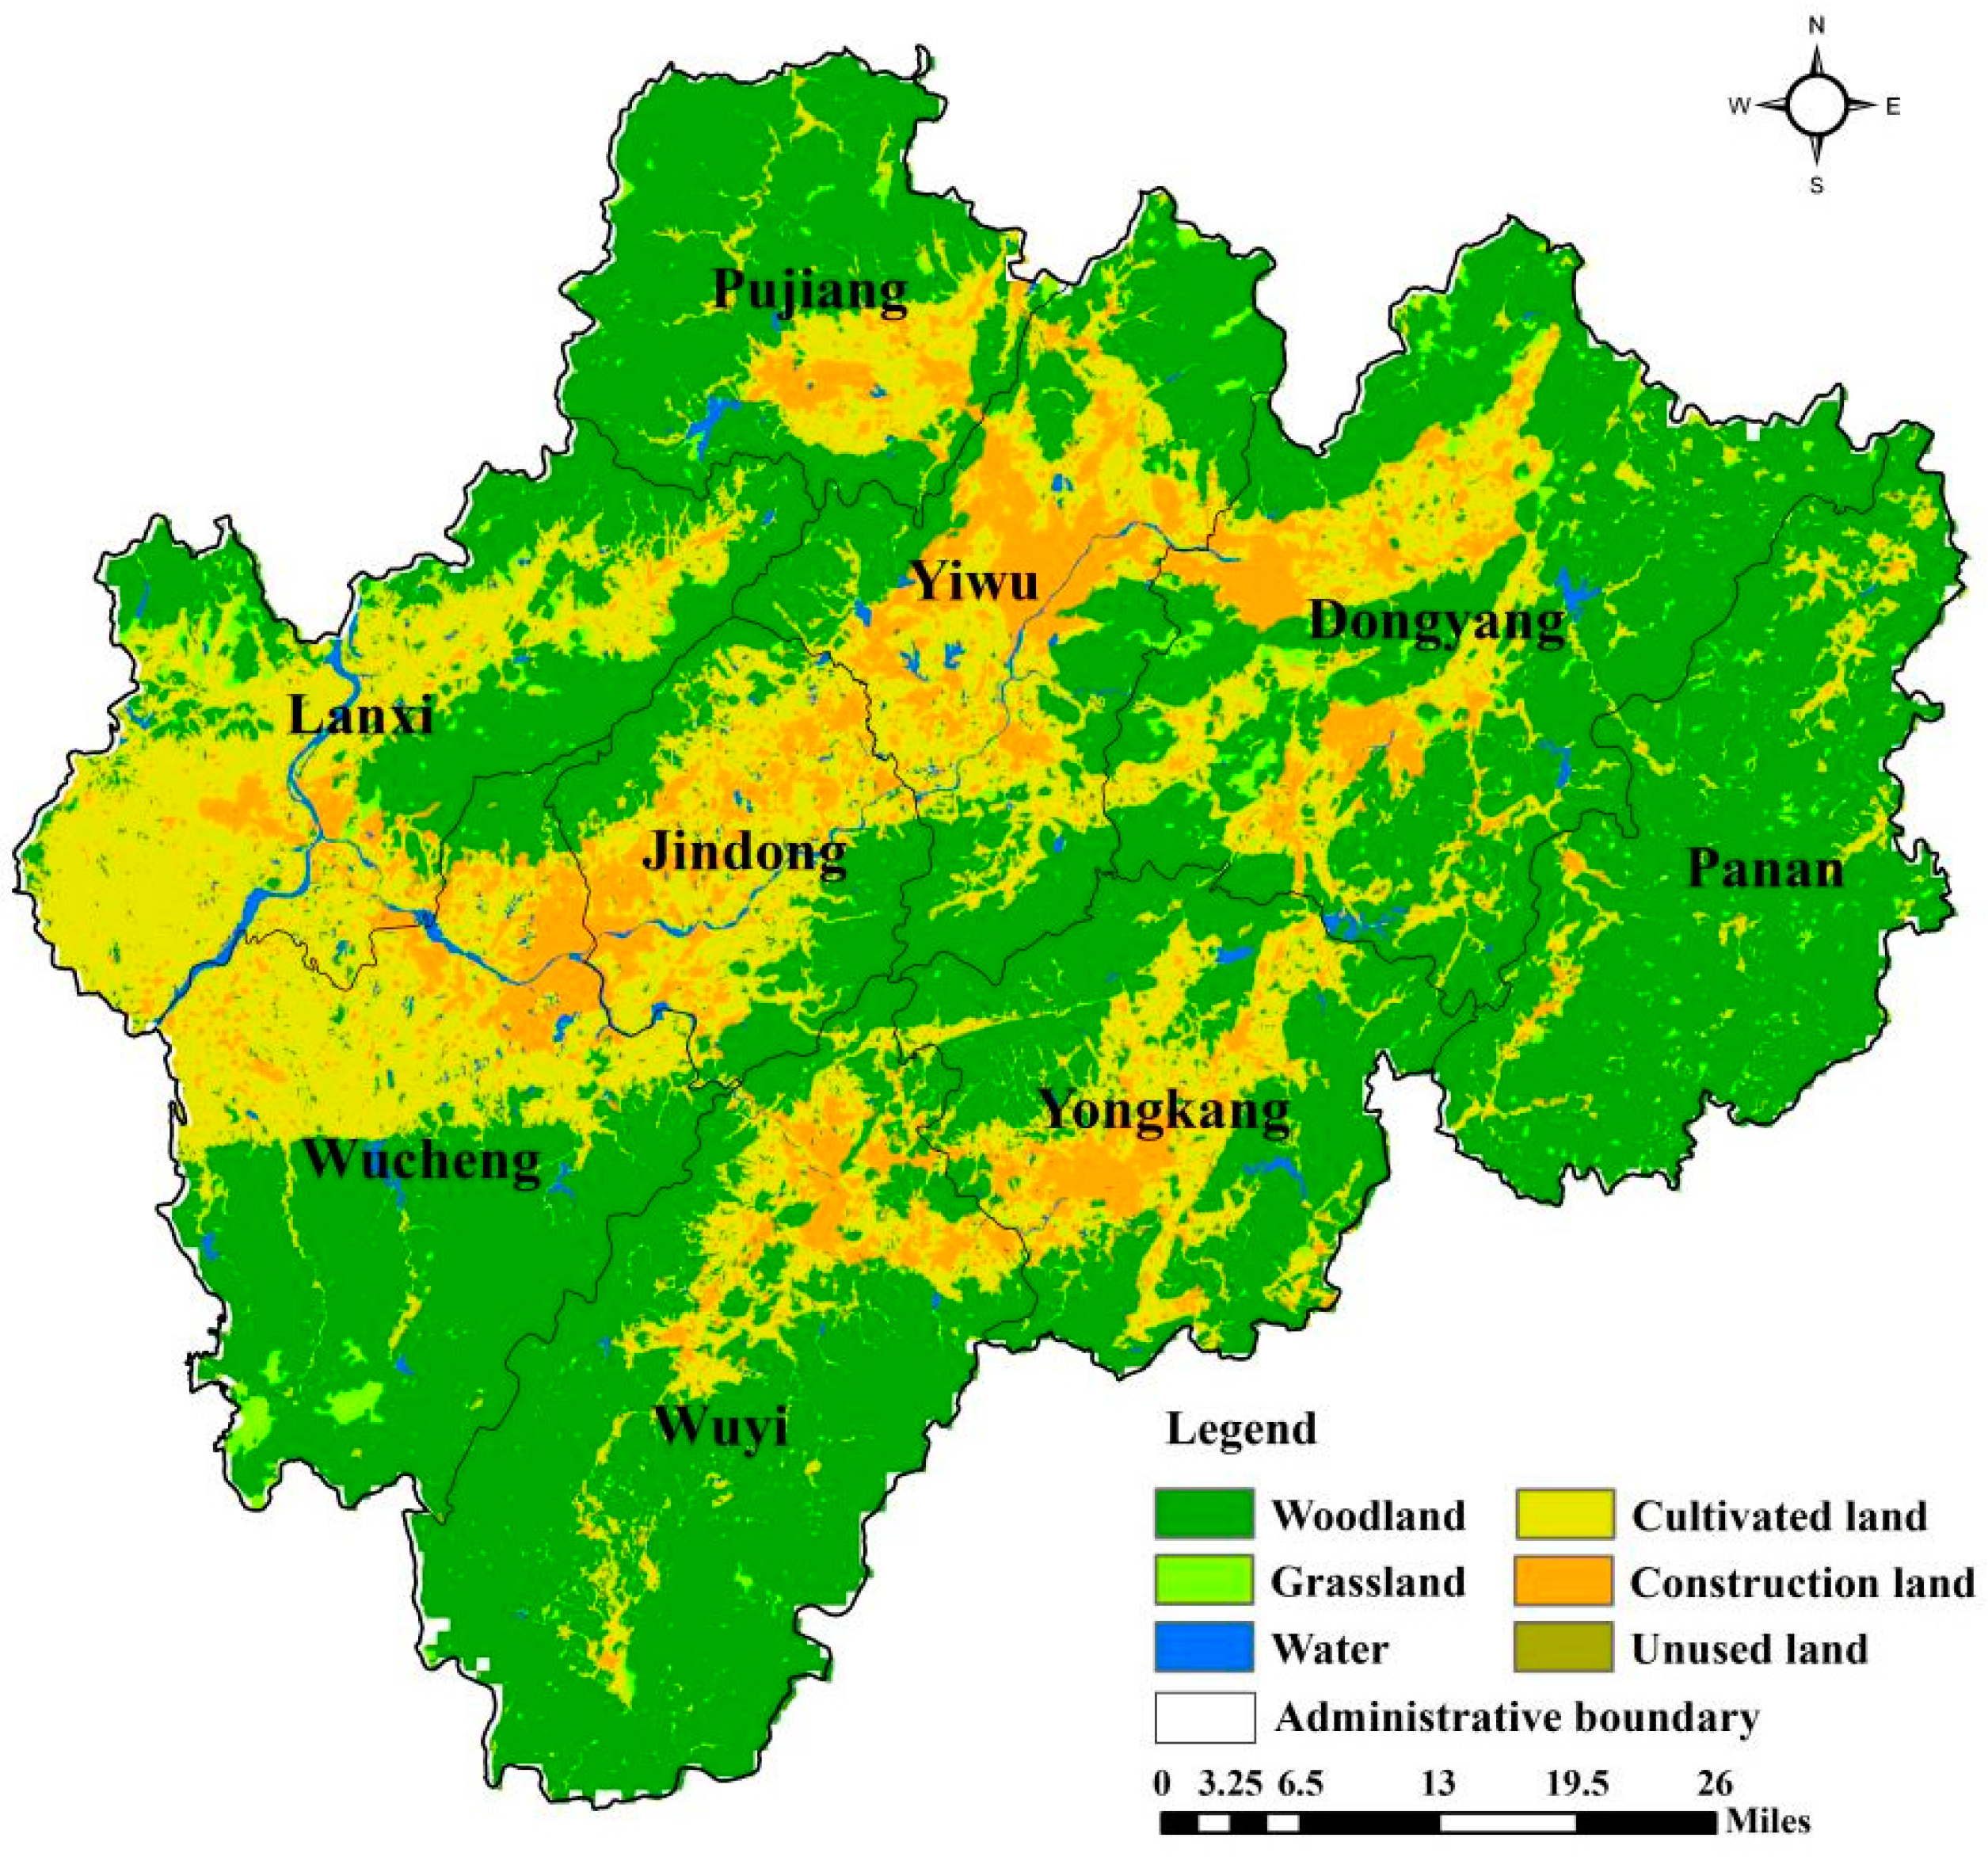
The quantitative targets and driving factors for low-carbon optimization were added to the FLUS model to determine the optimized land-use spatial pattern for Jinhua in 2030 (Figure 6). The additional construction land area was shown to mainly come from the radial expansion of existing construction land in the urban areas of Jinhua and Yiwu, but it was more directional compared with the forecasted expansion in all directions. The proportion of newly added construction land in the northeast of Jinhua city and the southwest of Yiwu city of the central corridor area was found to increase, which is consistent with the east–west expansion strategy of Jinhua and presents more obvious ribbon-form and cluster characteristics. Compared with the forecasted results, the expansion of the construction land area around Yongkang and Dongyang was predicted to decrease. The construction land areas in the southwest of Jinhua and the northeast of Yiwu were shown to decrease and concentrate more around the main axis of the Jinhua-Yiwu metropolitan area. They will be distributed around the Jinhua-Yiwu Expressway, which will contribute to the addition of production factors to the traffic arterial line. The green ecological zone in the central basin will be less affected by the expansion of construction land, and the acreage of cultivated land will decrease, and the acreage of woodland will increase. Total carbon emissions from the optimized land-use pattern will reduce by 19% compared with the value shown by the predicted results. Carbon sinks will increase by 11%. Carbon sources will reduce by 18%. In the scenario of low-carbon optimization, the growth rate of land-use carbon emissions is predicted to be only 6.2% from 2018–2030, lower than that of each period in the past.
5. Discussion
As the problems of the greenhouse effect and global warming are becoming increasingly serious, reducing carbon emissions has become an international consensus. Thus, in this paper, we proposed suggestions for low-carbon optimization of the land-use spatial distribution pattern based on an analysis of the effect of carbon emissions from land-use changes and the prediction of future tendencies in Jinhua. Many studies have explored the characteristics of land-use carbon emissions through coefficients of carbon emissions of land use in different regions and analyzed the existing problems in the land-use pattern [26,27,28,29]. Compared with previous studies, this study gives more practical advice on carbon emission reductions and proposed an optimized land-use spatial pattern using a multivariate linear programming model and a FLUS model with local driving factors.
In this study, we selected carbon emission coefficients in accordance with the actual situation in the study area. For instance, the carbon emission coefficient of woodland was selected with consideration of the carbon sink of the main forest vegetation types and the carbon emissions produced through firewood collection, forest fires, and HWP emissions of forest products in Zhejiang Province. This is more accurate than using the average coefficient at the national scale. However, the temporal effects of carbon emissions from changes in the age of stands, the site index, and the stand structure were still neglected. In terms of calculation of the carbon flow, we just considered natural and manmade carbon emissions but did not consider changes in carbon storage in land ecosystems. This may have caused the results to deviate from the actual situation. In addition, land use was divided into six types based on the first LUCC classification system, but the differences in carbon emissions intensity among different land-use types under the secondary classification were not considered. Thus, the spatial distribution of carbon emissions was not accurately described. Additionally, without driving factors, we were only able to perform pure mathematical simulations through the CA–Markov and FLUS models. The results do not reflect the influences of social and economic factors on the evolution of the land-use pattern well. Thus, in this study, driving factors, such as population, economy, transportation, and terrain were added to the models, and the impact of planning policies in the study area was also considered. The optimized simulation result in 2030 in Jinhua shows that in order to maintain stable economic performance under the premise of strictly controlling the intensity of land development, we should not only aim to limit the rate of construction land growth in terms of quantity but also to promote the construction of the Jinhua-Yiwu New Area and Jinhua-Lanxi Innovation City guided by the development of axial belts and a group layout. This will give full play to the connectivity of land development axes and promote the compound use of land and the intensive use of resources from the perspective of the spatial layout.
In future research, the carbon emission coefficient should be modified to improve the accuracy of the accounting results. Additionally, the impacts of land-use change on both carbon emissions and carbon storage should be considered. Our prediction models could be improved by refining the land-use classification so that the method can be applied to small-scale research more accurately in the future.
6. Conclusions
In this study, we analyzed the law of carbon emissions from land-use change in Jinhua City and explored a land-use optimization model under the guidance of achieving low carbon emissions. The specific conclusions are as follows:
- (1)
- From 2005 to 2018, the land-use structure of Jinhua changed significantly. On the whole, the acreage of construction land continued to grow. The acreage of woodland and cultivated land areas continued to decrease. The acreage of grassland and water areas first increased and then decreased. Most of the woodland was converted to cultivated land, and most of the cultivated land was converted to construction land. More than 80% of the construction land was formed through transfer from cultivated land. In the process of land-use change, in 2018, the total carbon emissions were 1.9 times greater than in 2005. There was a trend for positive carbon flow to increase, but negative carbon flow was always far greater than positive carbon flow, that is, the carbon metabolism of land use was far from balanced.
- (2)
- During the period from 2010 to 2015, carbon emissions in Jinhua showed negative growth. At this stage, the rate of decrement in woodland and the rate of growth in construction land were the smallest among the three periods. Accordingly, positive carbon flow reached its highest value and negative carbon flow reached its lowest value, indicating that changes in carbon flow due to land-use changes are closely related to the intensity of the evolution of the land-use pattern. In addition, thanks to the adjustment of the energy consumption structure and the treatment of fertilizer and pesticide pollutants in Jinhua after 2010, the average carbon emission intensity of construction land and cultivated land reduced, making the total carbon emissions of this stage somewhat lower than in the previous period.
- (3)
- The land-use prediction results show that on the basis of the law of original land-use evolution in Jinhua, by 2030, the acreage of construction land will have increased by 25,719 ha and the woodland area will have reduced by 53,586 ha. Carbon emissions are expected to increase by 30% compared to 2018. In the low-carbon optimization scenario of land use, the expansion of construction land in 2030 will be restricted, while the area of woodland will increase. Total carbon emissions will be reduced by 19% compared with the predicted results. In terms of the spatial pattern, the additional construction land present in the optimized land-use pattern will be concentrated around the main axis of the Jinhua-Yiwu metropolitan area, consistent with the strategy of focusing on developing the Jinhua-Yiwu metropolitan area. It is helpful to promote land agglomeration development and the efficient allocation of resources. Therefore, this study proposed a macroscopic spatial land-use pattern that contributes to carbon emission reduction with the consideration of regional planning objectives and economic development.
Author Contributions
S.H. and F.X. contributed to all aspects of this work. F.X. and Y.C. conducted data analysis. S.H. and M.G. wrote the main manuscript text. X.P. and C.R. gave some useful comments and suggestions to this work. All authors have read and agreed to the published version of the manuscript.
Funding
This work was supported by the National Natural Science Foundation of China (Grant No. 41907402) and Beijing Training Program of Innovation and Entrepreneurship for Undergraduates (Grant No. 202011413074).
Institutional Review Board Statement
Not applicable.
Informed Consent Statement
Not applicable.
Data Availability Statement
The data presented in this study are available on request from the author.
Conflicts of Interest
The authors declare no conflict of interest.
References
- International Energy Agency. Global Energy & CO2 Status Report: The Latest Trends in Energy and Emissions in 2018; International Energy Agency: Paris, France, 2019. [Google Scholar]
- Political Bureau of the Central Committee of the CPC. The 14th Five-Year Planfor National Economic and Social Development and the Long-Range Objectives through the Year 2035. In Proceedings of the 19th CPC Central Committee, Beijing, China, 26 October 2020. [Google Scholar]
- Lai, L.; Huang, X.J. Carbon Emission Effect of Land Use in China, 1st ed.; Nanjing University Press: Nanjing, China, 2010; pp. 3–65. [Google Scholar]
- Stuiver, M. Atmospheric carbon dioxide and carbon reservoir change. Science 1978, 199, 253–258. [Google Scholar] [CrossRef]
- Feddema, J.J.; Oleson, K.; Bonan, G. How important is land cover change for simulating future climates. Science 2005, 310, 1674–1678. [Google Scholar] [CrossRef] [PubMed] [Green Version]
- Houghton, A.; House, J.I.; Pongratz, J. Carbon emissions from land use and land-cover change. Biogeosciences 2012, 9, 5125–5142. [Google Scholar] [CrossRef] [Green Version]
- Liu, J.Y.; Shao, Q.Q.; Yan, X.D. An overview of the progress and research framework on the effects of land use change upon global climate. Adv. Earth Sci. 2011, 26, 1015–1022. [Google Scholar]
- Zhu, E.Y.; Deng, J.S.; Zhou, M.M. Carbon emissions induced by land-use and land-cover change from 1970 to 2010 in Zhejiang, China. Sci. Total Environ. 2018, 646, 930–939. [Google Scholar] [CrossRef]
- Yang, J.; Xie, B.P.; Zhang, D.G. Spatio-temporal evolution of carbon stocks in the Yellow River Basin based on InVEST and CA-Markov models. Chin. J. Eco-Agric 2011, 29, 1018–1029. [Google Scholar]
- Li, Y.; Huang, X.J.; Zhen, F. Effects of land use patterns on carbon emission in Jiangsu Province. Trans. CSAE 2008, 24 (Suppl. 2), 102–107. [Google Scholar]
- Zhao, X.C.; Zhu, X.; Zhou, Y.Y. Effects of land uses on carbon emissions and their spatial-temporal patterns in Hunan Province. Acta Sci. Circumstantiae 2013, 333, 941–949. [Google Scholar]
- Sun, H.; Liang, H.M.; Chang, X.L. Land Use Patterns on Carbon Emission and Spatial Association in China. Econ. Geogr. 2015, 35, 155–162. [Google Scholar]
- Zhejiang Provincial Statistics Bureau. Statistical Bulletin of the 7th Population Census of Zhejiang Province; Zhejiang Provincial Statistics Bureau: Zhejiang, China, 2021.
- Jinhua Municipal Statistics Bureau. Statistical Yearbook of Jinhua in 2020; Jinhua Municipal Statistics Bureau: Jinhua, China, 2021.
- Liu, J.Y.; Liu, M.L.; Deng, X.Z. The land use and land cover change database and its relative studies in China. J. Geogr. Sci. 2002, 12, 275–282. [Google Scholar]
- Li, K.R. Land Use Change, Net Greenhouse Gas Emissions and Terrestrial Ecosystem Carbon Cycle, 1st ed.; Meteorological Publishing House: Beijing, China, 2000; p. 260. [Google Scholar]
- West, T.O.; Marland, G.A. Synthesis of Carbon Sequestration, Carbon Emissions, and NetCarbon Flux in Agriculture: Comparing Tillage Practices in the United States. Agr. Ecosyst. Environ. 2002, 91, 217–232. [Google Scholar] [CrossRef]
- Piao, S.L.; Fang, J.Y.; Zhu, B. Forest biomass carbon stocks in China over the past 2 decades: Estimation based on integrated inventory and satellite data. J. Geophys. Res. 1984, 110. [Google Scholar] [CrossRef] [Green Version]
- Fang, J.Y.; Guo, Z.D.; Piao, S.L. Estimation of terrestrial vegetation carbon sequestration in China from 1981 to 2000. Sci. China Earth Sci. 2007, 6, 804–812. [Google Scholar]
- Duan, X.N.; Wang, X.K.; Lu, F. State Lab of Urban and Regional Ecology, Research Center for Eco-Environmental Sciences. Acta Ecol. Sin. 2008, 2, 463–469. [Google Scholar]
- Xu, G.Q.; Liu, Z.Y.; Jiang, Z.H. Decomposition Model and Empirical Study of Carbon Emissions for China, 1995–2004. Chin. J. Popul. Resour. Environ. 2006, 16, 158–161. [Google Scholar]
- Xia, C.Y.; Li, Y.; Ye, Y.M. Analyzing urban carbon metabolism based on ecological network utility: A case study of Hangzhou City. Acta Ecol. Sin. 2018, 38, 73–85. [Google Scholar]
- Yang, G.Q.; Liu, Y.L.; Wu, Z.F. Analysis and Simulation of Land-Use Temporal and Spatial Pattern Based on CA-Markov Model. Geomat. Inf. Sci. Wuhan Univ. 2007, 5, 414–418. [Google Scholar]
- Cao, S.; Jin, X.B.; Yang, X.H. Coupled MOP and GeoSOS-FLUS models research on optimization of land use structure and layout in Jintan district. J. Nat. Resour. 2019, 34, 1171–1185. [Google Scholar]
- Liu, X.P.; Xun, L.; Xia, L.A. Future land use simulation model (FLUS) for simulating multiple land use scenarios by coupling human and natural effects. Landsc. Urban. Plan. 2017, 168, 94–116. [Google Scholar] [CrossRef]
- Shi, H.X.; Mu, X.M.; Zhang, Y.L. Effects of Different Land Use Patterns on Carbon Emission in Guangyuan City of Sichuan Province. Bull. Soil Water Conserv. 2012, 32, 102–106. [Google Scholar]
- Su, Y.L.; Zhang, Y.F. Study on Effects of Carbon Emission by Land Use Patterns of Shaanxi Province. J. Soil Water Conserv. 2011, 25, 152–156. [Google Scholar]
- Li, P.; Li, J.T.; Liang, Y.H. Analysis of Land Use/Cover Change and Carbon Effect in Hebi in Recent 30 Years. Ecol. Econ. 2019, 35, 121–128. [Google Scholar]
- Jing, Y.; Zuo, L.L.; Peng, W.F. Spatial-temporal Change Analysis of Carbon Emission from Land Use in Mianyang the Case Study of Mianyang. Abbreviated J. Name 2021, 44, 172–185. [Google Scholar]
Figure 1.
Location and topography of the study area.

Figure 2.
The technology roadmap of this study.

Figure 3.
Spatial distribution of Jinhua land-use (a) 2005; (b) 2010; (c) 2015; (d) 2018.

Figure 4.
Trends of (a) positive and (b) negative carbon flow from 2005 to 2018.

Figure 5.
Image of predicted land-use in 2030.

Figure 6.
Optimized land-use spatial pattern in 2030.


Table 1.
Driving factors identified in the suitability analysis of construction land.
| Constraints | Influencing Factors | Weights |
|---|---|---|
| Existing construction land | Population | 0.1672 |
| Water | GDP | 0.1839 |
| Nature reserve | DEM | 0.0712 |
| slope | 0.0661 | |
| Distance to construction land | 0.0831 | |
| Distance to roadway | 0.1387 | |
| Distance to the motorway | 0.1500 | |
| Distance to railway | 0.1397 |
Table 2.
Optimization-oriented driving factors.
| Optimization-Oriented Driving Factors | Description |
|---|---|
| Jinhua-Yiwu Expressway | To improve the probability of land around the main axis of the Jinhua-Yiwu metropolitan area converting to construction land |
| Hilly area in the central basin | To reduce the probability of the green ecological zone in the central basin area |
Table 3.
Land-use transfer matrix for 2005–2010 (
).
| Land-Use Types | CuL | WL | GL | W | CoL | UL |
|---|---|---|---|---|---|---|
| CuL | 3096.3 | 14.9 | 1.0 | 7.0 | 92.8 | 0.0 |
| WL | 20.2 | 6575.5 | 4.8 | 0.6 | 14.3 | 0.1 |
| GL | 0.3 | 1.0 | 212.8 | 0.2 | 0.8 | 0.0 |
| W | 1.7 | 0.3 | 0.0 | 144.1 | 0.6 | 0.0 |
| CoL | 3.2 | 0.8 | 0.0 | 0.2 | 583.3 | 0.0 |
| UL | 0.0 | 0.0 | 0.3 | 0.0 | 0.1 | 3.7 |
Note CuL represents Cultivated land; WL represents Woodland; GL represents Grassland; W represents Water; CoL represents Construction land; UL represents Unused land.
Table 4.
Land-use transfer matrix for 2010 to 2015 (
).
| Land-Use Types | CuL | WL | GL | W | CoL | UL |
|---|---|---|---|---|---|---|
| CuL | 3003.6 | 26.5 | 0.9 | 2.2 | 88.3 | 0.0 |
| WL | 23.3 | 6559.3 | 1.7 | 0.7 | 7.5 | 0.1 |
| GL | 0.9 | 2.2 | 215.0 | 0.0 | 0.8 | 0.0 |
| W | 2.4 | 0.9 | 0.0 | 147.5 | 1.2 | 0.0 |
| CoL | 8.9 | 1.5 | 0.1 | 0.3 | 681.2 | 0.0 |
| UL | 0.0 | 0.1 | 0.0 | 0.0 | 0.0 | 3.7 |
Table 5.
Land-use transfer matrix for 2015 to 2018 (
).
| Land-Use Types | CuL | WL | GL | W | CoL | UL |
|---|---|---|---|---|---|---|
| CuL | 2742.5 | 128.4 | 4.4 | 9.2 | 44.6 | 0.0 |
| WL | 124.3 | 6398.1 | 13.7 | 5.1 | 8.8 | 0.4 |
| GL | 4.0 | 16.7 | 198.1 | 0.2 | 0.6 | 0.0 |
| W | 14.0 | 5.0 | 0.2 | 131.1 | 2.5 | 0.0 |
| CoL | 154.3 | 41.9 | 1.2 | 5.1 | 722.5 | 0.2 |
| UL | 0.0 | 0.5 | 0.0 | 0.0 | 0.0 | 3.1 |
Table 6.
Area changes for different land-use types from 2005 to 2018.
| Land-Use Types | 2005–2010 | 2010–2015 | 2015–2018 | |||
|---|---|---|---|---|---|---|
| Variable-Area ( ) | Rate (%) | Variable-Area ( ) | Rate (%) | Variable-Area ( ) | Rate (%) | |
| CuL | −90.4 | −2.8 | −82.8 | −2.6 | −117.2 | −3.8 |
| WL | −23.7 | −0.4 | −1.9 | 0.1 | −163.1 | −2.4 |
| GL | 4.3 | 1.9 | −1.3 | −0.6 | −6.8 | −3.0 |
| W | 5.4 | 3.6 | −1.4 | −0.9 | 1.1 | 0.7 |
| CoL | 104.8 | 17.8 | 87.4 | 12.6 | 145.1 | 18.6 |
| UL | −0.4 | −8.6 | 0.0 | −1.3 | −0.1 | −3.5 |
Table 7.
Carbon emissions from different land-use types from 2005 to 2018 ().
| Years | CuL | WL | GL | W | CoL | UL | Carbon Source | Carbon Sink | Total |
|---|---|---|---|---|---|---|---|---|---|
| 2005 | 135.0 | −252.0 | −0.5 | −4.1 | 8507.4 | 0.0 | 8642.5 | −256.7 | 8385.8 |
| 2010 | 142.5 | −251.2 | −0.5 | −4.3 | 18,671.0 | 0.0 | 18,813.5 | −255.9 | 18,557.6 |
| 2015 | 125.2 | −251.1 | −0.5 | −4.2 | 17,885.3 | 0.0 | 18,010.5 | −255.8 | 17,754.7 |
| 2018 | 107.0 | −245.0 | −0.5 | −4.3 | 24,227.3 | 0.0 | 24,334.4 | −249.7 | 24,084.6 |
Table 8.
Carbon flow from 2005 to 2018.
| The Direction of Carbon Flow | 2005–2010 (tC·a−1) | 2010–2015 (tC·a−1) | 2015–2018 (tC·a−1) |
|---|---|---|---|
| Cultivated land to Woodland | 1135.9 | 2204.2 | 10,161.3 |
| Cultivated land to Grassland | 42.2 | 41.8 | 185.5 |
| Cultivated land to Water | 470.6 | 160.8 | 1012.3 |
| Cultivated land to Construction land | −2,497,282.7 | −958,883.8 | −4,034,420.0 |
| Cultivated land to Unused land | 0.2 | 0.5 | 1.2 |
| Woodland to Cultivated land | −1669.8 | −1902.0 | −9512.0 |
| Woodland to Grassland | −168.1 | −60.4 | −591.1 |
| Woodland to Water | −5.6 | −7.2 | −48.2 |
| Woodland to Construction land | −387,023.8 | −82,125.8 | −1,098,230.4 |
| Woodland to Unused land | −4.0 | −2.1 | −18.4 |
| Grassland to Cultivated land | −14.8 | −41.4 | −171.1 |
| Grassland to Woodland | 37.0 | 78.5 | 485.4 |
| Grassland to Water | 4.7 | 0.5 | 4.4 |
| Grassland to Construction land | −20,450.4 | −8776.1 | −31,322.8 |
| Grassland to Unused land | 0.0 | 0.0 | 0.0 |
| Water to Cultivated land | −123.1 | −176.9 | −589.1 |
| Water to Woodland | 3.0 | 8.4 | 51.9 |
| Water to Grassland | −0.1 | −1.1 | −3.9 |
| Water to Construction land | −17,241.0 | −13,067.4 | −133,833.7 |
| Water to Unused land | 0.0 | 0.0 | 0.0 |
| Construction land to Cultivated land | 96,500.0 | 239,242.5 | 484,289.8 |
| Construction land to Woodland | 22,998.5 | 40,784.5 | 96,445.3 |
| Construction land to Grassland | 766.6 | 2183.3 | 6685.1 |
| Construction land to Water | 6330.2 | 7260.2 | 27,728.9 |
| Construction land to Unused land | 0.0 | 48.5 | 117.8 |
| Unused land to Cultivated land | −0.2 | −0.7 | −1.5 |
| Unused land to Woodland | 1.4 | 3.6 | 16.0 |
| Unused land to Grassland | 0.5 | 0.0 | 0.0 |
| Unused land to Water | 0.0 | 0.0 | 0.0 |
| Unused land to Construction land | −3857.0 | −58.9 | −5043.4 |
| Positive carbon flow | 128,290.5 | 292,017.3 | 627,184.8 |
| Negative carbon flow | −2,927,840.4 | −1,065,103.6 | −5,313,785.5 |
Table 9.
Carbon emissions in 2030 for the predicted and optimized land-use patterns.
| Land-Use Types | Prediction for 2030 | Optimization in 2030 | ||
|---|---|---|---|---|
| Area () | Carbon Emission (MgC) | Area () | Carbon Emission (MgC) | |
| Cultivated land | 3137.1 | 114.6 | 2859.6 | 104.5 |
| Woodland | 6014.6 | −224.9 | 6716.2 | −251.2 |
| Grassland | 256.1 | −0.5 | 208.0 | −0.4 |
| Water | 169.2 | −4.7 | 152.5 | −4.3 |
| Construction land | 1200.4 | 31,433.4 | 982.3 | 25,721.6 |
| Unused land | 3.6 | 0.0 | 3.4 | 0.0 |
Publisher’s Note: MDPI stays neutral with regard to jurisdictional claims in published maps and institutional affiliations. |
© 2021 by the authors. Licensee MDPI, Basel, Switzerland. This article is an open access article distributed under the terms and conditions of the Creative Commons Attribution (CC BY) license (https://creativecommons.org/licenses/by/4.0/).
Share and Cite
MDPI and ACS Style
Huang, S.; Xi, F.; Chen, Y.; Gao, M.; Pan, X.; Ren, C. Land Use Optimization and Simulation of Low-Carbon-Oriented—A Case Study of Jinhua, China. Land 2021, 10, 1020. https://0-doi-org.brum.beds.ac.uk/10.3390/land10101020
AMA Style
Huang S, Xi F, Chen Y, Gao M, Pan X, Ren C. Land Use Optimization and Simulation of Low-Carbon-Oriented—A Case Study of Jinhua, China. Land. 2021; 10(10):1020. https://0-doi-org.brum.beds.ac.uk/10.3390/land10101020
Chicago/Turabian StyleHuang, Shiqi, Furui Xi, Yiming Chen, Ming Gao, Xu Pan, and Ci Ren. 2021. "Land Use Optimization and Simulation of Low-Carbon-Oriented—A Case Study of Jinhua, China" Land 10, no. 10: 1020. https://0-doi-org.brum.beds.ac.uk/10.3390/land10101020
Note that from the first issue of 2016, this journal uses article numbers instead of page numbers. See further details here.