
Delimitating the Ecological Spaces for Water Conservation Services in Jilin Province of China


1
College of Land Science and Technology, China Agricultural University, Beijing 100083, China
2
Key Laboratory for Agricultural Land Quality Monitoring and Control, Ministry of Natural Resources, Beijing 100035, China
3
Land Consolidation and Rehabilitation Center, Ministry of Natural Resources of the People’s Republic of China, Beijing 100035, China
*
Author to whom correspondence should be addressed.
Land 2021, 10(10), 1029; https://0-doi-org.brum.beds.ac.uk/10.3390/land10101029
Submission received: 1 September 2021
/
Revised: 28 September 2021
/
Accepted: 28 September 2021
/
Published: 30 September 2021
(This article belongs to the Section Landscape Ecology)
Abstract
:Mastering the spatial distribution of water retention capacity and scientifically delineating the ecological space for water conservation are of great significance to the management of regional land and water resources. In this paper, a water conservation ecological spatial delimitation framework suitable for water-deficient areas was put forward. The water retention capacity of the study area in 1983, 1990, 2000, 2010, and 2016 was evaluated by using the InVEST Water Yield model and water balance method, respectively. On this basis, a flexible inflection point model based on the contribution degree of functional units was established. Then the ecological space for water conservation was delimited. The framework was applied to the delimitation of the key water conservation areas in Jilin province, China. The results showed that: (1) the spatial distribution pattern of water conservation in Jilin province gradually decreased from east to west. The spatial difference was significant. The maximum value of water conservation in Jilin province was 730 mm. From 1983 to 2016, water conservation, which accounted for 75.71% of the area, showed an upward trend. The overall water retention capacity showed the characteristics of the overall increase and the local decline. (2) From the absolute amount of the effect of unit area change on water conservation, the intensity from the high to the low was forestland, cultivated land, grassland, unused land, buildings, and water. (3) The area of water conservation less than 474 mm accounted for more than 80% of the total study area. The overall water retention capacity was low. High importance ecological space area of water conservation was comprehensively defined as 36.97%, which was mainly distributed in the natural forest area of Changbai Mountain in the east and the south of Song Liao Plain. Therefore, this study provided a basic layout of relatively concentrated ecological spatial distribution for water conservation types at different levels in Jilin province. The study results and conclusions of this paper will provide a reference for water conservation assessment and the regional land’s natural resources management.
1. Introduction
In recent decades, with the rapid development of urbanization and industrialization, human activities have had a serious impact on the regional and global ecological environment [1,2,3,4,5]. The decline of ecological services and the reduction of ecological space directly affect the sustainable development of the region and the survival of human beings. At the same time, the demand for high-quality ecological space is also increasing [6,7,8,9]. Ecological space is defined as land space with natural attributes and is the main function of improving ecological services, and it is divided into two land types: important ecological function land and ecologically sensitive land [10,11,12,13]. For all kinds of ecological function space systems, water conservation function land is an important part of the ecological space and the functional embodiment of the interaction of vegetation, water, and soil [14,15,16].
Water resources are a kind of basic natural and strategic economic resource. With the increase in global demand and the shortage of water resources caused by the deterioration of the water environment, the water retention capacity of regional ecosystems is seriously threatened [17,18]. As an important way for ecosystems to participate in the process of hydrological regulation, water conservation refers to the process and capacity of ecosystems to store and retain water in a specific time and space [19], the ecological base flow of drainage and recharge basin in non-rainy seasons, in order to ensure the water for human life and social development [20]. Regional water retention capacity is related to all aspects of vegetation, species survival, and social life [16,21,22,23]. Therefore, it is necessary to explore the delimitation of ecological space for water conservation under the guidance of water resources management so as to alleviate the contradictions among water use, water environment, water ecology, and resource development.
The amount of water resources per capita in Jilin province is 1269 , which is only 2/3 of the national level and 1/5 of the world average level. Thus, Jilin province belongs to the area of moderate water shortage [24,25]. As an important grain-producing area in China, Jilin province is facing great pressure on water resources due to the rapid development of regional agriculture in recent years [12,26]. In the process of economic development, the exploitation of cultivated land reserve resources will inevitably lead to the continuous destruction of the regional ecosystem water conservation services. At the same time, as the headstream of Songhua River, Yalu River, Tumen River, etc., water resources security is very important to maintain the water security of Jilin province and even the whole northeast region [27,28,29,30]. Therefore, there is an urgent need for quantitative evaluation and spatial-temporal heterogeneity of water conservation services in Jilin province. Further improving the technical system for spatial delimitation of important ecological functions will be conducive to improving the understanding of regional water retention capacity [31].
A series of studies on the evaluation of water conservation functions have been carried out. The InVEST Water Yield model was based on simplifications of well-known hydrological relationships in natural ecosystems, which was essential for water-related ecosystem services [32,33]. The annual water yield of 22 catchment areas in England was simulated and verified by long-term river flow data [34]. Xu Yang [35] analyzed the spatial-temporal dynamics of water yield in arid areas of northwest China from 1985 to 2015, as well as the response of water yield to land use and precipitation (P) changes. The water balance method is a relatively mature and accurate method [36,37,38,39,40], which has been widely used in the evaluation of regional water conservation services. Therefore, the regional water retention capacity is scientifically evaluated by using the combination of the InVEST Water Yield model and the water balance method.
From the current practical works, the water balance method was scientific and accurate in the calculation of the spatial functional value [29,41,42]. However, there were still some deficiencies in the follow-up processing methods. In the study of Xiangjiang River Basin, there was an obvious deficiency in using the fixed threshold method to delineate the ecological red line [43], while in the planning of green infrastructure in Germany [44], the ecological space was obtained based on only the order of the importance of services; the relative differences of functional contribution values of different regional evaluation units were ignored. In addition, on the national and inter-provincial scale, it was difficult to accurately express the important eco-spatial functions of areas with obvious differences in water resources endowment, to form standards, and to popularize them on a large scale [45,46,47,48]. Generally speaking, there was still a lack of an accurate methodological framework for the delineation of ecological space, and relevant cases were still rarely studied [49,50].
This paper put forward a methodological framework for the delimitation of ecological space for water conservation on a regional scale. Jilin province, China, was taken as the study area. The water balance method was used to analyze the spatial maps of water conservation in 1983, 1990, 2000, 2010, and 2016. Then, the flexible inflection point method of the cumulative contribution value of the evaluation unit was used to improve the delineation method of important water conservation levels, and an important ecological space range was formed. Finally, the factors affecting the delimitation of ecological space for water conservation and the correction scheme were further discussed. The research results of this paper can provide theoretical support for the future study of regional ecosystem water conservation and the application of regional land resources management.
2. Materials and Methods
2.1. Study Area
Jilin province (Figure 1) is located in the middle of northeast China, with a land area of , with four distinct seasons, where rain and heat coexist. The average annual P is 400 mm–600 mm. The average annual evapotranspiration(ET) is between 1100 mm and 1900 mm [51]. The topography is tilted from southeast to northwest, which is divided into eastern mountain area, central hilly region, and central and western plain area [28,29]. Changbai Mountain in the east is rich in natural forest resources and is a key protected area of natural forest resources in northeast China. The central part is an important commercial grain base. The western part is located in the typical ecotone of agriculture and animal husbandry, with serious wind, sand, drought, and salinization, so it is the key area of national desert prevention and three northern shelterbelts [52]. Jilin province is located in the upper and middle reaches of major rivers in northeast China. The volcanic cone around Tianchi in Changbai Mountain is the headstream of Songhua River, Yalu River, and Tumen River [31].
2.2. Data Source and Processing
Land use layers with a spatial resolution of 30 m were downloaded from Resources and Environment data Cloud platform of Chinese Academy of Sciences. Climate data contained the average annual P data and actual ET data. Soil data were from Center for Soil Science, and annual runoff data quoted the statistical data in the literature [53]. The details are shown in Table 1.
Land use data were visually interpreted and mapped by using Landsat images of different periods, and the overall accuracy was more than 90% [54]. According to the land use classification system [54], there were six categories of cultivated land, forestland, grassland, water, buildings, and unused land (Figure 2). In order to balance the efficiency of land use modeling and the richness of remote sensing image information, resampling of land use data was carried out by using the nearest neighbor method.
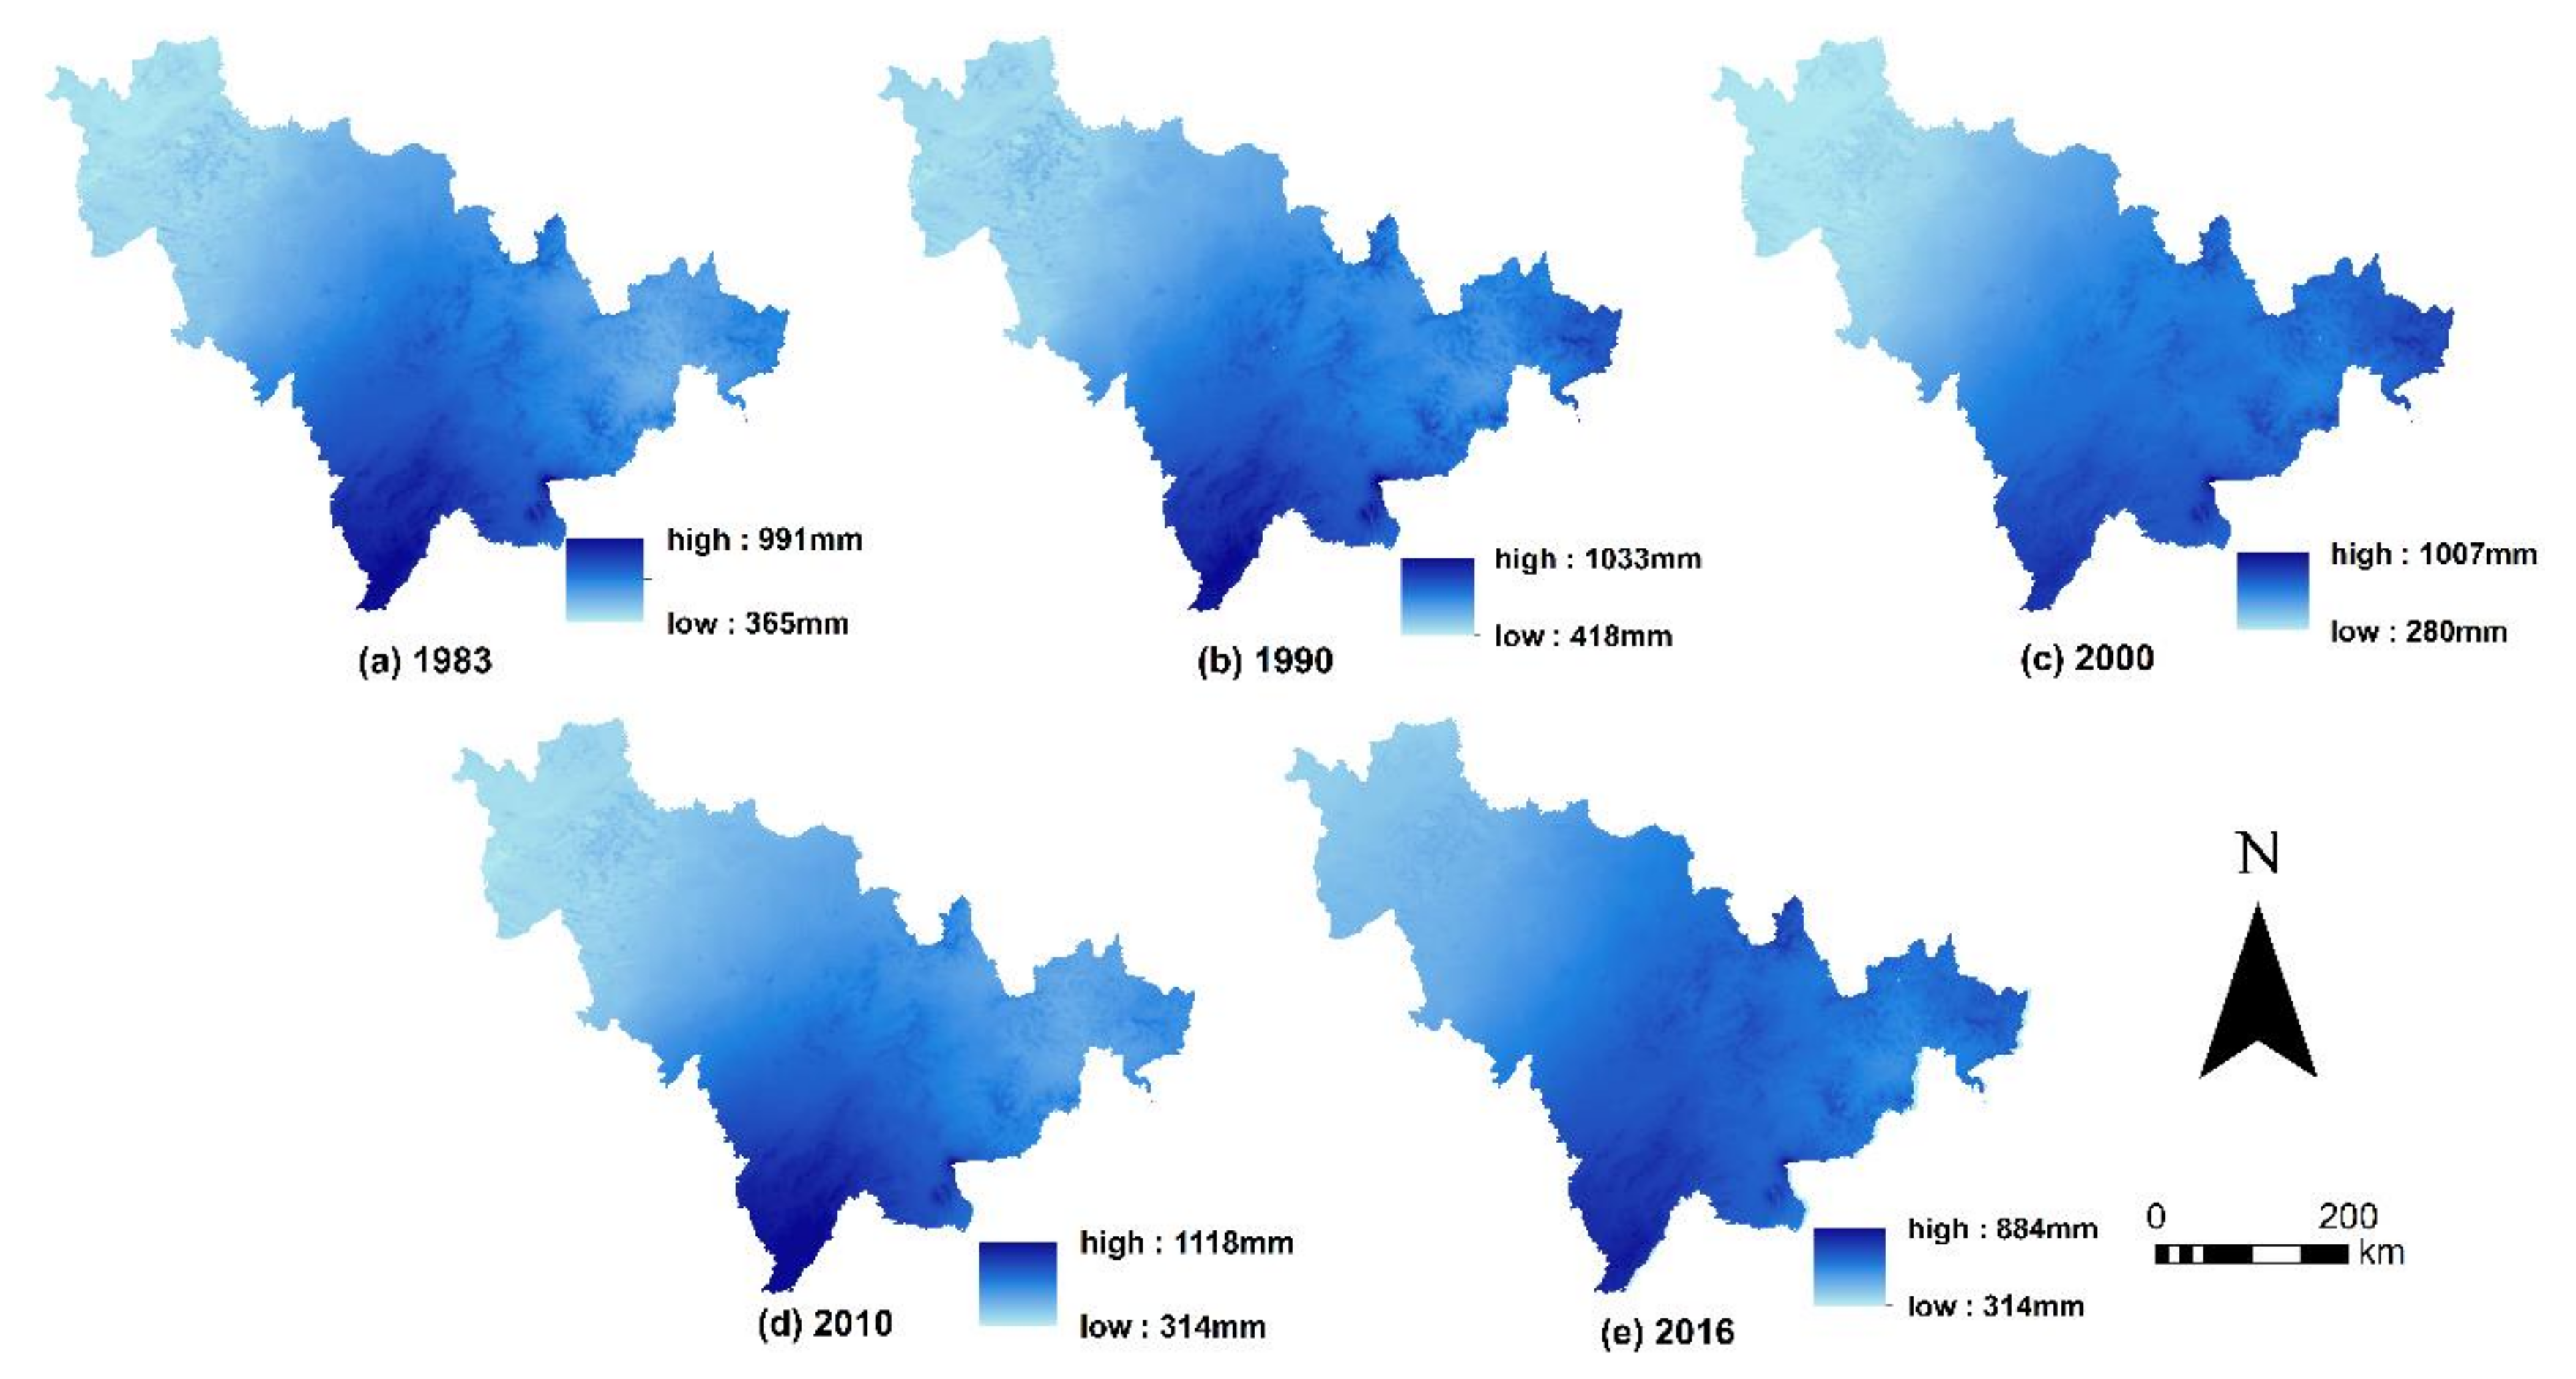
According to the requirements of the InVEST model and the availability of data, this paper made an empirical study in 1983, 1990, 2000, 2010, and 2016. In order to balance the interannual variation of P and actual ET, this paper used the average annual data of 1982–1984, 1989–1991, 1999–2001, 2009–2011, and 2015–2017 as the representative data of typical years (Figure 3).
2.3. Research Methods
2.3.1. Methodological Framework
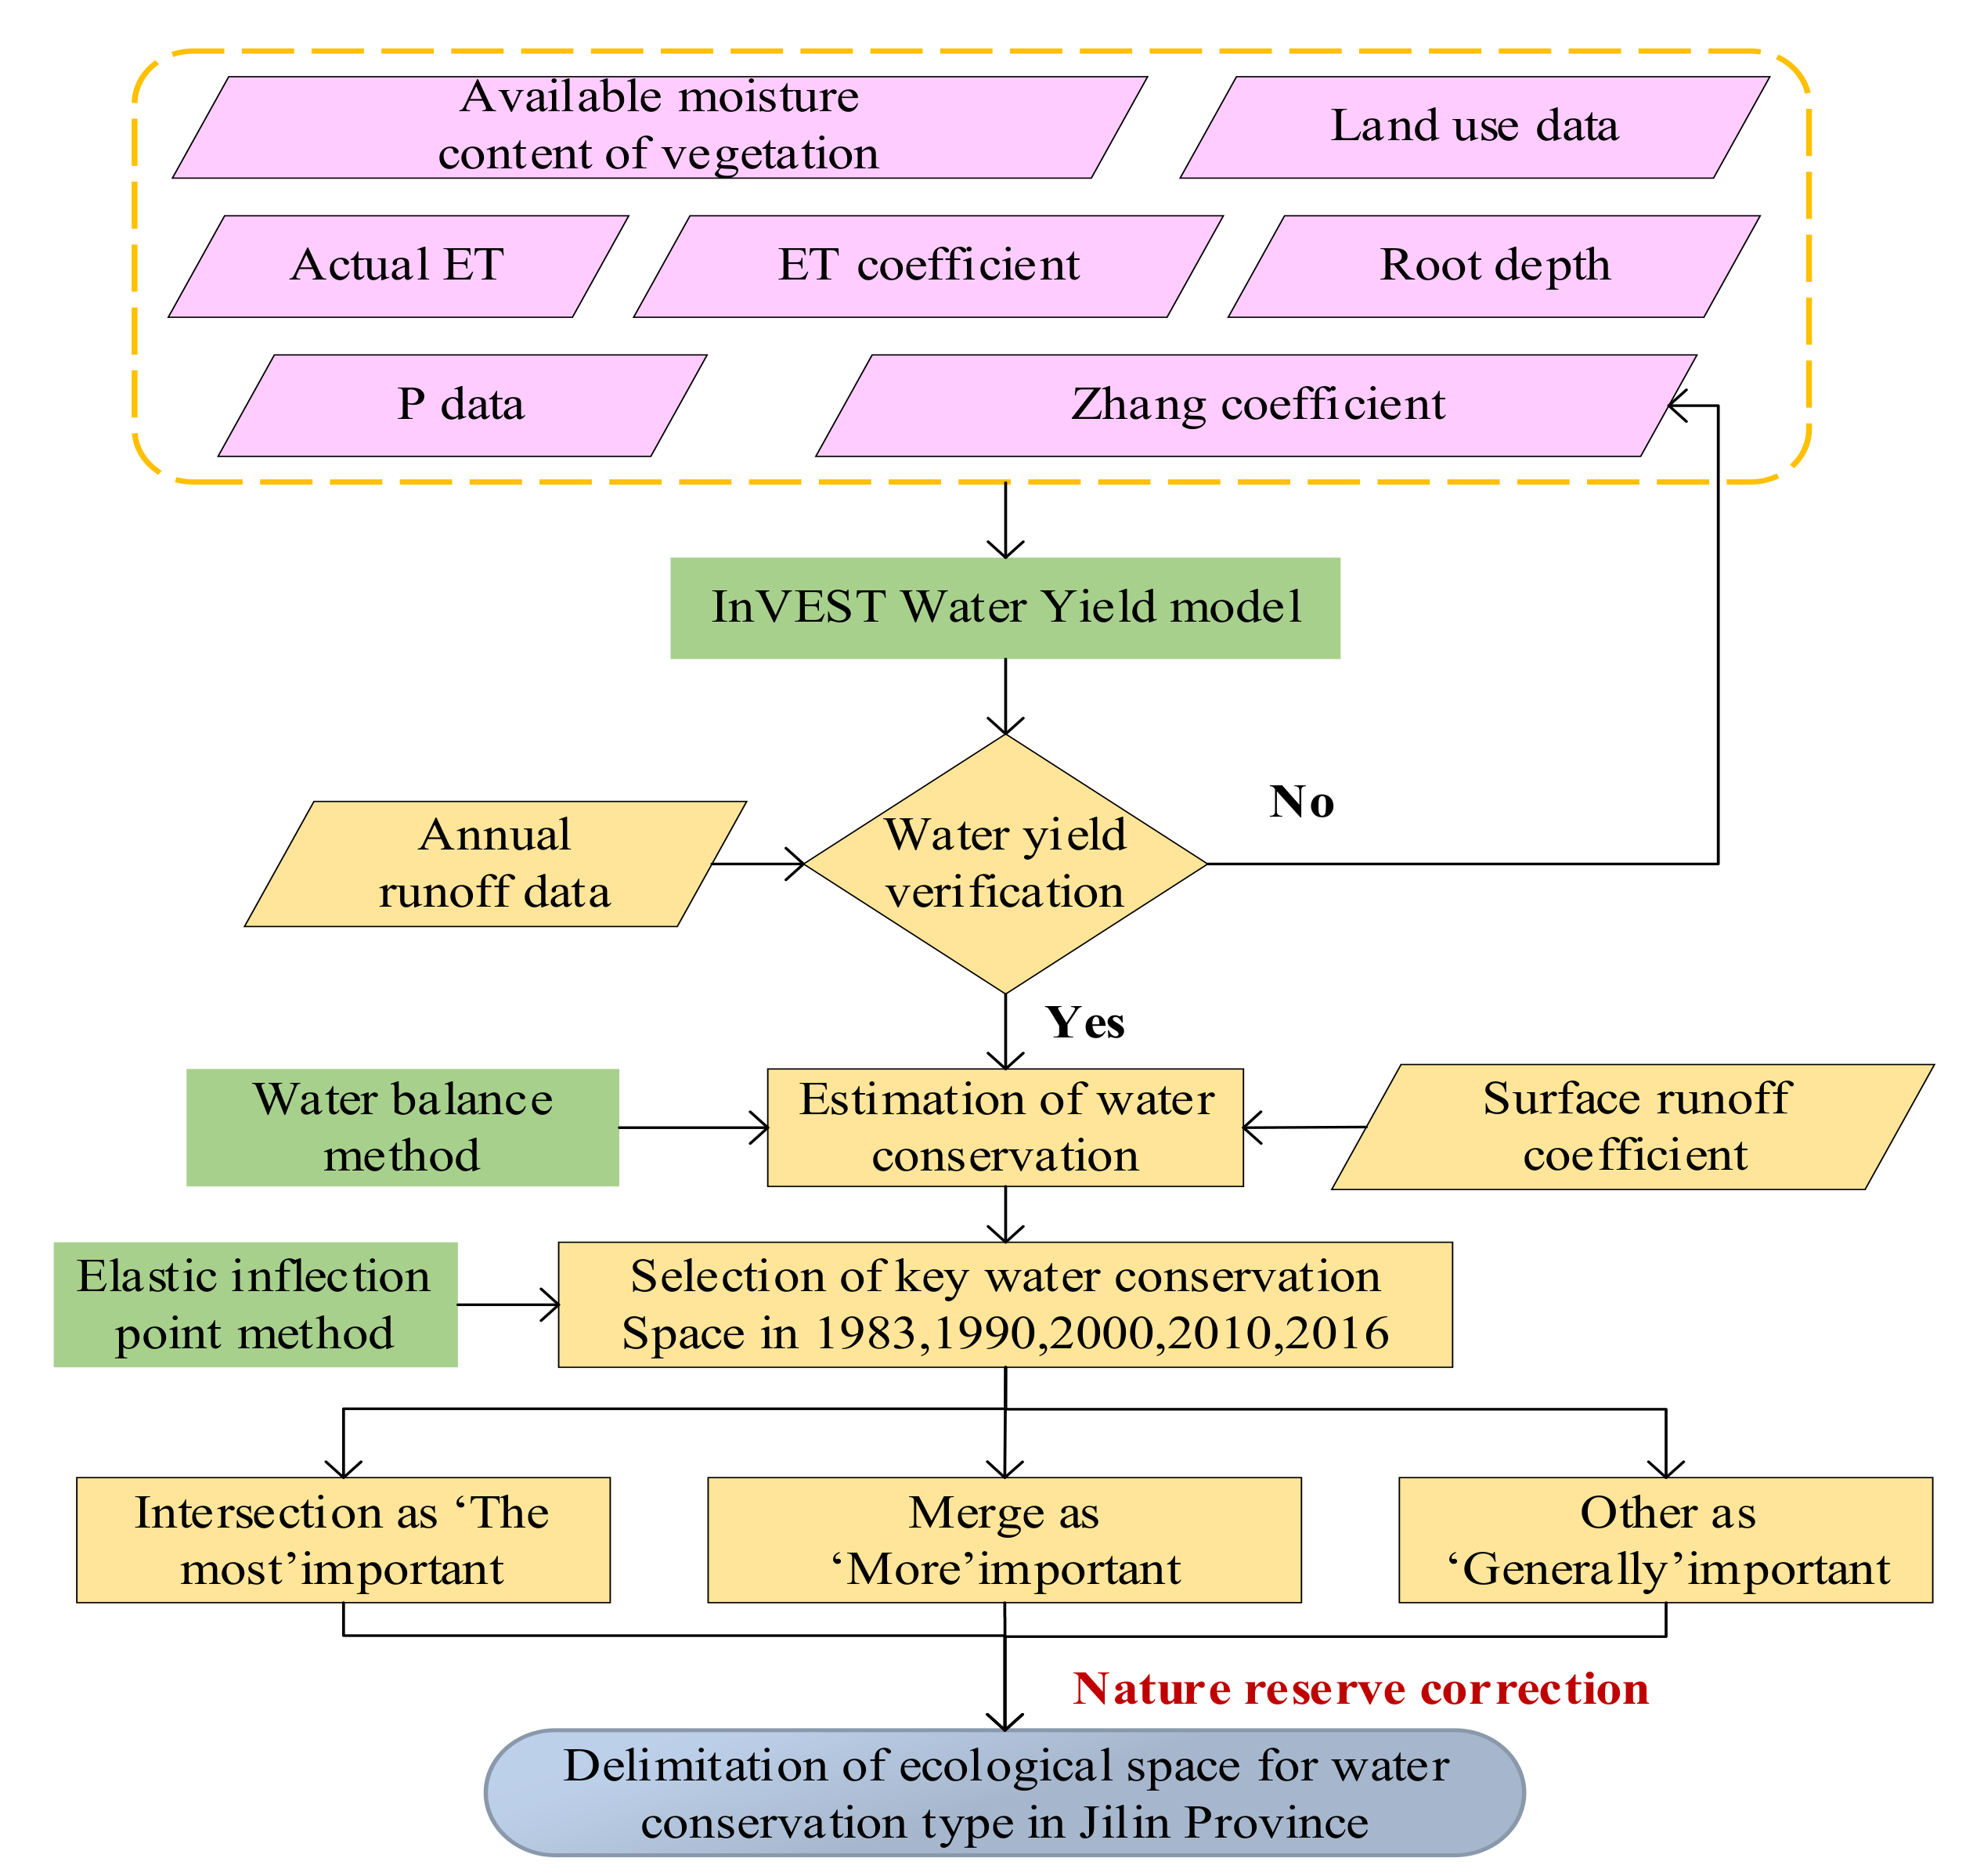
The methodological framework for delineation of the ecological space for water conservation is shown in Figure 4. (1) The InVEST Water Yield model was used to simulate the spatial distribution of water yield in 1983, 1990, 2000, 2010, and 2016. The calculation results were verified by using the annual runoff statistical data of Jilin province. (2) On the basis of water yield simulation, the water retention capacity from 1983 to 2016 was estimated by the water balance method. (3) The flexible inflection point method was used to find the inflection point, and the ecological space of important water conservation from 1983 to 2016 was selected at the same time; (4) the ecological space of important water conservation was finally delimited.
2.3.2. Calculation of Regional Water Yield Based on the InVEST Model
Water yield refers to the water outflow from the regional land use, which is the sum of water yield in sub-basins calculated according to the principle of water balance [34]. was the annual water yield per pixel under different land use patterns, and its calculation formula was as follows:
is the annual actual ET; is the annual P.
For vegetation cover areas, the ET of water balance was calculated by formula as follows:
is the potential ET. is a non-physical linear fitting parameter, which was used to characterize the surface characteristics of the watershed.
Where is the volumetric (mm) plant-available water content; the soil texture and effective rooting depth defined , which is used to indicate the total water in the soil that can be used by plants for growth. It is estimated as the product of the plant available water capacity (PAWC) and the minimum of root restricting layer depth and vegetation rooting depth:
Root restricting layer depth is the soil depth at which root penetration is inhibited because of physical or chemical characteristics. Vegetation rooting depth is often given as the depth at which 95% of a vegetation type’s root biomass occurs. PAWC is the plant available water capacity, i.e., the difference between field capacity and wilting point.
According to the soil texture, PAWC was calculated by Wenzuo Zhou’s empirical formula [28]:
where sand is the proportion of soil sand content (%); silt is the proportion of soil silt content (%); clay is the proportion of soil clay content (%); OM is the proportion of soil organic matter content (%).
Z is a parameter indicating P distribution and P, with a value between 1 and 30 [55]. In order to ensure the rationality of the results, the Water Yield model was validated according to the annual runoff data of 1983, 1990, and 2000 (, , ) of Jilin province [53]. When the value of Z was 18.3, the relative error between the simulation results and the actual annual runoff data was controlled within 5%, and the simulation results were , , , respectively. Therefore, Z was set at 18.3 in this paper. The water yield in 2010 and 2016 was , , respectively.
2.3.3. Water Conservation Calculation
In the InVEST model, the interception of P by vegetation and litter is returned to the atmosphere through ET, which makes little contribution to water conservation. This paper mainly considered the water retention capacity of the soil layer of the ecosystem [55]. The formula for calculating water retention capacity was as follows:
In the formula, is the annual water retention capacity; Yx is the annual water yield; is the annual surface runoff; Px was the annual P; is the surface runoff coefficient of the land use type .
The runoff coefficient comprehensively reflected the influence of natural geographical factors such as catchment topography, watershed characteristic factors, average slope, surface vegetation, and soil characteristics [56,57]. The smaller the runoff coefficient was, the easier the rainfall was absorbed by the soil. According to the relevant provisions of ‘Technical Guide for Red Line demarcation of Ecological Protection’ and ‘Code for Design of Building Water supply and drainage (GB50015-2009)’, combined with relevant studies in northeast China [58,59], the surface runoff coefficient was set as Table 2.
2.3.4. The Delineation Method of Important Ecological Space
The water conservation amount was the key index to evaluate the importance of water conservation [60]. In this paper, the functional value of water conservation was evaluated as follows:
- (1)
- By establishing the flexible relationship between the accumulative area of the benchmark units and the cumulative water conservation, the units were selected from the units with the largest water conservation value, and the sum of functional value was calculated. On this basis, the flexible relation model between cumulative units’ area and water conservation was established.
- (2)
- With the increase of units’ area, the cumulative value of water conservation increased synchronously. When the function value of each increasing unit was less than or equal to the increment of the function value of 1 unit, the elasticity of the functional area decreased. The conversion point was the inflection point. The units larger than the inflection point were the target range of the important water conservation space. As shown in Figure 5, all the units to the left of the inflection point could be selected as targets for important water conservation space. In other words, for every increase of 1 unit in the area of water conservation, the increment of water conservation was more than 1 unit.
- (3)
- The screening results in 1983, 1990, 2000, 2010, and 2016 were analyzed. The high-importance ecological space of Jilin province was obtained through intersect tool of ArcGIS, the medium importance ecological space was obtained through merge tool of ArcGIS, and the other areas were ecological space of low importance.
Finally, combined with the national nature reserve functional zoning data, provincial nature reserve zoning data, and other land use planning, the results were modified and adjusted.
3. Results and Analysis
3.1. Estimation of Water Conservation in 1983–2016
The amount of water conservation in Jilin province from 1983 to 2016 showed a spatial distribution pattern gradually decreasing from east to west. The natural forest area in the east of Changbai Mountain has a strong function of water conservation. In the middle of Songliao Plain, long-term agricultural activities have destroyed natural vegetation. The west was in the ecotone of agriculture and animal husbandry, and the ecological environment was fragile.
As shown in Figure 6, the area of each category was the same under the quantile principle. Based on this analysis of spatial distribution, most of the water conservation in Jilin province was less than 301 mm, accounting for more than 80% of the whole region. The maximum value of water conservation in Jilin province was 730 mm, which occurred in the Changbai Mountain area, and the minimum value was the water with 0 mm. In terms of the total amount, the total water conservation in 1983, 1990, 2000, 2010, and 2016 was , , , and , respectively.
From the changes in land use and water conservation in Jilin province from 1983 to 2016 (Figure 7), except for the great drought in Jilin province in 2000, the correlation coefficients between water conservation and various land-use types were positive. From 1983 to 2016, the cultivated land and buildings area of Jilin province increased, the conservation capacity also increased, while the grassland and water area decreased, and the conservation amount decreased correspondingly. Among them, the area of cultivated land increased by 7.71%, the amount of water conservation increased by ; the area of grassland decreased by 45.6%, and the corresponding amount of water conservation decreased by .
Although there was a positive correlation between land area and water conservation, the change of land area only reflected the change in water conservation.
According to the influence of unit area change on water conservation, the order of intensity was forestland, cultivated land, grassland, unused land, buildings, and water area. Among them, the forestland area most affected by water conservation decreased by , and the loss range of water retention capacity was 171,782–204,960 . Water was least affected by water conservation, and the water retention capacity was almost zero. Except for the drought in Jilin province in 2000, the water retention capacity of cultivated land and forestland per unit area increased significantly (Table 3). Since the 1980s, the government has always attached great importance to the protection of the natural environment. The construction of artificial forests and grassland shelterbelts has improved the ecological environment in the central and western regions. The quality of eco-environmental and the ability of ecological security have been significantly improved.
3.2. Analysis of the Water Conservation Change from 1983 to 2016
Based on the spatial change analysis of water conservation in each period (Figure 8), the overall trend of water conservation showed an upward trend from 1983 to 1990. The increased area was 36.54% more than the reduced area. In contrast, overall water conservation decreased significantly from 1990 to 2000. A total of 66.27% of water conservation decreased by 15–30% compared with the previous period, mainly due to the reduction of P caused by drought in Jilin province in 2000. Major changes had taken place in 2000–2010 and 2010–2016; except for a few areas, the growth rate of water conservation was 77% and 71.59%, with increases of 47% and 32.98%, respectively.
Overall (Figure 9a), from 1983 to 2016, water conservation showed a steady increasing trend, in which 94.04% in the areas had a change rate of 0–5%, the change was relatively stable. Among them, 75.71% of the total area showed an upward trend, and 18.33% showed a downward trend. The most obvious fluctuations were in the river beaches and around buildings in central Jilin province, where the rate of water conservation decline was more than 15%. Therefore, Jilin province should pay attention to the regulation of water system structure, rational utilization, and protection of water resources.
In addition (Figure 9b), except for the influence of land-use types, P and actual ET had a great influence on the total amount of water conservation [61]. The changes trend of water conservation from 1983 to 2016 was similar to the P. There was a positive correlation between water conservation and P.
3.3. Delineation of Important Space for Water Conservation
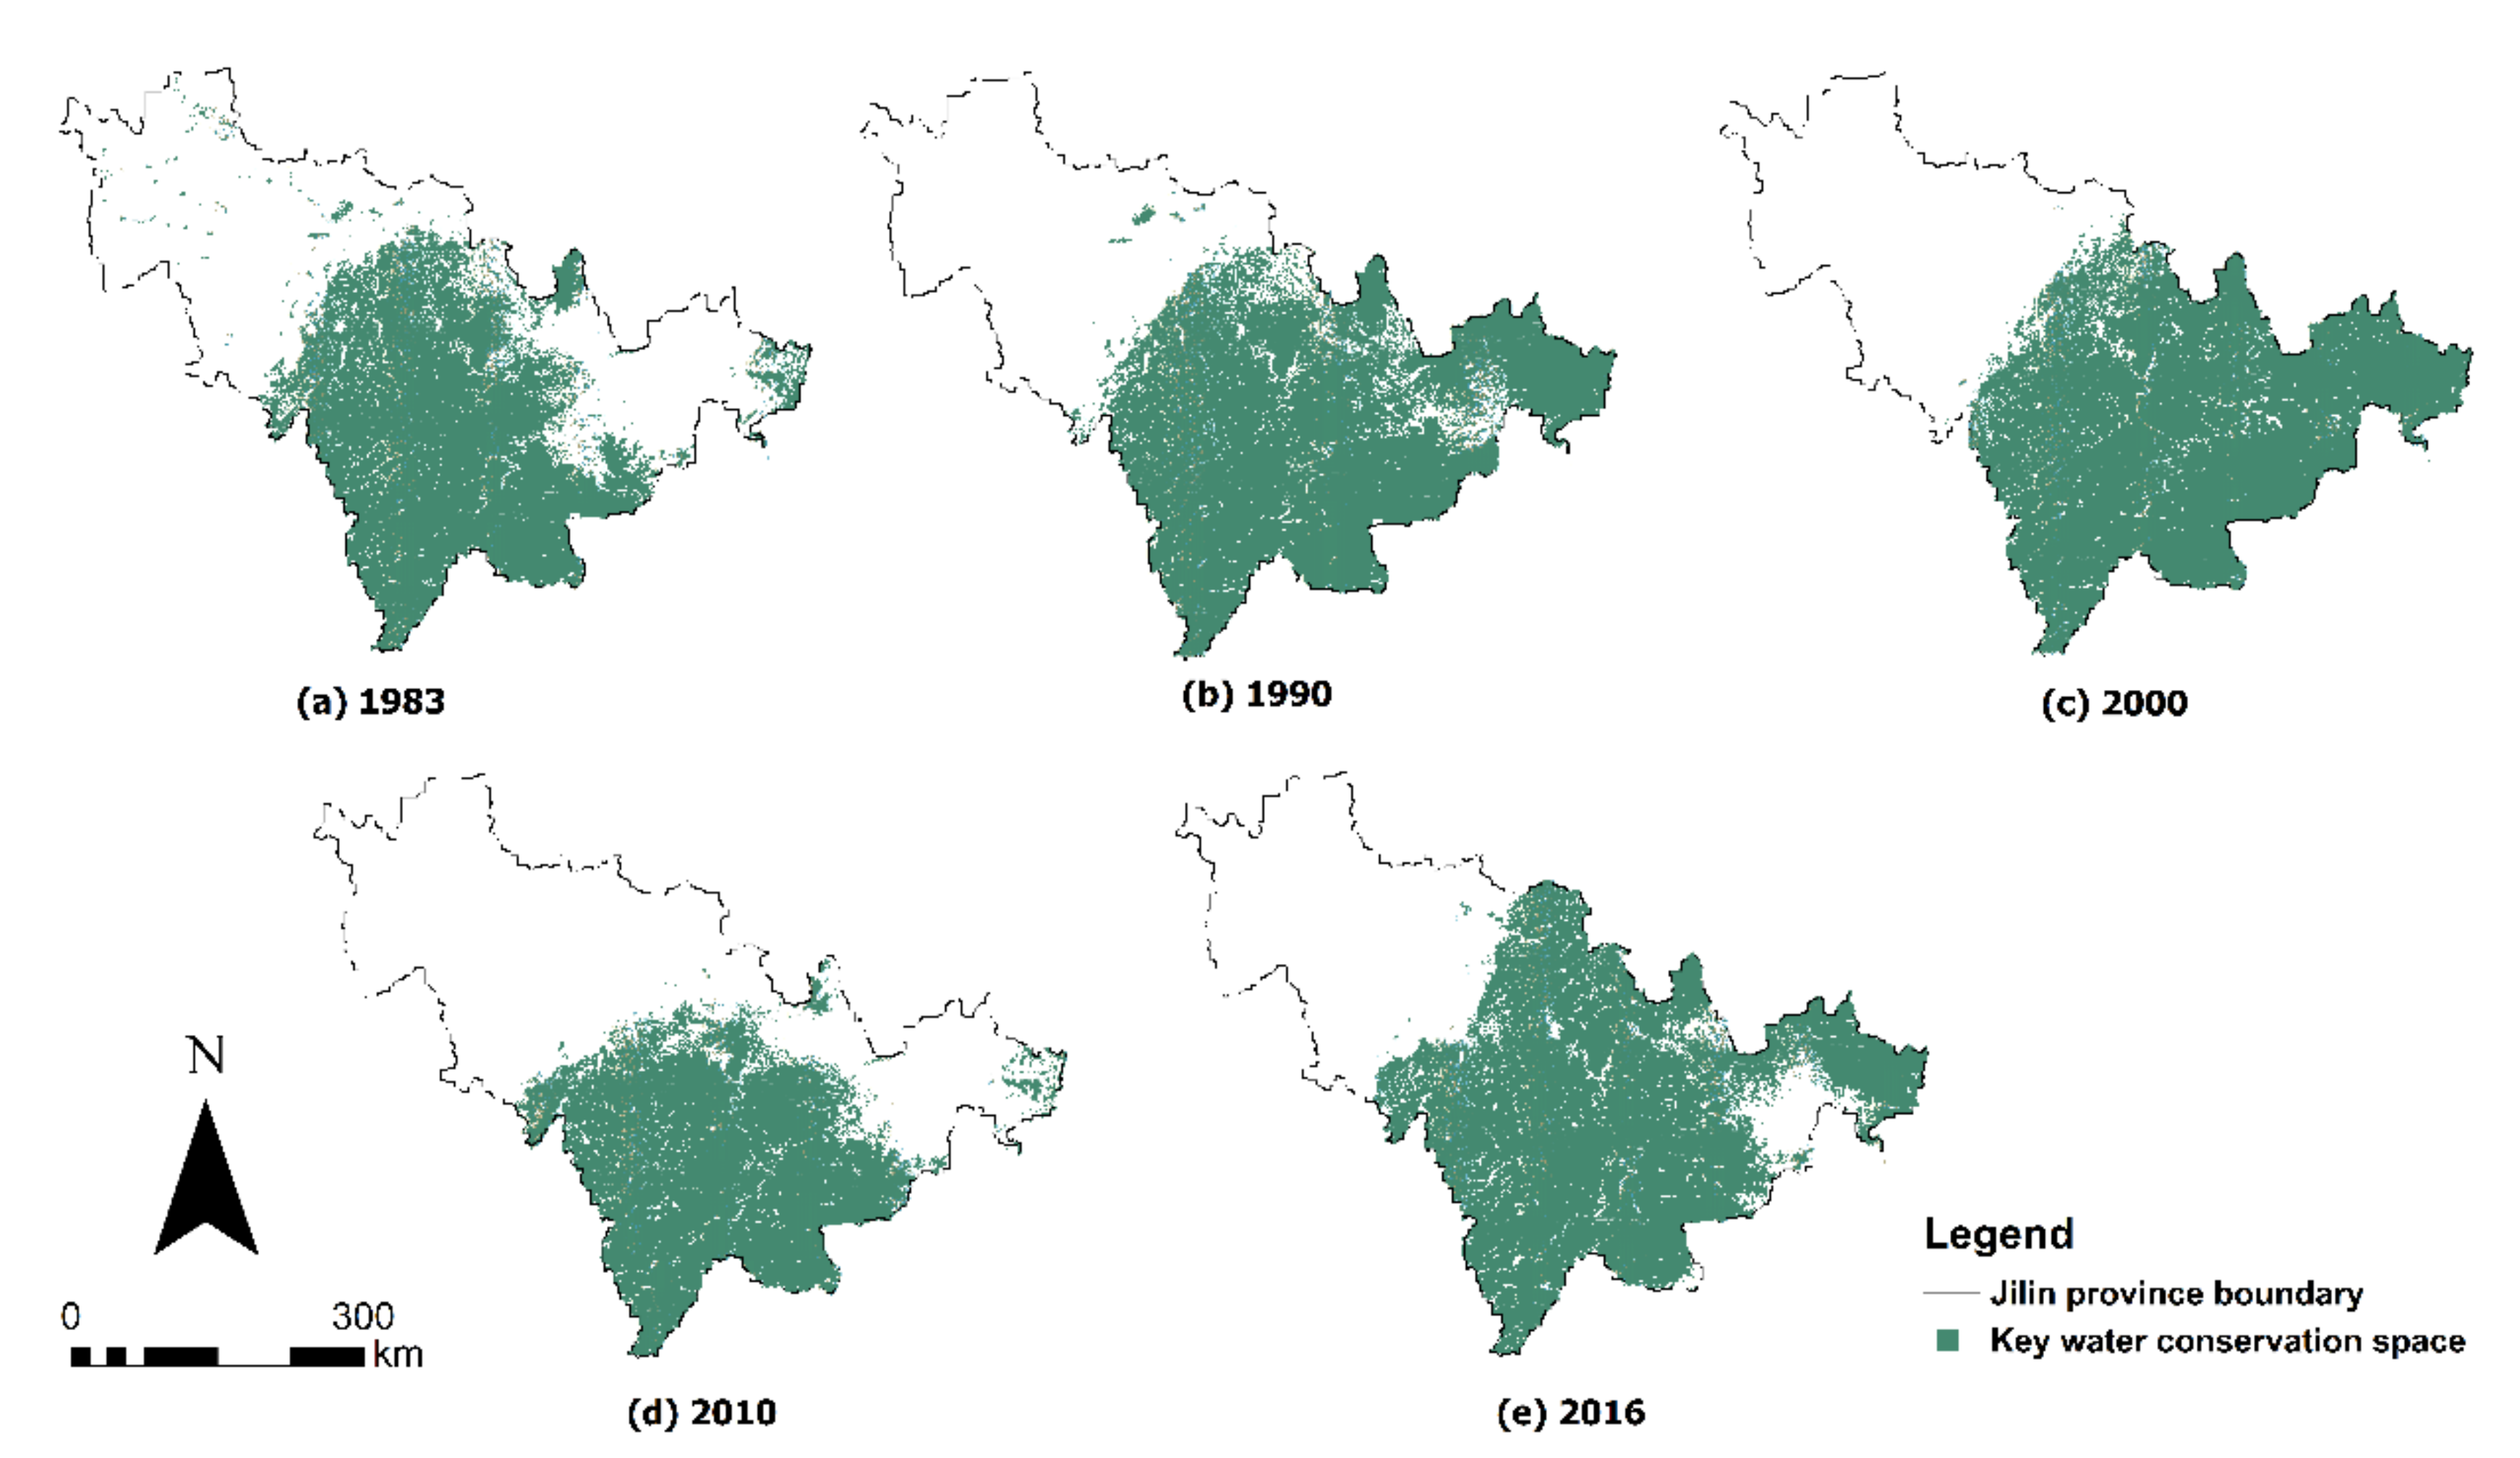
The study area was divided into 189,339 evaluation units with an area of . The tangent inflection point of the 45-degree slope of the curve was used as the division point (Figure 5). All the units in which the spatial functional value increased with the area and the marginal elasticity was greater than 1 were selected to delimit the ecological space of important water conservation in Jilin province from 1983 to 2016. As shown in Figure 10, the ecological space of important water conservation had an obvious law of spatial differentiation, in which the water retention capacity in the eastern mountain area was the strongest and that in the western wind–sand fragile area was weak.
The value of the flexible inflection point is shown in Table 4. According to statistics, the area of important water conservation space accounted for 44.05%, 52.59%, 56.54%, 39.04%, and 56.66% of the evaluation area in 1983, 1990, 2000, 2010, and 2016, respectively. The water conservation ratio of these important spaces was 63.86%, 71.32%, 83.15%, 63.44%, and 73.25%, respectively. These water conservation spaces (Figure 10) were the most valuable water conservation ecological spaces in 1983, 1990, 2000, 2010, and 2016, respectively.
Finally, the most valuable functional areas of water conservation from 1983 to 2016 were intersected, and the ‘high importance’ functional areas of water conservation in Jilin province were obtained by correcting by the national nature reserves data. Then, the ‘Medium importance’ functional areas were merged to obtain the most valuable ecological space of water conservation from 1983 to 2016. Finally, other areas were set as ‘low importance’ water conservation functional areas. As shown in Figure 11, high-importance areas were distributed in the south-central mountains, accounting for 36.97% of the total area. Except for protected areas such as the Momager wetland and Xiang Hai wetland, 34.3% of the areas in western Jilin province had the weakest water retention capacity. The delimitation results of ecological space for water conservation can not only serve the management of water resources and the macro-control of natural resources in Jilin province but also put forward a new method for the delimitation of ecological space in arid and water-scare areas.
4. Discussion
- (1)
- The diversity of factors affecting the water conservation change
The water conservation function of an ecosystem is a complex and comprehensive regulation process affected by many factors [62,63]. The process of water conservation is affected directly or indirectly by changing the type and structure of the underlying surface for land use. Specifically, soil porosity is affected by the changes in soil texture and structure, so the hydrological process is also affected [64,65,66]. It was found that the increase of cultivated land and buildings area will lead to an increase of regional water conservation to a certain extent, while the decrease of grassland area will lead to a corresponding improvement of water retention capacity. This conclusion was based on the internal homogeneity of each land-use type. However, if the internal differences of different land-use types were considered, the impact of land use on water conservation presented a more complex network structure. A variety of interaction modes were coupled with each other to form a complex interaction system. All the land use types involved in this paper were the broadest and simplest ways, which had relative limitations in the ways that affect water conservation and even many ecosystem services.
- (2)
- Contributions and Limitations
In view of the relative scarcity and uneven distribution of water resources in the study area, the evaluation of the water conservation function of a large ecosystem is helpful to make rational use of limited water resources and alleviate the contradiction between supply and demand of water resources; it is also of positive significance to the formulation of ecological protection policies [67,68]. Applying the methodological framework to the delineation of important ecological space of water conservation in Jilin province, the functional area of water conservation can be quantified scientifically and accurately. In Jilin province, the government should optimize the planting structure from the perspective of sustainable development, especially to improve the quality of grasslands in the central and western regions. At the same time, the restoration plan and ecological environment management of degraded forestland in the central and southern mountainous areas must be implemented. In addition, it is necessary to focus on the river beaches and construction where the water retention capacity has declined most, strengthen the implementation of national and local ecological construction policies, and perform good work in the planning of ecological functional areas.
Due to the temporal and spatial differences of influencing factors such as climate, topography, soil type and structure, surface mulch, land use patterns, social development, the spatial-temporal scale differences of ecosystem services [69], and the heterogeneity of ecosystem services [70], whether the results and conclusions of this study can be extended to other fields remains to be further studied. In this paper, a grid was selected to divide the evaluation unit. The spatial scale of the evaluation unit was larger, and part of the water retention capacity information may be omitted in the fine spatial scale. How to choose the appropriate spatial scale according to the purpose of evaluation and the need for decision making is an important direction that needs to be strengthened in future research. At the same time, to further explore the water yield and water conservation, the SWAT model will be used to accurately simulate the water cycle process in the next research.
5. Conclusions and Implications
Human activities and economic development have changed regional ecosystems and water resources utilization. To cope with these challenges, this study presented a methodological framework comprising four steps for ecological space for water conservation. The results showed that there was obvious spatial heterogeneity in water conservation services in Jilin province: (1) the high-value areas of water conservation were mainly distributed in the central and southern mountainous areas, while the low-value areas were mainly distributed in the ago-pastoral ecotone in the central and western regions. (2) The ecological space of water conservation of ‘high importance‘, ‘medium importance‘, and ‘low importance‘ accounted for 36.97%, 28.73%, and 34.30%, respectively.
The ecological spatial distribution of water conservation types at different levels was relatively concentrated, and the main determinants of this spatial distribution were surface vegetation cover and P. The framework of this paper is helpful to delineate the key areas of water conservation ecological space in the other arid and water shortage areas. It is possible for our framework to further understand the relationship between the regional environment and the use of water resources, which may also assist decision-makers in natural resource management by balancing the quality of ecosystem services and the allocation of natural resources.
Author Contributions
Conceptualization, H.W.; Data curation, J.M.; Formal analysis, W.Y.; Funding acquisition, C.Z. and L.L.; Methodology, H.W.; Supervision, W.Y.; Writing—original draft, H.W.; Writing—review and editing, C.Z., L.L., J.M. and L.G. All authors have read and agreed to the published version of the manuscript.
Funding
The research was funded by the Study on the Transition of Cultivated Land Protection in the Context of Fallow System, Philosophy and Social Science Foundation of China (Grant No. 19ZDA096).
Institutional Review Board Statement
Not applicable.
Informed Consent Statement
Not applicable.
Acknowledgments
We thank the research assistance from Changzhi Wang, Jinyou Li, Dehai Zhu, Yongxia Yang, Jianyu Yang, Peng Zhang, Shaner Li, Hao Guo, and Biqing Li for their help in obtaining the related data in this study. Moreover, we also thank the editors and anonymous reviewers for their review of the article and their insightful and constructive comments.We acknowledge the P data support from ‘National Earth System Science Data Center, National Science & Technology Infrastructure of China (http://www.geodata.cn accessed on 4 January 2021)’. The actual ET data set is provided by National Tibetan Plateau Data Center (http://data.tpdc.ac.cn accessed on 9 January 2021).
Conflicts of Interest
The authors declare no conflict of interest.
References
- Fei, L.; Shuwen, Z.; Jiuchun, Y.; Liping, C.; Haijuan, Y.; Kun, B. Effects of land use change on ecosystem services value in West Jilin since the reform and opening of China. Ecosyst. Serv. 2018, 31, 12–20. [Google Scholar] [CrossRef]
- Zhang, H.; Gao, Y.; Hua, Y.; Zhang, Y.; Liu, K. Assessing and mapping recreationists’ perceived social values for ecosystem services in the Qinling Mountains, China. Ecosyst. Serv. 2019, 39, 101006. [Google Scholar] [CrossRef]
- Zhang, H.; Xu, E. An evaluation of the ecological and environmental security on China’s terrestrial ecosystems. Sci. Rep. 2017, 7, 1–12. [Google Scholar] [CrossRef]
- Liu, S.; Lei, G.; Wang, D.; Li, H.; Li, W.; Gao, J. Reoccupying Ecological Land for Excessively Expanded Rust Belt Cities in Traditional Grain Bases: An Eco-Economic Trade-Off Perspective. Land 2020, 9, 297. [Google Scholar] [CrossRef]
- Yao, L.; Yu, Z.; Wu, M.; Ning, J.; Lv, T. The spatiotemporal evolution and trend prediction of ecological wellbeing performance in China. Land 2021, 10, 12. [Google Scholar] [CrossRef]
- Li, S.; Zhao, X.; Pu, J.; Miao, P.; Wang, Q.; Tan, K. Optimize and control territorial spatial functional areas to improve the ecological stability and total environment in karst areas of Southwest China. Land Use Policy 2021, 100, 104940. [Google Scholar] [CrossRef]
- Yang, Y.; Bao, W.; Liu, Y. Coupling coordination analysis of rural production-living-ecological space in the Beijing-Tianjin-Hebei region. Ecol. Indic. 2020, 117, 106512. [Google Scholar] [CrossRef]
- Chen, X.; Li, F.; Li, X.; Hu, Y.; Wang, Y. Mapping ecological space quality changes for ecological management: A case study in the Pearl River Delta urban agglomeration, China. J. Environ. Manag. 2020, 267, 110658. [Google Scholar] [CrossRef]
- Zhang, X.; Xu, Z. Functional coupling degree and human activity intensity of production–living–ecological space in underdeveloped regions in China: Case study of Guizhou Province. Land 2021, 10, 56. [Google Scholar] [CrossRef]
- Gao, J.; Wang, Y.; Zou, C.; Xu, D.; Lin, N.; Wang, L.; Zhang, K. China’s ecological conservation redline: A solution for future nature conservation. Ambio 2020, 49, 1519–1529. [Google Scholar] [CrossRef]
- Yang, Y.; Song, G.; Lu, S. Study on the ecological protection redline (EPR) demarcation process and the ecosystem service value (ESV) of the EPR zone: A case study on the city of Qiqihaer in China. Ecol. Indic. 2020, 109, 105754. [Google Scholar] [CrossRef]
- Liu, T.; Yang, X.; Geng, L.; Sun, B. A three-stage hybrid model for space-time analysis of water resources carrying capacity: A case study of Jilin province, China. Water 2020, 12, 426. [Google Scholar] [CrossRef] [Green Version]
- Lin, G.; Fu, J.; Jiang, D. Production–Living–Ecological Conflict Identification Using a Multiscale Integration Model Based on Spatial Suitability Analysis and Sustainable Development Evaluation: A Case Study of Ningbo, China. Land 2021, 10, 383. [Google Scholar] [CrossRef]
- Moglia, M.; Cook, S.; Tapsuwan, S. Promoting water conservation: Where to from here? Water 2018, 10, 1510. [Google Scholar] [CrossRef] [Green Version]
- Li, M.; Liang, D.; Xia, J.; Song, J.; Cheng, D.; Wu, J.; Cao, Y.; Sun, H.; Li, Q. Evaluation of water conservation function of Danjiang River Basin in Qinling Mountains, China based on InVEST model. J. Environ. Manag. 2021, 286, 112212. [Google Scholar] [CrossRef]
- Zheng, H.; Li, Y.; Robinson, B.E.; Liu, G.; Ma, D.; Wang, F.; Lu, F.; Ouyang, Z.; Daily, G.C. Using ecosystem service trade-offs to inform water conservation policies and management practices. Front. Ecol. Environ. 2016, 14, 527–532. [Google Scholar] [CrossRef]
- Pei, S.; Xie, G.; Liu, C.; Zhang, C.; Li, S.; Chen, L. Dynamic changes of water conservation service of typical ecosystems in China within a year based on data from CERN. Sustainability 2015, 7, 16513–16531. [Google Scholar] [CrossRef] [Green Version]
- Mahmoodi, N.; Kiesel, J.; Wagner, P.D.; Fohrer, N. Integrating water use systems and soil and water conservation measures into a hydrological model of an Iranian Wadi system. J. Arid Land 2020, 12, 545–560. [Google Scholar] [CrossRef]
- Návar, J. Fitting rainfall interception models to forest ecosystems of Mexico. J. Hydrol. 2017, 548, 458–470. [Google Scholar] [CrossRef]
- Zhou, G.; Wei, X.; Luo, Y.; Zhang, M.; Li, Y.; Qiao, Y.; Liu, H.; Wang, C. Forest recovery and river discharge at the regional scale of Guangdong Province, China. Water Resour. Res. 2010, 46, 46. [Google Scholar] [CrossRef] [Green Version]
- Sun, F.; Lü, Y.; Wang, J.; Hu, J.; Fu, B. Soil moisture dynamics of typical ecosystems in response to precipitation: A monitoring-based analysis of hydrological service in the Qilian Mountains. Catena 2015, 129, 63–75. [Google Scholar] [CrossRef]
- Blanco-Canqui, H.; Lal, R. Soil and water conservation. In Principles of Soil Conservation and Management; Springer: Dordrecht, The Netherlands, 2010; pp. 1–19. [Google Scholar]
- Saurí, D. Water conservation: Theory and evidence in urban areas of the developed world. Annu. Rev. Environ. Resour. 2013, 38, 227–248. [Google Scholar] [CrossRef]
- Song, C.L. Sustainable Development of Agricultural Product Processing Industry in Jilin province of China. J. Agric. Sci. 2011, 3, 238. [Google Scholar] [CrossRef] [Green Version]
- Liu, Y.; Wang, D.; Gao, J.; Deng, W. Land use/cover changes, the environment and water resources in Northeast China. Environ. Manag. 2005, 36, 691–701. [Google Scholar] [CrossRef]
- Wang, Q.; Liu, Y.-Y.; Zhang, Y.-Z.; Tong, L.-J.; Li, X.; Li, J.-L.; Sun, Z. Assessment of spatial agglomeration of agricultural drought disaster in China from 1978 to 2016. Sci. Rep. 2019, 9, 1–8. [Google Scholar] [CrossRef]
- Li, Q.S.; Willardson, L.S.; Deng, W.; Li, X.J.; Liu, C.J. Crop water deficit estimation and irrigation scheduling in western Jilin province, Northeast China. Agric. Water Manag. 2005, 71, 47–60. [Google Scholar] [CrossRef]
- Zhou, W.; Liu, G.; Pan, J.; Feng, X. Distribution of available soil water capacity in China. J. Geogr. Sci. 2005, 15, 3–12. [Google Scholar] [CrossRef]
- Wang, J.; Qin, L.; He, H. Assessing temporal and spatial inequality of water footprint based on socioeconomic and environmental factors in Jilin province, China. Water 2019, 11, 521. [Google Scholar] [CrossRef] [Green Version]
- Yang, Z.; Wang, S.; Guo, M.; Tian, J.; Zhang, Y. Spatiotemporal Differentiation of Territorial Space Development Intensity and Its Habitat Quality Response in Northeast China. Land 2021, 10, 573. [Google Scholar] [CrossRef]
- Li, M.; Xiao, C.; Liang, X.; Cao, Y.; Hu, S. Hydrogeochemical evolution under a changing environment: A case study in Jilin, China. Water Supply 2020, 20, 1653–1663. [Google Scholar] [CrossRef]
- Yang, D.; Liu, W.; Tang, L.; Chen, L.; Li, X.; Xu, X. Estimation of water provision service for monsoon catchments of South China: Applicability of the InVEST model. Landsc. Urban Plan. 2019, 182, 133–143. [Google Scholar] [CrossRef]
- Cong, W.; Sun, X.; Guo, H.; Shan, R. Comparison of the SWAT and InVEST models to determine hydrological ecosystem service spatial patterns, priorities and trade-offs in a complex basin. Ecol. Indic. 2020, 112, 106089. [Google Scholar] [CrossRef]
- Redhead, J.; Stratford, C.; Sharps, K.; Jones, L.; Ziv, G.; Clarke, D.; Oliver, T.; Bullock, J. Empirical validation of the InVEST water yield ecosystem service model at a national scale. Sci. Total Environ. 2016, 569, 1418–1426. [Google Scholar] [CrossRef] [PubMed] [Green Version]
- Yang, X.; Chen, R.; Meadows, M.E.; Ji, G.; Xu, J. Modelling water yield with the InVEST model in a data scarce region of northwest China. Water Supply 2020, 20, 1035–1045. [Google Scholar] [CrossRef]
- Xu, J.; Xie, G.; Xiao, Y.; Li, N.; Yu, F.; Pei, S.; Jiang, Y. Dynamic analysis of ecological environment quality combined with water conservation changes in national key ecological function areas in China. Sustainability 2018, 10, 1202. [Google Scholar] [CrossRef] [Green Version]
- Ayivi, F.; Jha, M.K. Estimation of water balance and water yield in the Reedy Fork-Buffalo Creek Watershed in North Carolina using SWAT. Int. Soil Water Conserv. Res. 2018, 6, 203–213. [Google Scholar] [CrossRef]
- Moiwo, J.P.; Tao, F.; Lu, W. Estimating soil moisture storage change using quasi-terrestrial water balance method. Agric. Water Manag. 2011, 102, 25–34. [Google Scholar] [CrossRef]
- Ji, G.; Wu, L.; Wang, L.; Yan, D.; Lai, Z. Attribution Analysis of Seasonal Runoff in the Source Region of the Yellow River Using Seasonal Budyko Hypothesis. Land 2021, 10, 542. [Google Scholar] [CrossRef]
- Wang, J.; Liu, K.; Weng, N. Research on water conservation service function of forest ecological system in upstream of Hanjiang River based on In-VEST model. Bull. Soil Water Conserv. 2014, 34, 213–217. [Google Scholar]
- Juniati, A.; Sutjiningsih, D.; Soeryantono, H.; Kusratmoko, E. Proposing water balance method for water availability estimation in Indonesian regional spatial planning. IOP Conf. Ser. Earth Environ. Sci. 2018, 106, 12073. [Google Scholar] [CrossRef]
- Gao, J.; Li, F.; Gao, H.; Zhou, C.; Zhang, X. The impact of land-use change on water-related ecosystem services: A study of the Guishui River Basin, Beijing, China. J. Clean. Prod. 2017, 163, S148–S155. [Google Scholar] [CrossRef]
- Chen, D.; Pan, Y.; Jin, X.; Du, H.; Li, M.; Jiang, P. The delineation of ecological redline area for catchment sustainable management from the perspective of ecosystem services and social needs: A case study of the Xiangjiang watershed, China. Ecol. Indic. 2021, 121, 107130. [Google Scholar] [CrossRef]
- Gantioler, S. The Right to Ecological Space/In the City. Operationalising ‘Green Infrastructure’ as Strategic Urban Planning Concept for a Just Access; Technische Universität München: München, Germany, 2018. [Google Scholar]
- Bai, Y.; Wong, C.P.; Jiang, B.; Hughes, A.C.; Wang, M.; Wang, Q. Developing China’s Ecological Redline Policy using ecosystem services assessments for land use planning. Nat. Commun. 2018, 9, 1–13. [Google Scholar] [CrossRef] [Green Version]
- Wang, Y.; Gao, J.; Zou, C.; Xu, D.; Wang, L.; Jin, Y.; Wu, D.; Lin, N.; Xu, M. Identifying ecologically valuable and sensitive areas: A case study analysis from China. J. Nat. Conserv. 2017, 40, 49–63. [Google Scholar] [CrossRef]
- Xu, X.; Yang, G.; Tan, Y. Identifying ecological red lines in China’s Yangtze River Economic Belt: A regional approach. Ecol. Indic. 2019, 96, 635–646. [Google Scholar] [CrossRef]
- Peng, J.; Wang, A.; Luo, L.; Liu, Y.; Li, H.; Hu, Y.n.; Meersmans, J.; Wu, J. Spatial identification of conservation priority areas for urban ecological land: An approach based on water ecosystem services. Land Degrad. Dev. 2019, 30, 683–694. [Google Scholar] [CrossRef] [Green Version]
- Xie, H.; Yao, G.; Liu, G. Spatial evaluation of the ecological importance based on GIS for environmental management: A case study in Xingguo county of China. Ecol. Indic. 2015, 51, 3–12. [Google Scholar] [CrossRef]
- Hong, W.; Jiang, R.; Yang, C.; Zhang, F.; Su, M.; Liao, Q. Establishing an ecological vulnerability assessment indicator system for spatial recognition and management of ecologically vulnerable areas in highly urbanized regions: A case study of Shenzhen, China. Ecol. Indic. 2016, 69, 540–547. [Google Scholar] [CrossRef]
- Li, X.; Wang, D.; Ren, Y.; Wang, Z.; Zhou, Y. Soil quality assessment of croplands in the black soil zone of Jilin province, China: Establishing a minimum data set model. Ecol. Indic. 2019, 107, 105251. [Google Scholar] [CrossRef]
- Dong, Y.; Ren, Z.; Fu, Y.; Yang, R.; Sun, H.; He, X. Land Use/Cover Change and Its Policy Implications in Typical Agriculture-forest Ecotone of Central Jilin province, China. Chin. Geogr. Sci. 2021, 31, 261–275. [Google Scholar] [CrossRef]
- Zhang, Q.; Xiao, C.; Zhu, Y.; Zhai, T.; Liang, X. Analysis on Spatio-temporal variation characteristics and causes of runoff in Jilin province. Water Sav. Irrig. 2013, 7, 53–57. [Google Scholar]
- Liu, J.; Kuang, W.; Zhang, Z.; Xu, X.; Qin, Y.; Ning, J.; Zhou, W.; Zhang, S.; Li, R.; Yan, C. Spatiotemporal characteristics, patterns, and causes of land-use changes in China since the late 1980s. J. Geogr. Sci. 2014, 24, 195–210. [Google Scholar] [CrossRef]
- Bai, Y.; Ochuodho, T.O.; Yang, J. Impact of land use and climate change on water-related ecosystem services in Kentucky, USA. Ecol. Indic. 2019, 102, 51–64. [Google Scholar] [CrossRef]
- Giudice, G.D.; Padulano, R.; Rasulo, G. Factors affecting the runoff coefficient. Hydrol. Earth Syst. Sci. Discuss. 2012, 9, 4919–4941. [Google Scholar]
- Sriwongsitanon, N.; Taesombat, W. Effects of land cover on runoff coefficient. J. Hydrol. 2011, 410, 226–238. [Google Scholar] [CrossRef]
- Zhang, Y.; Guan, D.; Jin, C.; Wang, A.; Wu, J.; Yuan, F. Analysis of impacts of climate variability and human activity on streamflow for a river basin in northeast China. J. Hydrol. 2011, 410, 239–247. [Google Scholar] [CrossRef]
- Li, T.; Dong, J.; Yuan, W. Effects of precipitation and vegetation cover on annual runoff and sediment yield in Northeast China: A preliminary analysis. Water Resour. 2020, 47, 491–505. [Google Scholar]
- Biao, Z.; Wenhua, L.; Gaodi, X.; Yu, X. Water conservation of forest ecosystem in Beijing and its value. Ecol. Econ. 2010, 69, 1416–1426. [Google Scholar] [CrossRef]
- Wang, S.; Wang, Y.; Ran, L.; Su, T. Climatic and anthropogenic impacts on runoff changes in the Songhua River basin over the last 56 years (1955–2010), Northeastern China. Catena 2015, 127, 258–269. [Google Scholar] [CrossRef]
- Li, L.; Huang, G.; Zhang, R.; Bill, B.; Guangdi, L.; Kwong, Y.C. Benefits of conservation agriculture on soil and water conservation and its progress in China. Agric. Sci. China 2011, 10, 850–859. [Google Scholar] [CrossRef]
- Mukherjee, S.; Bebermeier, W.; Schütt, B. An overview of the impacts of land use land cover changes (1980–2014) on urban water security of Kolkata. Land 2018, 7, 91. [Google Scholar] [CrossRef] [Green Version]
- Jara-Rojas, R.; Bravo-Ureta, B.E.; Engler, A.; Díaz, J. An analysis of the joint adoption of water conservation and soil conservation in Central Chile. Land Use Policy 2013, 32, 292–301. [Google Scholar] [CrossRef]
- Taye, G.; Poesen, J.; Wesemael, B.V.; Vanmaercke, M.; Teka, D.; Deckers, J.; Goosse, T.; Maetens, W.; Nyssen, J.; Hallet, V. Effects of land use, slope gradient, and soil and water conservation structures on runoff and soil loss in semi-arid Northern Ethiopia. Phys. Geogr. 2013, 34, 236–259. [Google Scholar] [CrossRef] [Green Version]
- Bewket, W. Soil and water conservation intervention with conventional technologies in northwestern highlands of Ethiopia: Acceptance and adoption by farmers. Land Use Policy 2007, 24, 404–416. [Google Scholar] [CrossRef]
- Feng, C.; Tang, X.; Jin, Y.; Höök, M. The role of energy-water nexus in water conservation at regional levels in China. J. Clean. Prod. 2019, 210, 298–308. [Google Scholar] [CrossRef]
- Gleick, P.H. A look at twenty-first century water resources development. Water Int. 2000, 25, 127–138. [Google Scholar] [CrossRef]
- Jenerette, G.D.; Potere, D. Global analysis and simulation of land-use change associated with urbanization. Landsc. Ecol. 2010, 25, 657–670. [Google Scholar] [CrossRef]
- Gong, S.; Xiao, Y.; Xiao, Y.; Zhang, L.; Ouyang, Z. Driving forces and their effects on water conservation services in forest ecosystems in China. Chin. Geogr. Sci. 2017, 27, 216–228. [Google Scholar] [CrossRef] [Green Version]
Figure 1.
The map of study area depicts the location of Jilin province and presents the elevation information.
Figure 1.
The map of study area depicts the location of Jilin province and presents the elevation information.

Figure 2.
The land use maps of Jilin province in (a) 1983, (b) 1990, (c) 2000, (d) 2010, and (e) 2016, reclassified into six categories.
Figure 2.
The land use maps of Jilin province in (a) 1983, (b) 1990, (c) 2000, (d) 2010, and (e) 2016, reclassified into six categories.

Figure 3.
The spatial-temporal distribution characteristics of the P data in Jilin province in (a) 1983, (b) 1990, (c) 2000, (d) 2010, and (e) 2016.
Figure 3.
The spatial-temporal distribution characteristics of the P data in Jilin province in (a) 1983, (b) 1990, (c) 2000, (d) 2010, and (e) 2016.

Figure 4.
The methodological framework of ecological space delimitation.

Figure 5.
The schematic diagram of cumulative function and cumulative area, and the left units of the inflection point were the important water conservation space target units.
Figure 5.
The schematic diagram of cumulative function and cumulative area, and the left units of the inflection point were the important water conservation space target units.

Figure 6.
The water conservation spital-temporal distribution pattern of Jilin province in (a) 1983, (b) 1990, (c) 2000, (d) 2010, and (e) 2016.
Figure 6.
The water conservation spital-temporal distribution pattern of Jilin province in (a) 1983, (b) 1990, (c) 2000, (d) 2010, and (e) 2016.

Figure 7.
The change trends of water retention capacity of (a) cultivated land, (b) forestland, (c) grassland, (d) unused land, (e) water, and (f) buildings from 1983 to 2016.
Figure 7.
The change trends of water retention capacity of (a) cultivated land, (b) forestland, (c) grassland, (d) unused land, (e) water, and (f) buildings from 1983 to 2016.


Figure 8.
Spatial change and change rate of water conservation distribution in Jilin province in (a) 1983–1990, (b) 1990–2000, (c) 2000–2010, (d) 2010–2018.
Figure 8.
Spatial change and change rate of water conservation distribution in Jilin province in (a) 1983–1990, (b) 1990–2000, (c) 2000–2010, (d) 2010–2018.

Figure 9.
(a) Total spatial change and change rate of water conservation from 1983 to 2016; (b) the total amount of P, actual ET, and change trends of Jilin province in 1983, 1990, 2000, 2010, and 2016.
Figure 9.
(a) Total spatial change and change rate of water conservation from 1983 to 2016; (b) the total amount of P, actual ET, and change trends of Jilin province in 1983, 1990, 2000, 2010, and 2016.

Figure 10.
The important water conservation spaces of Jilin province in (a) 1983, (b) 1990, (c) 2000, (d) 2010, and (e) 2016, respectively.
Figure 10.
The important water conservation spaces of Jilin province in (a) 1983, (b) 1990, (c) 2000, (d) 2010, and (e) 2016, respectively.

Figure 11.
(a) Delimitation result of ecological space for water conservation, and (b) the proportion of functional areas with different levels of different importance.
Figure 11.
(a) Delimitation result of ecological space for water conservation, and (b) the proportion of functional areas with different levels of different importance.


Table 1.
The datasets used for simulating the change of water conservation.
| Data | Description | Data Source |
|---|---|---|
| Land use | Land use/cover data with a spatial resolution of 30 m in 1983, 1990, 2000, 2010, and 2016 | Resources and Environment data cloud platform of Chinese Academy of Sciences (http://www.resdc.cn/ accessed on 21 October 2019) |
| Average annual P | Monthly P data set in China from 1901 to 2017, with a resolution of about 1 km | National Earth System Science Data Center, National Science & Technology Infrastructure of China (http://www.geodata.cn accessed on 4 January 2021) |
| Annual average ET | Monthly actual ET data set in China from 1982 to 2017 | Terrestrial evapotranspiration dataset across China (1982–2017), National Tibetan Plateau Data Center (https://data.tpdc.ac.cn/zh-hans/ accessed on 9 January 2021) |
| Soil data | Soil texture (clay%, sand%, loam%), soil depth | Institute of Soil Science, Chinese Academy of Sciences (http://english.issas.cas.cn/ accessed on 10 November 2020) |
| Annual runoff | Annual runoff of Jilin province from 1982 to 2000 | Statistical data in the paper [53] |
Table 2.
The surface runoff coefficient’s value of different land types.
| Land Number | Land Use Name | Surface Runoff Coefficient’s Value |
|---|---|---|
| 1 | Cultivated land | 0.05 |
| 2 | Forestland | 0.0229 |
| 3 | Grassland | 0.082 |
| 4 | Water | 0 |
| 5 | Building | 0.5 |
| 6 | Unused land | 0.2 |
Table 3.
The water conservation per unit area for different land types (unit: ).
| Year | Cultivated Land | Forestland | Grassland | Water | Buildings | Unused Land |
|---|---|---|---|---|---|---|
| 1983 | 119,059 | 171,782 | 14,542 | 2 | 0 | 8241 |
| 1990 | 130,870 | 197,141 | 15,083 | 3 | 0 | 11,197 |
| 2000 | 90,012 | 165,729 | 6212 | 2 | 0 | 3106 |
| 2010 | 129,803 | 203,501 | 8547 | 2 | 118 | 8752 |
| 2016 | 156,444 | 204,960 | 10,129 | 4 | 1145 | 12,477 |
Table 4.
Evaluation results of water conservation function in Jilin province.
| Year | Inflection Point ID | Cumulative Area Proportion/% | Water Retention Capacity/ | Cumulative Function Proportion/% | |
|---|---|---|---|---|---|
| 1983 | 83,404 | 82,550 | 44.05 | 1.48 | 63.86 |
| 1990 | 101,437 | 98,554 | 52.59 | 1.85 | 71.32 |
| 2000 | 105,952 | 105,956 | 56.54 | 1.71 | 83.15 |
| 2010 | 73,217 | 73,161 | 39.04 | 1.71 | 63.44 |
| 2016 | 106,135 | 106,181 | 56.66 | 2.13 | 73.25 |
Publisher’s Note: MDPI stays neutral with regard to jurisdictional claims in published maps and institutional affiliations. |
© 2021 by the authors. Licensee MDPI, Basel, Switzerland. This article is an open access article distributed under the terms and conditions of the Creative Commons Attribution (CC BY) license (https://creativecommons.org/licenses/by/4.0/).
Share and Cite
MDPI and ACS Style
Wang, H.; Zhang, C.; Li, L.; Yun, W.; Ma, J.; Gao, L. Delimitating the Ecological Spaces for Water Conservation Services in Jilin Province of China. Land 2021, 10, 1029. https://0-doi-org.brum.beds.ac.uk/10.3390/land10101029
AMA Style
Wang H, Zhang C, Li L, Yun W, Ma J, Gao L. Delimitating the Ecological Spaces for Water Conservation Services in Jilin Province of China. Land. 2021; 10(10):1029. https://0-doi-org.brum.beds.ac.uk/10.3390/land10101029
Chicago/Turabian StyleWang, Huan, Chao Zhang, Li Li, Wenju Yun, Jiani Ma, and Lulu Gao. 2021. "Delimitating the Ecological Spaces for Water Conservation Services in Jilin Province of China" Land 10, no. 10: 1029. https://0-doi-org.brum.beds.ac.uk/10.3390/land10101029
Note that from the first issue of 2016, this journal uses article numbers instead of page numbers. See further details here.