Article

Pollution Characteristics, Spatial Patterns, and Sources of Toxic Elements in Soils from a Typical Industrial City of Eastern China

1
College of Economics and Management, Zhejiang A&F University, Hangzhou 311300, China
2
Key Laboratory of Environment Remediation and Ecological Health, Ministry of Education, College of Environmental and Resource Sciences, Zhejiang University, Hangzhou 310058, China
3
Protection and Monitoring Station of Agricultural Environment, Bureau of Agriculture of Department of Rural and Agriculture of Zhejiang Province, Hangzhou 310020, China
4
Department of Land Resource Management, School of Tourism and Urban Management, Jiangxi University of Finance and Economics, Nanchang 330013, China
5
School of Geographical Sciences, Faculty of Science and Engineering, University of Nottingham Ningbo China, Ningbo 315100, China
*
Author to whom correspondence should be addressed.
Submission received: 29 September 2021 / Revised: 18 October 2021 / Accepted: 19 October 2021 / Published: 22 October 2021
(This article belongs to the Special Issue Contamination of Soils and Environmental Risks)

Abstract

:
Soil pollution due to toxic elements (TEs) has been a core environmental concern globally, particularly in areas with developed industries. In this study, we sampled 300 surface (0–0.2 m) soil samples from Yuyao City in eastern China. Initially, the geo-accumulation index, potential ecological risk index, single pollution index, and Nemerow composite pollution index were used to evaluate the soil contamination status in Yuyao City. Ordinary kriging was then deployed to map the distribution of the soil TEs. Subsequently, indicator kriging was utilized to identify regions with high risk of TE pollution. Finally, the positive matrix factorization model was used to apportion the sources of the different TEs. Our results indicated that the mean content of different TEs kept the order: Zn > Cr > Pb > Cu > Ni > As > Hg ≈ Cd. Soil pollution was mainly caused by Cd and Hg in the soil of Yuyao City, while the content of other TEs was maintained at a safe level. Regions with high TE content and high pollution risk of TEs are mainly located in the central part of Yuyao City. Four sources of soil TEs were apportioned in Yuyao City. The Pb, Hg, and Zn contents in soil were mainly derived from traffic activities, coal combustion, and smelting. Meanwhile, Cu was mainly sourced from industrial emissions and atmospheric deposition, Cr and Ni mainly originated from soil parental materials, and Cd and As were produced by industrial and agricultural activities. Our study provides important implications for improving the soil environment and contributes to the development of efficient strategies for TE pollution control and remediation.

1. Introduction

Soil pollution by toxic metal (TEs) has attracted wide attention both domestically and internationally, with public concern mainly regarding the safety of agricultural products and human health [1,2,3,4,5,6]. Among the TEs, chromium (Cr), lead (Pb), cadmium (Cd), mercury (Hg), arsenic (As), copper (Cu), zinc (Zn), and nickel (Ni) were listed as priority monitoring pollutants regulated by the Chinese government. Owing to rapid advances in industrialization and urbanization during the last several decades, TE pollution in soil has become increasingly serious and widespread in China [7,8,9,10,11].
TEs are important natural elements of the Earth’s crust. Before the emergence of human civilization, soil TEs were mainly derived from natural sources, and the content of TEs in soil remained at a low level. However, after the emergence of human civilization, especially since the industrial revolution in the 1840s, anthropogenic inputs of TEs to soils remarkably exceeded natural inputs from pedogenesis [12]. Numerous studies have confirmed that anthropogenic activities, such as industrial activities, agrochemical product input, sewage irrigation, smelting operations, fossil fuel combustion, and atmospheric deposition are important sources of TEs in the soil [13,14,15,16,17,18,19,20].
Assessing the pollution status of soil TEs provides vital knowledge for understanding the soil quality and the potential health risk posed to humans due to exposure to soil TEs. Currently, the geo-accumulation index (Igeo), potential ecological risk index (ER and RI), single pollution index (PI), and Nemerow composite pollution index (NPI) are the most widely used to evaluate soil pollution caused by TEs [21,22,23,24,25,26]. Moreover, analysis of the source of soil TEs could serve as a basis for accurately reducing the input of soil sourced from anthropogenic activities and can contribute to protecting human health and the soil environment. As a multivariate receptor factor analysis model, the PMF has proven to be a feasible and useful method for apportioning sources of soil TE [27,28].
In addition, mapping soil TEs provides critical information for understanding the spatial patterns of soil TEs. Many spatial interpolation methods, such as the triangular interpolation network (TIN), inverse distance weighting (IDW), regression models (RM), thin plate splines (TPS), local trend surfaces (LTS), geographically weighted regression (GWR), and geostatistical methods have been extensively used to map soil properties [29]. Among these methods, ordinary kriging (OK) has been the most widely used for mapping the spatial pattern of soil properties characterized by optimal unbiased estimation [29]. Moreover, indicator kriging (IK) can use indicator (0 or 1) variables to generate probabilities that a critical value was exceeded or not at each location in the study area, which can help us identify areas with a high risk of soil TE pollution [30,31,32]. Identifying regions with high risk of soil TE pollution could save considerable time, as well as labor costs, improving the efficiency and accuracy of soil pollution remediation.
Yuyao City is one of the most developed cities and counties in China. It is well-known for its electronic appliances, mechanical hardware, plastics, and molds. In addition, Yuyao City has more than seven thousand years of rice planting history, and it is an important production area for food and agricultural products. Long-term and extensive industrial and agricultural actions result in the accumulation of TEs in the soil and pose a great health threat to residents [33,34,35,36,37]. For example, excessive intake of Pb can lead to adverse effects on the immune, nervous, and endocrine systems [3,4,38,39,40]. Bladder, kidney, and liver cancers can be induced by long-term exposure to As [3,4,41,42]. Massive exposure to high doses of Zn, Cr, and Cu can lead to impairments in cholesterol, fertility, and liver function [43,44]. However, until now, the knowledge related to the pollution status, spatial pattern, pollution risk, and related sources of soil TEs in Yuyao City is still scarce. Therefore, to fill these gaps, in this study, we analyzed the pollution status, spatial patterns, and origins of TEs in Yuyao City based on 300 surface soil samples from Yuyao City. The main aims of this study are: (1) summarizing the statistics of soil TEs and assessing the pollution status of soil in Yuyao City using the Igeo, ER, RI, PI, and NPI index; (2) analyzing the spatial pattern of soil TEs using the OK method and identifying regions with high risk of soil TE pollution in Yuyao City using the IK method; and (3) apportioning the sources of different TEs via the PMF model. Our study could provide useful implications for environmental protection in the survey region and can also provide a valuable foundation for similar studies in other regions.

2. Study Area and Materials

2.1. Study Area

Yuyao City is situated in the northeast of Zhejiang Province, eastern China (Figure 1) with area of around 1500 km2. The Yuyao City climate has a subtropical monsoon climate with an average annual temperature of 18.1 ℃ and annual precipitation of 1835.2 mm in 2020. Yuyao City is one of the most developed cities or counties in China, featuring developed hardware products, home appliance manufacturing, and plastic product industries.

2.2. Soil Sampling and Analysis

In this study, the process of soil sampling and analysis strictly refer to the national standard issued by the Ministry and Ecology and Environment of People’s Republic of China (The Technical Specification for soil Environmental monitoring, HJ/T 166-2004, https://www.mee.gov.cn/ywgz/fgbz/bz/bzwb/jcffbz/200412/t20041209_63367.shtml, accessed on 21 October 2021). We collected 300 surface soil samples (0–0.2 m) from Yuyao City in 2012 (Figure 1) based on spatial coverage, land use, and soil groups. In some areas which have been known as heavily polluted regions or an important production base for rice and others agricultural crops, we conducted a more extensive survey, and thus more samples were collected from these regions. The coordinates of the sampling sites were recorded with a portable GPS. The soil samples were then transported to the laboratory and air-dried for several days at ambient temperature. After that, all soil samples were sieved with a 2 mm nylon sieve, meanwhile, plant residuals and gravels were removed. The concentrations of soil Cr, Pb, Cd, Cu, Zn, and Ni were measured by inductively coupled plasma mass spectrometry (ICP-MS). The contents of Hg and As in the soil were determined by atomic fluorescence spectrometry (AFS). Reagent blanks and standard reference materials (GBW07405, supplied by IGGE at the Chinese Academy of Geological Sciences) were used for quality assurance and quality control with recovery rates varying between 90% and 110%.

2.3. Geo-Accumulation Index (Igeo)

The I g e o is calculated to evaluate the enrichment status of soil TEs by comparing soil background values. I g e o is determined by the following formula [45]:
I g e o = log 2 ( C i 1.5 * C 0 )
here, C i means the content of soil TE i , C 0 represents the corresponding soil background value [46]. The I g e o is classified into seven classes: I g e o < 0 (unpolluted), 0 < I g e o ≤ 1 (unpolluted to moderately polluted), 1 < I g e o ≤ 2 (moderately polluted), 2 < I g e o ≤ 3 (moderately to heavily polluted), 3 < I g e o ≤ 4 (heavily polluted), 4 < I g e o ≤ 5 (heavily to extremely polluted), and I g e o > 5 (extremely polluted).

2.4. Potential Ecological Risk Assessment (ER and RI)

The ER and RI combine the concentration of each TE with its toxicity efficiency [47]. The ER is calculated using the following formula below [48]:
R I = E R i ; E R i = T R i * C f i ; C f i = C 0 i C n i
where C f i indicates the contamination factor for TE i, C 0 i denotes the content of soil TE i, C n i on behalf of the background value of TE i issued by the China National Environmental Monitoring Center [46], ERi means the single potential ecological risk of TE i l, and TRi is the toxic coefficient of TE i [47]. The toxic coefficients of Cr, Pb, Cd, Hg, As, Cu, Zn, and Ni were 2, 5, 30, 40, 10, 5, 1, and 3, respectively. RI is the composite potential ecological risk index, which is an integrated value of several TEs. ER is classified into five grades [48]: ER < 40 (low risk), 40 < ER < 80 (moderate risk), 80 < ER < 160 (considerable risk), 160 < ER < 320 (high risk), and ER > 320 (very high risk). The RI is classified into four categories [48]: RI < 150 (low risk), 150 < RI < 300 (moderate risk), 300 < RI < 600 (considerable risk), and RI > 600 (high risk).

2.5. Single Pollution Index (PI) and Nemerow Composite Pollution Index (NPI)

The PI and NPI were also computed to evaluate the pollution status of TEs by comparing the content of soil TEs with national screening values regulated by the Chinese government [49]. The PI was calculated using the formula:
P I = C i S i
here, C i on behalf of the concentration of soil TE i, and S i means the national screening value of TE i [49].
N C P I = ( P i max ) 2 + ( P I ¯ ) 2 2
where P i max represents the maximum PI of TEs and P I ¯ means the averaged PI of TEs [50]. PI could be classified into five categories: safety (PI ≤ 1), slight pollution (1 < PI ≤ 2), mild pollution (2 < PI ≤ 3), moderate pollution (3 < PI ≤ 5), and severe pollution (PI > 5). The NPI value is classified as: safe (NPI ≤ 0.7), precaution (0.7 < NPI ≤ 1), slightly polluted (1 < NPI ≤ 2), moderately polluted (2 < NPI ≤ 3), and seriously polluted (NPI > 3).

2.6. Ordinary Kriging

The spatial variability of soil TEs is a core concern for soil TE pollution control and remediation. As one of the most classic interpolation algorithms, the OK method has been widely used to estimate the spatial variation of soil properties around the world [29]. In this study, the OK was deployed to map the content of TEs in the soil around the survey region. In OK, the experimental semi-variogram was fitted to reveal the spatial dependence of soil TEs using formula as follows [51]:
Z * ( X 0 ) = i = 1 n φ i Z ( x i )
where Z ( x i ) is the observed TE content at sampling site i, and n is the number of observed soil samples. φi denotes the optimal weight value that could contribute to the unbiased estimation of the TE content with minimum variance. Detailed information on OK is available from Webster and Oliver (2007) [52].

2.7. Indicator Kriging

Indicator kriging (IK) is an extension of OK that can estimate the probability that the target variable exceeds a critical threshold at unvisited points [32,53,54]. The IK was deployed on a binary-transformed sample dataset. First, the indicator is defined using the following formula [52]:
I ( x ; z ) = { 1 Z ( x ) 0 Z ( x ) z z
Subsequently, using Equation (6), the original variable is transformed into a new set of binary indicator variable. Then, the experimental semi-variogram is as follows:
γ 1 * ( h ) = 1 2 N ( h ) i = 1 N ( h ) [ I ( x i ; Z k ) I ( x i + h ; Z k ) ] 2
where γ 1 * ( h ) denotes the experimental semi-variogram of the newly transformed binary indicator. N ( h ) means the number of pairs of indicator transformations, I ( χ i ; Z k ) and I ( χ i + h ; Z k ) , with a distance lag of h.
The conditional cumulative distribution function is produced by the IK at unvisited sites:
F ( χ 0 ; Z k | ( n ) ) = I * ( x 0 ; Z k ) = i = 1 n λ i I ( χ i ; Z k )
here, I * ( χ 0 ; Z k ) on behalf of the predicted indicator at the unvisited sites χ 0 , and λ 1 represents the weight assigned to the indicator in sites x i .

2.8. US-EPA Positive Matrix Factorization (PMF)

The PMF (EPA PMF version 5.0) model is a multivariate factor analysis method [55], which was used in current research to identify the potential sources of soil TEs in Yuyao City. In PMF, the soil sample data are decomposed into two matrices: factor contributions and factor profiles. After that, the users could appoint the sources of TEs that may contribute to the samples based on source profile information and emissions inventories. A detailed description of the PMF method is available in the study organized by Bhuiyan et al. (2021), Wang et al. (2021), Wu et al. (2021) [56,57,58].

2.9. Data Analysis

In this study, descriptive statistical analysis and correlation analysis were finished by R software (R Development Core Team, 2017). OK and IK were carried out with ArcGIS 10.3, (ESRI ArcGIS 10.3, Redlands, CA, USA). The PMF model was conducted using EPA PMF software (version 5.0).

3. Results and Discussion

3.1. Summary Statistics of Soil TEs

The descriptive statistics of the TEs in Yuyao City are listed in Table 1. The averaged concentration of different TEs kept the order: Zn (97.61 mg/kg) > Cr (61.80 mg/kg) > Pb (34.43 mg/kg) > Cu (32.75 mg/kg) > Ni (26.52 mg/kg) > As (6.13 mg/kg) > Hg (0.20 mg/kg) ≈ Cd (0.20 mg/kg). The averaged concentration of all TEs were greater than corresponding soil background values in Zhejiang Province, in addition to As. In comparison with the national arithmetic averaged concentrations of different TEs in China reported by Teng et al. (2014) [59], the levels of Pb, Cd, Hg, Cu, and Zn in Yuyao City were clearly higher than their national values. Cr content was slightly higher than the corresponding national value (Table 1). Moreover, the contents of As and Ni were lower than their national values (Table 1).
The coefficient of variation (CV, %) was used to measure variation in the target variable [60,61]. The CV of different TEs followed a decreasing order: Hg (70.00%) > Cd (55.00%) > Cu (49.47%) > Ni (41.78%) > Cr (35.79%) > As (29.36%) > Zn (28.57%) > Pb (4.59%), indicating that Hg and Cd exhibited strong variation and suggested significant spatial heterogeneity of Hg and Cd in Yuyao City [61]. Our results are consistent with the results obtained in many other similar studies, such as those by Xia et al. (2020), Ren et al. (2021), and Wang et al. (2021) [62,63,64].

3.2. Correlation Analysis

In this study, we used the Spearman’s correlation method to analyze the associations among the different TEs. As presented in Figure 2, most TEs under study showed a significant positive correlation with each other in Yuyao City. In particular, Cr had a strong relationship with Ni (0.94), Pb had a strong relationship with Hg (0.70), and Cu had a strong relationship with Zn (0.63). TEs are highly related to each other and may share similar sources which could contribute to the identification of sources of soil TEs and more efficient control of soil TE contamination [47].

3.3. Pollution and Ecological Risk Assessment

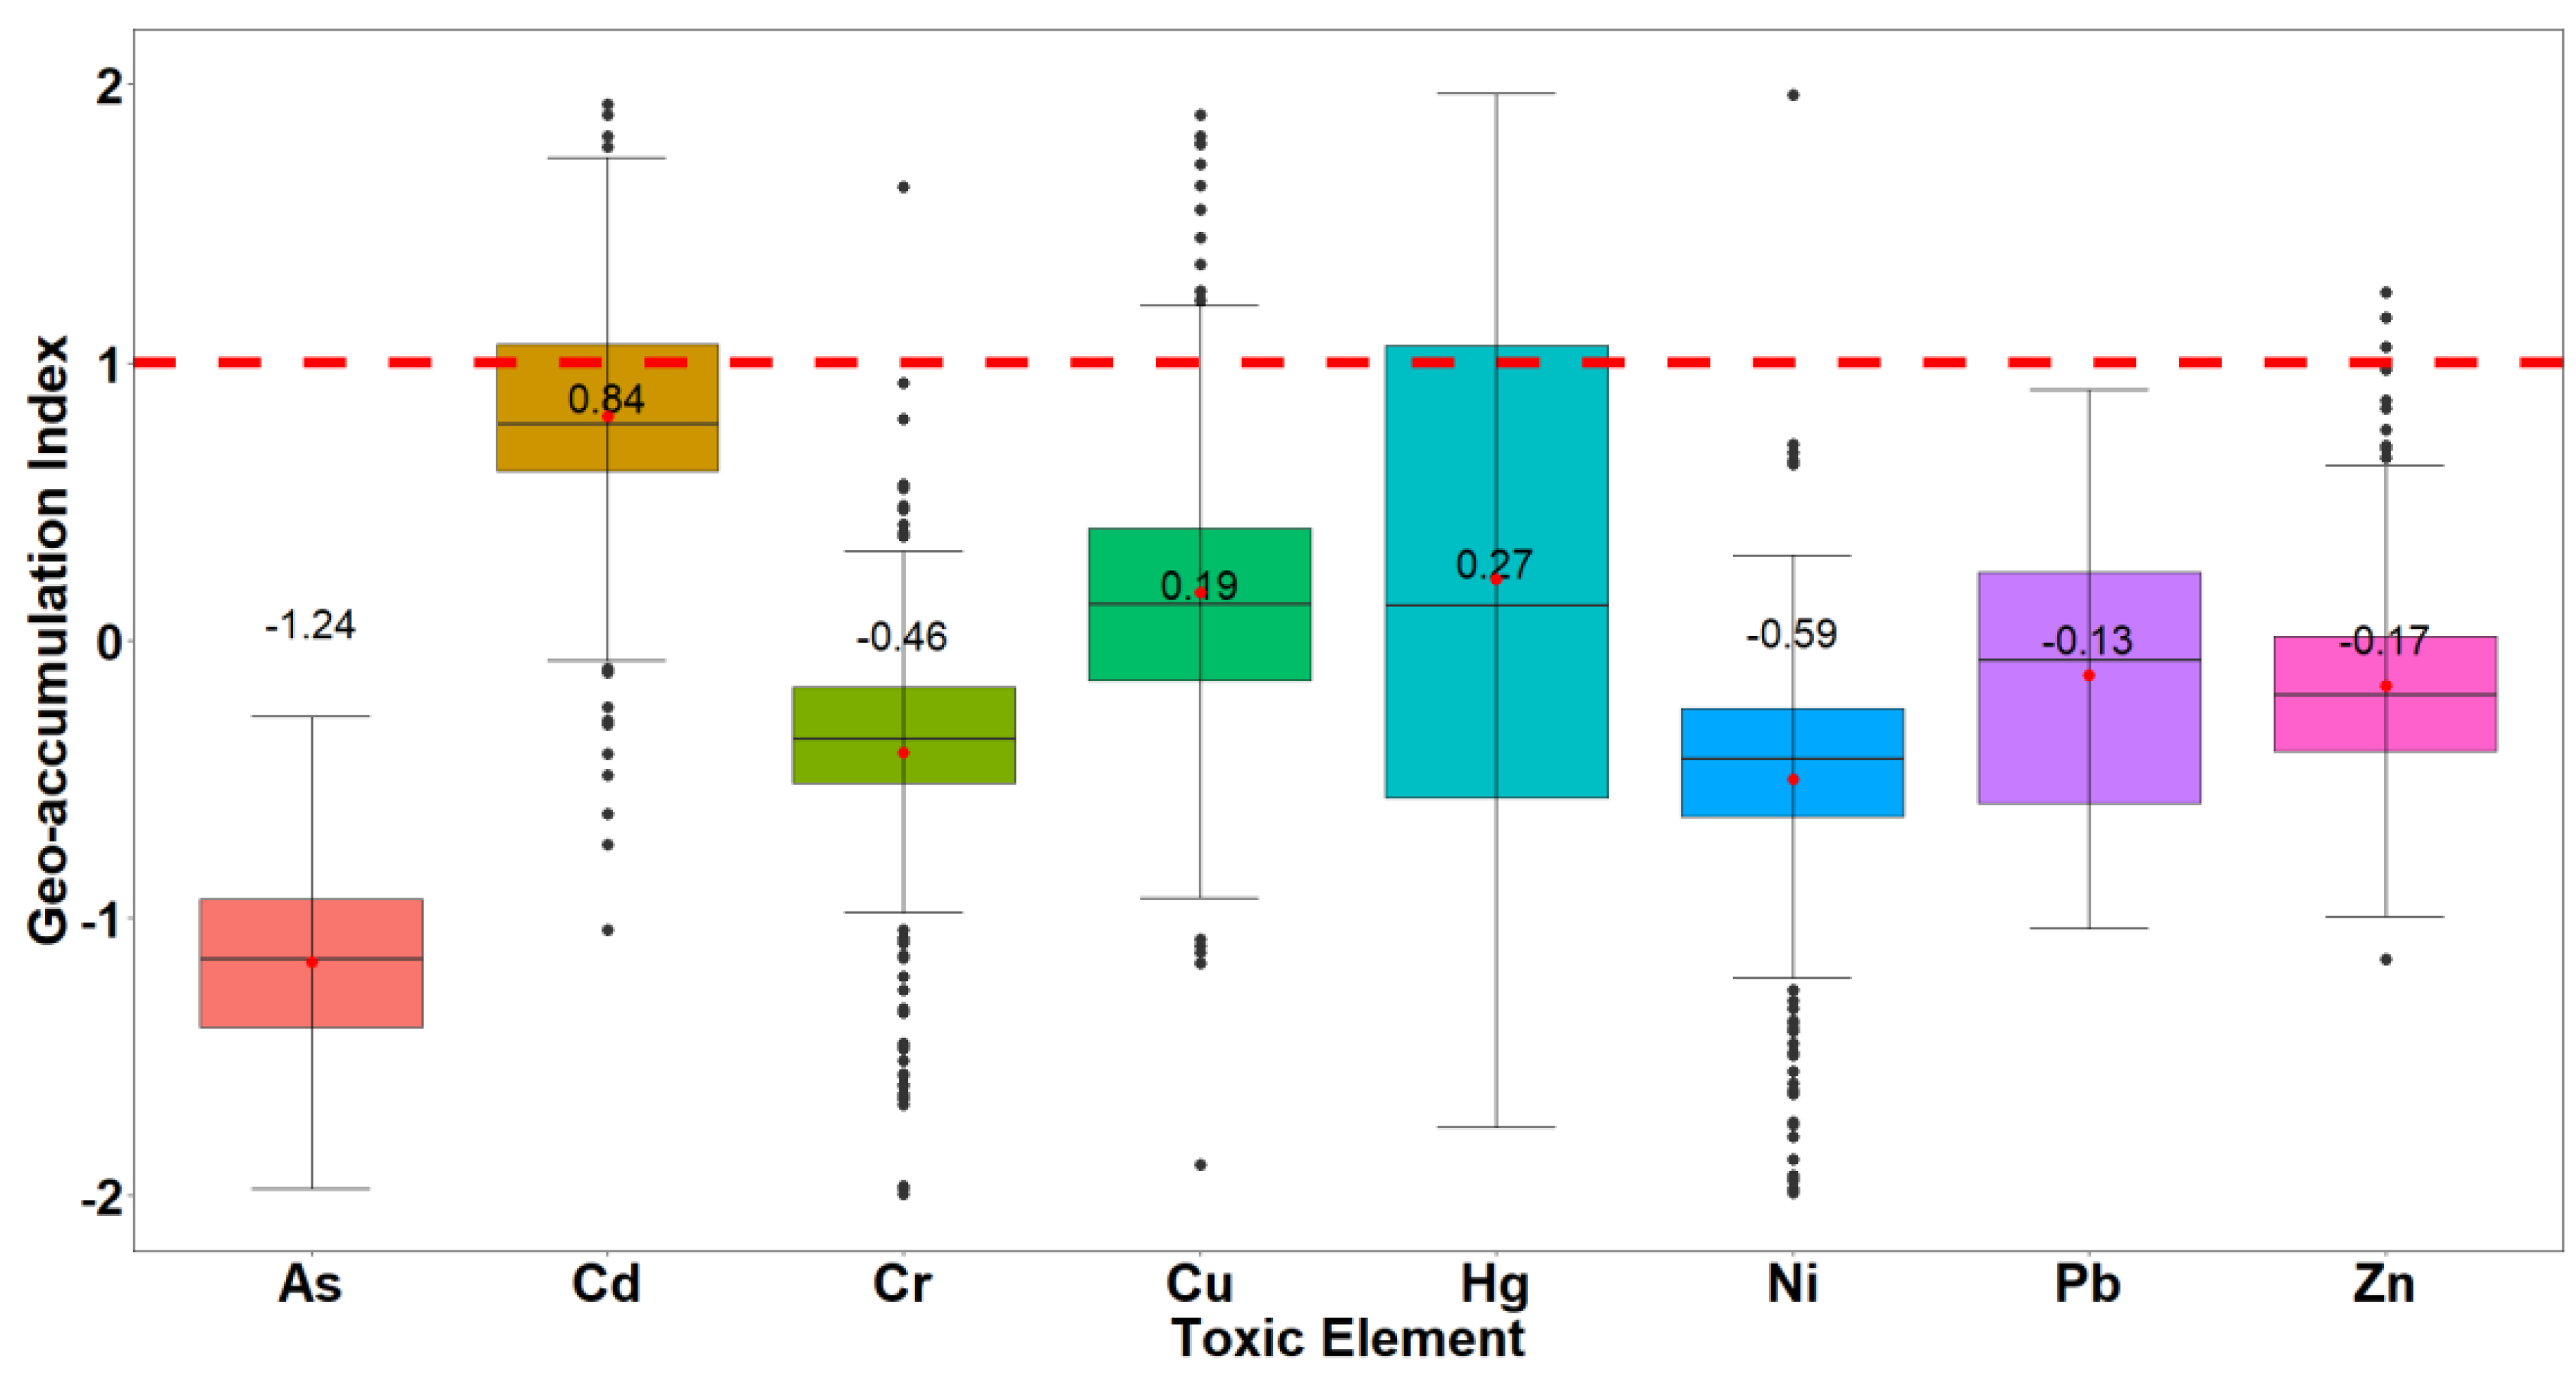
3.3.1. The Geo-Accumulation Index

The Igeo was calculated to quantitatively evaluate the accumulation of soils in the study area. A boxplot of Igeo is shown in Figure 3. The average Igeo values for different TEs followed the order: Cd (0.84) > Hg (0.27) > Cu (0.19) > Pb (−0.13) > Zn (−0.17) > Cr (−0.46) > Ni (−0.59) > As (−1.24). The results revealed that evaluated by the geo-accumulation index, the pollution status for Pb, Zn, Cr, Ni, and As was at an unpolluted level, while the pollution status for Cd, Hg, and Cu was unpolluted to moderately polluted.
Table 2 shows the proportions of different geological accumulation grades of different TEs in the whole survey region, referring to the Igeo classification standard [35]. Obviously, the soil pollution caused by Cd and Hg is much more serious than that caused by Cr, Pb, As, Cu, Zn, and Ni. Regarding As, all soil samples were unpolluted, while most of the soil samples were at unpolluted levels for Cr, Cu, Zn, and Ni (Table 2). In terms of Pb, 47.33% of the soil samples belonged to the unpolluted to moderately polluted grade, while the remaining soil samples were unpolluted. As for Cd, 28.33%, 1.33%, and 0.33% of the soil samples were moderately polluted, moderately to heavily polluted, and heavily to extremely polluted, respectively. With regard to Hg, 28.00% and 2.33% of soil samples were moderately polluted and moderately to heavily polluted, respectively.

3.3.2. The Potential Ecological Risk Assessment

The ER values of different TEs and RI were used to quantitatively evaluate the potential ecological risk due to TE accumulation. The mean value of ER for different TEs followed the order: Hg (89.57) > Cd (86.32) > Cu (9.30) > Pb (7.26) > As (6.67) > Ni (3.23) > Cr (2.34) > Zn (1.38) (Figure 4). The results showed that soil in Yuyao City had considerable potential ecological risk results from Hg and Cd accumulation, while the potential ecological risk caused by other TEs was low (Figure 4). The mean RI value was 206.08, which is at the moderate risk grade.
The proportions of soil samples at different potential ecological risk levels for different TEs are listed in Table 3. The potential ecological risk of all soil samples was low for Cr, Pb, As, Cu, Zn, and Ni. With regard of Cd, the proportions of ER value of soil samples at low, moderate, considerable, high, and very high risk were 3%, 49%, 45.67%, 2%, and 0.33%, respectively. For Hg, the proportions of ER value of soil samples at low, moderate, considerable, high, and very high risk were 24.33%, 29.67%, 34.33%, 11.33%, and 0.33%, respectively. For the RI value, the proportions of soil samples at low, moderate, considerable, and high risk were 35.67%, 49.33%, 14.67%, and 0.33%, respectively.

3.3.3. Pollution Index

Moreover, we calculated the PI and NPI to evaluate the contamination status of TEs in the soil of Yuyao City. As presented in Figure 5, the averaged PI decreased by the following order: Cd (0.48) > Zn (0.42) > As (0.34) ≈ Hg (0.33) ≈ Pb (0.33) > Ni (0.29) > Cr (0.23) ≈ Cu (0.23). The averaged PI of all TEs were at a safe level, but it is worth noting that the PI of some soil samples were at polluted levels for Cd, Hg, Cu, Zn, and Ni. Additionally, the average NPI value was 0.46, which was also at a safe level.
The proportions of PI values of TEs in soil samples at different pollution levels are provided in Table 4. Similar to the Igeo and ER indices, the PI of Cr, Pb, and As in all soil samples were at a safe level, while only a small part of the soil samples had PI values at polluted levels (slight pollution or more serious) for Cd (5.33%), Hg (3%), Cu (0.67%), Zn (1.33%), and Ni (0.33%). With regard to the NPI value, the proportion of soil samples with NPI values at safe, precautionary, slightly polluted, moderately polluted, and seriously polluted levels were 86.33%, 11%, 2.33%, 0%, and 0.33%, respectively.
Overall, Cd and Hg clearly accumulated in the soil in Yuyao City. Generally, the pollution was mainly caused by Cd and Hg, while the content of other TEs was kept at a safe level. This result is consistent with previous surveys conducted in Yuyao City [65,66,67]. Yuyao City is ranked 12th among the top 100 counties in China according to the level of economic development. Extensive industrial activities may lead to the accumulation of soil Cd and Hg [68,69].

3.4. Identify Regions with High Risk of TEs Contamination

Traditional spatial interpolation algorithms, such as OK and IDW, can only map the specific value of the target variable in unobserved locations. However, the predictions made by all interpolation methods are biased, which means that uncertainty exists in the predicted results. To fill this gap, IK was developed to map the probability that the target variable exceeds a specific threshold. In this study, we used IK to predict the probability of the occurrence of soil TE pollution in Yuyao City. For the geo-accumulation status, we focused on Cd and Hg because Cd and Hg are the most seriously polluted TEs in Yuyao City. Meanwhile, for the potential ecological risk and pollution index, we focused on NPI and RI because it can represent the composite pollution status and ecological risk caused by different TEs in the soil.
As shown in Figure 6a, the high pollution risk caused by Cd accumulation (probability of Iego > 1) was mainly expected in the central part of Yuyao City. In some regions, the probability of Cd pollution could exceed 90%. In terms of Hg, regions with a high pollution risk were situated in the center of Yuyao City, but most of the regions had a pollution risk lower than 50%. For the NPI value, areas with high composite pollution risk were mainly situated in the central part of Yuyao City, while the high value of probability of potential ecological risk (RI > 150) occurred mainly in the central and middle parts of Yuyao City.
In summary, the central part of Yuyao City had a relatively higher risk of soil TE contamination, especially for Cd and Hg. This indicates that these regions should be listed as priority regions for soil TE contamination control and remediation. There is an urgent need to take some measures to protect residents from the health risks caused by soil TE contamination. For example, the crop planting system could be adjusted in regions with high pollution risk, and economic plants could be planted take the place of food crops to reduce the accumulation of TEs in the human body via the food chain. Planting crops with low accumulation of TEs is another efficient way to reduce the risk of TE accumulation.

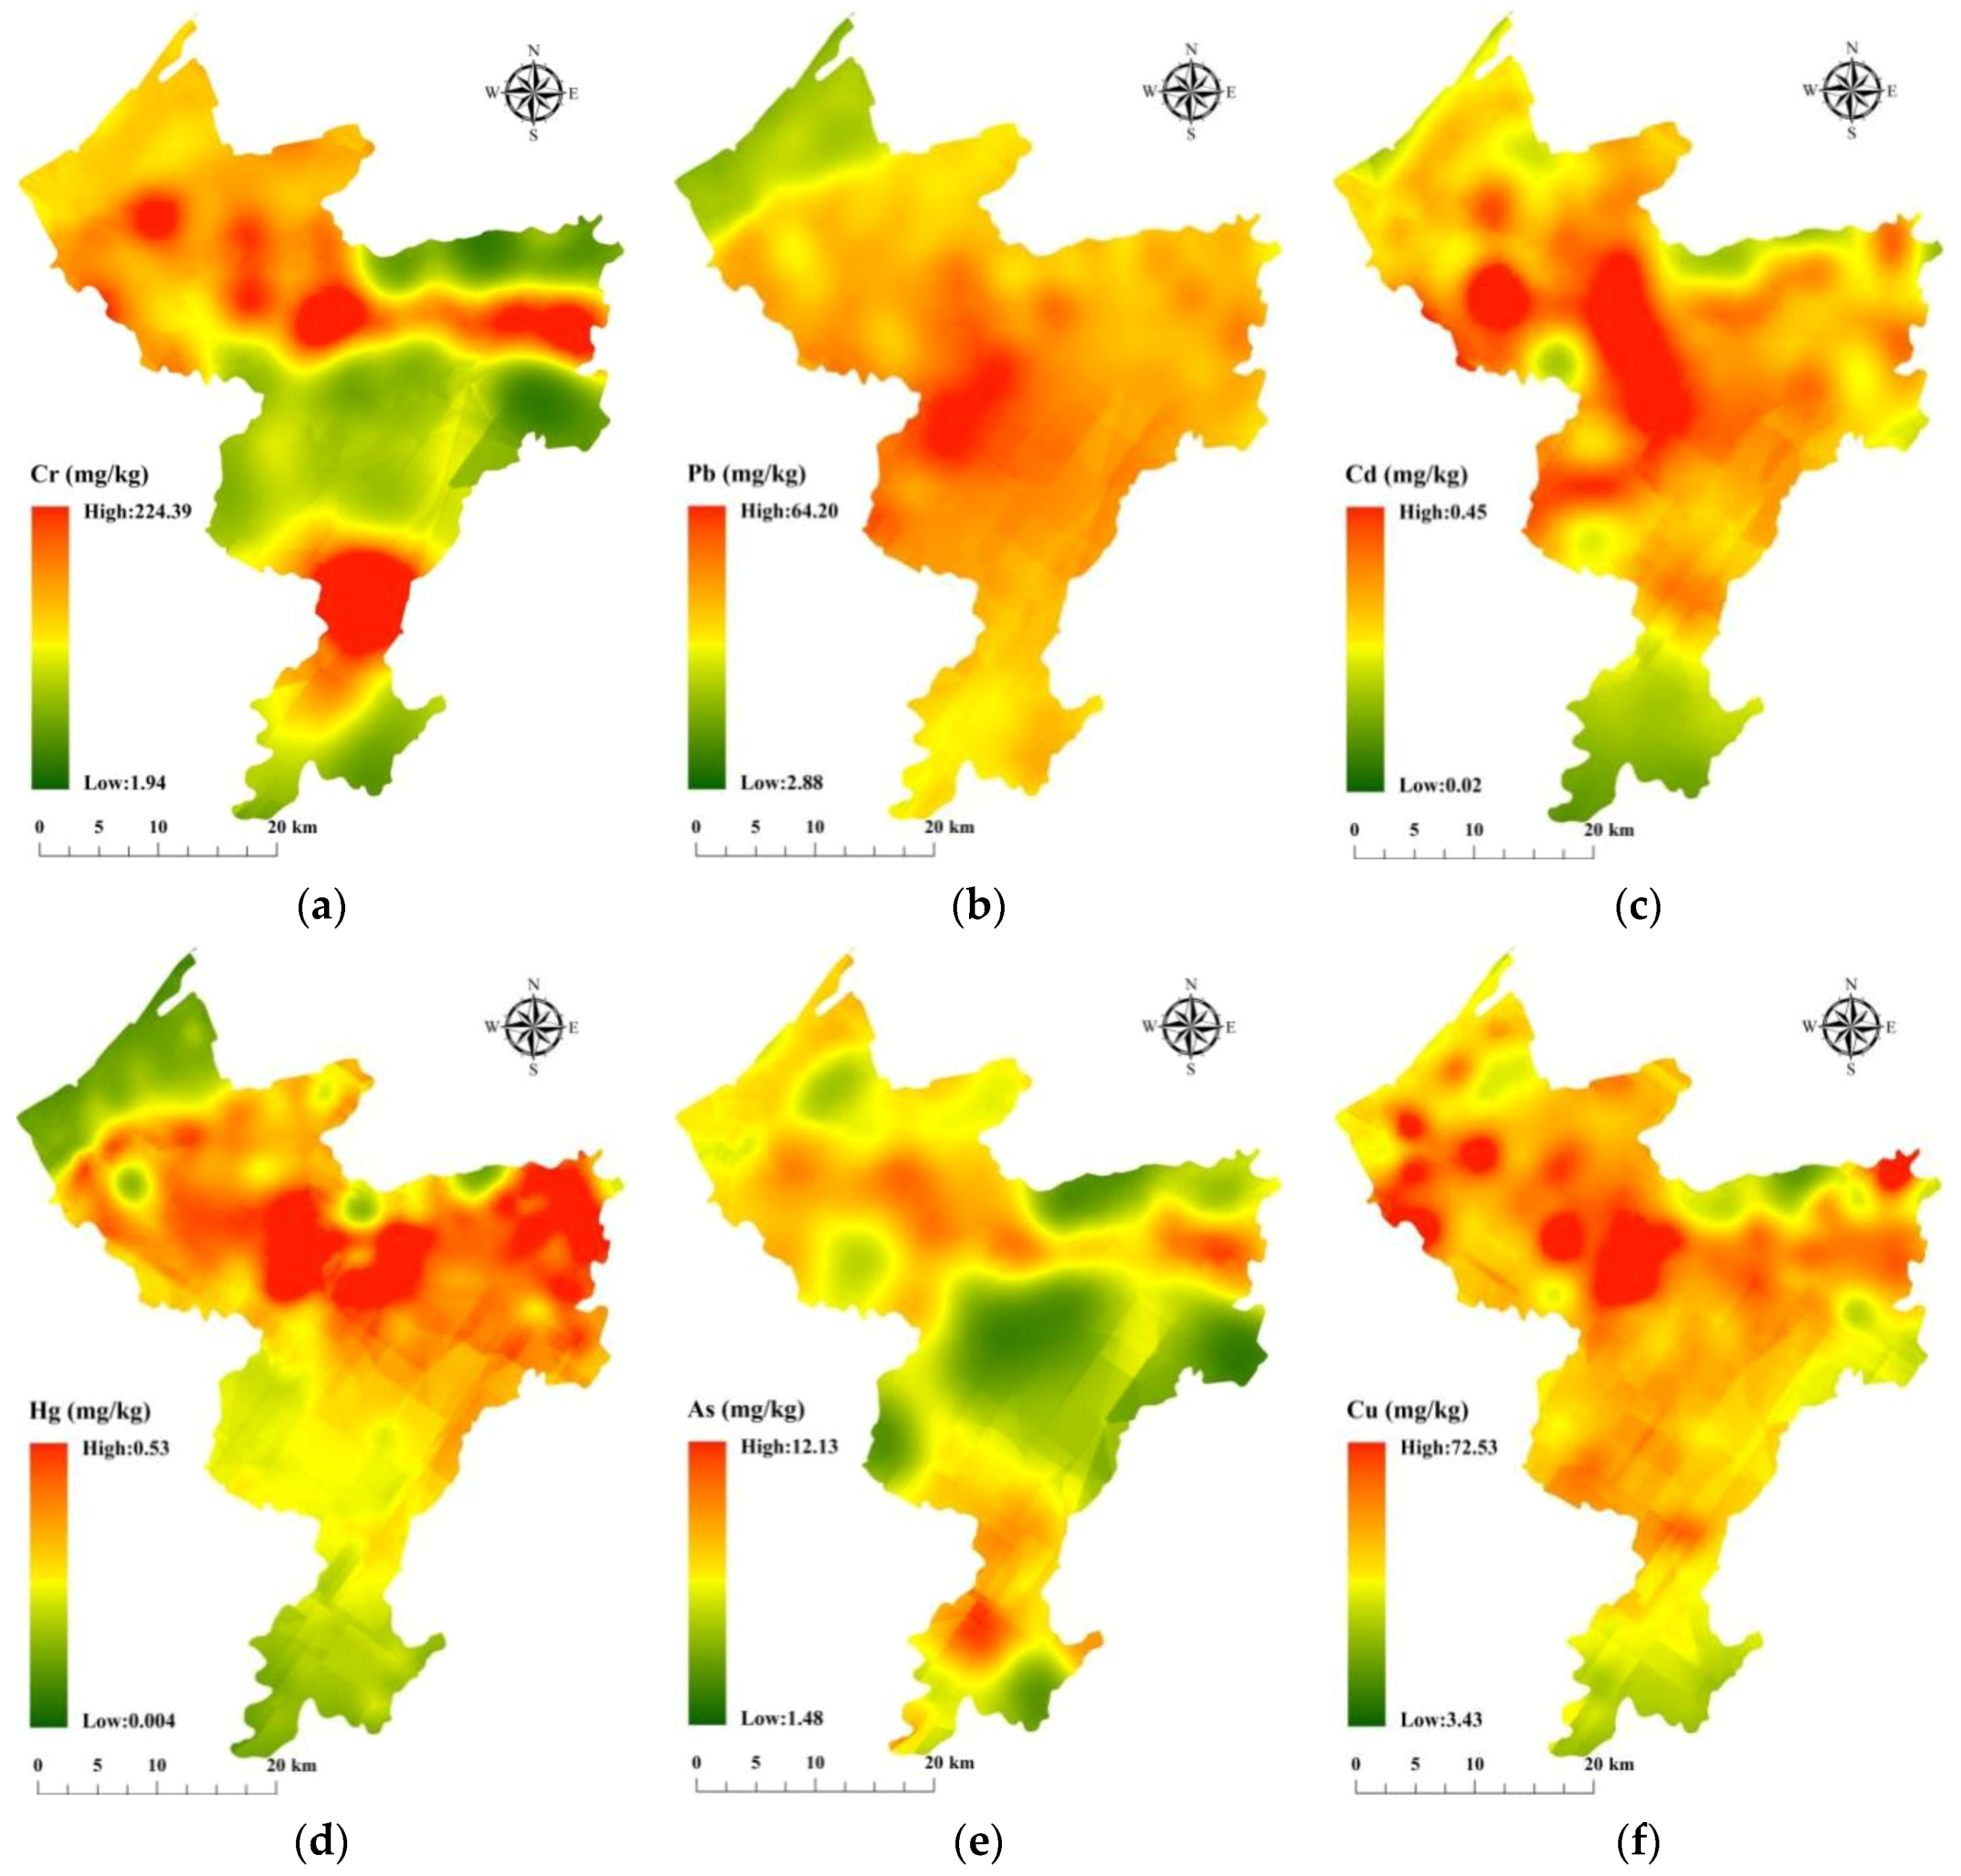
3.5. Spatial Pattern of TEs

Obtaining accurate information on the spatial variability of soil TEs plays a critical role in controlling TE pollution. In current research, OK interpolation was conducted to estimate the spatial variation of TE concentration in the soil of Yuyao City (Figure 7a–h). As presented in Figure 7, the concentrations of Cr, Cd, Hg, As, Zn, and Ni showed similar spatial patterns, with high values detected in the central and southern parts of Yuyao. Pb and Cu also had similar spatial patterns, with high values majorly detected in the central part of Yuyao City. According to the map of land use of Yuyao City presented in Figure 7i, the land use types in the central part of Yuyao are mainly urban, rural, industrial, mining, and residential land. Anthropogenic activities, such as industrial activities (emission of solid waste and wastewater), traffic activities (vehicle emissions), and agricultural activities (application of chemical fertilizer and pesticide) discharge large amounts of waste in which large amounts of TEs exist and then accumulate in soil [8,70,71,72,73,74].

3.6. Source Apportionment by PMF

PMF has been commonly used to apportion the source of soil TEs [57,75,76,77,78]. In current research, the PMF method was deployed to compute the contribution of different sources to the accumulation of eight soil TEs in Yuyao City. As displayed in Figure 8 and Figure 9, four sources were identified by the PMF model.
Factor 1 was heavily loaded with Pb (59.16%), Hg (75.96%), and Zn (35.05%). As presented in Figure 2, Pb was significantly and highly correlated with Hg and Zn, which also verified that Pb, Hg, and Zn were derived from similar sources in the soil of Yuyao City. Numerous studies have verified that vehicle exhaust emissions are a critical source of Pb accumulation in the soil [79,80]. As listed in Table 1, Hg had the highest CV value, which means that anthropogenic activities are the major origin of soil Hg [21]. Industrial activities such as smelting, coal mining, and combustion are regarded as the main sources of Hg pollution in the soil [21] In addition, coal mining and combustion emissions are important sources of Pb in the soil. Moreover, previous studies have also reported that Zn is closely associated with anthropogenic actions, such as burning fossil fuels, smelting, and coal combustion emissions [81,82]. The high values of Pb, Hg, and Zn were mainly situated in the central part of Yuyao City, which overlays with the urban land. Thus, Factor 1 could represent the source of traffic activities, coal combustion, and smelting (Figure 6).
Factor 2 was dominated by Cu, with a very high loading of 71.69%. Generally, Cu is closely related to the emission of industrial activities like metal smelting, petrochemical, cement production, and so on [83,84]. In addition, some researchers have also found that atmospheric deposition is another significant contributor to Cu accumulation in the soil [57,85]. Therefore, Factor 2 was mainly derived from industrial emissions and atmospheric deposition.
Factor 3 was dominated by Cr and Ni with high factor loading values of 74.28% and 76.06%, respectively. As presented in Figure 2, the content of Cr was extremely high, related to the content of Ni in the soil of Yuyao City, with a correlation coefficient of 0.94. This demonstrates that Cr and Ni in the soil originated from the same source. The mean content of Cr and Ni in Yuyao City was slightly higher than the corresponding background value, revealing that the Igeo and ER values of Cr and Ni were also at the safe or low risk level, which means that the Cr and Ni in the soil of Yuyao City may result from the weathering of soil parental materials. Previously, many researchers, such as Salonen and Korkka-Niemi (2007) [86], Chen et al. (2016) [87], Wang et al. (2020) [88], and Bhuiyan et al. (2021) [57] also reported that the contents of Cr and Ni were mainly sourced from soil parental materials. Therefore, Factor 3 represented natural sources, such as soil parent materials.
Factor 4 was mainly loaded with As and Cd with loadings of 50.84% and 40.56%, respectively. The enrichment of As and Cd has been shown to be associated with agricultural activities, like applying chemical fertilizers, herbicides, and pesticides [89]. In addition, the utilization of wastewater for irrigation could also give rise to the accumulation of As in the soil [89,90]. Some studies also reported that As could probably be sourced from poultry farming because organic As is widely used as a feed additive for livestock to promote animal growth, which could then result in a high content of As in livestock manure [91,92]. In terms of Cd, numerous studies have proved that Cd originates from industrial activities such as smelter plant emission, discharge of industrial waste, and so on. Cd is also usually used as an input for industrial production of various products such as plastics [93,94]. The plastic industry is a pillar industry in Yuyao. Thus, the plastic industry may also contribute to Cd accumulation in the soil of Yuyao City. Therefore, Factor 4 represents the source related to industrial and agricultural activities.
In summary, the main sources of TEs in the soil of Yuyao City were industrial activities, industrial emissions and atmospheric deposition, natural sources, and agricultural activities. The results of source apportionment of soil TEs were also verified by the results of summary statistics listed in Table 2, correlation analysis (Figure 2), and the map of the content of soil TEs in Yuyao City produced by OK (Figure 6) interpolation and the map of pollution risk outputted by IK (Figure 7). This confirmed the feasibility of using PMF for quantitatively analyzing the sources of soil TEs. However, as reported by previous researchers, uncertainty still exists in the results produced by the PMF model, which highlights the importance of introducing and combined with other source apportionment methods such as cluster analysis [12], principal component analysis [90], machine learning methods [17], the Unmix model [95], the stable isotope ratio technique [96], and the finite mixture distribution model [97] to reduce the uncertainty of the results produced by PMF.

3.7. Implication and Policy Recommendation

The results we obtained in from presented research could provide important implication for decision-makers to make effective management measures to control soil TEs contamination and thus improve environmental quality. Firstly, regions with high pollution risk should be listed as priority areas for soil TEs contamination control and remediation. Some management practices, such as lime application and bioleaching, could be employed in acidic soils to regulate soil pH and reduce the availability of HMs [98,99,100,101]. Secondly, we could consider establishing a spatial buffer around industrial park or regions featured by high density of industrial companies. We should also keep a safe distance between polluted land or industrial park and residents. Thirdly, breeding crop cultivars with low accumulation is another promising way to mitigate soil TEs contamination in food crops. Crops with different cultivars showed strong variation in ability of absorbing TEs from soil [7]. Finally, according to the results presented in Section 3.6, burning fossil fuels, traffic emissions, and coal combustion emissions contributed to Pb, Hg and As accumulation in the study area. Therefore, the government could encourage adopting green travel methods like bike or public traffic as well as promote use of clean energy such as wind energy, hydropower, tidal energy, and solar energy. These measures are expected to reduce accumulation of TEs in soil through atmospheric deposition, emission of wastewater, and solid waste. In our further work, comparison with previous similar studies which made surveys in the same regions as well as conducting another soil sampling in the same sites is a promising way to detect the temporal change of TEs in soil.

4. Conclusions

Obvious accumulation of Cr, Pb, Cd, Hg, Cu, Zn, and Ni was detected in the soil of Yuyao City. The concentrations of Cr, Pb, As, Cu, Zn, and Ni in most of the soil samples were at safe levels, whereas clear pollution caused by Cd and Hg accumulation in soil was detected. The high contents of the different TEs were mainly situated in the central and middle parts of Yuyao City. In addition, there was a low pollution risk caused by Cr, Pb, As, Cu, Zn, and Ni in Yuyao City, while a high risk of Cd and Hg contamination was detected. The regions with a high risk of TE pollution were mainly distributed in central Yuyao City. In terms of the sources of different TEs in the soil, Pb, Hg, and Zn were mainly derived from traffic activities, coal combustion, and smelting, Cu mainly sourced from industrial emissions and atmospheric deposition, Cr and Ni mainly came from soil parental materials, and Cd and As were attributed to industrial activities and agricultural activities. This study could provide critical information for improving soil environmental quality and contribute to the development of more efficient policies for reducing TE accumulation in soil.

Author Contributions

Conceptualization, B.H., H.L. and L.X.; methodology, B.H. and F.X.; software, F.X. and B.H.; validation, F.X., B.H. and X.C.; formal analysis, F.X. and X.C.; investigation, Y.Z. and B.H.; resources, F.X. and Y.Z.; data curation, B.H. and K.S.; writing original draft preparation, F.X., B.H., and K. S.; visualization, B.H., F.X.; supervision, H.L. and L.X.; project administration, Y.Z. and L.X.; funding acquisition, Y.Z. and F.X. All authors have read and agreed to the published version of the manuscript.

Funding

This study was funded by Zhejiang Province Public Welfare Technology Application Research Project (GN22D010769), the Scientific Research and Development Foundation of Zhejiang A&F University (2020FR060), Open Foundation of Key Laboratory of Agricultural Remote Sensing and Information System of Zhejiang Province (No. ZJRS-2022001), Key Research and Development Program of Zhejiang Province (2015C02011), the National Natural Science Foundation of China (41771244, 42071068), Key Program of the Natural Science Foundation of Zhejiang Province (LZ21D010002), and Social Science Foundation of Jiangxi Province (No 21YJ43D).

Institutional Review Board Statement

The study was conducted according to the guidelines of the Zhejiang A&F University, and ap-proved by the Institutional Review Board of Zhejiang A&F University.

Informed Consent Statement

Informed consent was obtained from all subjects involved in the study.

Data Availability Statement

The data used in this study was not permitted to share.

Conflicts of Interest

The authors declare that they have no known competing financial interests or personal relationships that could have appeared to influence the work reported in this paper. The authors declare no conflict of interest.

References

  1. Jerome, O.N. A History of Global Metal Pollution. Science 1996, 272, 223. [Google Scholar]
  2. Lacarce, E.; Saby, N.P.A.; Martin, M.P.; Marchant, B.P.; Boulonne, L.; Meersmans, J.; Jolivet, C.; Bispo, A.; Arrouays, D. Mapping soil Pb stocks and availability in mainland France combining regression trees with robust geostatistics. Geoderma 2012, 170, 359–368. [Google Scholar] [CrossRef]
  3. Chehregani, A.; Noori, M.; Yazdi, H.L. Phytoremediation of heavy-metal-polluted soils: Screening for new accumulator plants in Angouran mine (Iran) and evaluation of removal ability. Ecotox Environ Safe 2009, 72, 1349–1353. [Google Scholar] [CrossRef] [PubMed]
  4. Jiang, Y.F.; Chen, S.C.; Hu, B.F.; Zhou, Y.; Liang, Z.Z.; Jia, X.L.; Huang, M.X.; Wei, J.; Shi, Z. A comprehensive framework for assessing the impact of potential agricultural pollution on grain security and human health in economically developed areas. Environ. Pollut. 2020, 263, 114653. [Google Scholar] [CrossRef]
  5. Wu, J.; Li, J.; Teng, Y.G.; Chen, H.Y.; Wang, Y.Y. A partition computing-based positive matrix factorization (PC-PMF) approach for the source apportionment of agricultural soil heavy metal contents and associated health risks. J. Hazard. Mater. 2020, 388, 121766. [Google Scholar] [CrossRef]
  6. Xie, M.; Li, H.; Zhu, Y.; Xue, J.; You, Q.; Jin, B.; Shi, Z. Predicting Bioaccumulation of Potentially Toxic Element in Soil–Rice Systems Using Multi-Source Data and Machine Learning Methods: A Case Study of an Industrial City in Southeast China. Land 2021, 10, 558. [Google Scholar] [CrossRef]
  7. Zhao, F.J.; Ma, Y.; Zhu, Y.G.; Tang, Z.; McGrath, S.P. Soil contamination in China: Current status and mitigation strategies. Environ. Sci. Technol. 2015, 49, 750–759. [Google Scholar] [CrossRef]
  8. Pan, L.B.; Ma, J.; Wang, X.L.; Hou, H. Heavy metals in soils from a typical county in Shanxi Province, China: Levels, sources and spatial distribution. Chemosphere 2016, 148, 248–254. [Google Scholar] [CrossRef] [PubMed]
  9. Hu, B.F.; Xue, J.; Zhou, Y.; Shao, S.; Fu, Z.Y.; Li, Y.; Chen, S.C.; Qi, L.; Shi, Z. Modelling bioaccumulation of heavy metals in soil-crop ecosystems and identifying its controlling factors using machine learning. Environ. Pollut. 2020, 262, 114308. [Google Scholar] [CrossRef]
  10. Xiao, H.; Shahab, A.; Xi, B.D.; Chang, Q.X.; You, S.H.; Li, J.Y.; Sun, X.J.; Huang, H.W.; Li, X.K. Heavy metal pollution, ecological risk, spatial distribution, and source identification in sediments of the Lijiang River, China. Environ. Pollut. 2021, 269, 116189. [Google Scholar] [CrossRef] [PubMed]
  11. Qu, M.K.; Chen, J.; Huang, B.; Zhao, Y.C. Enhancing apportionment of the point and diffuse sources of soil heavy metals using robust geostatistics and robust spatial receptor model with categorical soil-type data. Environ. Pollut. 2020, 265, 114964. [Google Scholar] [CrossRef] [PubMed]
  12. Facchinelli, A.; Sacchi, E.; Mallen, L. Multivariate statistical and GIS-based approach to identify heavy metal sources in soils. Environ. Pollut. 2001, 114, 313–324. [Google Scholar] [CrossRef]
  13. Hu, B.F.; Wang, J.Y.; Jin, B.; Li, Y.; Shi, Z. Assessment of the potential health risks of heavy metals in soils in a coastal industrial region of the Yangtze River Delta. Environ. Sci. Pollut. Res. 2017, 24, 19816–19826. [Google Scholar] [CrossRef]
  14. Li, S.; Jia, Z. Heavy metals in soils from a representative rapidly developing megacity (SW China): Levels, source identification and apportionment. Catena 2018, 163, 414–423. [Google Scholar] [CrossRef]
  15. Natalia, B.; Olga, Y.; Inna, T.; Galina, M. Current state and dynamics of heavy metal soil pollution in Russian Federation—A review. Environ. Pollut. 2019, 249, 200–207. [Google Scholar]
  16. Vareda, J.P.; Valente, A.J.M.; Durães, L. Assessment of heavy metal pollution from anthropogenic activities and remediation strategies: A review. J. Environ. Manag. 2019, 246, 101–118. [Google Scholar] [CrossRef]
  17. Jia, X.L.; Fu, T.T.; Hu, B.F.; Shi, Z.; Zhu, Y.W. Identification of the potential risk areas for soil heavy metal pollution based on the source-sink theory. J. Hazard. Mater. 2020, 393, 122424. [Google Scholar] [CrossRef]
  18. Lee, H.; Kim, H.K.; Noh, H.J.; Byun, Y.J.; Chung, H.M.; Kim, J.I. Source identification and assessment of heavy metal contamination in urban soils based on cluster analysis and multiple pollution indices. J. Soil. Sediment. 2021, 21, 1947–1961. [Google Scholar] [CrossRef]
  19. Chen, T.B.; Zheng, Y.M.; Lei, M.; Huang, Z.C.; Wu, H.T.; Chen, H.; Fan, K.K.; Wu, X.; Tian, Q.Z. Assessment of heavy metal pollution in surface soils of urban parks in Beijing, China. Chemosphere 2005, 60, 542–551. [Google Scholar] [CrossRef]
  20. Wei, J.; Li, H.; Liu, J. Heavy metal pollution in the soil around municipal solid waste incinerators and its health risks in China. Environ. Res. 2022, 203, 111871. [Google Scholar] [CrossRef]
  21. Fei, X.F.; Lou, Z.H.; Xiao, R.; Ren, Z.Q.; Lv, X.N. Contamination assessment and source apportionment of heavy metals in agricultural soil through the synthesis of PMF and GeogDetector models. Sci. Total. Environ. 2020, 747, 141293. [Google Scholar] [CrossRef]
  22. Hu, B.F.; Jia, X.L.; Hu, J.; Xu, D.Y.; Xia, F.; Li, Y. Assessment of heavy metal pollution and health risks in the soil-plant-human system in the Yangtze River Delta, China. Int. J. Environ. Res. Public Health 2017, 14, 1042. [Google Scholar] [CrossRef] [PubMed] [Green Version]
  23. Adimalla, N.; Qian, H.; Wang, H. Assessment of heavy metal (HM) contamination in agricultural soil lands in northern Telangana, India: An approach of spatial distribution and multivariate statistical analysis. Environ. Monit. Assess. 2019, 191, 1–15. [Google Scholar] [CrossRef] [PubMed]
  24. Liu, K.H.; Li, C.M.; Tang, S.Q.; Shang, G.D.; Yu, F.M.; Li, Y. Heavy metal concentration, potential ecological risk assessment and enzyme activity in soils affected by a lead-zinc tailing spill in Guangxi, China. Chemosphere 2020, 251, 126415. [Google Scholar] [CrossRef]
  25. Baruah, S.G.; Ahmed, I.; Das, B.; Ingtipi, B.; Boruah, H.; Gupta, S.K.; Nema, A.K.; Chabukdhar, M. Heavy metal (loid) s contamination and health risk assessment of soil-rice system in rural and peri-urban areas of lower brahmaputra valley, northeast India. Chemosphere 2021, 266, 129150. [Google Scholar] [CrossRef]
  26. Ilechukwu, I.; Osuji, L.C.; Okoli, C.P.; Onyema, M.O.; Ndulwe, G.I. Assessment of heavy metal pollution in soils and health risk consequences of human exposure within the vicinity of hot mix asphalt plants in Rivers State, Nigeria. Environ. Monit. Assess. 2021, 193, 1–14. [Google Scholar] [CrossRef]
  27. Zhang, M.; Wang, X.P.; Liu, C.; Lu, J.Y.; Qin, Y.H.; Mo, Y.K.; Xiao, P.J.; Liu, Y. Identification of the heavy metal pollution sources in the rhizosphere soil of farmland irrigated by the Yellow River using PMF analysis combined with multiple analysis methods—using Zhongwei city, Ningxia, as an example. Environ. Sci. Pollut. Res. 2020, 27, 16203–16214. [Google Scholar] [CrossRef]
  28. Kumar, S.; Islam, A.R.M.T.; Islam, H.M.T.; Touhidul, H.M.; Ongoma, V.; Khan, R.; Mallick, J. Water resources pollution associated with risks of heavy metals from Vatukoula Goldmine region, Fiji. J. Environ. Manag. 2021, 293, 112868. [Google Scholar] [CrossRef]
  29. Li, J.; Heap, A.D. Spatial interpolation methods applied in the environmental sciences: A review. Environ. Modell. Softw. 2014, 53, 173–189. [Google Scholar] [CrossRef]
  30. Solow, A.R. Mapping by simple indicator kriging. Math. Geol. 1986, 18, 335–352. [Google Scholar] [CrossRef]
  31. Chakraborty, S.; Man, T.; Paulette, L.; Deb, S.; Li, B.; Weindorf, D.C.; Frazier, M. Rapid assessment of smelter/mining soil contamination via portable X-ray fluorescence spectrometry and indicator kriging. Geoderma 2017, 306, 108–119. [Google Scholar] [CrossRef]
  32. Hu, B.F.; Zhao, R.Y.; Chen, S.C.; Zhou, Y.; Jin, B.; Li, Y.; Shi, Z. Heavy metal pollution delineation based on uncertainty in a coastal industrial city in the Yangtze River Delta, China. Int. J. Environ. Res. Public Health 2018, 15, 710. [Google Scholar] [CrossRef] [PubMed] [Green Version]
  33. Durowoju, O.S.; Ekosse, G.I.E.; Odiyo, J.O. Occurrence and Health-Risk Assessment of Trace Metals in Geothermal Springs within Soutpansberg, Limpopo Province, South Africa. Int. J. Environ. Res. Public Health 2020, 17, 4438. [Google Scholar] [CrossRef] [PubMed]
  34. Jessica, B.; Emmanuel, S.; Renald, B. Heavy metal pollution in the environment and their toxicological effects on humans. Heliyon 2020, 6, e04691. [Google Scholar]
  35. Sanaei, F.; Amin, M.M.; Alavijeh, Z.P.; Esfahani, R.A.; Sadeghi, M.; Bandarrig, N.S.; Fatehizadeh, A.; Taheri, E.; Rezakazemi, M. Health risk assessment of potentially toxic elements intake via food crops consumption: Monte Carlo simulation-based probabilistic and heavy metal pollution index. Environ. Sci. Pollut. Res. 2021, 28, 1479–1490. [Google Scholar] [CrossRef]
  36. Ngo, H.T.T.; Watchalayann, P.; Nguyen, D.B.; Doan, H.N.; Liang, L. Environmental health risk assessment of heavy metal exposure among children living in an informal e-waste processing village in Viet Nam. Sci. Total Environ. 2021, 763, 142982. [Google Scholar] [CrossRef] [PubMed]
  37. Huang, J.L.; Wu, Y.Y.; Sun, J.X.; Geng, X.L.; Zhao, M.L.; Sun, T.; Fan, Z.Q. Health risk assessment of heavy metal (loid) s in park soils of the largest megacity in China by using Monte Carlo simulation coupled with Positive matrix factorization model. J. Hazard. Mater. 2021, 415, 125629. [Google Scholar] [CrossRef]
  38. Gade, M.; Comfort, N.; Re, D.B. Sex-specific neurotoxic effects of heavy metal pollutants: Epidemiological, experimental evidence and candidate mechanisms. Environ. Res. 2021, 201, 111558. [Google Scholar] [CrossRef]
  39. Kupraszewicz, E.; Brzóska, M.M. Excessive ethanol consumption under exposure to lead intensifies disorders in bone metabolism: A study in a rat model. Chemico-Biol. Interact. 2013, 203, 486–501. [Google Scholar] [CrossRef] [PubMed]
  40. Squadrone, S.; Brizio, P.; Stella, C.; Pastorino, P.; Serracca, L.; Ecolini, C.; Abete, M.C. Presence of trace metals in aquaculture marine ecosystems of the northwestern Mediterranean Sea (Italy). Environ. Pollut. 2016, 215, 77–83. [Google Scholar] [CrossRef]
  41. Patlolla, A.K.; Todorov, T.I.; Tchounwou, P.B.; van der Voet, G.; Centeno, J.A. Arsenic-induced biochemical and genotoxic effects and distribution in tissues of Sprague-Dawley rats. Microchem. J. 2012, 105, 101–107. [Google Scholar] [CrossRef] [PubMed] [Green Version]
  42. Tan, S.Y.; Praveena, S.M.; Abidin, E.Z.; Cheema, M.S. A review of heavy metals in indoor dust and its human health-risk implications. Rev. Environ. Health 2016, 31, 447–456. [Google Scholar] [CrossRef] [PubMed] [Green Version]
  43. U.S. Environmental Protection Agency. Supplementary Guidance for Conducting Health Risk Assessment of Chemical Mixtures; Risk Assessment Forum Technical Panel; U.S. Environmental Protection Agency: Washington, DC, USA, 2000.
  44. Alengebawy, A.; Abdelkhalek, S.T.; Qureshi, S.R.; Wang, Q.M. Heavy metals and pesticides toxicity in agricultural soil and plants: Ecological risks and human health implications. Toxics 2021, 9, 42. [Google Scholar] [CrossRef] [PubMed]
  45. Müller, G. Index of geoaccumulation in sediments of the rhine river. Geojournal 1969, 2, 108–118. [Google Scholar]
  46. China National Environmental Monitoring Center (CNEMC). The Background Concentrations of Soil Elements of China; China Environmental Science Press: Beijing, China, 1990. (In Chinese) [Google Scholar]
  47. Hakanson, L. An ecological risk index for aquatic pollution control. A sedimentological approach. Water. Res. 1980, 14, 975–1001. [Google Scholar] [CrossRef]
  48. Hu, B.F.; Shao, S.; Ni, H.; Fu, Z.Y.; Hu, L.S.; Zhou, Y.; Min, X.X.; She, S.F.; Chen, S.C.; Huang, M.X.; et al. Current status, spatial features, health risks, and potential driving factors of soil heavy metal pollution in China at province level. Environ. Pollut. 2020, 266, 114961. [Google Scholar] [CrossRef]
  49. Ministry of Ecology and Environment of People’s Republic of China. Environmental Quality Standard for Soils; Report No. GB15618-2018; MEEPRC: Beijing, China, 2018. (In Chinese)
  50. China National Environmental Protection Agency. The Technical Specification for Soil Environmental Monitoring; The Standard No. HJ/T 166-2004; CEPA: Beijing, China, 2004. (In Chinese)
  51. Cressie, N. Spatial prediction and ordinary kriging. Math. Geol. 1988, 20, 405–421. [Google Scholar] [CrossRef]
  52. Webster, R.; Oliver, M.A. Geostatistics for Environmental Scientists; John Wiley & Sons: Hoboken, NJ, USA, 2007. [Google Scholar]
  53. Juang, K.W.; Lee, D.Y. Simple indicator kriging for estimating the probability of incorrectly delineating hazardous areas in a contaminated site. Environ. Sci. Technol. 1998, 32, 2487–2493. [Google Scholar] [CrossRef]
  54. Goovaerts, P.; Webster, R.; Dubois, J.P. Assessing the risk of soil contamination in the Swiss Jura using indicator geostatistics. Environ. Ecol. Stat. 1997, 4, 49–64. [Google Scholar] [CrossRef]
  55. U.S. Environmental Protection Agency. EPA Positive Matrix Factorization (PMF) 5.0 Fundamentals and User Guide; EPA/600/R-14/108.; U.S. EPA: Washington, DC, USA, 2014.
  56. Wu, J.T.; Margenot, A.J.; Wei, X.; Fan, M.M.; Zhang, H.; Best, J.L.; Wu, P.B.; Chen, F.R.; Gao, C. Source apportionment of soil heavy metals in fluvial islands, Anhui section of the lower Yangtze River: Comparison of APCS–MLR and PMF. J. Soil. Sediments 2020, 20, 3380–3393. [Google Scholar] [CrossRef]
  57. Bhuiyan, M.A.H.; Karmaker, S.C.; Bodrud-Doza, M.; Abdur, R.M.; Bidyut, S.B. Enrichment, sources and ecological risk mapping of heavy metals in agricultural soils of dhaka district employing SOM, PMF and GIS methods. Chemosphere 2021, 263, 128339. [Google Scholar] [CrossRef] [PubMed]
  58. Wang, Y.T.; Guo, G.H.; Zhang, D.G.; Lei, M. An integrated method for source apportionment of heavy metal (loid) s in agricultural soils and model uncertainty analysis. Environ. Pollut. 2021, 276, 116666. [Google Scholar] [CrossRef]
  59. Teng, Y.; Wu, J.; Lu, S.; Wang, Y.; Jiao, X.; Song, L. Soil and soil environmental quality monitoring in China: A review. Environ. Int. 2014, 69, 177–199. [Google Scholar] [CrossRef]
  60. Gotway, C.A.; Ferguson, R.B.; Hergert, G.W.; Peterson, T.A. Comparison of kriging and inverse-distance methods for mapping soil parameters. Soil. Sci. Soc. Am. J. 1996, 60, 1237–1247. [Google Scholar] [CrossRef]
  61. Webster, R. Statistics to support soil research and their presentation. Eur. J. Soil. Sci. 2001, 52, 331–340. [Google Scholar] [CrossRef]
  62. Ren, Y.J.; Lin, M.; Liu, Q.M.; Zhang, Z.H.; Fei, X.F.; Xiao, R.; Lv, X.N. Contamination assessment, health risk evaluation, and source identification of heavy metals in the soil-rice system of typical agricultural regions on the southeast coast of China. Environ. Sci. Pollut. Res. 2021, 28, 12870–12880. [Google Scholar] [CrossRef]
  63. Xia, F.; Hu, B.F.; Zhu, Y.W.; Ji, W.J.; Chen, S.C.; Xu, D.Y.; Shi, Z. Improved Mapping of Potentially Toxic Elements in Soil via Integration of Multiple Data Sources and Various Geostatistical Methods. Remote Sens. 2020, 12, 3775. [Google Scholar] [CrossRef]
  64. Wang, Z.; Chen, X.M.; Yu, D.Q.; Zhang, L.X.; Wang, J.N.; Lv, J.S. Source apportionment and spatial distribution of potentially toxic elements in soils: A new exploration on receptor and geostatistical models. Sci. Total Environ. 2021, 759, 143428. [Google Scholar] [CrossRef]
  65. Jia, X.L.; Hu, B.F.; Marchant, B.P.; Zhou, L.Q.; Shi, Z.; Zhu, Y.W. A methodological framework for identifying potential sources of soil heavy metal pollution based on machine learning: A case study in the Yangtze Delta, China. Environ. Pollut. 2019, 250, 601–609. [Google Scholar] [CrossRef] [PubMed]
  66. Xiang, M.T.; Li, Y.; Yang, J.; Li, Y.; Li, F.; Hu, B.F.; Cao, Y. Assessment of Heavy Metal Pollution in Soil and Classification of Pollution Risk Management and Control Zones in the Industrial Developed City. Environ. Manag. 2020, 66, 1105–1119. [Google Scholar] [CrossRef]
  67. Hu, B.F.; Shao, S.; Fu, Z.Y.; Li, Y.; Ni, H.; Chen, S.C.; Zhou, Y.; Jin, B.; Shi, Z. Identifying heavy metal pollution hot spots in soil-rice systems: A case study in South of Yangtze River Delta, China. Sci. Total Environ. 2019, 658, 614–625. [Google Scholar] [CrossRef]
  68. Yang, H.; Wang, F.; Yu, J.; Huang, K.; Zhang, H.; Fu, Z. An improved weighted index for the assessment of heavy metal pollution in soils in Zhejiang, China. Environ. Res. 2021, 192, 110246. [Google Scholar] [CrossRef] [PubMed]
  69. Xia, F.; Hu, B.F.; Shao, S.; Xu, D.Y.; Zhou, Y.; Zhou, Y.; Huang, M.X.; Li, Y.; Chen, S.C.; Shi, Z. Improvement of Spatial Modelling of Cr, Pb, Cd, As and Ni in Soil Based on Portable X-ray Fluorescence (PXRF) and Geostatistics: A Case Study in East China. Int. J. Environ. Res. Public. Health 2019, 16, 2694. [Google Scholar] [CrossRef] [PubMed] [Green Version]
  70. Sun, C.; Liu, J.; Wang, Y.; Sun, L.; Yu, H. Multivariate and geostatistical analyses of the spatial distribution and sources of heavy metals in agricultural soil in Dehui, Northeast China. Chemosphere 2013, 92, 517–523. [Google Scholar] [CrossRef] [PubMed]
  71. Fu, T.T.; Zhao, R.Y.; Hu, B.F.; Jia, X.L.; Wang, Z.G.; Zhou, L.Q.; Huang, M.X.; Li, Y.; Shi, Z. Novel framework for modelling the cadmium balance and accumulation in farmland soil in Zhejiang Province, East China: Sensitivity analysis, parameter optimisation, and forecast for 2050. J. Clean. Prod. 2021, 279, 123674. [Google Scholar] [CrossRef]
  72. Hu, B.F.; Shao, S.; Ni, H.; Fu, Z.Y.; Huang, M.X.; Chen, Q.X.; Shi, Z. Assessment of potentially toxic element pollution in soils and related health risks in 271 cities across China. Environ. Pollut. 2021, 270, 116196. [Google Scholar] [CrossRef]
  73. Qin, G.; Niu, Z.; Yu, J.D.; Li, Z.H.; Ma, J.Y.; Ping, X. Soil heavy metal pollution and food safety in China: Effects, sources and removing technology. Chemosphere 2020, 267, 129205. [Google Scholar] [CrossRef]
  74. Kuerban, M.; Maihemuti, B.; Waili, Y.; Tuerhong, T. Ecological risk assessment and source identification of heavy metal pollution in vegetable bases of Urumqi, China, using the positive matrix factorization (PMF) method. PLoS ONE 2020, 15, e0230191. [Google Scholar] [CrossRef] [Green Version]
  75. Guan, Q.Y.; Wang, F.F.; Xu, C.Q.; Pan, N.H.; Lin, J.K.; Zhao, R.; Yang, Y.Y.; Luo, H.P. Source apportionment of heavy metals in agricultural soil based on PMF: A case study in Hexi Corridor, northwest China. Chemosphere 2018, 193, 189–197. [Google Scholar] [CrossRef]
  76. Agyeman, P.C.; Ahado, S.K.; John, K.; Kebonye, N.M.; Vašát, R.; Borůvka, L.; Kočárek, M.; Němeček, K. Health risk assessment and the application of CF-PMF: A pollution assessment–based receptor model in an urban soil. J. Soil. Sediment. 2021, 21, 3117–3136. [Google Scholar] [CrossRef]
  77. Heidari, M.; Darijani, T.; Alipour, V. Heavy metal pollution of road dust in a city and its highly polluted suburb; quantitative source apportionment and source-specific ecological and health risk assessment. Chemosphere 2021, 273, 129656. [Google Scholar] [CrossRef]
  78. Magesh, N.S.; Tiwari, A.; Botsa, S.M.; Leitao, L.M. Hazardous heavy metals in the pristine lacustrine systems of Antarctica: Insights from PMF model and ERA techniques. J. Hazard. Mater. 2021, 412, 125263. [Google Scholar] [CrossRef] [PubMed]
  79. Xiao, R.; Guo, D.; Ali, A.; Mi, S.; Liu, T.; Ren, C.; Li, R.; Zhang, Z. Accumulation, ecological-health risks assessment, and source apportionment of heavy metals in paddy soils: A case study in Hanzhong, Shaanxi, China. Environ. Pollut. 2019, 248, 349–357. [Google Scholar] [CrossRef] [PubMed]
  80. Saby, N.P.A.; Arrouays, D.; Boulonne, L.; Pochot, A. Geostatistical assessment of Pb in soil around Paris, France. Sci. Total Environ. 2006, 367, 212–221. [Google Scholar] [CrossRef] [PubMed]
  81. Jin, G.; Fang, W.; Shafi, M.; Wu, D.; Li, Y.; Zhong, B.; Ma, J.; Liu, D. Source apportionment of heavy metals in farmland soil with application of APCS-MLR model: A pilot study for restoration of farmland in Shaoxing City Zhejiang, China. Ecotoxicol. Environ. Saf. 2019, 184, 109495. [Google Scholar] [CrossRef]
  82. Chai, L.; Wang, Y.H.; Wang, X.; Ma, L.; Cheng, Z.X.; Su, L.M.; Liu, M.X. Quantitative source apportionment of heavy metals in cultivated soil and associated model uncertainty. Ecotoxicol. Environ. Saf. 2021, 215, 112150. [Google Scholar] [CrossRef]
  83. Yang, Y.; Christakos, G.; Guo, M.; Xiao, L.; Huang, W. Space-time quantitative source apportionment of soil heavy metal concentration increments. Environ. Pollut. 2017, 223, 560–566. [Google Scholar] [CrossRef] [PubMed]
  84. Jiang, H.H.; Cai, L.M.; Wen, H.H.; Luo, J. Characterizing pollution and source identification of heavy metals in soils using geochemical baseline and PMF approach. Sci. Rep. 2020, 10, 1–11. [Google Scholar] [CrossRef] [Green Version]
  85. Martin, L. Urban land use influences on heavy metal fluxes and surface sediment concentrations of small lakes. Water Air Soil Pollut. 2001, 126, 363–383. [Google Scholar] [CrossRef]
  86. Salonen, V.P.; Korkka-Niemi, K. Influence of parent sediments on the concentration of heavy metals in urban and suburban soils in Turku, Finland. Appl. Geochem. 2007, 22, 906–918. [Google Scholar] [CrossRef]
  87. Chen, H.Y.; Teng, Y.G.; Lu, S.J.; Wang, Y.Y.; Wu, J.; Wang, J. Source apportionment and health risk assessment of trace metals in surface soils of Beijing metropolitan, China. Chemosphere 2016, 144, 1002–1011. [Google Scholar] [CrossRef] [PubMed]
  88. Wang, Y.; Zhang, L.; Wang, J.; Lv, J.S. Identifying quantitative sources and spatial distributions of potentially toxic elements in soils by using three receptor models and sequential indicator simulation. Chemosphere 2020, 242, 125266. [Google Scholar] [CrossRef] [PubMed]
  89. Hu, B.F.; Zhou, Y.; Jiang, Y.F.; Ji, W.J.; Fu, Z.Y.; Shao, S.; Li, S.; Huang, M.X.; Zhou, L.Q.; Shi, Z. Spatio-temporal variation and source changes of potentially toxic elements in soil on a typical plain of the Yangtze River Delta, China (2002–2012). J. Environ. Manag. 2020, 271, 110943. [Google Scholar] [CrossRef]
  90. Shao, S.; Hu, B.F.; Tao, Y.; You, Q.H.; Huang, M.X.; Zhou, L.Q.; Chen, Q.X.; Shi, Z. Comprehensive source identification and apportionment analysis of five heavy metals in soils in Wenzhou City, China. Environ. Geochem. Health 2021, 1–24. [Google Scholar] [CrossRef]
  91. Nachman, K.E.; Baron, P.A.; Raber, G.; Francesconi, K.A.; Navas-Acien, A.; Love, D.C. Roxarsone, inorganic arsenic, and other arsenic species in chicken: A U.S.-based market basket sample. Environ. Health Perspect. 2013, 121, 818–824. [Google Scholar] [CrossRef] [PubMed] [Green Version]
  92. Wang, J.; Wang, L.L.; Wang, Y.X.; Tsang, D.C.W.; Yang, X.; Beiyuan, J.Z.; Yin, M.L.; Xiao, T.F.; Jiang, Y.J.; Lin, W.L.; et al. Emerging risks of toxic metal (loid) s in soil-vegetables influenced by steel-making activities and isotopic source apportionment. Environ. Int. 2021, 146, 106207. [Google Scholar] [CrossRef]
  93. Yuanan, H.; He, K.; Sun, Z.; Chen, G.; Cheng, H. Quantitative source apportionment of heavy metal (loid)s in the agricultural soils of an industrializing region and associated model uncertainty. J. Hazard. Mater. 2020, 391, 122244. [Google Scholar] [CrossRef]
  94. Ko, M.S.; Nguyen, T.H.; Kim, Y.G.; Linh, B.M.; Chanpiwat, P.; Hoang, H.N.T.; Nguyen, T.A.H.; Tuyến, L.H.; Bien, N.Q.; Nguyen, V.A.; et al. Assessment and source identification of As and Cd contamination in soil and plants in the vicinity of the Nui Phao Mine, Vietnam. Environ. Geochem. Health 2020, 42, 4193–4201. [Google Scholar] [CrossRef]
  95. Liao, S.Y.; Jin, G.Q.; Muhammad, A.K.; Zhu, Y.W.; Duan, L.L.; Luo, W.X.; Jia, J.W.; Zhong, B.; Ma, J.W.; Ye, Z.Q.; et al. The quantitative source apportionment of heavy metals in peri-urban agricultural soils with UNMIX and input fluxes analysis. Environ. Technol. Inno. 2021, 21, 101232. [Google Scholar] [CrossRef]
  96. Glaser, B.; Dreyer, A.; Bock, M.; Fiedler, S.; Mehring, M.; Heitmann, T. Source apportionment or organic pollutants of a highway-traffic-influenced urban area in Bayreuth (Germany) using biomarker and stable carbon isotope signatures. Environ. Sci. Technol. 2005, 39, 3911–3917. [Google Scholar] [CrossRef]
  97. Lin, Y.P.; Cheng, B.Y.; Shyu, G.S.; Chang, T.K. Combining a finite mixture distribution model with indicator kriging to delineate and map the spatial patterns of soil heavy metal pollution in Chunghua County, Central Taiwan. Environ. Pollut. 2010, 158, 235–244. [Google Scholar] [CrossRef] [PubMed]
  98. Chen, H.P.; Zhang, W.; Yang, X.; Wang, P.; McGrath, S.P.; Zhao, F.J. Effective methods to reduce cadmium accumulation in rice grain. Chemosphere 2018, 207, 699–707. [Google Scholar] [CrossRef] [PubMed]
  99. Du, Y.; Wang, X.; Ji, X.; Zhang, Z.; Saha, U.K.; Xie, W.; Xie, Y.H.; Wu, J.M.; Peng, B.; Tan, C. Effectiveness and potential risk of CaO application in Cd-contaminated paddy soil. Chemosphere 2018, 204, 130–139. [Google Scholar] [CrossRef] [PubMed]
  100. Berar, I.M.; Micle, V.; Avram, S.; Şenilă, M.; Oros, V. Bioleaching of some heavy metals from polluted soils. Environ. Eng. Manag. J. 2012, 11, 1389–1393. [Google Scholar]
  101. Damian, E.; Micle, V.; Sur, M.I. Removal of heavy metals from contaminated soil using chitosan as washing agent–A preliminary study. J. Environ. Prot. Ecol. 2020, 21, 823–829. [Google Scholar]
Figure 1. Study area and sampling location.
Land 10 01126 g001
Figure 2. Relationships among TEs in soil (n = 300) (the symbol × means that the relationships among corresponding TEs was not significant at the 99% confidence level).
Land 10 01126 g002
Figure 3. Boxplot of values of geo-accumulation index (the red dashed line means the threshold for occurrence of pollution).
Land 10 01126 g003
Figure 4. Boxplot of values of potential ecological index (the number represents the mean value of potential ecological index of different TEs; the blue dashed line represents threshold value of low risk; the orange dashed line represents threshold value of moderate risk; the red dashed line represents threshold value of high risk; the grey solid line means the threshold of low risk for RI).
Land 10 01126 g004
Figure 5. Boxplot of values of single PI and NPI (the red dashed line means the threshold for occurrence of pollution).
Land 10 01126 g005
Figure 6. Map of probability of the Igeo value for Cd and Hg >1 (a,b), probability of the NPI value >1 (c), and probability of the RI value >150 (d).
Land 10 01126 g006
Figure 7. Maps of content of Cr (a), Pb (b), Cd (c), Hg (d), As (e), Cu (f), Zn (g), Ni (h) and land use types (i) in Yuyao City.
Land 10 01126 g007aLand 10 01126 g007b
Figure 8. Contributions of different sources to TEs outputted by PMF model.
Land 10 01126 g008aLand 10 01126 g008b
Figure 9. Factor fingerprints of sources of soil TEs in Yuyao City produced by PMF.
Land 10 01126 g009
Table 1. Summary statistics of TEs in soil of Yuyao City (mg/kg) (n = 300).
TEsMinMaxMeanSDSkewnessKurtosisCV(%)BVTCNV
Cr9.21246.0061.8022.122.0516.2635.7952.90261
Pb17.3066.4034.431.580.58−0.494.5923.70527
Cd0.051.690.200.118.74114.4355.000.07300.097
Hg0.040.760.200.141.151.1370.000.09400.065
As1.9011.406.131.800.260.3029.369.21011
Cu7.14134.0032.7516.202.9912.0649.4717.60523
Zn47.70252.0097.6127.892.136.7628.5770.60174
Ni4.86144.0026.5211.083.9640.9441.7824.60327
Note: CV means coefficient of variation, %; BV means background value of TEs in Zhejiang Province; TC means the toxic coefficient of different TEs [47]; NV means the national arithmetic value reported by Teng et al. (2014) [59].
Table 2. Pollution status assessed by geo-accumulation index (n = 300).
Grade CrPbCdHgAsCuZnNi
Unpolluted
I g e o ≤ 0
n266158210209300278297299
Percent (%)88.6752.677069.6710092.679999.67
Unpolluted to moderately polluted
0 < I g e o ≤ 1
n33142000000
Percent (%)1147.33000000
Moderately polluted
1 < I g e o ≤ 2
n10858401931
Percent (%)0.33028.332806.3310.33
Moderately to heavily polluted
2 < I g e o ≤ 3
n00470300
Percent (%)001.332.330100
Heavily polluted
3 < I g e o ≤ 4
n00000000
Percent (%)00000000
Heavily to extremely polluted
4 < I g e o ≤ 5
n00100000
Percent (%)000.3300000
Extremely polluted
I g e o > 5
n00000000
Percent (%)00000000
Table 3. Pollution status assessed by potential ecological risk assessment index (n = 300).
Grade CrPbCdHgAsCuZnNi
Low risk
ER ≤ 40
n300300973300300300300
Percent (%)100100324.33100100100100
Moderate risk
40 < ER ≤ 80
n00147890000
Percent (%)004929.670000
Considerable risk
80 < ER ≤ 160
n001371030000
Percent (%)0045.6734.330000
High risk
160 < ER ≤ 320
n006340000
Percent (%)00211.330000
Very high riskn00110000
ER > 320Percent (%)000.330.330000
Table 4. Pollution status assessed by pollution index (n = 300).
Grade CrPbCdHgAsCuZnNi
Safety
PI ≤ 1
n300300284291300298296299
Percent (%)10010094.679710099.3398.6799.67
Slight pollution
1 < PI ≤ 2
n001590240
Percent (%)005300.671.330
Mild pollution
2 < PI ≤ 3
n00000001
Percent (%)00000000.33
Moderate pollution
3 < PI ≤ 5
n00100000
Percent (%)000.3300000
Severe pollution
PI > 5
n00000000
Percent (%)00000000
Publisher’s Note: MDPI stays neutral with regard to jurisdictional claims in published maps and institutional affiliations.

