
Gross Ecosystem Productivity Dominates the Control of Ecosystem Methane Flux in Rice Paddies


1
State Key Laboratory of Coal Mine Disaster Dynamics and Control, Faculty of Architecture and Urban Planning, Chongqing University, Chongqing 400045, China
2
Department of Biology Science, Institute of Environment Sciences, University of Quebec at Montreal, Montreal, QC C3H 3P8, Canada
3
Shanghai Academy of Environmental Sciences, Shanghai 200233, China
4
Ministry of Education Key Laboratory for Biodiversity Science and Ecological Engineering, Coastal Ecosystems Research Station of the Yangtze River Estuary, Fudan University, Shanghai 200433, China
*
Author to whom correspondence should be addressed.
†
Hong Li and Min Zhao are equally contributing first authors.
Land 2021, 10(11), 1186; https://0-doi-org.brum.beds.ac.uk/10.3390/land10111186
Submission received: 2 October 2021
/
Revised: 1 November 2021
/
Accepted: 1 November 2021
/
Published: 4 November 2021
(This article belongs to the Topic Climate Change and Environmental Sustainability)
Abstract
:Although rice paddy fields are one of the world’s largest anthropogenic sources of methane CH4, the budget of ecosystem CH4 and its’ controls in rice paddies remain unclear. Here, we analyze seasonal dynamics of direct ecosystem-scale measurements of CH4 flux in a rice-wheat rotation agroecosystem over 3 consecutive years. Results showed that the averaged CO2 uptakes and CH4 emissions in rice seasons were 2.2 and 20.9 folds of the wheat seasons, respectively. In sum, the wheat-rice rotation agroecosystem acted as a large net C sink (averaged 460.79 g C m−2) and a GHG (averaged 174.38 g CO2eq m−2) source except for a GHG sink in one year (2016) with a very high rice seeding density. While the linear correlation between daily CH4 fluxes and gross ecosystem productivity (GEP) was not significant for the whole rice season, daily CH4 fluxes were significantly correlated to daily GEP both before (R2: 0.52–0.83) and after the mid-season drainage (R2: 0.71–0.79). Furthermore, the F partial test showed that GEP was much greater than that of any other variable including soil temperature for the rice season in each year. Meanwhile, the parameters of the best-fit functions between daily CH4 fluxes and GEP shifted between rice growth stages. This study highlights that GEP is a good predictor of daily CH4 fluxes in rice paddies.
1. Introduction
Rice paddies provide the dominant staple food crop for over 5 billion people worldwide while acting as a major source of atmospheric methane (CH4) which is the second most important greenhouse gas following carbon dioxide (CO2) [1,2]. Thereby, constraint and mitigation of CH4 emissions from irrigated rice fields emerges as a major scientific and policy issue. Previous studies on global estimation of CH4 emissions from rice paddies showed that the budget of CH4 flux remain great uncertainties [2,3], which indicated more efforts are needed to understand the responses of CH4 flux to biological and environmental factors.
Previous CH4 flux from rice paddies have predominantly been measured using the manual closed chamber technique [4,5]. Chamber-based measurements can introduce some potential biases due to direct interaction with the near-surface environment and are also limited to estimate annual budgets due to the discrete sampling in time [6,7]. In recent years, the eddy covariance (EC) technique advantaged in measuring CH4 flux since it provides continuous ecosystem-scale CH4 flux without interfering with the processes of gas exchange between the surface and the atmosphere [6,8]. Several studies using EC methods have advantaged our understanding of the dynamics and process of CH4 flux from rice paddies [9,10,11]. However, to date few studies have used this method to measure CH4 flux from rice paddies in China [9,10].
Methane-producing microbes (methanogens) produce CH4 in soils as the end product of the anaerobic decomposition of organic matter, which would be mineralized to carbon dioxide under aerobic conditions before being released to the atmosphere. Thus, soil water content and soil temperature, which regulate the reduced soil conditions and enzyme-mediated processes, have been widely considered as the most important environmental controlling factors of CH4 flux. However, rice plants growing in water-saturated soils are also closely associated with the production and transport of CH4. Recently, several studies revealed that gross ecosystem productivity (GEP) is the dominant cause of the diel pattern of half-hourly CH4 flux in rice paddies [9,10,12,13], and that GEP represents one of the most important factors regulating seasonal variations in daily CH4 flux [9,14,15,16]. However, in some sites, GEP are not that important as temperature for CH4 flux [10,11].
China has 19% of the global rice field area and provides 30% of the production, in which winter wheat-paddy rice cropping rotation are very common practiced. Over 80% of these rice paddies apply water-saving techniques, such as mid-season drainage and alternate wetting and drying, which has largely decreased the amount of CH4 emissions [17,18,19,20]. In addition to changes in the redox environment, soil water status can influence stomatal conductance and photosynthesis of rice plants [21,22,23]. While Dai et al. (2019) using EC technique in a rice paddy in China has reported a correlation between GEP and CH4 flux. How rice plants control CH4 flux in rice paddies applying water-saving techniques remains unclear. In this study, we measured CH4 flux using the eddy covariance technique over 3 consecutive rice growing cycles in a rice paddy where water-saving techniques are applied, to: (1) identify factors affecting CH4 flux during rice season; (2) estimate annual carbon budget and greenhouse gas (GHG) budget for the rice-wheat rotation agroecosystem. We hypothesized that rice plant productivity would exert a strong control on CH4 flux in the rice season.
2. Methods
2.1. Study Site and Crop Management
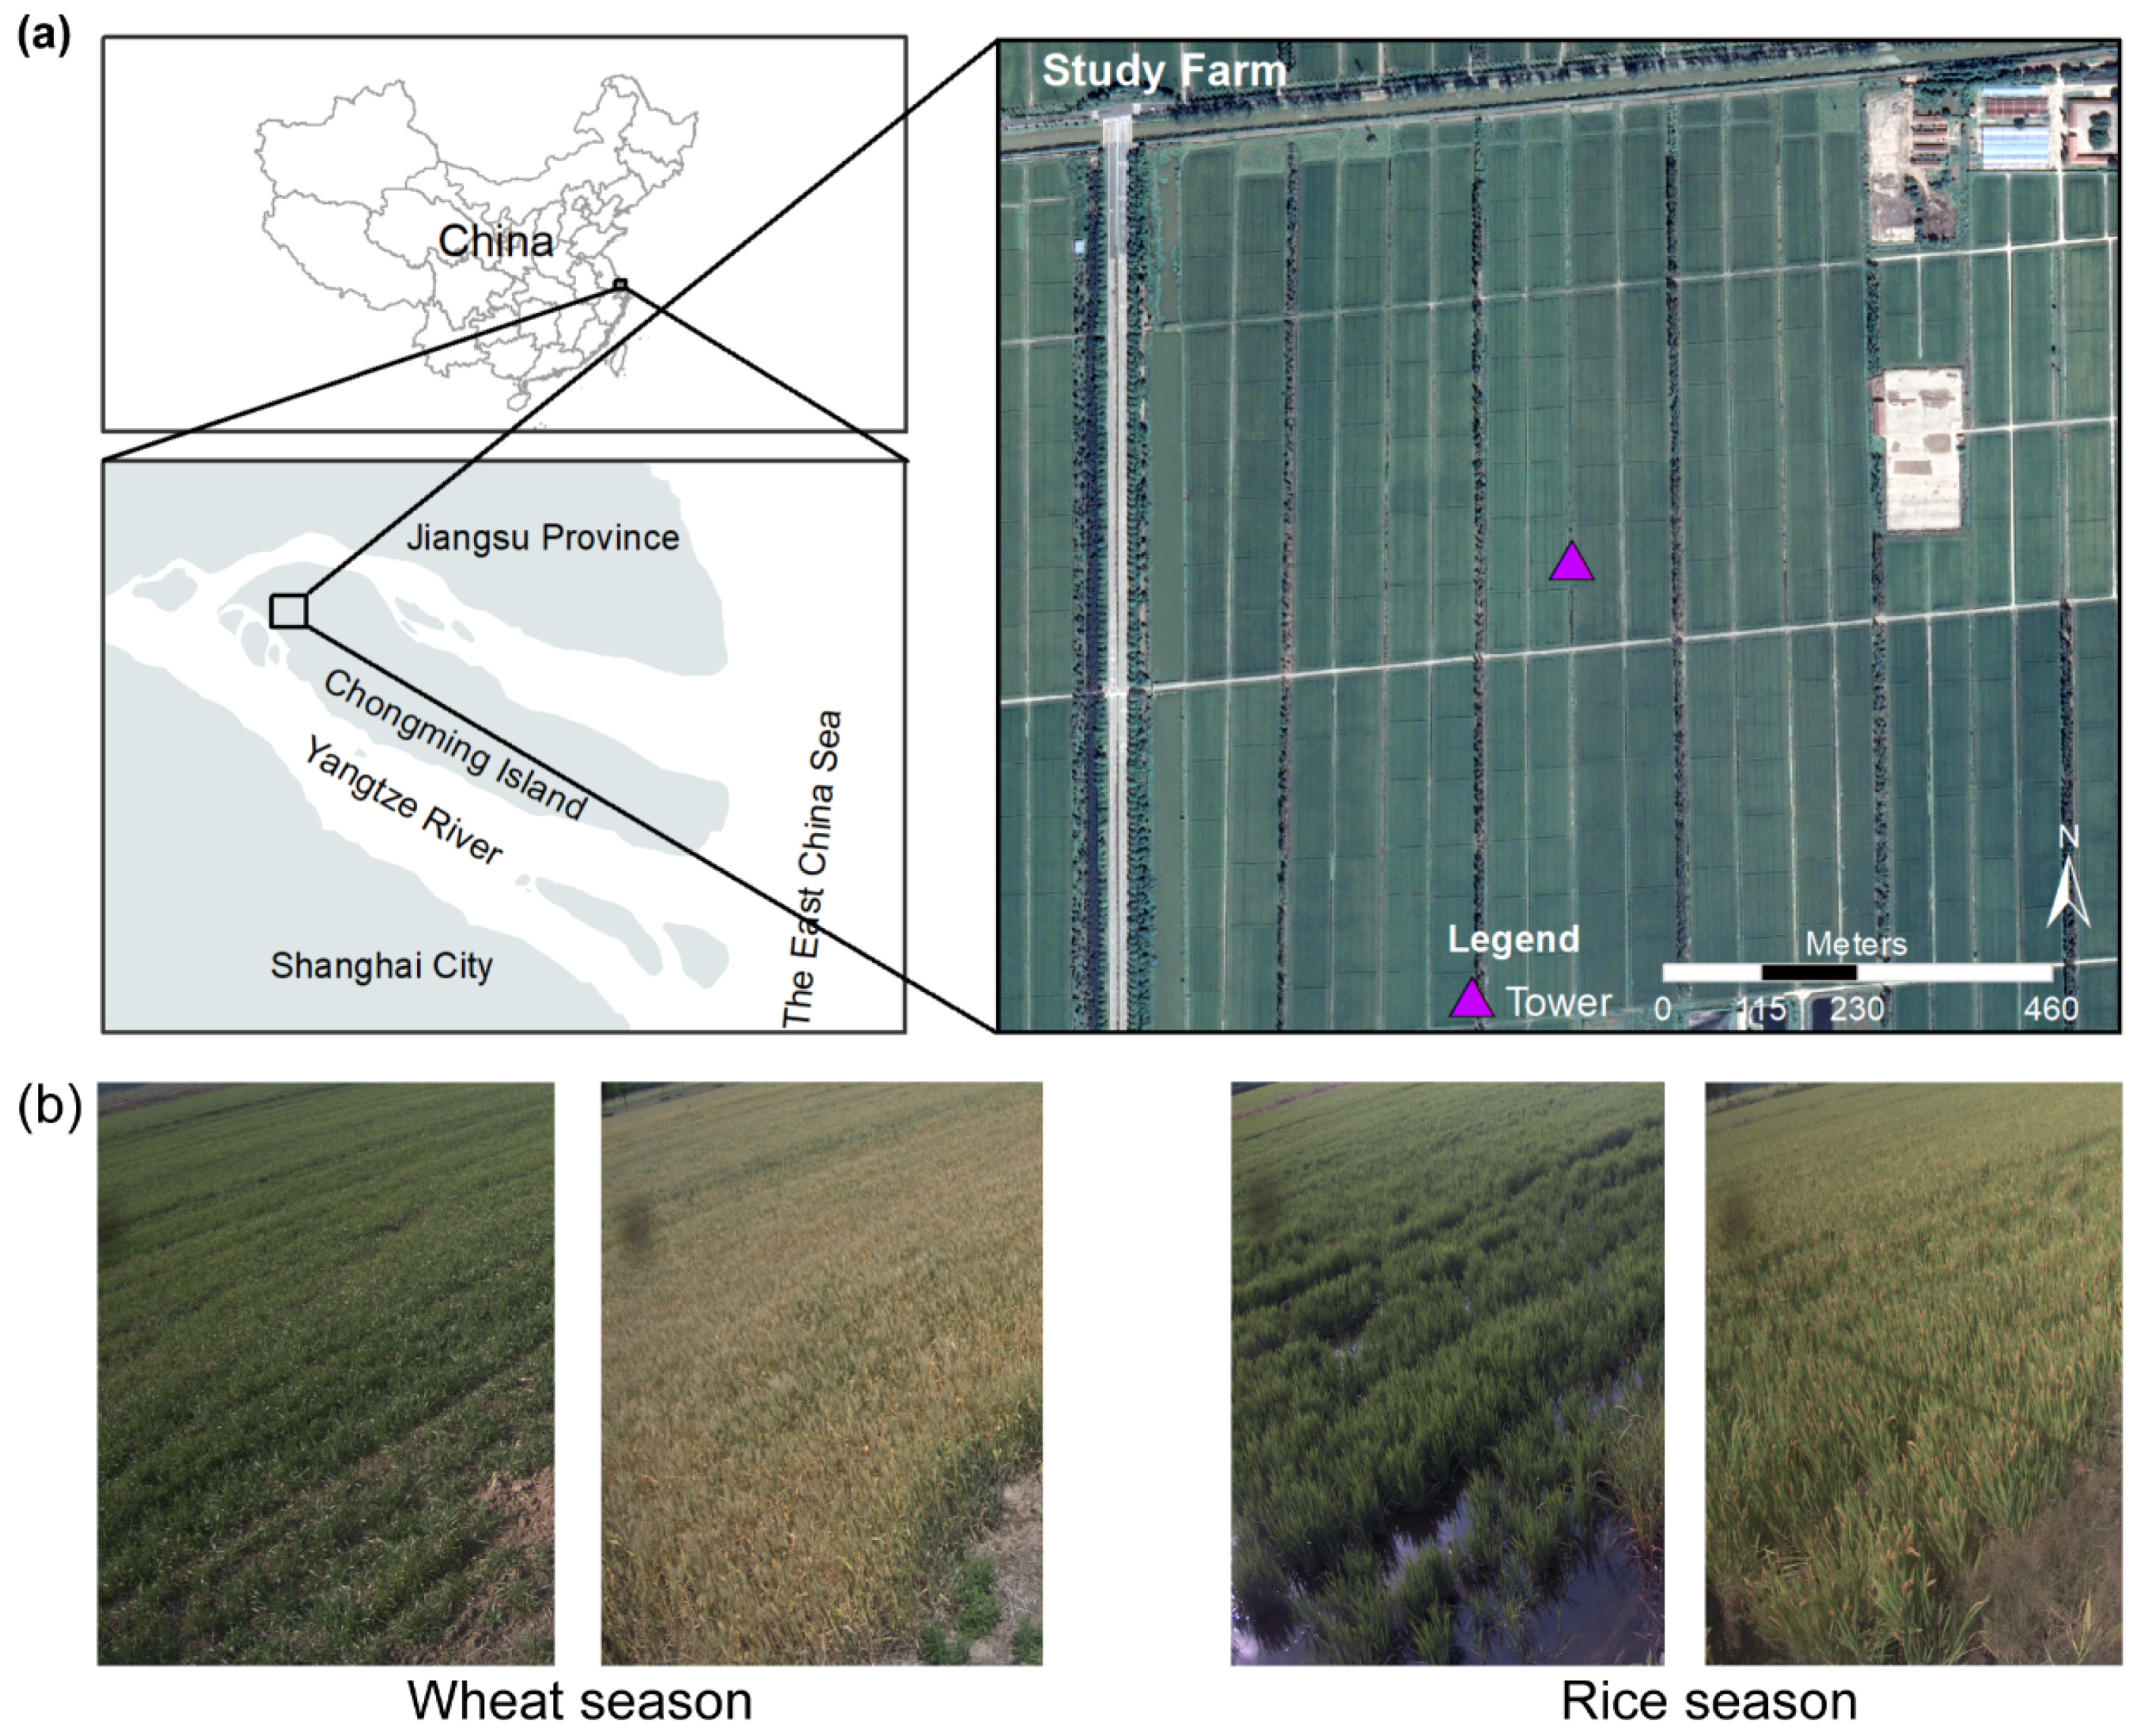
The studied rice-wheat rotation agroecosystem is located at the Yuejin Farm on the Chongming Island, Shanghai, China (31°48′37.54″ N, 121°15′0.43″ E, Figure 1a). The farm covers a flat and homogenous area of 18.95 km2. The climate here is characterized as northern subtropical monsoon climate. The mean air temperature and annual precipitation were 17.1 ± 0.6 °C and 1156.1 ± 190.6 mm (1991 to 2012), respectively. The soil texture is characterized as silt loam. The soil organic carbon and total nitrogen in the topsoil (0–8 cm) are 20 g C kg−1 and 1.6 g N kg−1, respectively.
2.2. Crop Establishment
An annual winter wheat-paddy rice cropping rotation was practiced in the field (Figure 1b). Winter wheat was sowed in October or December and rice was direct-seeded in June (Table 1). Seeds of the wheat and rice cultivar were Ningmai 13 and Wuyunjing 31, respectively. Chopped rice and wheat straw at 5–10 cm length is mixed into the soil layer when farmers plow in the cropping systems. The cropping regime and water management at the wheat-paddy field are representative of common practices in southeast China. The cropping regimes are detailed in Li et al. (2019) [16]. Irrigation was only started at a few days before the rice season and ended at about two weeks before the ends of the rice season. During the rice season, alternate wetting and drying regime (AWD) was deployed. The mid-season drainage (MSD) was also applied from late July to early August in each year [16]. In short, a typical water regime of AWD-MSD-AWD-moisture irrigation was practiced in the rice season.
The paddy rice sequentially experienced 3 growth stages related to rice plant phenology, including: vegetative (DOY 164–208, 159–206, 158–202 in 2016, 2017, and 2018, respectively), reproductive (DOY 209–271, 207–269, 203–271 in 2016, 2017, and 2018, respectively), and ripening stage (DOY 272–315, 270–296, 272–318 in 2016, 2017, and 2018, respectively). Mid-season drainage represents a strong artificial disturbance, and thus the MSD period (DOY 204–222, 200–216, 199–214 in 2016, 2017, and 2018, respectively) was separated from the late vegetative and early reproductive stage in our study. Accordingly, neither the vegetative stage nor the reproductive stage includes the MSD practice in the following analyses.
2.3. Eddy Covariance Measurements and Data Processing
The eddy covariance (EC) technique was used to continuously collect net CH4 fluxes and net CO2 fluxes between the wheat-rice rotation field and the atmosphere from 2016 to 2018. The EC measurement station was in the middle of the farmland (Figure 1). The EC system included an open-path CH4 gas analyzer (LI-7700, LI−COR), an open-path CO2/H2O gas analyzer (EC150, Campbell Scientific), and a sonic anemometer (CSAT3, Campbell Scientific). The turbulence data was sampled with a frequency of 10 Hz.
Fluxes were calculated using the 30 min covariance of gas scalar concentrations of interest and vertical wind velocity after applying a series of standard correction. The EddyPro 7.0.4 software (LI−COR) was used as outlined in Li et al. (2018, 2019) [16,24]. Briefly, these included a despiking procedure including detecting and eliminating individual out-of-range values [25], time lag detection applying covariance maximization with default, double coordinate rotations [26], compensation of Webb-Pearman-Leuning density fluctuations [27]. The random uncertainty for half-hourly fluxes were estimated [28].
The subsequent QA/QC processing for half-hourly fluxes were performed as detailed in Li et al. (2018, 2019) [16,24]. The data were removed when rainfall events occurred, relative signal strength indicator (RSSI) < 20%, and friction velocity < 0.13 m s−1 [29]. The the steady state test and the well-developed turbulence test were used to generate flux quality flags [30]. After QA/QC, data coverage during the rice growing seasons 2016–2018 were 49–56% for CH4 flux and 52–64% for CO2 flux. Daily averaged fluxes were only calculated when more than 12 data points were available for both daytime and nighttime.
To estimate seasonal budgets, gaps of CO2 and CH4 fluxes were filled using both the marginal distribution sampling method and a random forest algorithm [29,31]. GEP were estimated based on the gap-filling of the marginal distribution sampling method of CO2 fluxes time series [29]. The uncertainty introduced by the gap-filling procedure were estimated [29,31]. The uncertainty of seasonal budgets was obtained according to Aurela et al. (2002) [32]. The net GHG budget was calculated assuming that 1 g CH4 is equivalent to 28 g CO2 with respect to the greenhouse effect over a time horizon of 100 years.
Basic hydrological and micrometeorological data were collected in conjunction with the EC data, including air temperature (3.3 m above ground, HMP155 A, Campbell Scientific), soil temperature (5 cm underground, 109, Campbell Scientific), and volumetric water content (VWC) (5 cm underground, CS616, Campbell Scientific), and water table depth (Pro 30, YSI).
2.4. Statistics
To investigate the seasonal variation in CH4 flux, a semi-empirical multiplicative model was employed. Based on previous studies, several potential driving factors of the CH4 flux were included in the model:
where FCH4 is the daily CH4 flux, Tg, GEP, VWC, u*, P are the normalized soil temperature, gross ecosystem photosynthesis, volumetric water content, friction velocity, ambient pressure, respectively, and a, b, c, d, e and f are the model parameters. In 2018, water conductivity (g) and water table depth (h) were also tested as model parameters.
To identify the importance of each driving factor in synchronous controls of CH4 flux, a partial F test was performed to determine whether including the independent variables in the model could significantly increase the model’s ability to explain the variation of the dependent variable. A partial F value larger than the threshold F value (Fα, α = 0.05) indicates that the excluded variable can significantly increase the explanation of the dependent variable at the significance level of 5% if it is included in the model. A larger F value suggests that the excluded variable can explain more of the variation of the dependent variable than other independent variables.
3. Results and Discussion
3.1. Seasonal Variations in CH4 Fluxes and Predictors
Large seasonal variations in daily mean CH4 fluxes were observed each year in the rice-wheat rotation agroecosystem (Figure 2). Daily CH4 fluxes during 2016–2018 averaged at 10.57 and 408.07 mg CH4 m−2 d−1 in the wheat and rice season, respectively. Daily CH4 fluxes kept a relatively low range between −52.06 and 199.00 mg CH4 m−2 d−1 in the wheat growing season and a range between 0.57 and 1488.70 mg CH4 m−2 d−1 in the rice growing season. CH4 fluxes sharply increased when the field was first flooded for the rice season in June. CH4 fluxes reach peaks in late July and then gradually decreased to low emissions at the end of the rice season between late October and early November.
For the rice season, daily CH4 fluxes varied among rice growth stages (Figure 2). In the vegetative stage, daily CH4 fluxes, as well as GEP and soil temperature, exhibited an increasing trend until the mid-season drainage (Figure 2 and Figure 3). Daily CH4 fluxes reached peaks of 1.45–1.47g CH4 m−2 d−1 at the end of the vegetative stage in middle July of each year. Daily CH4 fluxes sharply dropped by 81–88% during the mid-season drainage despite GEP and soil temperature continuing to increase (Figure 2 and Figure 3). After the drainage, daily CH4 flux increased to an average emission of 0.47, 0.42, and 0.44 g m−2 d−1 in August in 2016, 2017, and 2018, respectively. At the ripening stage, CH4 flux was much lower compared to other stages (Figure 2). In total, cumulative CH4 emissions at the vegetative, mid-season drainage, reproductive and, ripening stage were 46–48%, 13–18%, 31–38%, and 1–4%, respectively.
As discussed in Li et al. (2019) [16], CH4 fluxes in the rice paddy represents a strong CH4 source for atmosphere CH4 during the rice growing season. The seasonal pattern (Figure 3) of CH4 fluxes which was observed to peak before the mid-season drainage with a secondary peak after the mid-season drainage was consistent with previous studies under similar cropping regimes in southeast China [19,33].
During the rice growing season, the linear correlation between daily CH4 fluxes and GEP were not significant. However, daily CH4 fluxes were significantly correlated to GEP both before (Figure 4, R2: 0.52–0.83) and after the mid-season drainage (Figure 4, R2: 0.71–0.79) in each year. Furthermore, the partial F test showed that GEP during all periods were identified as significant variables in each year. Soil temperature during periods except for before the mid-season drainage in 2016 and after the mid-season drainage in 2018 were significant variables. The F value of GEP was much greater than that of any other variable including soil temperature in each year (Table 2), which demonstrated that GEP was much more important than any other variable included in the model although when other variables were added, a larger proportion of the variance in CH4 fluxes could be explained at the seasonal timescale (Table 3, R2: 0.80–0.98).
While the linear correlation between daily CH4 fluxes and GEP were not significant for the whole rice season, the regression (Figure 4) and F partial test (Table 2) both before (Figure 4, R2: 0.52–0.83) and after the mid-season drainage demonstrated that daily GEP was the most important predictor of daily CH4 fluxes as we hypothesized. This separate analysis for each rice growing stage may be a helpful way to identify the factors of CH4 fluxes in rice paddies. The close relationship between daily CH4 fluxes and GEP as well as plant biomass was also reported in a few previous studies [9,15,34,35]. Meanwhile, the functional relationship between daily CH4 fluxes and GEP shifted (Figure 4) between growth stages. The linear response of CH4 fluxes to GEP indicated a direct limitation of substrate supply for methanogenesis in the early cultivation stage while the exponential response might indicate multiple processes associated with GEP controls on CH4 fluxes in the later stage related to carbon supply and transport processes. The slope of CH4 flux to GEP becomes smaller after the MSD maybe due to a limited environmental condition for CH4 production during the AWD period. Overall, the evidence of GEP dominating CH4 fluxes highlights the importance of rice plant productivity in controlling CH4 emissions.
Water management contributed to the changing magnitude of daily CH4 fluxes in the rice season. For example, daily CH4 fluxes sharply increased when the first flooded before the rice season and decreased during the operation of mid-season drainage in each year. Meanwhile, no significant positive correlation between CH4 fluxes and VWC (even after accounting for possible time lags) was found at each growth stage (Figure 5a–e). CH4 fluxes was significantly correlated to water table depth only during the ripening stage when water table depth was very low (<0) (Figure 5j). However, daily CH4 fluxes was significantly correlated with water table depth when analyzing the entire rice growing season even though no significant correlation was observed for the vegetative, mid-season drainage, and reproductive stages (Figure 5f).
Although the results highlight the importance of plants control on CH4 fluxes in rice paddies, the effect of environmental factors remains important. Higher soil temperature can enhance methanogenesis, molecular diffusion, and transport within plants [36,37,38]. Although the relative importance was less than GEP, soil temperature was significantly correlated with CH4 fluxes during some growth stages (Table 2). Anaerobic soil conditions, which depend on soil water content in rice fields, are a prerequisite for CH4 production by methanogens in rice paddies. This dependence on anaerobic conditions could explain why CH4 fluxes decreased during the middle season drainage in each year. The significance between daily CH4 fluxes and water table depth (<0) also indicated the importance of soil water conditions which decides anaerobic conditions of the paddy fields on CH4 flux.
3.2. Annual C and GHG Budgets
For the wheat season, cumulative CO2 uptake were estimated at 683.61 ± 43.26, 579.87 ± 50.68, 617.98 ± 4.91 g CO2 m−1 in 2016, 2017, and 2018, respectively (Table 4). Wheat cumulative CH4 emissions were 3.45 ± 0.40, 2.55 ± 0.13, 4.27 ± 0.21, g CH4 m−1 in 2016, 2017, and 2018, respectively. In total, wheat season acted as both net C and GHG sink (averaged 168.97 g C m−2 and 1648.39 g CO2eq m−2, respectively).
For the rice season, cumulative CO2 uptake was estimated at −2048.34 ± 193.50, −1299.69 ± 107.91, −839.56 ± 91.62 g CO2 m−1 in 2016, 2017, and 2018, respectively (Table 4). Rice cumulative CH4 emissions were 59.42 ± 5.11, 57.68 ± 4.90, 56.88 ± 6.29, g CH4 m−1 in 2016, 2017, and 2018, respectively. In total, although rice season acted as a net C sink (averaged 337.20 g C m−2), it existed a GHG source (averaged 227.98 g CO2eq m−2 for 3 years) due to great CH4 emissions except for the season with very high seeding density in 2016 [16].
Both the wheat and rice season acted as large atmospheric sinks for CO2 and sources for CH4. The averaged CO2 uptakes and CH4 emissions in rice seasons were 2.2 and 20.9 folds of the wheat seasons, respectively (Table 4). In sum, the rice-wheat rotation agroecosystem acted as net C sink (averaged 460.79 g C m−2) and GHG source (averaged 174.38 g CO2eq m−2 in 2017–2018) except for 2016. Although the magnitude of CO2 and CH4 budget in our study were higher than results reported from other regions [7,12,39,40,41], they are comparable with EC measurements in the near province of Jiangsu in China [9,10]. The harvest carbon was not accounted for in this study, while rice season might be a C source when harvested carbon was added [42]. The N2O emissions was not included in the calculation of GHG budget in this study, while N2O emission especially in the wheat season is a very strong source for atmosphere N2O.
More than half of the global rice crop experience drought and high temperatures, which are predicted to become more frequent under climate change, resulting that water-saving techniques have been widely employed in rice cropping regimes [17,18,19,20]. In some models [18], CH4 fluxes are often predicted as a function of soil temperature and/or other environmental variables while the importance of rice plant controls on CH4 fluxes is rarely accounted for. We found daily GEP is a good predictor (R2: 0.52–0.83) of daily CH4 fluxes if accounting for growth stage specific responses in water-saving paddy fields. Thus, more studies are needed to further optimize the prediction of CH4 fluxes in rice paddies under climate change. The strong connection between GEP and CH4 flux found in this study indicates a possible trade-off in using irrigated ecosystems for carbon capture and sequestration [43,44]. Meanwhile, increasing human population demands for food further increases in rice production. Thus, a balance between increase of photosynthetically fixed carbon for rice grain yield and mitigation of methane emissions is required for irrigated rice fields. In addition to water limiting techniques, practices to control excessive carbon input such as a better-informed management of planting density [16] and to decrease the plant-mediated transport of CH4 similar to a modified rice plant with low stomatal density has a great potential to limit increases in CH4 emissions.
4. Conclusions
In this paper, we analyzed 3 consecutive years of eddy covariance measurements of CH4 fluxes from a rice-wheat rotation agroecosystem located in Southeast China. The wheat-rice rotation agroecosystem acted as a large net C sink (averaged 460.79 g C m−2) and a GHG (averaged 174.38 g CO2eq m−2) source except for a GHG sink in one year with a very high rice seeding density. The averaged CO2 uptakes and CH4 emissions in rice seasons were 2.2 and 20.9 folds of the wheat seasons, respectively. Although daily CH4 flux and GEP existed not significantly correlated for the whole season, GEP dominates the control of CH4 flux when the rice season was divided into the periods before and after the mid-season drainage. The reason is that the functional relationship between daily CH4 flux and GEP shifted between growth stages. The separate analysis for each rice growing stage can be a helpful way to identify the factors of CH4 flux in rice paddies. We highlight daily GEP was a good predictor of daily CH4 flux in rice paddies.
Author Contributions
Conceptualization, H.L., C.P. and H.G.; methodology, H.L., M.Z. and C.P.; software, H.L.; validation, Q.W., H.G. and B.Z.; investigation, M.Z.; resources, M.Z.; data curation, H.L.; writing—original draft preparation, H.L.; writing—review and editing, H.L., M.Z., C.P., H.G., Q.W., and B.Z.; visualization, C.P.; supervision, C.P. and B.Z.; project administration, H.L., M.Z. and B.Z.; funding acquisition, H.L., M.Z., Q.W. and B.Z. All authors have read and agreed to the published version of the manuscript.
Funding
This research was funded by the National Natural Science Foundation of China (Grant No. 32101337), the Fundamental Research Funds for the Central Universities (No. 2021CDJQY-023), the Science and Technology Commission of Shanghai Municipality (17DZ1202100 and 20dz1204703).
Informed Consent Statement
Informed consent was obtained from all subjects involved in the study.
Data Availability Statement
All data used in the study are available from the corresponding author by request.
Acknowledgments
Hong Li acknowledges the obtaining postdoctoral fellowship from the University of Quebec at Montreal (UQAM). The authors thank Mengshan Zhang and Shengqi Dai for assistance in the field experiments.
Conflicts of Interest
The authors declare no conflict of interest.
References
- Myhre, G.; Shindell, D.; Bréon, F.M.; Collins, W.; Fuglestvedt, J.; Huang, J. Anthropogenic and Natural Radiative Forcing. Clim. Chang. 2013, 423, 658–740. [Google Scholar]
- Saunois, M.; Stavert, A.R.; Poulter, B.; Bousquet, P.; Canadell, J.G.; Jackson, R.B.; Raymond, P.A.; Dlugokencky, E.J.; Houweling, S.; Patra, P.K.; et al. The Global Methane Budget: 2000–2017. Under Open Review for Earth System Science Data. Earth Syst. Sci. Data 2019. [Google Scholar] [CrossRef]
- IPCC Climate Change 2014: Impacts, Adaptation, and Vulnerability Working Group II Contribution to the Fifth Assessment Report; Cambridge University Press: Cambridge, UK, 2014.
- Aulakh, M.S.; Wassmann, R.; Rennenberg, H. Methane emissions from rice fields—Quantification, mechanisms, role of management, and mitigation options. In Advances in Agronomy; Academic Press: Cambridge, MA, USA, 2001; Volume 70, pp. 193–260. [Google Scholar]
- Chen, H.; Zhu, Q.; Peng, C.; Wu, N.; Wang, Y.; Fang, X.; Jiang, H.; Xiang, W.; Chang, J.; Deng, X.; et al. Methane Emissions from Rice Paddies Natural Wetlands, Lakes in China: Synthesis New Estimate. Glob. Chang. Biol. 2013, 19, 19–32. [Google Scholar] [CrossRef]
- Baldocchi, D.D. Assessing the Eddy Covariance Technique for Evaluating Carbon Dioxide Exchange Rates of Ecosystems: Past, Present and Future. Glob. Chang. Biol. 2003, 9, 479–492. [Google Scholar] [CrossRef] [Green Version]
- Meijide, A.; Manca, G.; Goded, I.; Magliulo, V.; di Tommasi, P.; Seufert, G.; Cescatti, A. Seasonal Trends and Environmental Controls of Methane Emissions in a Rice Paddy Field in Northern Italy. Biogeosciences 2011, 8, 3809–3821. [Google Scholar] [CrossRef] [Green Version]
- Baldocchi, D.D. How Eddy Covariance Flux Measurements Have Contributed to Our Understanding of Global Change Biology. Glob. Chang. Biol. 2020, 26, 242–260. [Google Scholar] [CrossRef] [PubMed]
- Dai, S.; Ju, W.; Zhang, Y.; He, Q.; Song, L.; Li, J. Variations and Drivers of Methane Fluxes from a Rice-Wheat Rotation Agroecosystem in Eastern China at Seasonal and Diurnal Scales. Sci. Total Environ. 2019, 690, 973–990. [Google Scholar] [CrossRef]
- Ge, H.-X.; Zhang, H.-S.; Zhang, H.; Cai, X.-H.; Song, Y.; Kang, L. The Characteristics of Methane Flux from an Irrigated Rice Farm in East China Measured Using the Eddy Covariance Method. Agric. For. Meteorol. 2018, 249, 228–238. [Google Scholar] [CrossRef]
- Knox, S.H.; Jackson, R.B.; Poulter, B.; McNicol, G.; Fluet-Chouinard, E.; Zhang, Z.; Hugelius, G.; Bousquet, P.; Canadell, J.G.; Saunois, M.; et al. FLUXNET-CH4 Synthesis Activity: Objectives, Observations, and Future Directions. Bull. Am. Meteor. Soc. 2019, 100, 2607–2632. [Google Scholar]
- Hatala, J.A.; Detto, M.; Baldocchi, D.D. Gross Ecosystem Photosynthesis Causes a Diurnal Pattern in Methane Emission from Rice. Geophys. Res. Lett. 2012, 39, L06409. [Google Scholar] [CrossRef] [Green Version]
- McNicol, G.; Knox, S.H.; Guilderson, T.P.; Baldocchi, D.D.; Silver, W.L. Where Old Meets New: An Ecosystem Study of Methanogenesis in a Reflooded Agricultural Peatland. Glob. Chang. Biol. 2020, 26, 772–785. [Google Scholar] [PubMed]
- Chu, H.; Chen, J.; Gottgens, J.F.; Ouyang, Z.; John, R.; Czajkowski, K.; Becker, R. Net Ecosystem Methane and Carbon Dioxide Exchanges in a Lake Erie Coastal Marsh and a Nearby Cropland. J. Geophys. Res. Biogeosci. 2014, 119, 722–740. [Google Scholar] [CrossRef]
- Knox, S.H.; Matthes, J.H.; Sturtevant, C.; Oikawa, P.Y.; Verfaillie, J.; Baldocchi, D. Biophysical Controls on Interannual Variability in Ecosystem-Scale CO2 and CH4 Exchange in a California Rice Paddy. J. Geophys. Res. Biogeosci. 2016, 121, 978–1001. [Google Scholar] [CrossRef]
- Li, H.; Guo, H.-Q.; Helbig, M.; Dai, S.-Q.; Zhang, M.-S.; Zhao, M.; Peng, C.-H.; Xiao, X.-M.; Zhao, B. Does Direct-Seeded Rice Decrease Ecosystem-Scale Methane Emissions?—A Case Study from a Rice Paddy in Southeast China. Agric. For. Meteorol. 2019, 272–273, 118–127. [Google Scholar]
- Chauhan, B.S.; Jabran, K.; Mahajan, G. (Eds.) Rice Production Worldwide; Springer International Publishing: Cham, Switzerland, 2017; ISBN 978-3-319-47514-1. [Google Scholar]
- Li, C.; Qiu, J.; Frolking, S.; Xiao, X.; Salas, W.; Moore, B.; Boles, S.; Huang, Y.; Sass, R. Reduced Methane Emissions from Large-Scale Changes in Water Management of China’s Rice Paddies during 1980–2000. Geophys. Res. Lett. 2002, 29, 1972. [Google Scholar] [CrossRef] [Green Version]
- Liu, S.; Zhang, Y.; Lin, F.; Zhang, L.; Zou, J. Methane and Nitrous Oxide Emissions from Direct-Seeded and Seedling-Transplanted Rice Paddies in Southeast China. Plant Soil 2014, 374, 285–297. [Google Scholar] [CrossRef]
- Yadav, S.; Gill, G.; Humphreys, E.; Kukal, S.S.; Walia, U.S. Effect of Water Management on Dry Seeded and Puddled Transplanted Rice. Part 1: Crop Performance. Field Crop. Res. 2011, 120, 112–122. [Google Scholar] [CrossRef]
- Caine, R.S.; Yin, X.; Sloan, J.; Harrison, E.L.; Mohammed, U.; Fulton, T.; Biswal, A.K.; Dionora, J.; Chater, C.C.; Coe, R.A.; et al. Rice with Reduced Stomatal Density Conserves Water and Has Improved Drought Tolerance under Future Climate Conditions. New Phytol. 2019, 221, 371–384. [Google Scholar] [CrossRef]
- Damour, G.; Simonneau, T.; Cochard, H.; Urban, L. An Overview of Models of Stomatal Conductance at the Leaf Level. Plant Cell Environ. 2010, 33, 1419–1438. [Google Scholar] [CrossRef]
- Kumar, A.; Nayak, A.K.; Mohanty, S.; Das, B.S. Greenhouse Gas Emission from Direct Seeded Paddy Fields under Different Soil Water Potentials in Eastern India. Agric. Ecosyst. Environ. 2016, 228, 111–123. [Google Scholar] [CrossRef]
- Li, H.; Dai, S.; Ouyang, Z.; Xie, X.; Guo, H.; Gu, C.; Xiao, X.; Ge, Z.; Peng, C.; Zhao, B. Multi-Scale Temporal Variation of Methane Flux and Its Controls in a Subtropical Tidal Salt Marsh in Eastern China. Biogeochemistry 2018, 137, 163–179. [Google Scholar] [CrossRef]
- Vickers, D.; Mahrt, L. Quality Control and Flux Sampling Problems for Tower and Aircraft Data. J. Atmos. Ocean. Technol. 1997, 14, 512–526. [Google Scholar] [CrossRef]
- Wilczak, J.M.; Oncley, S.P.; Stage, S.A. Sonic Anemometer Tilt Correction Algorithms. Bound.-Layer Meteorol. 2001, 99, 127–150. [Google Scholar] [CrossRef]
- Webb, E.K.; Pearman, G.I.; Leuning, R. Correction of Flux Measurements for Density Effects Due to Heat and Water Vapour Transfer. Q. J. R. Meteorol. Soc. 1980, 106, 85–100. [Google Scholar] [CrossRef]
- Finkelstein, P.L.; Sims, P.F. Sampling Error in Eddy Correlation Flux Measurements. J. Geophys. Res.-Atmos. 2001, 106, 3503–3509. [Google Scholar] [CrossRef]
- Reichstein, M.; Falge, E.; Baldocchi, D.; Papale, D.; Aubinet, M.; Berbigier, P.; Bernhofer, C.; Buchmann, N.; Gilmanov, T.; Granier, A.; et al. On the Separation of Net Ecosystem Exchange into Assimilation and Ecosystem Respiration: Review and Improved Algorithm. Glob. Chang. Biol. 2005, 11, 1424–1439. [Google Scholar] [CrossRef]
- Foken, T.; Gockede, M.; Mauder, M.; Mahrt, L.; Amiro, B.; Munger, W. Post-field data quality control. In Handbook of Micrometeorology: A Guide for Surface Flux Measurement and Aanlysis; Springer: Berlin/Heidelberg, Germany, 2004; Volume 29, pp. 181–208. ISBN 1383-8601. [Google Scholar]
- Kim, Y.; Johnson, M.S.; Knox, S.H.; Black, T.A.; Dalmagro, H.J.; Kang, M.; Kim, J.; Baldocchi, D. Gap-Filling Approaches for Eddy Covariance Methane Fluxes: A Comparison of Three Machine Learning Algorithms and a Traditional Method with Principal Component Analysis. Glob. Chang. Biol. 2020, 26, 1499–1518. [Google Scholar] [CrossRef]
- Aurela, M.; Laurila, T.; Tuovinen, J. Annual CO2 Balance of a Subarctic Fen in Northern Europe: Importance of the Wintertime Efflux. J. Geophys. Res. Atmos. 2002, 10, 1–12. [Google Scholar] [CrossRef]
- Zhang, A.; Bian, R.; Pan, G.; Cui, L.; Hussain, Q.; Li, L.; Zheng, J.; Zheng, J.; Zhang, X.; Han, X.; et al. Effects of Biochar Amendment on Soil Quality, Crop Yield and Greenhouse Gas Emission in a Chinese Rice Paddy: A Field Study of 2 Consecutive Rice Growing Cycles. Field Crop. Res. 2012, 127, 153–160. [Google Scholar] [CrossRef]
- Chanton, J.P.; Whiting, G.J.; Blair, N.E.; Lindau, C.W.; Bollich, P.K. Methane Emission from Rice: Stable Isotopes, Diurnal Variations, and CO2 Exchange. Glob. Biogeochem. Cycles 1997, 11, 15–27. [Google Scholar] [CrossRef]
- Huang, Y.; Sass, R.; Fisher, F. Methane Emission from Texas Rice Paddy Soils. 2. Seasonal Contribution of Rice Biomass Production to CH4 Emission. Glob. Chang. Biol. 1997, 3, 491–500. [Google Scholar] [CrossRef]
- Chanton, J.P. The Effect of Gas Transport on the Isotope Signature of Methane in Wetlands. Org. Geochem. 2005, 36, 753–768. [Google Scholar] [CrossRef]
- Holzapfel-Pschorn, A.; Conrad, R.; Seiler, W. Effects of Vegetation on the Emission of Methane from Submerged Paddy Soil. Plant Soil 1986, 92, 223–233. [Google Scholar] [CrossRef]
- Kim, J.; Verma, S.B.; Billesbach, D.P.; Clement, R.J. Diel Variation in Methane Emission from a Midlatitude Prairie Wetland: Significance of Convective Throughflow in Phragmites Australis. J. Geophys. Res. Atmos. 1998, 103, 28029–28039. [Google Scholar] [CrossRef]
- Alberto, M.C.R.; Wassmann, R.; Buresh, R.J.; Quilty, J.R.; Correa, T.Q., Jr.; Sandro, J.M.; Centeno, C.A.R. Measuring Methane Flux from Irrigated Rice Fields by Eddy Covariance Method Using Open-Path Gas Analyzer. Field Crop. Res. 2014, 160, 12–21. [Google Scholar] [CrossRef]
- Centeno, C.A.R.; Alberto, M.C.R.; Wassmann, R.; Sander, B.O. Assessing Diel Variation of CH4 Flux from Rice Paddies through Temperature Patterns. Atmos. Environ. 2017, 167, 23–39. [Google Scholar] [CrossRef]
- Swain, C.K.; Bhattacharyya, P.; Nayak, A.K.; Singh, N.R.; Neogi, S.; Chatterjee, D.; Pathak, H. Dynamics of Net Ecosystem Methane Exchanges on Temporal Scale in Tropical Lowland Rice. Atmos. Environ. 2018, 191, 291–301. [Google Scholar] [CrossRef]
- Knox, S.H.; Sturtevant, C.; Matthes, J.H.; Koteen, L.; Verfaillie, J.; Baldocchi, D. Agricultural Peatland Restoration: Effects of Land-Use Change on Greenhouse Gas (CO2 and CH4) Fluxes in the Sacramento-San Joaquin Delta. Glob. Chang. Biol. 2015, 21, 750–765. [Google Scholar] [CrossRef]
- Hemes, K.S.; Chamberlain, S.D.; Eichelmann, E.; Knox, S.H.; Baldocchi, D.D. A Biogeochemical Compromise: The High Methane Cost of Sequestering Carbon in Restored Wetlands. Geophys. Res. Lett. 2018, 45, 6081–6091. [Google Scholar] [CrossRef]
- van der Gon, H.; Kropff, M.J.; van Breemen, N.; Wassmann, R.; Lantin, R.S.; Aduna, E.; Corton, T.M.; van Laar, H.H. Optimizing Grain Yields Reduces CH4 Emissions from Rice Paddy Fields. Proc. Natl. Acad. Sci. USA 2002, 99, 12021–12024. [Google Scholar] [CrossRef] [Green Version]
Figure 1.
Location and the satellite image from Google Earth taken on 1st October 2018 of the study area (a), and the photos of wheat season and rice season, respectively (b).
Figure 1.
Location and the satellite image from Google Earth taken on 1st October 2018 of the study area (a), and the photos of wheat season and rice season, respectively (b).

Figure 2.
Time series of daily (green lines) and half-hourly (black circles) CH4 fluxes during the rice growing season in 2016–2018.
Figure 2.
Time series of daily (green lines) and half-hourly (black circles) CH4 fluxes during the rice growing season in 2016–2018.

Figure 3.
Time series of daily averaged air temperature (yellow lines), 5cm soil temperature (dark yellow lines), photosynthetically active radiation (PAR), volumetric water content (VWC, navy blue lines), rainfall (blue columns), and gross ecosystem productivity (GEP, green forks).
Figure 3.
Time series of daily averaged air temperature (yellow lines), 5cm soil temperature (dark yellow lines), photosynthetically active radiation (PAR), volumetric water content (VWC, navy blue lines), rainfall (blue columns), and gross ecosystem productivity (GEP, green forks).

Figure 4.
Linear and exponential regression models of daily CH4 fluxes against GEP for the periods before (yellow points) and after (green points) the mid-season drainage, respectively. The grey circles (a–c) represent CH4 fluxes during mid-season drainage each year.
Figure 4.
Linear and exponential regression models of daily CH4 fluxes against GEP for the periods before (yellow points) and after (green points) the mid-season drainage, respectively. The grey circles (a–c) represent CH4 fluxes during mid-season drainage each year.

Figure 5.
The relationship between daily CH4 fluxes and volumetric water content (VWC, (a–e)) in 2016 (green), 2017 (blue) and 2018 (purple), water table depth (WTD, (f–j)) in 2018 (purple) over the whole rice season (a,f), during the vegetative stage (b,g), during the mid-season drainage periods (c,h), during the reproductive stage (d,i), during the ripening stage (e,j). Daily CH4 fluxes and VWC showed a significant negative correlation only during the vegetative stage (b). Daily CH4 fluxes and WTD showed a significant positive correlation for the whole season (f) and during the ripening stage when WTD was very low (j).


Table 1.
Planting and harvest date in the rice-wheat rotation agroecosystem.
| Year | 2015–2016 | 2016–2017 | 2017–2018 | |||
|---|---|---|---|---|---|---|
| Season | Wheat | Rice | Wheat | Rice | Wheat | Rice |
| Plant date | 28 October | 11 June | 18 December | 7 June | 26 October | 6 June |
| Harvest date | 30 May | 11 November | 26 May | 24 October | 28 May | 15 November |
Table 2.
The results of Partial F test for daily CH4 fluxes and other variables before and after the mid-season drainage. Signifiant codes: 0 ‘***’ 0.001 ‘**’ 0.01 ‘*’ 0.05 ‘.’ 0.1 ‘ ’ 1.
Table 2.
The results of Partial F test for daily CH4 fluxes and other variables before and after the mid-season drainage. Signifiant codes: 0 ‘***’ 0.001 ‘**’ 0.01 ‘*’ 0.05 ‘.’ 0.1 ‘ ’ 1.
| Year | Period | GEP | Tg | Pa | u* | VWC | WTD | Cond |
|---|---|---|---|---|---|---|---|---|
| 2016 | Before MSD | 66.87 *** | 3.91 | 3.55 | 8.99 * | 0.11 | ||
| 2017 | 18.36 ** | 24.64 ** | 0.01 | 0.54 | 0.15 | |||
| 2018 | 22.94 *** | 8.47 * | 9.15 | 0.60 | 2.56 | 4.10 | ||
| 2016 | After MSD | 171.29 *** | 18.14 *** | 5.22 * | 4.64 * | 2.15 | ||
| 2017 | 157.40 *** | 15.88 ** | 2.54 | 0.43 | 5.94 * | |||
| 2018 | 86.74 *** | 1.61 | 2.07 | 2.35 | 0.18 | 0.05 |
Table 3.
Statistical tests (Coefficient of Determination (R2) and Akaike Information Criterion (AIC)) for the biophysical drivers in the models of daily CH4 fluxes in 2016–2018, including stepwise multivariate linear and hierarchical Neural Network Models. Daily CH4 fluxes were log transformed before being fit with linear models. The results were only presented when the addition of the variable improved the R2 of the model and was justified by a reduction in the AIC of the model. FCH4 is the daily CH4 flux, Tg, Tw, GEP, VWC, u*, Pa, and spcond are abbreviated soil temperature, water temperature, gross ecosystem photosynthesis, volumetric water content, friction velocity, ambient pressure, and conductivity, respectively.
| Before Mid-Season Drainage | After Mid-Season Drainage | |||||
|---|---|---|---|---|---|---|
| Year | Variable | R2 | AIC | Variable | R2 | AIC |
| 2016 | GEP | 0.83 | −49.76 | GEP | 0.79 | −25.96 |
| GEP + Tg | 0.87 | −50.81 | GEP + Tg | 0.84 | −32.07 | |
| GEP + Tg + u* | 0.92 | −54.95 | GEP + Tg + Pa | 0.88 | −36.96 | |
| GEP + Tg + u* + Pa | 0.98 | −68.16 | GEP + Tg+ Pa + u* | 0.89 | −38.74 | |
| GEP + Tg+ Pa + VPD | 0.89 | −38.75 | ||||
| 2017 | GEP | 0.60 | −27.51 | GEP | 0.71 | −42.84 |
| GEP + Tg | 0.91 | −43 | GEP + Tg | 0.73 | −44.97 | |
| GEP + Tg + VWC | 0.85 | −65.39 | ||||
| 2018 | GEP | 0.52 | −44.95 | GEP | 0.71 | 9.39 |
| GEP + Tg | 0.63 | −47.05 | GEP + Tw | 0.76 | −3.18 | |
| GEP + Tg + spcond | 0.68 | −47.18 | GEP + Tw + spcond | 0.77 | −5.44 | |
| GEP + Tg + spcond + WTD | 0.73 | −47.7 | GEP + Tw + spcond + WTD | 0.78 | −4.53 | |
| GEP + Tg + spcond + WTD + Pa | 0.91 | −55.82 | GEP + Tw + spcond + WTD + Pa | 0.80 | −10.45 | |
Table 4.
Annual sums of net CO2 fluxes, GEP, CH4 fluxes, total ecosystem carbon (C) and greenhouse gas (GHG) budgets in wheat and rice season were estimated. The total C and GHG budget for one year were also calculated.
Table 4.
Annual sums of net CO2 fluxes, GEP, CH4 fluxes, total ecosystem carbon (C) and greenhouse gas (GHG) budgets in wheat and rice season were estimated. The total C and GHG budget for one year were also calculated.
| Season | NEE | GEP | CH4 | C Budget | GHG Budget | ||
|---|---|---|---|---|---|---|---|
| g C m−2 | g C m−2 | g C m−2 | g CO2eq m−2 | g C m−2 | g CO2eq m−2 | ||
| 2016 | wheat | −186.44 | 972.03 | 2.03 | 75.91 | −184.41 | −607.71 |
| rice | −558.64 | 1786.52 | 44.56 | 1663.74 | −514.08 | −384.60 | |
| year | −689.13 | 2743.44 | 48.86 | 1824.00 | −640.27 | −702.81 | |
| 2017 | wheat | −158.15 | 857.22 | 1.98 | 74.03 | −156.17 | −505.84 |
| rice | −354.46 | 1573.59 | 43.26 | 1615.06 | −311.20 | 315.37 | |
| year | −407.31 | 2535.42 | 46.23 | 1726.03 | −361.08 | 232.54 | |
| 2018 | wheat | −168.54 | 1195.16 | 2.22 | 83.13 | −166.32 | −534.84 |
| rice | −228.97 | 1474.50 | 42.66 | 1592.73 | −186.31 | 753.17 | |
| year | −425.98 | 2675.04 | 44.95 | 1678.14 | −381.03 | 116.21 | |
Publisher’s Note: MDPI stays neutral with regard to jurisdictional claims in published maps and institutional affiliations. |
© 2021 by the authors. Licensee MDPI, Basel, Switzerland. This article is an open access article distributed under the terms and conditions of the Creative Commons Attribution (CC BY) license (https://creativecommons.org/licenses/by/4.0/).
Share and Cite
MDPI and ACS Style
Li, H.; Zhao, M.; Peng, C.; Guo, H.; Wang, Q.; Zhao, B. Gross Ecosystem Productivity Dominates the Control of Ecosystem Methane Flux in Rice Paddies. Land 2021, 10, 1186. https://0-doi-org.brum.beds.ac.uk/10.3390/land10111186
AMA Style
Li H, Zhao M, Peng C, Guo H, Wang Q, Zhao B. Gross Ecosystem Productivity Dominates the Control of Ecosystem Methane Flux in Rice Paddies. Land. 2021; 10(11):1186. https://0-doi-org.brum.beds.ac.uk/10.3390/land10111186
Chicago/Turabian StyleLi, Hong, Min Zhao, Changhui Peng, Haiqiang Guo, Qing Wang, and Bin Zhao. 2021. "Gross Ecosystem Productivity Dominates the Control of Ecosystem Methane Flux in Rice Paddies" Land 10, no. 11: 1186. https://0-doi-org.brum.beds.ac.uk/10.3390/land10111186
Note that from the first issue of 2016, this journal uses article numbers instead of page numbers. See further details here.