
Identifying Key Sites of Green Infrastructure to Support Ecological Restoration in the Urban Agglomeration


1
Department of Landscape Architecture, Nanjing Agricultural University, Nanjing 210095, China
2
College of Humanities and Social Development, Nanjing Agricultural University, Nanjing 210095, China
*
Author to whom correspondence should be addressed.
Land 2021, 10(11), 1196; https://0-doi-org.brum.beds.ac.uk/10.3390/land10111196
Submission received: 10 October 2021
/
Revised: 3 November 2021
/
Accepted: 4 November 2021
/
Published: 5 November 2021
(This article belongs to the Special Issue Anthropic Infrastructures in the Landscape: Ecological Effects on Terrestrial Ecosystems)
Abstract
:The loss and fragmentation of natural space has placed tremendous pressure on green infrastructure (GI), especially in urban agglomeration areas. It is of great importance to identify key sites of GI, which are used to economically and efficiently restore urban ecological network. However, in the existing research, few scholars have explored the identification and application of GI key sites. Taking the Southern Jiangsu Urban Agglomeration as an example, based on the ecosystem service assessment and landscape connectivity analysis, we identified the multi-class key sites of GI in the study area by MSPA, InVEST model, MCR model, and Linkage mapper. The results showed that: (1) a total of 60 GI sources and 130 GI corridors were extracted. The ecological resources of the study area were densely distributed in the north and south and sparsely in the middle. (2) Three-hundred eighty GI key sites were identified, including 53 water ecological points, 251 ecological fracture points, and 76 ecological pinch points. The GI key sites we identified were large in number and widely distributed, yet were hardly included in the existing ecological protection policies. These key sites should be prioritized in GI planning and differentiated for management strategies, ensuring that limited land resources and public funds can be directed to where restoration is really needed. The present study provides land managers and urban planners with additional tools to better understand how to effectively restore and develop the ecosystems of urban agglomerations in the context of scarce land resources.
1. Introduction
Green infrastructure (GI) can be interpreted as a strategically planned network of natural and near-natural areas with other environmental features designed and it can contribute to ecosystem resilience and human benefits through ecosystem services [1,2,3]. However, starting from the 1980s, the neoliberal-oriented urban renewal policies have changed the process of urban development in Western countries [4]. The privatization of public space has gradually transformed GI that was once open to the public into controlled spaces to attract businesses and investors [5,6]. At the same time, China has also begun to use urban natural space to capture land appreciation gains [7].
The loss of ecological space in recent years not only places tremendous pressure on urban GI, but also leads to series of environmental risks [8,9,10]. Especially in rapidly urbanizing areas, urban GI is facing habitat fragmentation, water pollution, and biodiversity loss [11]. The pandemic outbreak of 2020 highlights the necessity to deal with the dark side of the global city and the necessity to guarantee open and healthy GI [12,13,14]. Therefore, how to construct and optimize regional GI economically and effectively is crucial for the sustainable development of urban ecosystems under the background of land scarcity [15,16,17].
Due to its holistic approach, GI planning has become one of the important national strategies for coordinating ecosystem protection and economic development, and it is widely implemented in urban agglomerations around the world [18,19,20]. In practice, however, natural space and land resources are extremely limited in mega-cities [21]. Since degraded ecosystems are numerous, it is unrealistic to optimize and re-plan GI by increasing sources and constructing corridors [22]. Therefore, as an effective method to reduce land costs [23], the identification of GI key sites should be applied to urban ecological network planning as soon as possible to achieve an orderly and efficient ecological improvement process [24,25].
Key sites are generally defined as the small natural vegetation areas in GI that can make a contribution to habitat connectivity and availability by acting as a key part of a corridor or as a stepping stone between other, eventually larger, habitat patches [26,27]. Referring to the existing research and relevant literature of GI, however, experts have usually focused on source determination and corridor construction [28,29,30]. The mainstream framework of “source extraction—resistance surface setting—corridor construction” was formed to try to realize smooth flow of the ecological process [31,32]. In contrast, research on identification and mapping of GI key sites is lacking. In many cases, key sites were still regarded as attached components of GI [33]. Actually, the determination of GI key sites plays an important role in the realistic projects of urban planning, as they reveal important areas that influence the success and benefits of restoration actions [34].
In the existing studies, the identification methods of GI key sites mainly include the following four aspects: (1) identifying the stepping stones of GI [35]; (2) calculating and choosing patches with better intermediation based on Betweenness Centrality (measure to what extent a node contributes to paths between all other nodes) [36,37]; (3) determining the intersection of corridors with key habitat patches, other corridors, and infrastructure networks [38]; (4) recognizing ecological pinch points based on the circuit theory [39,40]. Nevertheless, almost all studies have determined key sites by a single method and have neglected composite identification of multiple types of key sites, especially in urban agglomeration with fragmented ecological patterns [41]. Many studies have targeted ecologically degraded areas in forests, oceans, riparian buffers, and wetlands, while few have selected built-up areas [42,43]. In addition, little research has explored the impact of spatial extent changes on the identification of key sites [44,45]. In practice, based on the identification results, corresponding restoration and protection strategies of key sites have rarely been proposed in conjunction with current spatial planning [46,47].
Here, this study focused on the identification of GI key sites with the framework of constructing the regional GI to provide a cost-effective restoration and development method for an ecological network in urban agglomeration. The overall goals are: (1) to extract GI sources using ecosystem service evaluation, landscape connectivity analysis, and MSPA; (2) to construct GI corridors based on the MCR model; and (3) to identify multiple types of GI key sites to support ecological conservation and restoration in urban agglomeration.
2. Materials and Methods
2.1. Study Area
Five cities (coordinates: 118.905469° E, 32.096836° N–118.912763° E, 32.100553° N) in southern Jiangsu Province were studied including Nanjing, Suzhou, Wuxi, Changzhou, and Zhenjiang, with a total spatial area of 27,872 km2, accounting for 26.2% of the total land of Jiangsu Province (Figure 1). As a rapidly urbanizing region close to Shanghai, the metropolis of China, these five cities are closely linked in terms of population, economic activities, ecological integrity, and transportation infrastructure, forming a huge co-urbanized region, the Southern Jiangsu Urban Agglomeration.
Since the 20th century, with the influx of population and increasing urbanization, the urban productivity and quality of life in the Southern Jiangsu Urban Agglomeration has been on the rise. However, the situation of important ecological space across municipalities, such as Taihu Lake and the Tianmu Mountains, continues to decline, seriously threatening the ecosystem of the Southern Jiangsu Urban Agglomeration. The seemingly vast land is actually facing the plight that per capita resources (freshwater, forests, etc.) are extremely in shortage [48].
As an important part of the Yangtze River Delta metropolitan area, the Southern Jiangsu Urban Agglomeration, like other mega-cities around the world, is facing the ecological risks brought by rapid urbanization [49]. It is important to explore the utilization of natural resources and the layout of GI key sites within this urban agglomeration, so as to alleviate the contradictions existing between the urban development and ecological conservation, and to seek the solution of environmental resource management and environmental problems in the co-urbanized regions of developing countries.
2.2. Data Sources and Processing
The data collected for this study contained images and text materials including geographic information, ecological and environmental data, and socio-economic data (Table 1). The data relating to land utilization, based on the purpose of the study, were reclassified by GIS into nine types including paddy field, dry land, forest land, grassland, river and canal, lake and pond, wetland, buildable land, and unused land (Figure 1). The areas of lake and pond in the study area were larger than those of river and canal, so they were analyzed separately as two types considering the difference between their ecosystems and ecological space. All the raw image data were processed with the ArcGIS 10.2 platform for projection correction and boundary cropping.
2.3. Methods
2.3.1. GI Sources Extraction
GI sources can provide diverse and high-quality ecosystem services to cities and residents. In this study, with reference to the existing source extraction methods [50,51], the recognition of the source was carried out from the perspectives of ecosystem service and landscape connectivity [52,53].
Faced with the ecological issues of the study area, three typical ecosystem services were selected for the evaluation, including water conservation, soil conservation, and biodiversity conservation. The mapping of the spatial distribution of the ecosystem service evaluation was formed by the weighted overlay method and was divided into five levels from very important to unimportant by the natural breakpoint method. After that, a binary raster graphic was created with the very important patches of ecosystem service as the foreground and the rest of the space as a background. The spatial distribution of seven landscape types, including core, bridge, loop, branch, edge, perforation, and islet, was acquired through MSPA (Morphological spatial pattern analysis, which can be used to measure, identify, and disaggregate the spatial pattern of raster images) [54], from which the core areas were selected. Then, three indexes, namely the landscape coincidence probability (LCP), integral index of connectivity (IIC), and probability connectivity (PC), were introduced to calculate the importance value of each core area in the overall landscape [55]. Next, considering previous research, setting 1000 m for the migration threshold, 0.5 for PC, and the core areas with dPC > 0.0016 were determined as the GI sources [56]. The landscape connectivity indices are calculated as follows:
where is the number of components; is the total area of each component; is the total landscape area; is the total number of patches in the landscape; and are the areas of patch and patch ; is the number of links in the shortest path (topological distance) between patch and patch ; is the maximum potential for the species to spread directly in patch and patch ; is index value when all the initially existing patches are present in the landscape; and is index value after the removal of that single patch from the landscape.
2.3.2. GI Corridors Construction
Based on the habitat quality assessment results of the InVEST model [57], we comprehensively considered the influencing factors of elevation, slope and vegetation cover, and constructed ecological resistance surface [58]. The sensitivity of land use type to habitat threat factors is shown in Table 2, and the formula of the InVEST habitat quality model is as follows:
where is the total threat level; is the number of stress factors; is the total number of grid units of stress factors; is the weight of threat factor ; is the effect of the threat that originates in grid unit ; is the maximum impact distance of threat factor ; is the legal accessibility of grid unit ; is the sensitivity of landscape to threat factor , 0–1; is the habitat quality index of grid in landscape type ; is the habitat suitability score of the landscape ; is the scale constant, which is generally taken as 2.5; is the semi-saturation constant equal to half of the maximum of .
Then, in support of the corrected DMSP/OLS night light data [59], the ecological resistance surface was modified into the integrated resistance surface. The formula is:
where is the ecological resistance coefficient of grid based on night light; is the night light of grid ; is the average night light of the land use type corresponding to grid ; is the basic ecological resistance coefficient of land use type corresponding to grid .
Next, the Linkage Mapper was used to calculate the minimum cumulative consumption path for the spatial location of GI corridors [60].
2.3.3. GI Key Sites Identification
According to the natural resources and urban development characteristics of the Southern Jiangsu Urban Agglomeration, the key sites of GI in the study area were identified relying on the following three methods: (1) using the intersection of GI corridors and strategic rivers to obtain water ecological points; (2) using the intersection of GI corridors and intercity backbone roads to identify ecological fracture points; and (3) based on electric circuit theory [61], with the help of the software Circuitscape 4.0 and the plug-in Linkage Mapper 2.0 to determine simulated current intensity distribution and ecological pinch points. The first two methods extracted special spatial points with reference to the urban agglomeration status, while the latter determined irreplaceable spatial locations in the corridor based on the analysis of ecological flow.
3. Results
3.1. GI Sources
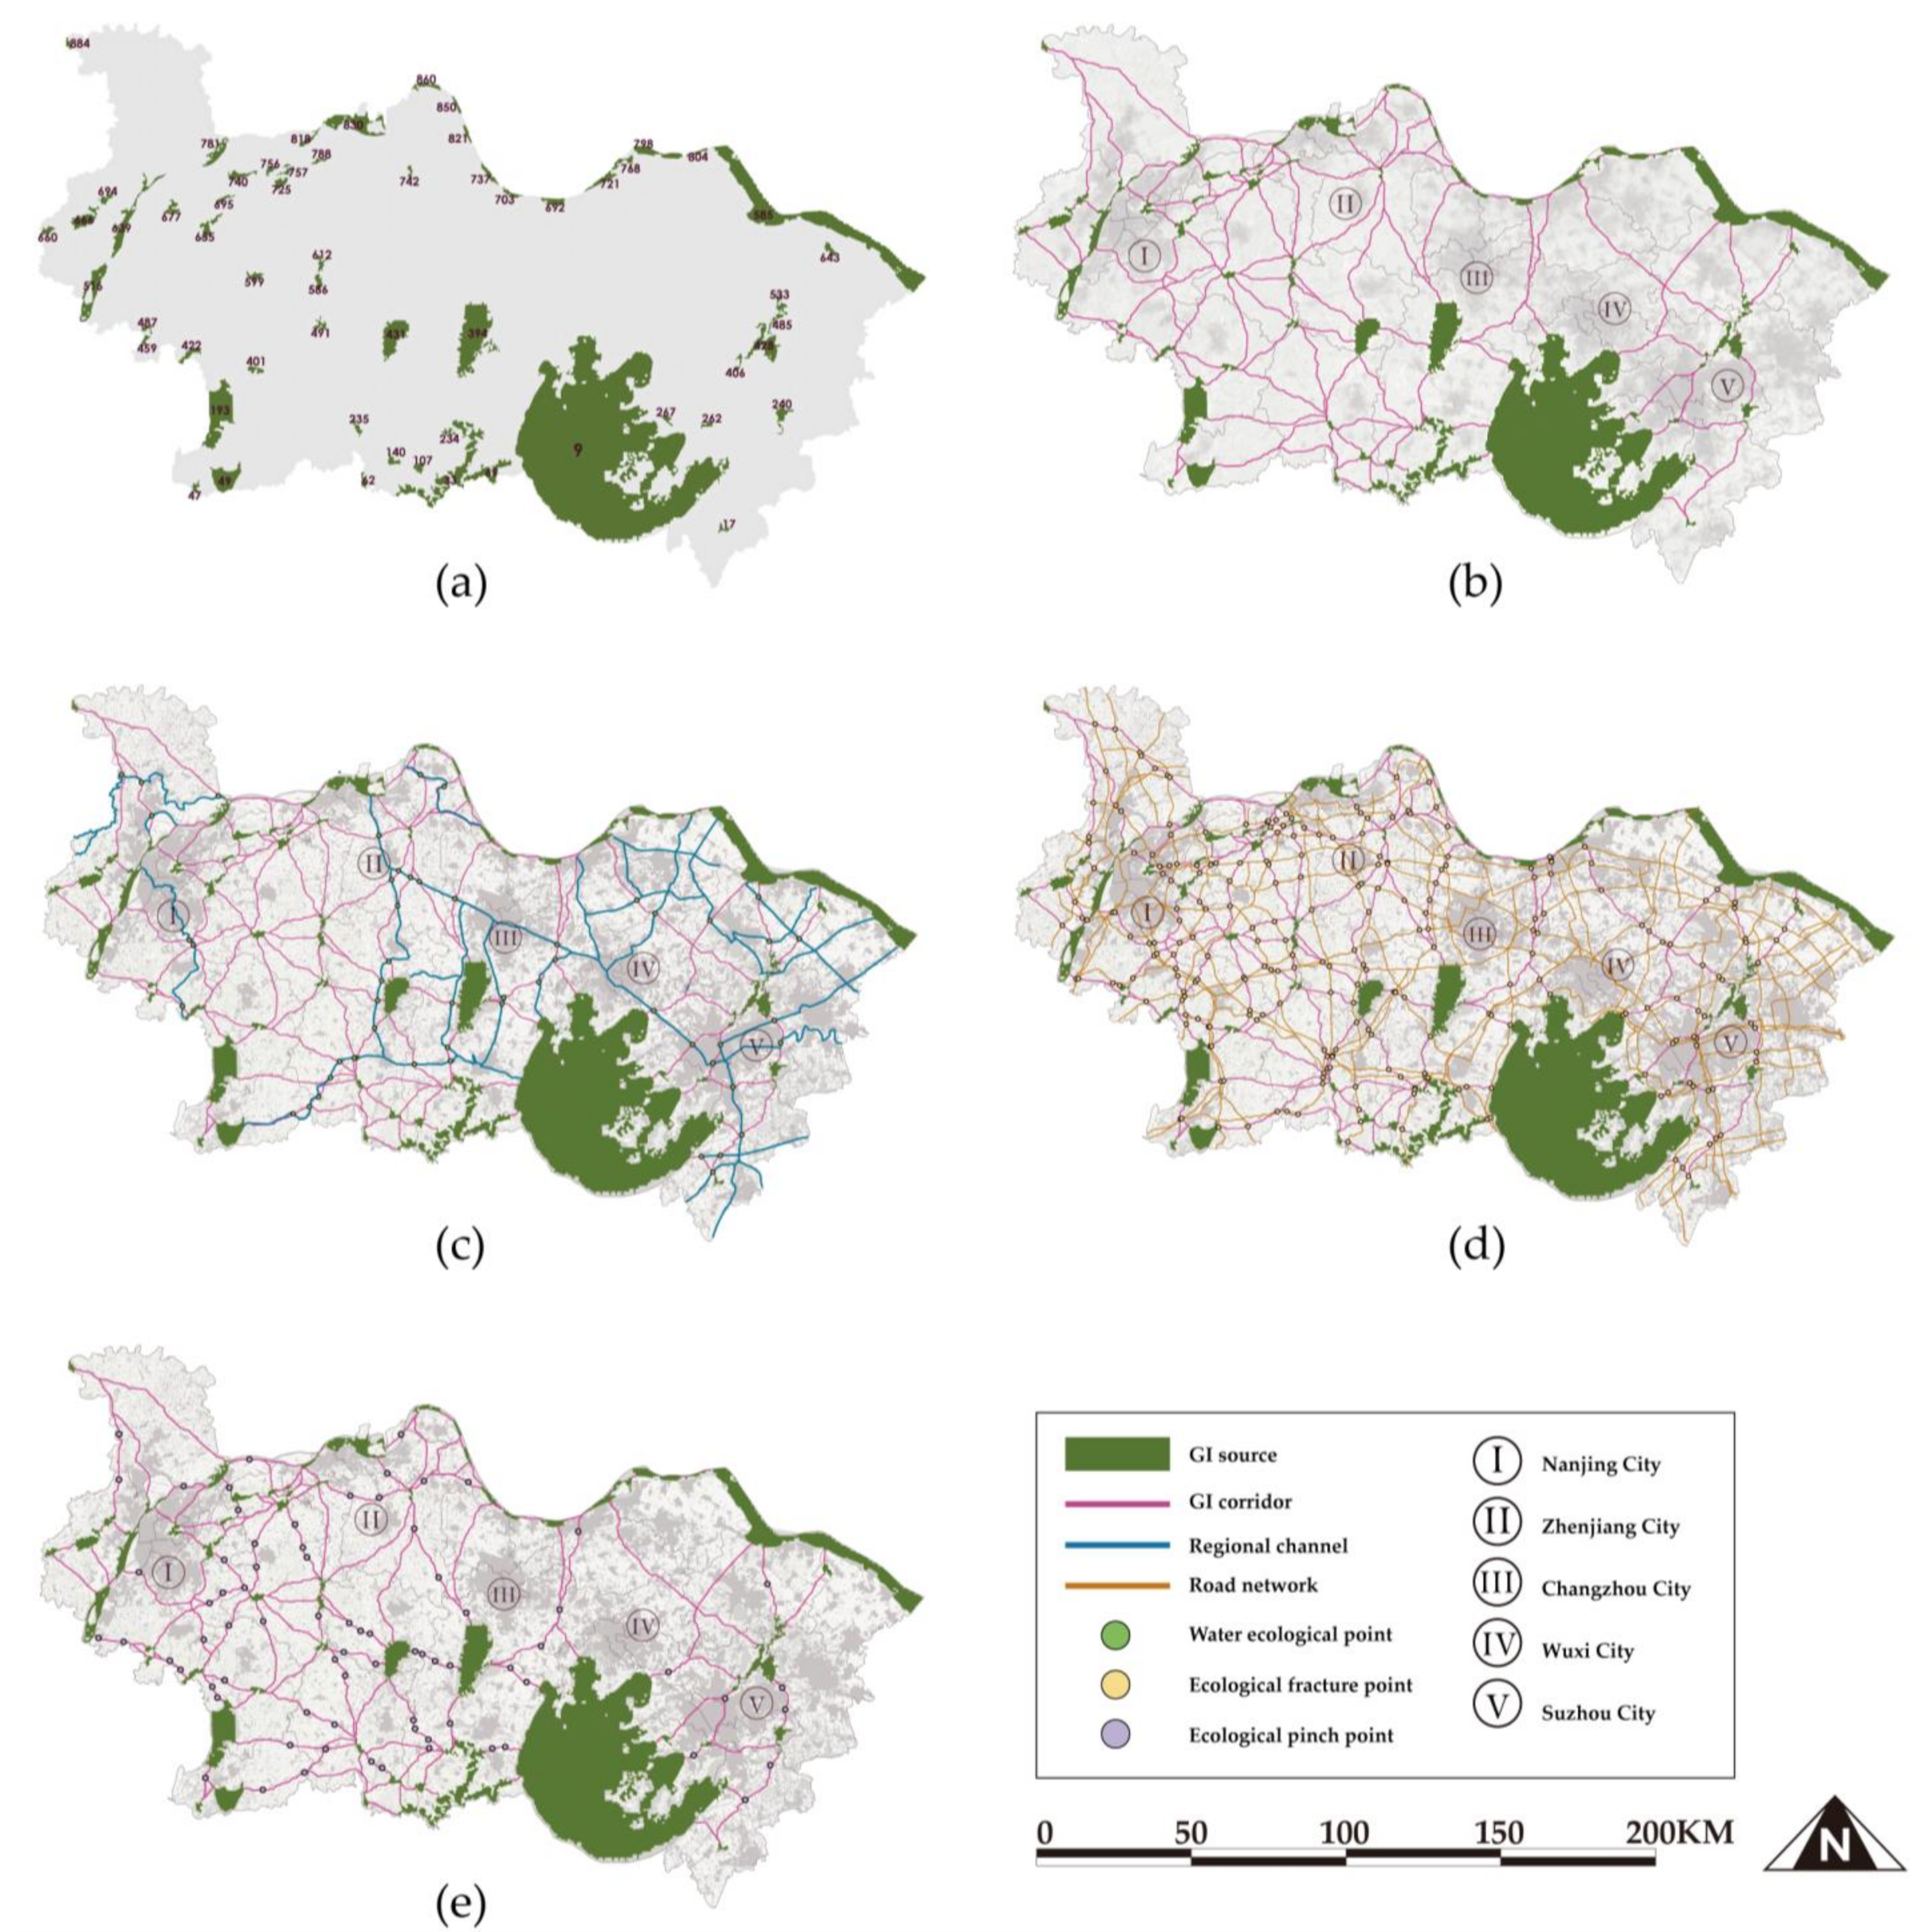
Based on the composite index system, the evaluation of the importance of ecosystem service in the Southern Jiangsu Urban Agglomeration was determined (Figure S1 in the Supplementary Materials). The most important patches for ecosystem services were mainly concentrated in the south part of the study area, the southern Nanjing, and the Yangtze River band area within Nanjing and Zhenjiang, accounting for 22.31% of the total area. The core areas were obtained by extracting ecological patches using MSPA (Figure S2 in the Supplementary Materials). The layout of the core areas was found to be seriously fragmented, only accounting for 48.26% of the whole ecological patches, while 15.91% of these patches were considered islets. These isolated islets caused a decrease in overall ecosystem service of the study area due to the smaller potential for its internal physical-energy exchange with the surrounding landscape matrix. A total of 60 GI sources were extracted from the core areas, covering 3629.33 km2. Most of the GI sources were scattered close to important water bodies (Yangtze River, Taihu Lake) and mountains (Ningzhen mountain), ranging from 2 to 10 km2 (Figure 2).
3.2. GI Corridors
In this study, an integrated resistance surface was constructed by taking comprehensive habitat index evaluation and night light data into account. In terms of spatial distribution, a distinct aggregation of high resistance values was formed mainly in the central study area, the middle part of Nanjing, and the north of Taihu Lake (Figure S3 in the Supplementary Materials). Furthermore, in the city-wide perspective, the resistance value spread from high to low along with the construction land to natural space.
One-hundred thirty GI corridors of the Southern Jiangsu Urban Agglomeration were obtained, with a total length of about 2584.69 km, among which the longest corridor was 74.68 km, while the shortest one was 0.47 km, and the average corridor reached about 19.88 km (Figure 2). Corridors linking various sources formed a network-like structure basically covering the entire study area. Among them, several corridors crossed the urban area where human activities are frequent, such as the corridor between Taihu Lake and Yangcheng Lake, and certain corridors located at the edge of main urban area, such as the corridor linking the Yangtze River and Gehu Lake on the east and west sides of the Changzhou urban area.
3.3. GI Key Sites
A total of 380 key sites were identified in the present study, including water ecological points, ecological fracture points, and ecological pinch points.
3.3.1. Water Ecological Points
Water ecological points were determined based on the intersection between strategic rivers and ecological corridors. In the study, 53 water ecological points were identified (Figure 2), accounting for 14% of the ecological points in the study area, mainly concentrated in the middle section of the study area and the northern and southern areas of Suzhou. Several points were also located in the central and northern areas of Nanjing and the northern part of Wuxi. Compared with the other two cities, Suzhou showed a more ideal point distribution pattern, with better uniformity and coverage. In contrast, water ecological points were not identified in the south of Zhenjiang and the north of Changzhou due to the lack of GI corridors and strategic rivers. Moreover, parts of the water ecological points were located in the suburbs of the built-up area and even within the city, such as the southern suburbs of Nanjing and the main urban area of Suzhou. These areas owned a stable water supply but were also exposed to ecological risks such as water pollution.
3.3.2. Ecological Fracture Points
By identifying the fracture points formed after the potential corridors were intersected by the road network, 251 ecological fracture points were acquired, accounting for 66% of the ecological points in the study area (Figure 2). In general, within the study area, the ecological fracture points showed a dense distribution in the west and were sparse in the east. As for cities, ecological fracture points were mainly concentrated in the central urban area of Nanjing, Zhenjiang, and Suzhou, and their distribution density decreased gradually from built-up area to natural space. A few ecological fracture points were also gathered in the junction of adjacent cities and formed clusters, such as the junction of Zhenjiang and Nanjing, and the junction of Zhenjiang and Changzhou. In addition, in terms of land types, many ecological fracture points were located in areas such as forest land, arable land, lakes, and rivers, which indicated that the construction of transportation infrastructure directly influenced the ecological exchange in multiple types of land patches.
3.3.3. Ecological Pinch Points
Overall, 76 ecological pinch points were identified, accounting for 20% of the ecological points in the study area, which were more densely distributed in the central and western part of the urban agglomeration, and a wide range of Nanjing, Zhenjiang, and Changzhou (Figure 2). Certain pinch points were scattered in Suzhou near Taihu Lake and Wuxi near Gehu Lake, which were mostly located near or between ecological sources with good habitat quality. However, the distribution in northern Wuxi and northern Suzhou was relatively sparse. In addition, most of the ecological pinch points were located on non-construction land after superimposing the land type map onto the distribution map.
4. Discussion
4.1. Application of Key Sites in Spatial Planning
In order to alleviate the contradiction between natural space and construction land in the urban agglomeration, a strict ecological protection planning was formulated in Jiangsu Province [62], in which a total of 8474.27 square kilometers of land was included in the national environmental protection areas. Surprisingly, the vast majority of the conservation zones presented an excellent match in spatial distribution with GI sources and corridors, yet hardly included the GI key sites we identified. Referring to our evaluation map of ecosystem service and landscape connectivity, the current ecological space distribution was very unfriendly to the structural stability and ecological connectivity of the regional ecological network [63,64]. The results of the study can contribute to ameliorating the situation through informing the local planners where new development would harm areas that are important for the ecological network of the urban agglomeration [65]. In future ecological planning, the practical application of the GI key sites identification results should be strengthened and used as important pilot objects for planning [66]. In addition, we believe that ecological network planning is spatially nested and prioritized [67,68]. The identification process was carried out in a sequence by constructing a regional GI and then acquiring GI key sites [69]. However, in terms of practical application, GI corridor connectivity is usually achieved by restoring key sites, and complete corridors enable communication between sources [70]. Therefore, we believe that it is necessary to bring GI key sites into ecological restoration policies as a priority [71,72]. Through this approach, the current disorderly construction pattern of urban ecological space will be improved, and the social and ecological benefits of ecological restoration actions will be further enhanced [73,74].
4.2. Differentiated Identification and Governance of Key Sites
Compared with previous studies that categorized all identified ecological points as key sites [75,76], the present study used the Linkage mapper to obtain a more comprehensive distribution pattern of GI key sites based on the modified resistance surface and classified them in detail. It also determined that we need to take into account the connotations and characteristics of different types of key sites in the governance approach [77]. Referring to our experimental results, the water ecological points contain a large number of important watershed spaces, and most of them are facing issues such as rain flooding, water pollution, and decreasing water storage capacity. In view of this, they should be set up as water ecological conservation areas in regional and municipal land use planning policy [78]. Water mobility within these areas should be improved by optimizing the pattern of riparian green space patches and building multi-layered, less interventional symbiotic buffer zones [79,80]. Ecological fracture points are concentrated along cross-city railroads and highways, and the original wildlife migration corridors in these areas have been gradually disrupted by noise pollution and soil hardening [81]. In the course of urban expansion, these areas should be set up as important ecological restoration areas, and human interference should be reduced by building scenic paths [82], green overpasses, and underground passages to enhance the connectivity of ecological processes [83]. In addition, as important ecological stepping stones for the GI corridors, the ecological pinch points show a rich frequency of biological aggregation and migration on the distribution map of biological flows [84]. Based on the characteristics, we suggest setting them as critical nature conservation areas and enhancing the diversity of landscape patches and biological species through the establishment of suburban greenbelts and forest parks [85,86]. In developing countries like China, where urbanization is rapid but of poor quality and environmental problems are complex and diverse, GI key sites should be identified more accurately than sources and corridors [87]. Our research results can provide certain logical reference and framework basis for current governance strategies.
4.3. Limitations and Uncertainties
Although this study has provided new insights into the identification and conservation of GI key sites and has proposed targeted application and governance strategies, it also comes with limitations and uncertainties. It is difficult to form a universal model due to the differences in the determination of indicators and thresholds in the research process of GI [88]. Therefore, in the model of the present study, considerable indicators and parameters will exert some influence on the benefits of the final GI. The indicators mainly include the data types in the ecosystem services importance assessment, the relevant landscape granularity and edge effect width in the MSPA, the scope of the sources buffer zone, and the corridor width [89,90,91]. These circumstances may lead to discrepancies between the theoretical framework of GI and reality, creating uncertainty in the subsequent identification process for the types and spatial locations of GI key sites. This would be a good spot to call for ground truthing and on-site analyses as the key means of substantiating and updating regional GIS data sets.
5. Conclusions
The demand and importance of establishing public, healthy, and stable GI in urban agglomeration areas have increased rapidly after the epidemic outbreak of 2020. The identification and application of GI key sites can effectively improve the disorderly construction pattern of GI network in the urban renewal process and influence the smart development of regional public space. Here, we used ecosystem service evaluation and landscape connectivity analysis to avoid ignoring or amplifying the ecological functions of certain natural spaces. Constructing the GI network using the MSPA and MCR model has systematized the complex landscape patterns. Based on the GI sources and corridors, the circuit theory and Linkage Mapper were applied to identify multiple types of GI key sites, providing a new perspective and framework for ecological restoration of the urban agglomeration. The results showed that the ecological resources of the Southern Jiangsu Urban Agglomeration were densely distributed in the north and south and were sparsely distributed in the middle. Overall, 380 GI key sites were identified, including 53 water ecological points, 251 ecological fracture points, and 76 ecological pinch points. Our findings reveal the spatial distribution patterns of the key sites that are important for the stability and connectivity of ecological networks. Prioritizing the conservation and differentiated management of GI key sites should be brought into the regional land use policies, ensuring that limited land resources and public funds can be directed where restoration is really needed. The study provides land managers and urban planners with additional tools to better understand how to effectively restore and develop the ecosystems of urban agglomerations around the world in the context of scarce land resources.
Supplementary Materials
The following are available online at https://0-www-mdpi-com.brum.beds.ac.uk/article/10.3390/land10111196/s1, Figure S1: The spatial distribution of the ecosystem service in the study area, Figure S2: Landscape types in the study area by MSPA, Figure S3: The integrated resistance surface of the study area.
Author Contributions
Conceptualization, H.S. and J.W.; methodology, H.S. and J.W.; software, H.S.; validation, H.S. and C.L.; investigation, H.S. and J.W.; resources, H.S.; data curation, H.S.; writing—original draft preparation, H.S.; writing—review and editing, J.W. and C.L.; visualization, J.W. and C.L.; supervision, J.W.; project administration, H.S. and J.W.; funding acquisition, J.W. All authors have read and agreed to the published version of the manuscript.
Funding
This research was funded by National Natural Science Foundation of China (No. 32001360, 41901196), China National R & D Program (No. 2019YFD1100405), Jiangsu Committee of Science & Technology Fund (No. BK20190545), and Fundamental Research Funds for the Central Universities (No. Y0202100063).
Institutional Review Board Statement
Not applicable.
Informed Consent Statement
Not applicable.
Data Availability Statement
The data presented in this study are available on request from the author.
Acknowledgments
The authors gratefully acknowledge the support of the funding. In addition, the authors are very grateful the experts who helped us in the process of data collection.
Conflicts of Interest
The authors declare no conflict of interest.
References
- Tzoulas, K.; Korpela, K.; Venn, S.; Yli-Pelkonen, V.; Kazmierczak, A.; Niemela, J.; James, P. Promoting ecosystem and human health in urban areas using Green Infrastructure: A literature review. Landsc. Urban Plan. 2007, 81, 167–178. [Google Scholar] [CrossRef] [Green Version]
- Norton, B.A.; Coutts, A.M.; Livesley, S.J.; Harris, R.J.; Hunter, A.M.; Williams, N.S.G. Planning for cooler cities: A framework to prioritise green infrastructure to mitigate high temperatures in urban landscapes. Landsc. Urban Plan. 2015, 134, 127–138. [Google Scholar] [CrossRef]
- Fnukalova, E.; Zyka, V.; Romportl, D. The Network of Green Infrastructure Based on Ecosystem Services Supply in Central Europe. Land 2021, 10, 592. [Google Scholar] [CrossRef]
- Camerin, F. From "Ribera Plan" to "Diagonal Mar", passing through 1992 "Vila Olimpica". How urban renewal took place as urban regeneration in Poblenou district (Barcelona). Land Use Pol. 2019, 89. [Google Scholar] [CrossRef]
- Atkinson, R. Alpha City: How London Was Captured by the Super-Rich; Verso Books: London, UK, 2021. [Google Scholar]
- Stein, S. Capital City: Gentrification and the Real Estate State; Verso Books: Brooklyn, NY, USA, 2019. [Google Scholar]
- Miao, P. Brave new city: Three problems in Chinese urban public space since the 1980s. J. Urban Des. 2011, 16, 179–207. [Google Scholar] [CrossRef]
- Lovell, S.T.; Taylor, J.R. Supplying urban ecosystem services through multifunctional green infrastructure in the United States. Landsc. Ecol. 2013, 28, 1447–1463. [Google Scholar] [CrossRef]
- Ren, Z.; He, J.; Yue, Q. Assessing the Impact of Urban Expansion on Surrounding Forested Landscape Connectivity across Space and Time. Land 2021, 10, 359. [Google Scholar] [CrossRef]
- Finewood, M.H.; Matsler, A.M.; Zivkovich, J. Green Infrastructure and the Hidden Politics of Urban Stormwater Governance in a Postindustrial City. Ann. Am. Assoc. Geogr. 2019, 109, 909–925. [Google Scholar] [CrossRef]
- Chen, M.; Liu, W.; Lu, D. Challenges and the way forward in China’s new-type urbanization. Land Use Pol. 2016, 55, 334–339. [Google Scholar] [CrossRef]
- Fabris, L.M.F.; Camerin, F.; Semprebon, G.; Balzarotti, R.M. New Healthy Settlements Responding to Pandemic Outbreaks: Approaches from (and for) the Global City. Plan J. 2020, 5, 385–406. [Google Scholar]
- Dobricic, S.; Pisoni, E.; Pozzoli, L.; Van Dingenen, R.; Lettieri, T.; Wilson, J.; Vignati, E. Do environmental factors such as weather conditions and air pollution influence COVID-19 outbreaks. JRC Sci. Policy Rep. Eur. 2020, 30376. [Google Scholar] [CrossRef]
- Coker, E.S.; Cavalli, L.; Fabrizi, E.; Guastella, G.; Lippo, E.; Parisi, M.L.; Pontarollo, N.; Rizzati, M.; Varacca, A.; Vergalli, S. The Effects of Air Pollution on COVID-19 Related Mortality in Northern Italy. Environ. Resour. Econ. 2020, 76, 611–634. [Google Scholar] [CrossRef]
- Egoh, B.N.; Reyers, B.; Rouget, M.; Richardson, D.M. Identifying priority areas for ecosystem service management in South African grasslands. J. Environ. Manage. 2011, 92, 1642–1650. [Google Scholar] [CrossRef] [PubMed] [Green Version]
- Panagopoulos, T. Special Issue: Landscape Urbanism and Green Infrastructure. Land 2019, 8, 112. [Google Scholar] [CrossRef] [Green Version]
- Slater, S.J.; Christiana, R.W.; Gustat, J. Peer Reviewed: Recommendations for keeping parks and green space accessible for mental and physical health during COVID-19 and other pandemics. Prev. Chronic Dis. 2020, 17, E59. [Google Scholar] [CrossRef]
- Slatmo, E.; Nilsson, K.; Turunen, E. Implementing Green Infrastructure in Spatial Planning in Europe. Land 2019, 8, 62. [Google Scholar] [CrossRef] [Green Version]
- Monteiro, R.; Ferreira, J.C.; Antunes, P. Green Infrastructure Planning Principles: An Integrated Literature Review. Land 2020, 9, 525. [Google Scholar] [CrossRef]
- Ferreira, J.C.; Monteiro, R.; Silva, V.R. Planning a Green Infrastructure Network from Theory to Practice: The Case Study of Setubal, Portugal. Sustainability 2021, 13, 8432. [Google Scholar] [CrossRef]
- Haaland, C.; van den Bosch, C.K. Challenges and strategies for urban green-space planning in cities undergoing densification: A review. Urban For. Urban Green. 2015, 14, 760–771. [Google Scholar] [CrossRef]
- Holl, K.D.; Crone, E.E.; Schultz, C.B. Landscape restoration: Moving from generalities to methodologies. Bioscience 2003, 53, 491–502. [Google Scholar] [CrossRef] [Green Version]
- Jiang, C.; Yang, Z.; Wen, M.; Huang, L.; Liu, H.; Wang, J.; Chen, W.; Zhuang, C. Identifying the spatial disparities and determinants of ecosystem service balance and their implications on land use optimization. Sci. Total Environ. 2021, 793. [Google Scholar] [CrossRef]
- Menz, M.H.M.; Dixon, K.W.; Hobbs, R.J. Hurdles and Opportunities for Landscape-Scale Restoration. Science 2013, 339, 526–527. [Google Scholar] [CrossRef]
- Omitaomu, O.A.; Kotikot, S.M.; Parish, E.S. Planning green infrastructure placement based on projected precipitation data. J. Environ. Manage. 2021, 279. [Google Scholar] [CrossRef]
- Forman, R.T.T. Some General-Principles of Landscape and Regional Ecology. Landsc. Ecol. 1995, 10, 133–142. [Google Scholar] [CrossRef]
- Benedict, M.A.; McMahon, E.T. Green Infrastructure: Linking Landscapes and Communities; Island Press: Washington WA, USA, 2012. [Google Scholar]
- Beaujean, S.; Nor, A.N.M.; Brewer, T.; Zamorano, J.G.; Dumitriu, A.C.; Harris, J.; Corstanje, R. A multistep approach to improving connectivity and co-use of spatial ecological networks in cities. Landsc. Ecol. 2021, 36, 2077–2093. [Google Scholar] [CrossRef]
- Kang, J.; Zhang, X.; Zhu, X.; Zhang, B. Ecological security pattern: A new idea for balancing regional development and ecological protection. A case study of the Jiaodong Peninsula, China. Glob. Ecol. Conserv. 2021, 26. [Google Scholar] [CrossRef]
- Fan, M.; Ou, W.; Chen, L. Spatial priority areas for individual and multiple hydrological ecosystem services with economic costs across teshio watershed, northernmost of Japan. Glob. Ecol. Conserv. 2019, 20. [Google Scholar] [CrossRef]
- Zhang, Z.; Meerow, S.; Newell, J.P.; Lindquist, M. Enhancing landscape connectivity through multifunctional green infrastructure corridor modeling and design. Urban For. Urban Green. 2019, 38, 305–317. [Google Scholar] [CrossRef]
- Wei, S.; Pan, J.; Liu, X. Landscape ecological safety assessment and landscape pattern optimization in arid inland river basin: Take Ganzhou District as an example. Hum. Ecol. Risk Assess. 2020, 26, 782–806. [Google Scholar] [CrossRef]
- Tong, H.-L.; Shi, P.-J. Using ecosystem service supply and ecosystem sensitivity to identify landscape ecology security patterns in the Lanzhou-Xining urban agglomeration, China. J. Mt. Sci. 2020, 17, 2758–2773. [Google Scholar] [CrossRef]
- Saura, S.; Estreguil, C.; Mouton, C.; Rodriguez-Freire, M. Network analysis to assess landscape connectivity trends: Application to European forests (1990–2000). Ecol. Indic. 2011, 11, 407–416. [Google Scholar] [CrossRef]
- Gharibi, S.; Shayesteh, K.; Attaeian, B. Interconnected ecological network design using lcp algorithm and cohesion index in urban scale. Urban Ecosyst. 2021, 24, 153–163. [Google Scholar] [CrossRef]
- Almenar, J.B.; Bolowich, A.; Elliot, T.; Geneletti, D.; Sonnemann, G.; Rugani, B. Assessing habitat loss, fragmentation and ecological connectivity in Luxembourg to support spatial planning. Landsc. Urban Plan. 2019, 189, 335–351. [Google Scholar] [CrossRef]
- Carroll, C.; McRae, B.H.; Brookes, A. Use of Linkage Mapping and Centrality Analysis Across Habitat Gradients to Conserve Connectivity of Gray Wolf Populations in Western North America. Conserv. Biol. 2012, 26, 78–87. [Google Scholar] [CrossRef] [PubMed]
- Rushdi, A.M.A.; Hassan, A.K. Reliability of migration between habitat patches with heterogeneous ecological corridors. Ecol. Model. 2015, 304, 1–10. [Google Scholar] [CrossRef]
- Peng, J.; Yang, Y.; Liu, Y.; Hu, Y.n.; Du, Y.; Meersmans, J.; Qiu, S. Linking ecosystem services and circuit theory to identify ecological security patterns. Sci. Total Environ. 2018, 644, 781–790. [Google Scholar] [CrossRef] [PubMed] [Green Version]
- Liquete, C.; Kleeschulte, S.; Dige, G.; Maes, J.; Grizzetti, B.; Olah, B.; Zulian, G. Mapping green infrastructure based on ecosystem services and ecological networks: A Pan-European case study. Environ. Sci. Policy 2015, 54, 268–280. [Google Scholar] [CrossRef]
- Wang, S.; Wu, M.; Hu, M.; Fan, C.; Wang, T.; Xia, B. Promoting landscape connectivity of highly urbanized area: An ecological network approach. Ecol. Indic. 2021, 125. [Google Scholar] [CrossRef]
- Guo, K.; Zhang, X.; Liu, J.; Wu, Z.; Chen, M.; Zhang, K.; Chen, Y. Establishment of an integrated decision-making method for planning the ecological restoration of terrestrial ecosystems. Sci. Total Environ. 2020, 741. [Google Scholar] [CrossRef]
- Uribe, D.; Geneletti, D.; del Castillo, R.F.; Orsi, F. Integrating Stakeholder Preferences and GIS-Based Multicriteria Analysis to Identify Forest Landscape Restoration Priorities. Sustainability 2014, 6, 935–951. [Google Scholar] [CrossRef] [Green Version]
- Li, L.; Uyttenhove, P.; Vaneetvelde, V. Planning green infrastructure to mitigate urban surface water flooding risk—A methodology to identify priority areas applied in the city of Ghent. Landsc. Urban Plan. 2020, 194. [Google Scholar] [CrossRef]
- Dong, J.; Peng, J.; Xu, Z.; Liu, Y.; Wang, X.; Li, B. Integrating regional and interregional approaches to identify ecological security patterns. Landsc. Ecol. 2021, 36, 2151–2164. [Google Scholar] [CrossRef]
- Zhao, S.-M.; Ma, Y.-F.; Wang, J.-L.; You, X.-Y. Landscape pattern analysis and ecological network planning of Tianjin City. Urban For. Urban Green. 2019, 46. [Google Scholar] [CrossRef]
- Chen, C.; Shi, L.; Lu, Y.; Yang, S.; Liu, S. The Optimization of Urban Ecological Network Planning Based on the Minimum Cumulative Resistance Model and Granularity Reverse Method: A Case Study of Haikou, China. IEEE Access 2020, 8, 43592–43605. [Google Scholar] [CrossRef]
- Li, X.; Lv, X.; Yin, R.; Fang, B.; Jin, T. Spatial Equilibrium State and Its Time Evolution of the Multi-functionalization of Regional Land Use in the Eastern China. Pol. J. Environ. Stud. 2021, 30, 2827–2841. [Google Scholar] [CrossRef]
- Faccini, F.; Luino, F.; Sacchini, A.; Turconi, L.; De Graff, J.V. Geohydrological hazards and urban development in the Mediterranean area: An example from Genoa (Liguria, Italy). Nat. Hazards Earth Syst. Sci. 2015, 15, 2631–2652. [Google Scholar] [CrossRef] [Green Version]
- Ramyar, R.; Saeedi, S.; Bryant, M.; Davatgar, A.; Hedjri, G.M. Ecosystem services mapping for green infrastructure planning-The case of Tehran. Sci. Total Environ. 2020, 703. [Google Scholar] [CrossRef]
- Lanzas, M.; Hermoso, V.; de-Miguel, S.; Bota, G.; Brotons, L. Designing a network of green infrastructure to enhance the conservation value of protected areas and maintain ecosystem services. Sci. Total Environ. 2019, 651, 541–550. [Google Scholar] [CrossRef] [PubMed]
- Xu, X.; Yang, G.; Tan, Y.; Liu, J.; Hu, H. Ecosystem services trade-offs and determinants in China’s Yangtze River Economic Belt from 2000 to 2015. Sci. Total Environ. 2018, 634, 1601–1614. [Google Scholar] [CrossRef]
- Pascual-Hortal, L.; Saura, S. Comparison and development of new graph-based landscape connectivity indices: Towards the priorization of habitat patches and corridors for conservation. Landsc. Ecol. 2006, 21, 959–967. [Google Scholar] [CrossRef]
- Carlier, J.; Moran, J. Landscape typology and ecological connectivity assessment to inform Greenway design. Sci. Total Environ. 2019, 651, 3241–3252. [Google Scholar] [CrossRef] [PubMed]
- Cadavid-Florez, L.; Laborde, J.; McLean, D.J. Isolated trees and small woody patches greatly contribute to connectivity in highly fragmented tropical landscapes. Landsc. Urban Plan. 2020, 196. [Google Scholar] [CrossRef]
- Saura, S.; Pascual-Hortal, L. A new habitat availability index to integrate connectivity in landscape conservation planning: Comparison with existing indices and application to a case study. Landsc. Urban Plan. 2007, 83, 91–103. [Google Scholar] [CrossRef]
- Terrado, M.; Sabater, S.; Chaplin-Kramer, B.; Mandle, L.; Ziv, G.; Acuna, V. Model development for the assessment of terrestrial and aquatic habitat quality in conservation planning. Sci. Total Environ. 2016, 540, 63–70. [Google Scholar] [CrossRef] [PubMed] [Green Version]
- Kong, F.; Wang, D.; Yin, H.; Dronova, I.; Fei, F.; Chen, J.; Pu, Y.; Li, M. Coupling urban 3-D information and circuit theory to advance the development of urban ecological networks. Conserv. Biol. 2021, 35, 1140–1150. [Google Scholar] [CrossRef]
- Wu, B.; Yu, B.; Yao, S.; Wu, Q.; Chen, Z.; Wu, J. A surface network based method for studying urban hierarchies by night time light remote sensing data. Int. J. Geogr. Inf. Sci. 2019, 33, 1377–1398. [Google Scholar] [CrossRef]
- Dutta, T.; Sharma, S.; McRae, B.H.; Roy, P.S.; DeFries, R. Connecting the dots: Mapping habitat connectivity for tigers in central India. Reg. Envir. Chang. 2016, 16, 53–67. [Google Scholar] [CrossRef]
- Leonard, P.B.; Duffy, E.B.; Baldwin, R.F.; McRae, B.H.; Shah, V.B.; Mohapatra, T.K. gflow: Software for modelling circuit theory-based connectivity at any scale. Methods Ecol. Evol. 2017, 8, 519–526. [Google Scholar] [CrossRef] [Green Version]
- Zhang, S.; Wei, Z.; Liu, W.; Yao, L.; Suo, W.; Xing, J.; Huang, B.; Jin, D.; Wang, J. Indicators for Environment Health Risk Assessment in the Jiangsu Province of China. Int. J. Environ. Res. Public Health 2015, 12, 11012–11024. [Google Scholar] [CrossRef] [Green Version]
- Egerer, M.; Anderson, E. Social-Ecological Connectivity to Understand Ecosystem Service Provision across Networks in Urban Landscapes. Land 2020, 9, 530. [Google Scholar] [CrossRef]
- Pino, J.; Marull, J. Ecological networks: Are they enough for connectivity conservation? A case study in the Barcelona Metropolitan Region (NE Spain). Land Use Pol. 2012, 29, 684–690. [Google Scholar] [CrossRef]
- Peng, J.; Pan, Y.; Liu, Y.; Zhao, H.; Wang, Y. Linking ecological degradation risk to identify ecological security patterns in a rapidly urbanizing landscape. Habitat Int. 2018, 71, 110–124. [Google Scholar] [CrossRef]
- Yu, Q.; Yue, D.; Wang, Y.; Kai, S.; Fang, M.; Ma, H.; Zhang, Q.; Huang, Y. Optimization of ecological node layout and stability analysis of ecological network in desert oasis: A typical case study of ecological fragile zone located at Deng Kou County(Inner Mongolia). Ecol. Indic. 2018, 84, 304–318. [Google Scholar] [CrossRef]
- Virtanen, E.A.; Viitasalo, M.; Lappalainen, J.; Moilanen, A. Evaluation, Gap Analysis, and Potential Expansion of the Finnish Marine Protected Area Network. Front. Mar. Sci. 2018, 5. [Google Scholar] [CrossRef]
- Kong, F.; Yin, H.; Nakagoshi, N.; Zong, Y. Urban green space network development for biodiversity conservation: Identification based on graph theory and gravity modeling. Landsc. Urban Plan. 2010, 95, 16–27. [Google Scholar] [CrossRef]
- Wang, C.; Yu, C.; Chen, T.; Feng, Z.; Hu, Y.; Wu, K. Can the establishment of ecological security patterns improve ecological protection? An example of Nanchang, China. Sci. Total Environ. 2020, 740. [Google Scholar] [CrossRef]
- Gilby, B.L.; Olds, A.D.; Brown, C.J.; Connolly, R.M.; Henderson, C.J.; Maxwell, P.S.; Schlacher, T.A. Applying systematic conservation planning to improve the allocation of restoration actions at multiple spatial scales. Restor. Ecol. 2021, 29. [Google Scholar] [CrossRef]
- Hou, W.; Zhai, L.; Feng, S.; Walz, U. Restoration priority assessment of coal mining brownfields from the perspective of enhancing the connectivity of green infrastructure networks. J. Environ. Manage. 2021, 277. [Google Scholar] [CrossRef]
- Jalkanen, J.; Toivonen, T.; Moilanen, A. Identification of ecological networks for land-use planning with spatial conservation prioritization. Landsc. Ecol. 2020, 35, 353–371. [Google Scholar] [CrossRef] [Green Version]
- Wang, Y.; Li, X.; Sun, M.; Yu, H. Managing urban ecological land as properties: Conceptual model, public perceptions, and willingness to pay. Resour. Conserv. Recycl. 2018, 133, 21–29. [Google Scholar] [CrossRef]
- Szulczewska, B.; Giedych, R.; Maksymiuk, G. Can we face the challenge: How to implement a theoretical concept of green infrastructure into planning practice? Warsaw case study. Landsc. Res. 2017, 42, 176–194. [Google Scholar] [CrossRef]
- Luo, Y.; Wu, J.; Wang, X.; Wang, Z.; Zhao, Y. Can policy maintain habitat connectivity under landscape fragmentation? A case study of Shenzhen, China. Sci. Total Environ. 2020, 715. [Google Scholar] [CrossRef] [PubMed]
- Yu, Q.; Yue, D.; Wang, J.; Zhang, Q.; Li, Y.; Yu, Y.; Chen, J.; Li, N. The optimization of urban ecological infrastructure network based on the changes of county landscape patterns: A typical case study of ecological fragile zone located at Deng Kou (Inner Mongolia). J. Clean Prod. 2017, 163, S54–S67. [Google Scholar] [CrossRef]
- Xun, B.; Yu, D.; Wang, X. Prioritizing habitat conservation outside protected areas in rapidly urbanizing landscapes: A patch network approach. Landsc. Urban Plan. 2017, 157, 532–541. [Google Scholar] [CrossRef]
- Bychkov, I.V.; Gagarinova, O.V.; Orlova, I.I.; Bogdanov, V.N. Water Protection Zoning as an Instrument of Preservation for Lake Baikal. Water 2018, 10, 1474. [Google Scholar] [CrossRef] [Green Version]
- Carvalho, L.; Mackay, E.B.; Cardoso, A.C.; Baattrup-Pedersen, A.; Birk, S.; Blackstockf, K.L.; Borics, G.; Borja, A.; Feld, C.K.; Ferreira, M.T.; et al. Protecting and restoring Europe’s waters: An analysis of the future development needs of the Water Framework Directive. Sci. Total Environ. 2019, 658, 1228–1238. [Google Scholar] [CrossRef] [PubMed]
- Hong Hanh, N.; Recknagel, F.; Meyer, W. Water Quality Control Options in Response to Catchment Urbanization: A Scenario Analysis by SWAT. Water 2018, 10, 1846. [Google Scholar] [CrossRef] [Green Version]
- Laurance, W.F.; Campbell, M.J.; Alamgir, M.; Mahmoud, M.I. Road Expansion and the Fate of Africa’s Tropical Forests. Front. Ecol. Evol. 2017, 5. [Google Scholar] [CrossRef] [Green Version]
- Forman, R.T.T.; Alexander, L.E. Roads and their major ecological effects. Annu. Rev. Ecol. Syst. 1998, 29, 207–231. [Google Scholar] [CrossRef] [Green Version]
- Popp, J.N.; Boyle, S.P. Railway ecology: Underrepresented in science? Basic Appl. Ecol. 2017, 19, 84–93. [Google Scholar] [CrossRef]
- Huang, J.; Hu, Y.; Zheng, F. Research on recognition and protection of ecological security patterns based on circuit theory: A case study of Jinan City. Environ. Sci. Pollut. Res. 2020, 27, 12414–12427. [Google Scholar] [CrossRef] [PubMed]
- Xu, W.; Xiao, Y.; Zhang, J.; Yang, W.; Zhang, L.; Hull, V.; Wang, Z.; Zheng, H.; Liu, J.; Polasky, S.; et al. Strengthening protected areas for biodiversity and ecosystem services in China. Proc. Natl. Acad. Sci. USA 2017, 114, 1601–1606. [Google Scholar] [CrossRef] [PubMed] [Green Version]
- Bradshaw, C.J.A.; Craigie, I.; Laurance, W.F. National emphasis on high-level protection reduces risk of biodiversity decline in tropical forest reserves. Biol. Conserv. 2015, 190, 115–122. [Google Scholar] [CrossRef]
- Deng, Y.; Liu, Y.; Fu, B. Urban growth simulation guided by ecological constraints in Beijing city: Methods and implications for spatial planning. J. Environ. Manag. 2019, 243, 402–410. [Google Scholar] [CrossRef]
- Hu, T.; Chang, J.; Liu, X.; Feng, S. Integrated methods for determining restoration priorities of coal mining subsidence areas based on green infrastructure: A case study in the Xuzhou urban area, of China. Ecol. Indic. 2018, 94, 164–174. [Google Scholar] [CrossRef]
- Zhang, L.; Peng, J.; Liu, Y.; Wu, J. Coupling ecosystem services supply and human ecological demand to identify landscape ecological security pattern: A case study in Beijing-Tianjin-Hebei region, China. Urban Ecosyst. 2017, 20, 701–714. [Google Scholar] [CrossRef]
- Zhang, K.; Chui, T.F.M. A comprehensive review of spatial allocation of LID-BMP-GI practices: Strategies and optimization tools. Sci. Total Environ. 2018, 621, 915–929. [Google Scholar] [CrossRef]
- Kukkala, A.S.; Moilanen, A. Ecosystem services and connectivity in spatial conservation prioritization. Landsc. Ecol. 2017, 32, 5–14. [Google Scholar] [CrossRef] [Green Version]
Figure 1.
Location and land utilization status of the study area.

Figure 2.
GI key sites identification process: (a) GI sources extraction; (b) GI corridors construction; (c) water ecological points identification; (d) ecological fracture points identification; (e) ecological pinch points identification.
Figure 2.
GI key sites identification process: (a) GI sources extraction; (b) GI corridors construction; (c) water ecological points identification; (d) ecological fracture points identification; (e) ecological pinch points identification.


Table 1.
Images and text data sources.
| Data | Accuracy | Time (Period) | Data Sources | Application |
|---|---|---|---|---|
| China county administrative boundary data | - | 2018 | Resource and Environment Science and Data Center of Chinese Academy of Sciences (https://www.resdc.cn/, accessed date: 10 March 2021) | - |
| Land utilization status | 30 m × 30 m | 2018 | Ecosystem service assessment, MSPA, landscape connectivity assessment, InVEST model | |
| DEM elevation data of Jiangsu Province | 30 m × 30 m | 2018 | Water conservation assessment, soil conservation assessment | |
| Night light data | 1 km × 1 km | 2018 | Resistance surface correction | |
| NDVI spatial distribution data | 1 km × 1 km | 2018 | Soil conservation assessment | |
| Annual net primary productivity (NPP) | 1 km × 1 km | 2000–2010 | Water conservation assessment | |
| Annual average precipitation | 500 m × 500 m | 2000–2010 | Biodiversity conservation assessment | |
| Soil data | 1 km × 1 km | 2015 | National Tibet Plateau Data Center 1: 1,000,000 China Soil Data Set (http://data.tpdc.ac.cn/, accessed date: 16 March 2021) | Water conservation assessment |
| Road data | - | 2018 | Geospatial Data Cloud (http://www.gscloud.cn/, accessed date: 18 March 2021) | InVEST model |
Table 2.
The sensitivity of land use type to habitat threat factors.
| Land Use and Land Cover | Habitat Suitability | Sensitivity to Threat Factor | ||||||
|---|---|---|---|---|---|---|---|---|
| Urban | Industrial Land | Cropland | Rural Settlements | Railroad | Motorway | Road | ||
| Paddy field | 0.3 | 0.5 | 0.6 | 0.01 | 0.3 | 0.2 | 0.3 | 0.2 |
| Dry land | 0.2 | 0.5 | 0.6 | 0.01 | 0.3 | 0.2 | 0.3 | 0.2 |
| Grassland | 0.4 | 0.6 | 0.7 | 0.5 | 0.5 | 0.2 | 0.3 | 0.2 |
| Forest land | 1 | 0.9 | 1 | 0.5 | 0.7 | 0.5 | 0.8 | 0.5 |
| River and canal | 0.9 | 0.8 | 0.85 | 0.45 | 0.6 | 0.3 | 0.4 | 0.3 |
| Lake and pond | 0.9 | 0.85 | 0.9 | 0.5 | 0.65 | 0.5 | 0.6 | 0.5 |
| Wetland | 1 | 0.95 | 1 | 0.6 | 0.8 | 0.7 | 0.85 | 0.7 |
| Buildable land | 0 | - | - | - | - | - | - | - |
| Unused land | 0 | - | - | - | - | - | - | - |
Publisher’s Note: MDPI stays neutral with regard to jurisdictional claims in published maps and institutional affiliations. |
© 2021 by the authors. Licensee MDPI, Basel, Switzerland. This article is an open access article distributed under the terms and conditions of the Creative Commons Attribution (CC BY) license (https://creativecommons.org/licenses/by/4.0/).
Share and Cite
MDPI and ACS Style
Sun, H.; Liu, C.; Wei, J. Identifying Key Sites of Green Infrastructure to Support Ecological Restoration in the Urban Agglomeration. Land 2021, 10, 1196. https://0-doi-org.brum.beds.ac.uk/10.3390/land10111196
AMA Style
Sun H, Liu C, Wei J. Identifying Key Sites of Green Infrastructure to Support Ecological Restoration in the Urban Agglomeration. Land. 2021; 10(11):1196. https://0-doi-org.brum.beds.ac.uk/10.3390/land10111196
Chicago/Turabian StyleSun, Hui, Chunhui Liu, and Jiaxing Wei. 2021. "Identifying Key Sites of Green Infrastructure to Support Ecological Restoration in the Urban Agglomeration" Land 10, no. 11: 1196. https://0-doi-org.brum.beds.ac.uk/10.3390/land10111196
Note that from the first issue of 2016, this journal uses article numbers instead of page numbers. See further details here.