Article

Analysis of Spatial–Temporal Characteristics of Industrial Land Supply Scale in Relation to Industrial Structure in China

1
School of Public Policy and Management, Tsinghua University, Beijing 100084, China
2
School of Public Policy and Management, China University of Mining and Technology, Xuzhou 221116, China
*
Author to whom correspondence should be addressed.
Submission received: 7 October 2021 / Revised: 9 November 2021 / Accepted: 12 November 2021 / Published: 19 November 2021

Abstract

:
Taking China’s industrial land transfer data as the data source, this study quantitatively analyzes the transfer structure and spatial distribution of China’s industrial land from 2010 to 2019. By constructing the information entropy and the equilibrium degree model of industrial land-use structure, this study evaluates the transfer characteristics of industrial land of different functional types in various provinces of China, analyzes the scale advantages of various types of transferred industrial land by using the land transfer scale advantage index, and summarizes the spatial distribution characteristics of different types of industrial land transfer in China through the spatial center of gravity analysis and cold/hot spot regional distribution mapping. The following results were obtained. (1) There are significant differences in the transfer scale of industrial land among provinces in China. The transfer scale of Eastern and Central China is large, whereas that of Western China is small. (2) From the perspective of land-use structure, the transfer scale of industrial land in the central and western regions is more balanced than that in the east. (3) From the gravity center distribution of the standard deviation ellipse, the land transfer direction of the energy industry, and the mining industry, and other types of industries is more significant than that of the culture and sports hygiene industries, modern manufacturing industry, and high-tech industry. (4) From the analysis of cold and hot spots, the mining industry, the energy industry, and other types of industries in the western region with rich mineral resources are the hot spots of industrial land transfer, and the southeast coast is the cold spot; the eastern coastal area is a hot area for land transfer of modern manufacturing, the high-tech industry, and the culture and sports hygiene industries. The results reveal the regional differences and spatial distribution characteristics of industrial transfer in China and provide a reference for authorities to formulate industrial planning and industrial land collection, storage, and transfer plans.

1. Introduction

China is the world’s largest industrial country and the only country in the world with all of the industrial categories of the United Nations industrial classification catalogue: 41 categories, 191 medium categories, and 525 sub-categories. According to the data of the World Bank, China’s industrial added value increased from CNY 28.929 billion in 1960 to CNY 53.17 trillion in 2020, representing a 183.81-fold increase and an average annual growth of 9.08% [1]. In 2010, the added value of China’s manufacturing industry surpassed that of the United States, causing China to become the largest manufacturing country and an important engine of global industrial growth. In response to rapid industrialization, a continuous supply of large areas of industrial land is needed to support further development of industry [2]. China’s industrial land area is 11,478.80 km2, accounting for 19.69% of built-up land in cities in 2019; in some developed areas, such as Shanghai, the percentage is as high as 43.44% [3]. Land is a basic resource and necessary to achieve specific goals in various fields [4]. The remarkable achievements of China’s industrial economy are inseparable from the support of its land resources. As China becomes a “world factory,” its position is becoming increasingly stable [5], and China’s industrialization process is also advancing. Hence, the interaction between industrial growth and industrial land utilization is increasingly frequent and important. The expansion of enterprises needs substantial industrial land as a support. To support the development of enterprises, the Chinese government has built industrial parks and development zones in many areas to realize industrial agglomeration [6]. As a result of industrial growth, the industrial land scale in China has been continuously expanding.
The spatial distribution pattern and agglomeration effect of industry has always been one of the hotspots of academic research in this field [7]. Especially after countries have paid increasing attention to the resurgence of the manufacturing industry’s priority in the overall economy, developed countries have implemented the relocation of overseas manufacturing factories back to their native countries [8]. However, industrial development requires a large amount of land resources as input; hence, it has become the choice of many enterprises to establish corresponding factories in appropriate regions, such as developing emerging industries in regions rich in higher education resources, in order to achieve an effective allocation of resources [9]. In the market-oriented industrial land transfer system, the supply of land resources is more affected by market demand than other factors; thus, the freedom of land supply affects the process of regional industrialization [10]. To attract high-tech enterprises, governments have formulated a series of preferential land and tax policies and built industrial parks to speed up technology transfer and upgrade the regional industrial structure [11,12]. Hence, the government will pay more attention to industrial planning and land resource allocation. For example, Lai [13] evaluated the spatial and transformation directions of industrial land in urban renewal projects in Shenzhen city.
As an important driving force of urban expansion, industrialization is the main direction to which land-use type is transforming [14,15]. In the existing related research, the spatial and temporal evolution of industry is generally studied from the perspectives of industrial land scale change and spatial evolution, and the driving force of evolution is explored. For example, Li studied the characteristics of the spatial–temporal pattern of land used for transportation and discussed the driving factors that influence the spatial distribution of transportation in China [16]. Zhao analyzed the spatial–temporal evolution characteristics of land use in cities along the “Belt and Road Initiative” and discussed industrial land supply mechanisms [17]. The expansion of industrial land has promoted the development of local economies. However, whether land resources have been used efficiently is an important research problem. In theory, appropriate industrial policies can lead the direction of industrial innovation development and help to improve the efficiency of industrial innovation [18]. Yao argued that innovation, economic connections, and industrial structure optimization can promote land use efficiency, and this has a positive spillover effect on the surrounding areas [19]. Luo contended that the process of industrial suburbanization in Wuhan city affected the layout of industrial parks and manufacturing innovation [20]. Liu used a stochastic frontier analysis method to measure the industrial land-use efficiency in China and explored its spatial–temporal characteristics and influencing factors [21]. Similarly, Huang analyzed the spatial–temporal characteristics and driving forces of land development intensity in the western China [22].
The information entropy plays an important role as a descriptive statistic in various disciplines linked to the spatial domain, e.g., landscape changes [23,24], land use, and land cover change [25]. For example, Kostas introduced the Bayesian information entropy statistical spatial metrics for simulating the historical land-use transformations in urban/suburban areas [26]. Although information entropy has unique advantages in reflecting the diversity of industrial structure, it fails to take all the characteristics of the spatial or the spatial–temporal dimension into account [27]. Therefore, mapping the cold and hot spots of industrial distribution using the Geographic Information System (GIS), which can reflect the long-term evolution trend of regional or urban industrial structure and further aid the government in urban or industrial planning, has gradually drawn attention from the academic community [28]. Generally, the industrial output value is used as the division standard when measuring industrial structure. However, for research on a large scale and a long-term period, it is still worth exploring to measure the distribution and evolution of industrial structure with the input of industrial land as a new data source. Based on this, two hypotheses are proposed in this paper.
Hypothesis 1 (H1).
Industrial land transfer data can measure the composition of China’s industrial structure.
Hypothesis 2 (H2).
Industrial land transfer data can reflect the spatial differentiation of industrial structure.
The main purpose of this study is to use industrial land transfer data as a new data source to measure the composition of China’s industrial structure and identify the competitive industries. The spatial characteristics of industrial distribution are visually analyzed with the help of GIS, and the hot spot and cold spot distribution of different industries are identified.
The remainder of this paper is organized as follows: Section 2 describes the various methods used in this study, constructs the industrial structure measure and illustrates the variables and data. Section 3 presents the results of the qualitative and quantitative analyses. Section 4 discusses the results and Section 5 summarizes the findings of the study.

2. Materials

2.1. Data Sources

China land market (www.landchina.com; access date: 11 November 2021), sponsored by the real estate registration center of the Ministry of Natural Resources, is a website dedicated to recording China’s land transaction information. Land transaction data information includes administrative region, electronic supervision number, project name, project location, area, land-use type, industry classification, and other land supply information, which are widely used in various land studies.
Python programming was used to obtain 300,596 records of China’s industrial land transfer transaction data from 2010 to 2019, delete duplicate data based on the uniqueness of the electronic supervision number, screen out a total of 300,002 industrial land transfer records, and obtain the longitude and latitude coordinates of the land parcels in the Auto Navi Map according to the project location. Based on the classification standards of the Industrial Classification for National Economic Activities (GB/T 4754-2017) and the Classification of High-tech Industries (Manufacturing) (2017), the types of industrial land transfer were divided into 10 categories (Table 1).

2.2. Methods

2.2.1. Information Entropy of Industrial Land-Use Structure

The information entropy of industrial land-use structure can reflect the orderliness degree of provincial industrial land. The higher the entropy value, the lower the orderliness degree, the greater the difference between various industrial land types, and the more complex the land-use structure. The lower the entropy, the higher the orderliness of land transfer, and there are fewer land transfer types [29,30]. The calculation formula is expressed as
G j i = j = 1 m P j i ln P j i
In Formula (1), G j i represents the information entropy of j province’s land-use structure. The unit is bit (Nat). P j i indicates the proportion of the transfer area of i industrial land in the total scale of industrial land transfer in j province. The value of information entropy of land-use structure reflects the transfer types of industrial land and the uniformity distribution of various land types in each province. According to the principle of maximum and minimum entropy, when there is no land transfer in the region, the entropy is the minimum; that is, G j i =0. When the transfer area of industrial types in each province is equal, all kinds of land-use types tend to be stable. When G j i = ln m , the information entropy of land-use structure is the largest. It can be seen that the more land function types there are, the lower the orderliness of the land-use system and the greater the entropy.

2.2.2. Equilibrium Degree of Industrial Land-Use Structure

Based on the information entropy function, the equilibrium degree formula of industrial land use can be constructed. This index can reflect the homogeneity of industrial land use. The higher the value, the stronger the homogeneity of industrial land-use structure [31]. The calculation formula is
D j i = G j i ln m
In Formula (2), D j i represents the equilibrium degree of industrial land-use structure; G j i represents the information entropy of industrial land-use structure of j province; m indicates the number of industrial land-use types in each province. D j i is the degree of equilibrium, which is the ratio of actual information entropy to maximum information entropy. Evidently, because G j i ln m , the value range is between 0 and 1; the greater the value of D j i is, the stronger the homogeneity of industrial land-use structure in the province.

2.2.3. Land Transfer Scale Advantage Index

The land transfer scale advantage index reflects the relative importance and scale advantage of a certain type of industrial land. It refers to the ratio of the transfer scale of a certain type of industrial land type in a region to the total transfer area of industrial land in the region and the transfer area of this type of industrial land in the whole country. It is an important index to measure the spatial distribution of a certain type of industrial land. The land transfer scale advantage index of type i industrial land in j province of China is defined as Q j i . The specific formula is as follows:
Q j i = E j i / E j E i / E
where Q j i is the advantage index of i industrial land transfer scale in province j ; E j i is i transferred industrial land scale in province j ; E j is the total scale of industrial land transfer in j province; E i is the i th industrial land transfer scale in China; E is the total transferred area of industrial land in China. When Q j i is greater than, equal to, and less than 1, the i th land transfer scale advantage in j province is higher, equal to, and lower than the national level, respectively.

2.2.4. Spatial Distribution Center of Gravity

The barycentric model describes the offset trajectory and centralized and discrete distribution trend of spatial attributes, which can represent the spatial change of regional attributes [32]. The center of gravity reflects the spatial distribution center of industrial land. The transfer of gravity center shows that the land of various industries in different regions changes synchronously, which can reflect their regional differences. The calculation formula is as follows:
X = ( j = 1 n x j E j ) / ( j = 1 n E j ) ; Y = ( j = 1 n y j E j ) / ( j = 1 n E j )
where E j is the total scale of transferred industrial land in j province. x j , y j are the geometric center coordinates of the provincial administrative unit. X , Y are the coordinates of the gravity center of the industrial land spatial distribution.

2.2.5. Cold and Hot Spot Analysis

To observe the spatial difference of industrial land supply scale among provinces, Getis-OrdG*i index was used to divide cold spot areas and hot spot areas [33]. We analyzed the distribution of the patterns of cold and hot spots of industrial land transfer scale at the provincial scale with the following formula:
G i * ( d ) = j = 1 n ω i j ( d ) x j / j = 1 n x j
To facilitate interpretation and comparison, Formula (5) was transformed into
Z ( G i * ( d ) ) = ( G i * ( d ) E ( G i * ( d ) ) ) / V a r ( G i * ( d ) )
where E ( G i * ( d ) ) and V a r ( G i * ( d ) ) are the mathematical expectation and variance of G i * ( d ) ; ω i j is the spatial weight matrix. If the score of G i * ( d ) is positive and statistically significant, it indicates that there is a high level of hot spot spatial aggregation; if the score of G i * ( d ) is negative and statistically significant, it represents cold spot agglomeration; if the confidence interval is 0, it means there is no statistical significance.

3. Results

3.1. Analysis of the Change of Industrial Land Transfer in China

From 2010 to 2019, the average transfer price of industrial land in China was CNY 2.2 million per hectare. The top three provincial administrative regions were Shanghai (CNY 7.83 million per hectare), Guangdong Province (CNY 4.73 million per hectare), and Beijing (CNY 4.46 million per hectare). Qinghai Province (CNY 0.24 million per hectare) had the lowest transfer price. The transfer price per hectare of industrial land was 32.63, 19.71, and 18.58 times that of Qinghai Province, respectively. In the past 10 years, 30 provinces and cities have transferred a total of 300,002 pieces of industrial land, with a transfer area of 1,111,982.03 hectares. The largest number of industrial land transfers were in Jiangsu (40,543), Zhejiang (28,733), and Shandong (28,258), and the top three transfer areas were Jiangsu (102,908.60 hectares), Shandong (96,772.57 hectares), and Xinjiang (70,693.08 hectares).
Among the top three industrial land transfer scales of each province, 96.67%, 70.00%, and 60.00% of the industries were related to raw material processing, modern manufacturing, and food and textile industries. Among them, the land transfer scale of food and textile industries in Heilongjiang was 34.41% of the total transfer area, the transfer scale of raw material processing land in the Ningxia Hui Autonomous Region was 46.60% of the total transfer area, and the transfer scale of modern manufacturing land in Shanghai was 32.41% of the total transfer area. Among the total transfer scale of other industrial land types in each province, the area of industrial land transferred by mining industry in the Inner Mongolia Autonomous Region was 15.32% of the total scale, the transfer area of the energy industry in Qinghai was 18.80%, the transfer area of the construction industry in Hunan Province accounted for 11.86% of the total scale, the transfer area of Shanghai’s high-tech industry accounted for 14.71% of the total scale, the transfer area of industrial supporting services in Beijing accounted for 32.79%, and the transfer area of other industries in Qinghai accounted for 58.11% of the total scale. Among the land transfer scales of culture and sports hygiene industries, only Fujian accounted for the highest proportion of industrial land transfer scale, but it measured only 3.78% (Figure 1).
There is either competition or cooperation between industries, which is reflected in the transfer scale of industrial land types—that is, different land types have positive or negative relations. It can be seen from Table 2 that there is an obvious negative correlation between the traditional industries represented by the mining industry, energy industry, and raw material processing, and the modern industrial land scale represented by the culture and sports hygiene industries, modern manufacturing industry, and high-tech industry, and there is a significant positive correlation between traditional industries represented by the mining industry and energy industry. The modern industries represented by the culture and sports hygiene industries, modern manufacturing industry, and high-tech industry also show a significant positive relationship; food and textile industries and industrial supporting services have a positive relationship with the construction industry.

3.2. Analysis of the Change of Industrial Land Transfer Structure in China

The information entropy results of industrial land-use structure show that from 2010 to 2019, the information entropy of industrial land-use structure in various provinces of China varied greatly, and Shaanxi Province had the highest entropy value, which was 55.97% higher than Qinghai Province, which had the lowest entropy value. According to the number of industrial land transfer types, the maximum information entropy of industrial land-use structure was 2.30, and the information entropy of 33.33% provinces represented by Shaanxi, Guizhou, and Guangdong exceeded 2.0 by reaching 2.05. The information entropy of 63.33% provinces represented by Guangxi, Henan, and Inner Mongolia was in the range of 1.5–1.99, with an average of 1.85. The information entropy of industrial land-use structure in Qinghai Province was the lowest at only 1.34.
From the results of industrial land-use equilibrium, the stronger the homogeneity of industrial land-use structure, the higher its value. From 2010 to 2019, there were significant differences in the value of industrial land-use equilibrium degree among China’s provinces. Shaanxi and Guizhou Provinces, with a high equilibrium value, exceeded 0.9, whereas Qinghai Province had a low value of only 0.58, and the average equilibrium value of each province was 0.83. Shaanxi Province, with the highest degree of equilibrium, exceeded Qinghai Province by 56.9%. The equilibrium degree of 19 provinces was in the range of 0.8–0.89, and the representative provinces were Guangdong, Hunan, Jilin, Sichuan, and Shanxi, among others. The equilibrium degree of Liaoning, Zhejiang, Shandong, Beijing (municipality directly under the central government), Jiangsu, Ningxia (autonomous region), Tianjin (municipality directly under the central government), Fujian, and other provinces was in the range of 0.70–0.79, with an average of 0.77, accounting for 26.67% of the total (Figure 2).

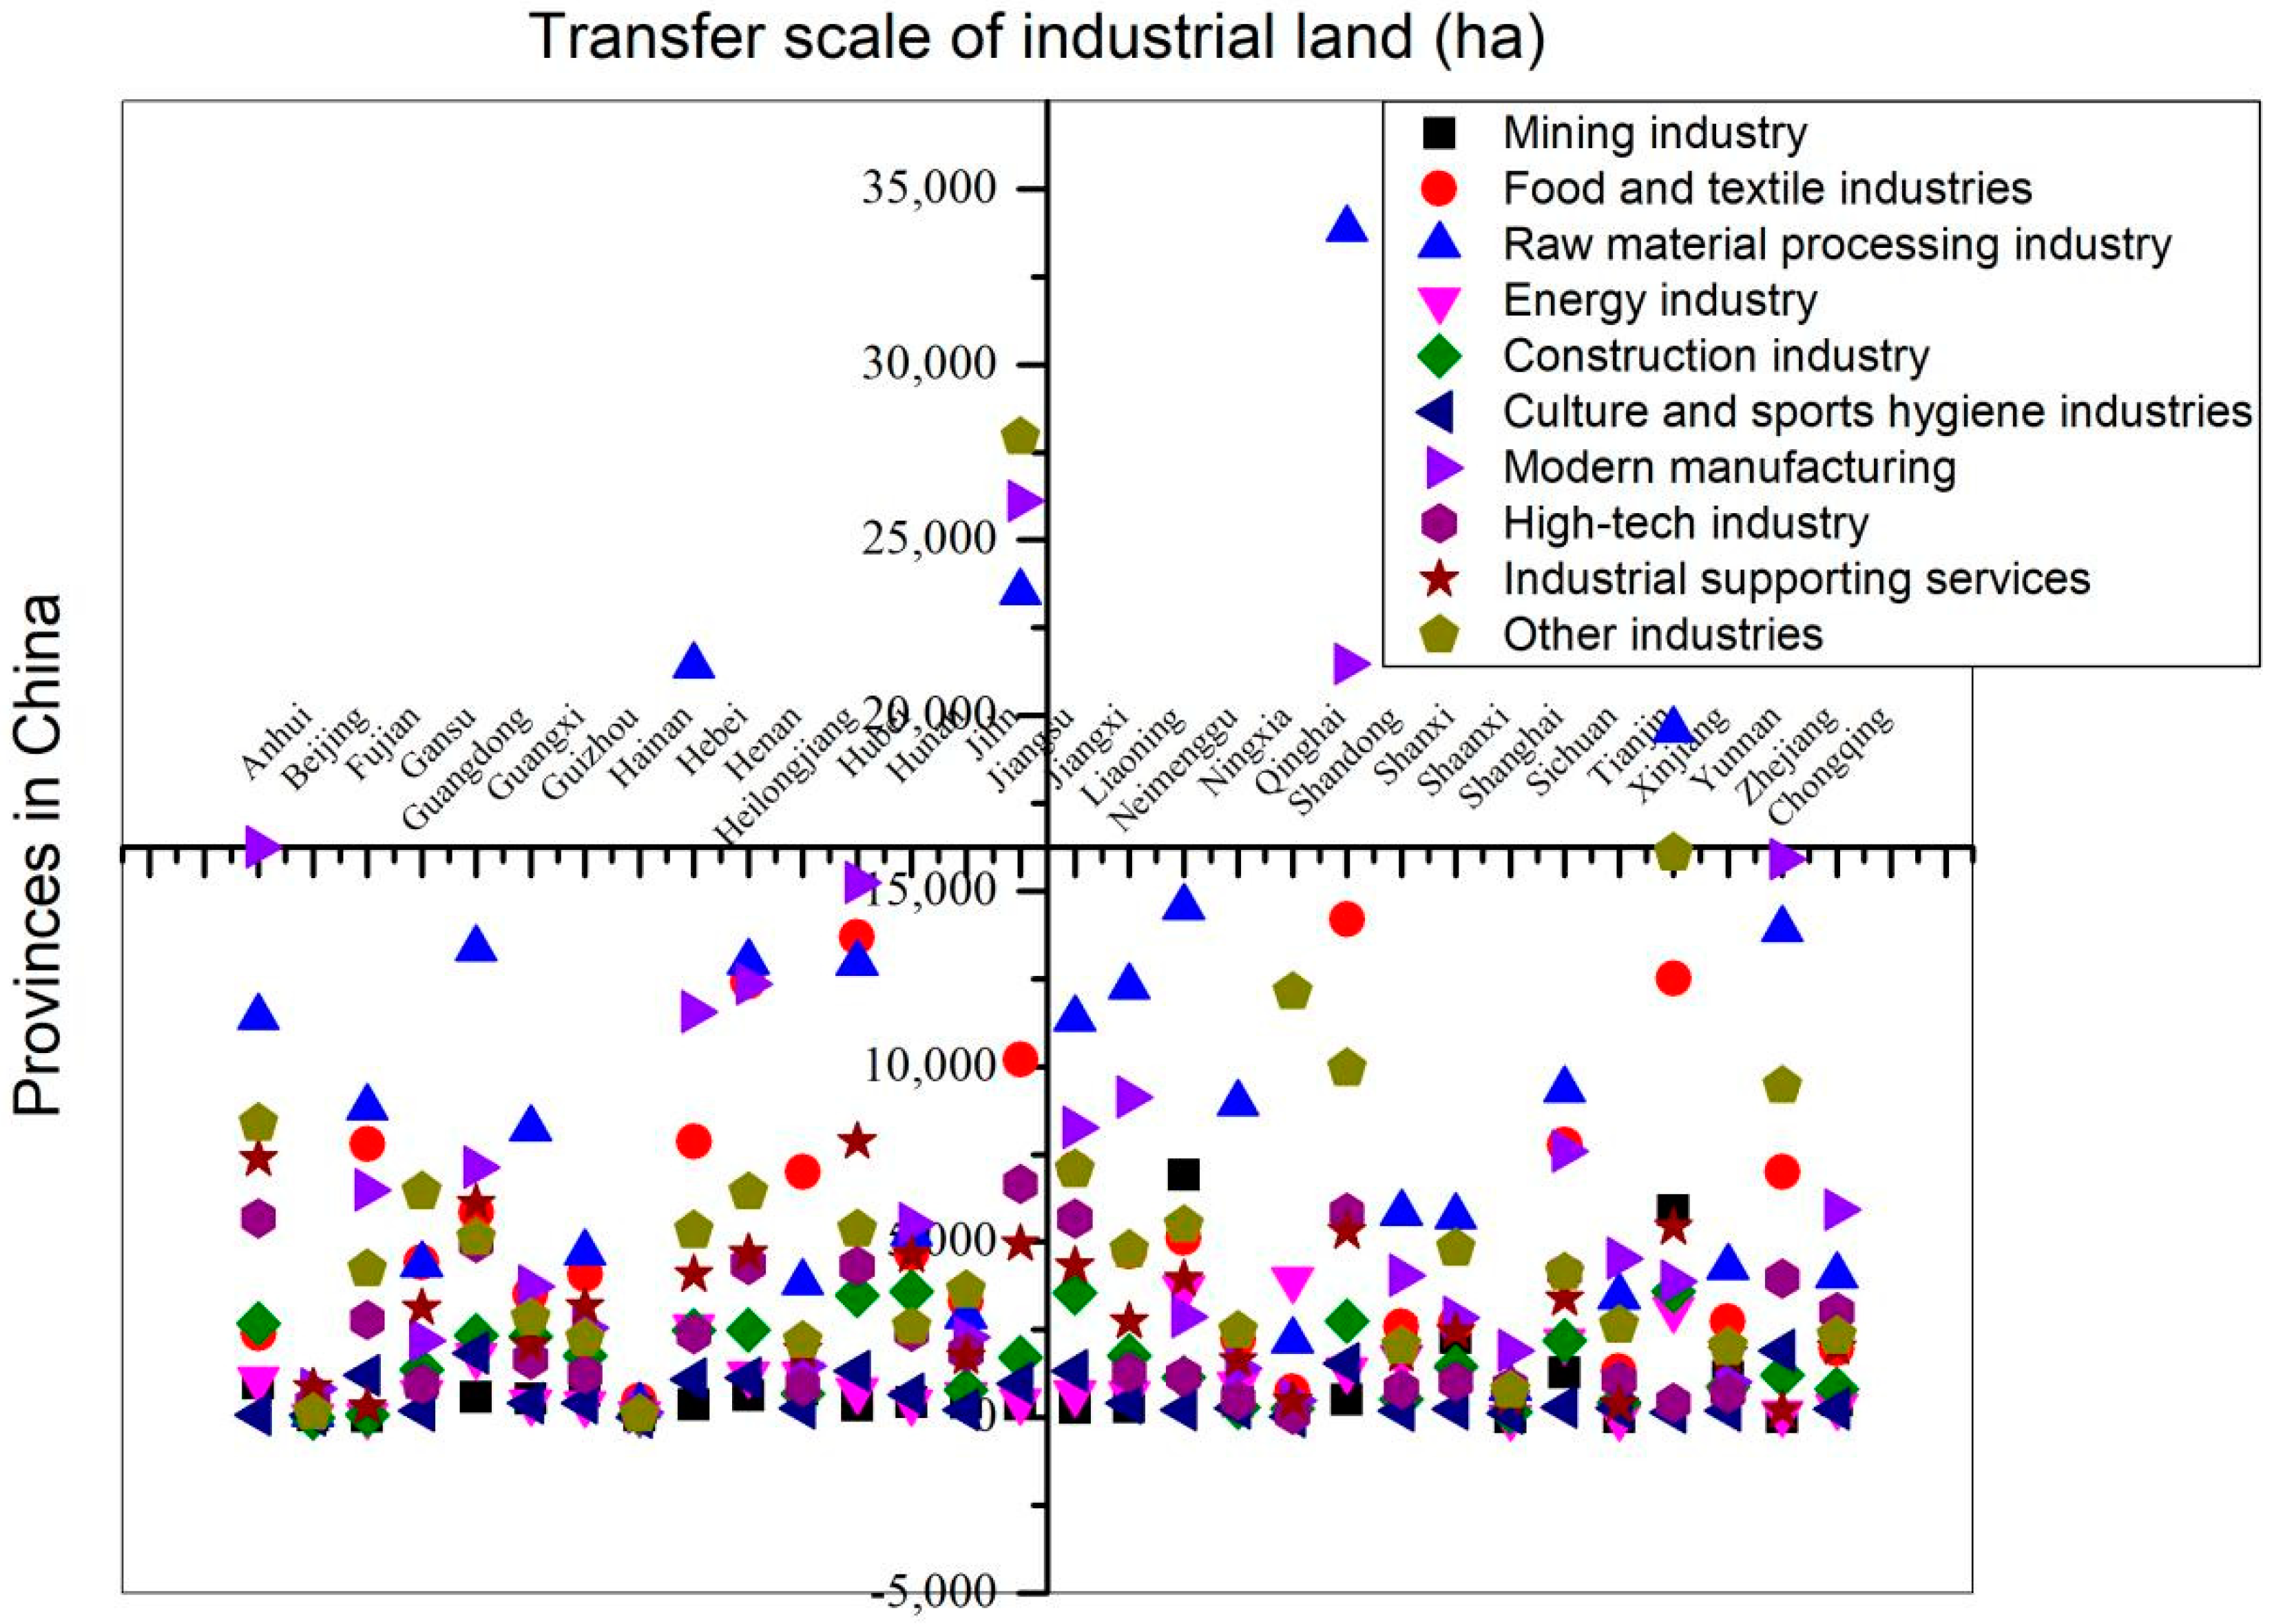
3.3. Analysis of the Scale Advantage Pattern of Industrial Land Transfer in China

From 2010 to 2019, the transfer scale of industrial land in different provinces of China varied greatly, resulting in obvious differences in the advantage index value of the industrial land transfer scale. Generally, the land transfer scale of the mining industry and energy industry with geographical distribution advantages accounted for a high proportion of the total scale of the province; hence, the advantage index value was also at a high level, such as the mining industry in Inner Mongolia, Shanxi, and Shaanxi and the energy industry in Qinghai, Inner Mongolia, and Shanxi. Specifically, the average transfer scale advantage index of mining industrial land in the top five provinces was 3.83, whereas the advantage index of the bottom five was only 0.14, and 66.67% provinces were lower than the national development level. In the food and textile industries, only 40% of the provincial advantage index was higher than the national level, and the average transfer scale advantage index of the top five industrial land was 1.74. In the raw material processing industry, 63.33% of the provincial advantage index was lower than the national development level, and the average transfer scale advantage index of the top five provinces was 1.4. It was the lowest in Beijing, at only 0.15. In the energy industry, the average transfer scale advantage index of the top five was 3.53, and the advantage index of 46.67% provinces was higher than the national level. In the construction industry, the average transfer scale advantage index of the top five was 1.86 and that in the bottom five was only 0.21. Among the culture and sports hygiene industries, the average transfer scale advantage index of the top five was 1.87, and the index of 60% provinces was lower than the national level. In the modern manufacturing industry, the average transfer scale advantage index of industrial land in the top five was 1.73. Only 53.33% of the provincial advantage indexes were higher than the national level. The index in Qinghai Province was the lowest, at only 13.46% of the average index value. Among the high-tech industries, the average transfer scale advantage index of the top five high-tech industrial land was 2.05, and the advantage index of 56.67% provinces was higher than the national level. In industrial supporting services, 66.67% of the provincial advantage index was higher than the national development level, but the highest index value of Beijing was 83.62 times than that of Zhejiang. Among other industries, only 26.67% of the provincial advantage index was higher than the national level.
Judging from the distribution of industrial land transfer scale advantages in various provinces, Beijing’s culture and sports hygiene industries, modern manufacturing industry, high-tech industry, and industrial service advantage indexes were in the leading position, Shanghai exhibited advantages in the modern manufacturing and high-tech industries, the mining industry and energy industry were mainly concentrated in Inner Mongolia, and the advantage index of the energy industry and other industrial land was higher in Qinghai province. With a lower advantage index of the industrial land transfer scale, Qinghai Province was at a disadvantaged stage for many industrial land types, such as food and textile industries, raw material processing, construction industry, culture and sports hygiene industries, modern manufacturing industry, high-tech industry, industrial supporting services, and others. Beijing’s food and textile industries, raw material processing, construction, and other industry types were lower than the national average. Tianjin lagged in the mining industry, food and textile industries, energy industry, industrial supporting services, and other industry types. Xinjiang and the Inner Mongolia autonomous regions were at a disadvantage in the culture and sports hygiene industries, modern manufacturing industry, and high-tech industry (Table 3).

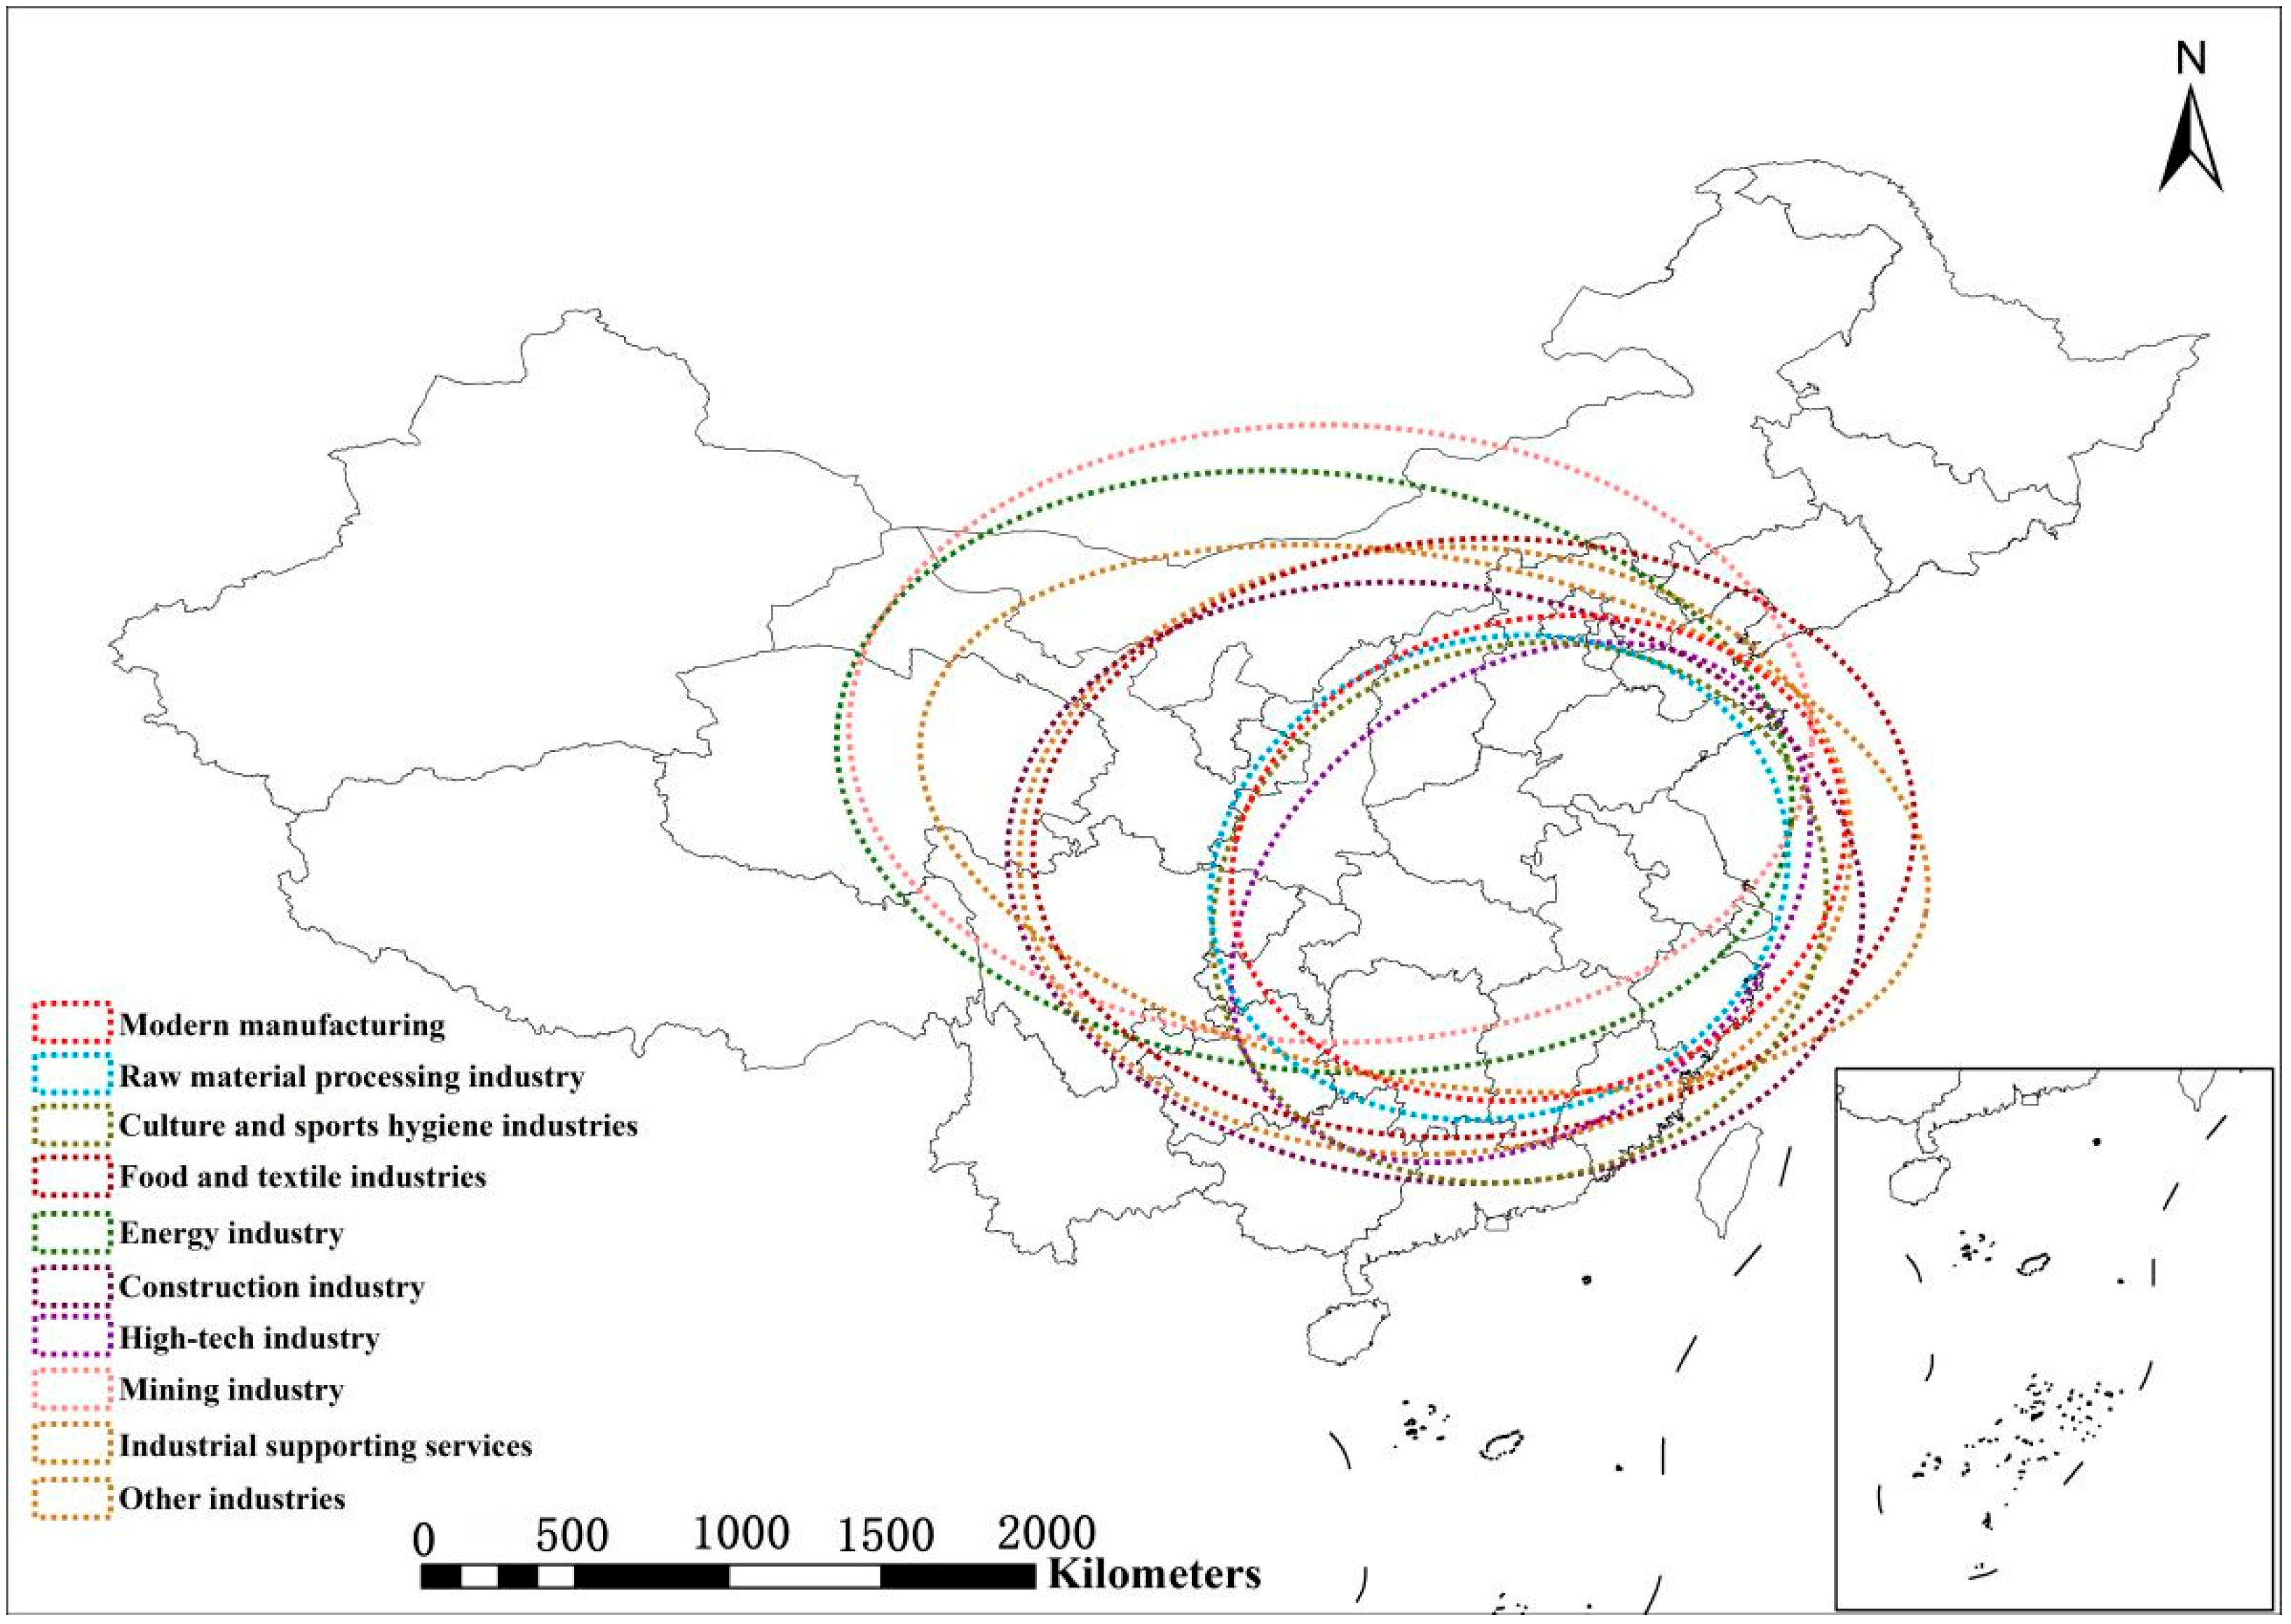
3.4. Standard Deviational Ellipse Analysis of Industrial Land Transfer in China

The standard deviational ellipse method is one of the classical methods used to analyze the directional characteristics of spatial distribution. The size of the ellipse reflects the concentration of the overall elements of the spatial pattern, and the deflection angle reflects the dominant direction of the pattern. From 2010 to 2019, the gravity elliptical center of the standard deviation of industrial land transfer in China was distributed in the central and western regions, mainly in Henan (50%), Anhui (10%), Hubei (20%), and Shaanxi Province (20%) (Figure 3). Specifically, the gravity elliptical center of industrial land for the mining industry was located in Ansai District, Yan’an city, Shaanxi Province (36.722048° N; 109.291435° E); the center of the food and textile industries was located in Ye County, Pingdingshan city, Henan Province (33.659471° N; 113.500543° E); the center of raw material processing was located in Zhengyang County, Zhumadian city, Henan Province (32.494174° N; 114.242755° E); the center of the energy industry was located in Huangling County, Yan’an city, Shaanxi Province (35.601222° N; 108.820461° E); the focus of the construction industry was located in Xiangzhou District, Xiangyang city, Hubei Province (32.346195° N; 112.365024° E); the gravity center of the culture and sports hygiene industries was located in Macheng city, Huanggang city, Hubei Province (31.464455° N; 114.836005° E); the gravity center of the modern manufacturing industry was located in Jieshou city, Fuyang city, Anhui Province (33.064719° N; 115.385743° E); the center of the high-tech industry was located in Xinxian County, Xinyang city, Henan Province (31.764286° N; 114.879332° E); the focus of industrial supporting services was located in Nanzhao County, Nanyang city, Henan Province (33.2861° N; 112.36808° E); and the gravity center of the other industries was located in Song County, Luoyang city, Henan Province (34.224829° N; 112.040986° E).
The angle θ indicates that the standard deviation ellipse angle degrees of various transferred industrial land in China are significantly different from each other, ranging from 54.84° to 100.59°. Specifically, the turning angle of the land transferred in the mining industry is close to 90°, and the spatial distribution follows the “west–east” trend with the major axis being located in central China, which reflects the facts that the mining industrial land transfer is concentrated in Inner Mongolia, Shanxi, Shaanxi, and other regions. The spatial pattern of land transfer for the food and textile industries and industrial supporting services is inclined towards the “southwest–northeast” direction, with the major axis being located in southeast China, and most of the industrial sites are located in the developed provinces along the southeast coast. The spatial distribution for the energy industry and construction industry was close to the “northwest–southeast” axis with the major axis crossing the central and southeast regions of China. The angle of raw material processing (76.28°), culture and sports hygiene industries (73.67°), and modern manufacturing industry (77.28°) is about 75°, and their spatial distribution shows an obvious “southwest–northeast” trend; the spatial distribution of these 3 types of industrial land transfer overlaps with the major axis being located in northern and southeast China, including the Yangtze River Delta and the Beijing-Tianjin-Hebei economic zone. The transfer position of high-tech industrial land showed an obvious “southwest–northeast” trend, and the angle degree was only 54.84°. The pattern of other transferred industrial land showed a significant “northwest–southeast” trend, with an angle degree of 100.59°.
In the results of the ratio of major and minor semi-axes of various types of transferred industrial land, the flatness was in the range of 1.17 to 1.95, and there was a significant difference among different types. The semi-major axis of the ellipse represents the direction of data distribution, and the semi-minor axis represents the range of data distribution. The greater the difference between the semi-major and semi-minor axes (the greater oblateness), the more obvious the directionality of data. Specifically, the oblateness of transferred industrial land represented by the culture and sports hygiene industries, raw material processing, and modern manufacturing industry was less than 1.3, covering 5–8 provinces and part of which covered 12–14 provinces. For the food and textile industries, construction industry, high-tech industry, and industrial supporting services, the oblateness was in the range of 1.31–1.5, the provinces fully covered accounted for 23.33–46.67% of the total, and the provinces partially covered accounted for about 40% of all provinces. The oblateness of the mining industry, energy industry, and other industrial land was between 1.56–1.95, and the provinces fully covered and partially covered were between 33.33–43.33% and 33.33–40%, respectively (Table 4).

3.5. Cold and Hot Spot Analysis of Spatial Pattern of Transferred Industrial Land in China

From 2010 to 2019, the Getis-OrdG*i index of industrial land supply scale in China’s provincial administrative regions showed obvious spatial distribution characteristics according to the transfer type, involving hot spots and cold spots in the east, central, and west regions of the country. However, not all types of transferred industrial land showed significant characteristics in spatial distribution. For example, the land transfer of food and textile industries did not show significant distribution characteristics on the provincial scale. In some transferred industrial land types, there was an obvious contrast between Eastern and Western China; that is, the spatial distribution of hot spots and cold spots was significantly different. For example, in the distribution of land transfer for the mining industry and energy industry, Xinjiang and Qinghai in the western inland region were obvious hot spots, whereas the eastern coastal and central regions were cold spots. From the regional distribution of modern manufacturing and high-tech industrial land transfer, it can be clearly observed that the hot areas of these two types of transferred industrial land were concentrated in the eastern coastal and central regions. For example, the hot spots of the modern manufacturing industry were mainly in Jiangsu, Zhejiang, Shanghai, Fujian, and Anhui provinces along with the sub-hot spots composed of nine provinces, including Beijing, Tianjin, Hebei, and Shandong. The hot spots of the high-tech industry included Jiangsu, Zhejiang, Shanghai, and other provinces in the Yangtze River Delta and extended to Fujian, Jiangxi, and Hunan provinces. The spatial distribution of raw material processing and the culture and sports hygiene industries formed a contrast between the east and the west; that is, the hot spot area was located in the east, and the cold spot area was located in the northwest and southwest. Construction industry and industrial service land were only distributed in sub hot areas, including in the Shaanxi, Chongqing, Guangxi, and Fujian provinces. Finally, the distribution of other industrial land was obvious in cold and hot areas, but they were all located in the western provinces of China, including hot areas in Xinjiang and cold areas dominated by Sichuan and Yunnan (Figure 4).

4. Discussion

4.1. Driving Forces of Structural Differences in Industrial Land Transfer in China

As an important factor of production, land is an indispensable part of regional economic growth. However, there are significant differences in economic development and resource endowments among different regions in China. In long-term social development and urban industrial planning, the economic structure will continue to change, which will promote various regions to adjust the land-use structure. Among various land-use functions, the transferred industrial land directly reflects the requirements of regional economic development [34]. With the gradual standardization of China’s land transfer procedures, the industrial planning process is also being scientifically improved. The market-oriented industrial land transfer principle is the best embodiment of the resource allocation theory, such as the development of three-dimensional printing (3D) industry [35] and intelligent manufacturing industry [36].
The transfer frequency of industrial land is closely related to the development level of market economy in the province. First, in the provinces where foreign investment is more concentrated, industrial land transactions are more active. The eastern coastal areas represented by Jiangsu, Zhejiang, and Shandong are the areas where China has attracted foreign investment earlier; so, the transfer activities of industrial land are more frequent. The inland provinces, such as Qinghai, Ningxia, and Gansu, are far away from the eastern developed region; thus, the industrial land transfer transaction records are far lower than those in the eastern region. Second, the economic development level directly affects the unit price of transferred industrial land. More economically developed provinces have stronger demand for industrial land; thus, the government will regulate the transfer scale and type of industrial land. As the products produced in such areas are closer to the market and have convenient transportation, enterprises will prefer economically developed areas. For example, the transfer unit price of industrial land in Guangdong, Zhejiang, Jiangsu, Shanghai, Beijing, Tianjin, and Chongqing, where the transfer scale of industrial land is controlled, is much higher than that in inland provinces such as Qinghai, Xinjiang, and Ningxia.

4.2. Spatial Differentiation Characteristics of Transferred Industrial Land in China

The active degree of industrial land transfer represents the industrial development vitality of a region. It also reflects the degree to which a region is favored by industrial investors and most directly reflects the industrial investment attractiveness. It is also a barometer to feed back the industrial investment of a region. As there are great differences in the natural environment and socio-economic conditions of China’s provinces, and there are obvious boundaries in population distribution, the spatial distribution of industrial land transfer types also has their own characteristics, and the driving forces of industrial land use are also quite different.
First, due to the fixed distribution space of mineral resources, the land transfer of the mining industry and energy industry has significant regional characteristics. Inner Mongolia, Shanxi, Shaanxi, and other provinces have a wide distribution of coal minerals, oil, natural gas, metal mines, and other resources. Therefore, the mining industry occupies an important position in the transfer type of industrial land in these provinces. Moreover, China’s current energy structure is still dominated by coal. To alleviate the energy pressure in the eastern region, the central government has implemented the “West–East Electricity Transmission Project” to transport the thermal power generated at the pithead plants in Shanxi and Inner Mongolia, the main coal producing areas, to Beijing, Tianjin, and Tangshan, which has also directly promoted the scale of energy industrial land in the associated provinces.
Second, the modern manufacturing and high-tech industries characterized by intensive knowledge and technology, low resource consumption, and high added value are more concentrated in China’s economically developed areas. Beijing, Shanghai, Tianjin, Chongqing, Jiangsu, Zhejiang, and other provincial administrative regions have concentrated most of China’s higher education resources and research and development (R&D) personnel. Therefore, various high-tech enterprises have set up R&D centers and production bases in developed regions and provinces, thus forming a spatial agglomeration of high-tech industries. However, Qinghai, Xinjiang, Inner Mongolia, and Ningxia, which are located in inland areas, have the energy industry as their main industrial structure, resulting in the continuous flow of population to economically developed coastal provinces, which indirectly leads to the slow development of high-tech industries; hence, the transfer scale of industrial land for related industries is also small. In addition, relying on their financial advantages, coastal provinces have formulated a series of preferential policies for land transfer, which has also promoted the expansion of the scale of land transfer to a certain extent through tax regulation and encouraging enterprises to purchase land.
Finally, industries represented by the food and textile industries and raw material processing need to be close to the origin of raw materials and place of consumption. Therefore, the industrial land transfer of this type is mainly concentrated in large agricultural and populous provinces. For example, Henan Province, as a large agricultural and rural population province in China with a population of nearly 100 million, is an important origin of grain, meat, and poultry eggs in China, and it has more than 10 of the national top 100 agricultural enterprises. As the production base of Nike, Adidas, and other international sports brands, Fujian has formed a complete industrial chain and industrial cluster development pattern comprising chemical fiber, spinning, weaving, dyeing, clothing, and textile machinery. Therefore, the transfer land of the light textile industry occupies an important position in Fujian.

4.3. Limitations and Future Research

Industrial land transfer data is a new data source for quantitative analysis of land-use structure. With the help of information entropy, the complex urban industrial land structure can be deeply studied. As information entropy is a measure of complexity, the division standard of functional types of transferred industrial land plays a decisive role in the values of information entropy of land-use structure. However, there may be differences in the classification standards of industrial land types in different countries and regions. This study classifies the types of transferred industrial land based on China’s national economic industry classification standards. However, some land transfer types may not be completely consistent with the industry classification, which may lead to some errors between the calculation results and the actual situation of land-use information entropy and land-use structure equilibrium.
In addition, there are other data types that can be used for scientific research in the data set. For example, by measuring China’s industrial land-use structure information entropy, equilibrium, spatial cold and hot spots, and kernel density estimation, among other variables, in each year, we can further explore the distribution of regular patterns, characteristics, and driving forces of different industrial land types in China in various time series.

5. Conclusions

Industrial concentration and spatial distribution characteristics are among the research hotspots in the academic community. Taking China’s industrial land transfer data as the data source, this study investigated the development differences, equilibrium, industrial concentration, and spatial distribution characteristics of industrial industries in various provinces of China from the perspective of industrial structure. The information entropy of land-use structure reflects the types of industrial development in each province in the past decade, and the results reveal the differences of land transfer function types. By evaluating the land transfer scale advantage index, the specialization degree of regional industrial development was measured by the scale of industrial land transfer with different functions. Then, we calculated the transfer center of all types of industrial land through standard deviation ellipse analysis, estimated its distribution trends and coverage, identified cold and hot spots with the Getis-OrdG*i index, and finally analyzed the driving factors for the development of the spatial pattern of transferred industrial land in all provinces.
The scale and function types of transferred industrial land in China’s provinces in the past decade have notable characteristics. First, the transferred industrial land scale showed a decreasing trend from the southeast coast to the northwest inland; second, there were obvious differences in the transfer types of industrial land in various provinces. The transfer land of the mining industry and energy industry was mainly concentrated in Central and Western China, whereas modern manufacturing and high-tech industries were mainly concentrated in the Yangtze River Delta urban agglomerations, Pearl River Delta, and Beijing-Tianjin-Hebei urban agglomeration. Finally, the social economy and natural resource endowment are important factors causing the difference of industrial land transfer types in various provinces, and the transfer scale of traditional industrial land represented by the mining industry and energy industry was significantly correlated. Similarly, the scale of modern industrial land represented by the culture and sports hygiene industries, modern manufacturing industry, and high-tech industry also showed an obvious positive relationship, but there was a significant negative correlation between the scale of industrial land between traditional industry and modern industry.

Author Contributions

Conceptualization, P.D.; methodology, P.D.; software, P.D.; validation, P.D., Y.Z. and Z.M.; formal analysis, P.D. and Z.C.; investigation, P.D., Y.Z., R.S. and Z.C.; resources, R.S.; data curation, R.S. and Z.C.; writing—original draft preparation, P.D., R.S., Z.M. and Z.C.; writing—review and editing, P.D., R.S., Z.M., Z.C. and Y.Z.; visualization, P.D. and Z.C.; supervision, Y.Z.; project administration, P.D.; funding acquisition, P.D., Y.Z. All authors have read and agreed to the published version of the manuscript.

Funding

This research is supported by the National Natural Science Foundation of China (71974107, 91646102, L1924058, L1824039), Tsinghua University—Cambridge University Joint Research Initiative Fund (20193080066), China Postdoctoral Science Foundation (2020M680598, 2021M691741), Natural Resource Science and Technology Project of Jiangsu Province (2020002).

Institutional Review Board Statement

Not applicable.

Informed Consent Statement

Not applicable.

Data Availability Statement

The data presented in this study are available on request from the corresponding author.

Acknowledgments

The authors are grateful to the anonymous reviewers and editors for their detailed comments and valuable suggestions.

Conflicts of Interest

The authors declare no conflict of interest.

References

  1. World Bank Open Data. 2020. Available online: https://data.worldbank.org/ (accessed on 11 November 2021).
  2. Zhang, J.; Chang, Y.; Wang, C.; Zhang, L. The green efficiency of industrial sectors in China: A comparative analysis based on sectoral and supply-chain quantifications. Resour. Conserv. Recycl. 2018, 132, 269–277. [Google Scholar] [CrossRef]
  3. MOHURD. China Urban Construction Statistical Yearbook; China Statistics Press: Beijing, China, 2019. [Google Scholar]
  4. Wei, Y.; Li, X.; Gao, F.; Huang, C.; Ma, P. The United Nations Sustainable Development Goals (SDG) and the Response Strategies of China. J. Earth Sci. 2018, 33, 1084–1093. [Google Scholar]
  5. Li, H.; Wei, Y.D.; Liao, F.H.; Huang, Z. Administrative hierarchy and urban land expansion in transitional China. Appl. Geogr. 2015, 56, 177–186. [Google Scholar] [CrossRef]
  6. Wu, Y.; Heerink, N. Foreign direct investment, fiscal decentralization and land conflicts in China. China Econ. Rev. 2016, 38, 92–107. [Google Scholar] [CrossRef]
  7. Chen, W.; Shen, Y.; Wang, Y.; Wu, Q. How do industrial land price variations affect industrial diffusion? Evidence from a spatial analysis of China. Land Use Policy 2018, 71, 384–394. [Google Scholar] [CrossRef]
  8. Stentoft, J.; Rajkumar, C. The relevance of Industry 4.0 and its relationship with moving manufacturing out, back and staying at home. Int. J. Prod. Res. 2020, 58, 2953–2973. [Google Scholar] [CrossRef]
  9. Bailey, D.; Glasmeier, A.; Tomlinson, P.R.; Tyler, P. Industrial policy: New technologies and transformative innovation policies? Camb. J. Reg. Econ. Soc. 2019, 12, 169–177. [Google Scholar] [CrossRef] [Green Version]
  10. Vachadze, G. Land market liberalization, transfer of agricultural technology, and the process of industrialization. Land Use Policy 2013, 35, 388–394. [Google Scholar] [CrossRef]
  11. Jens, J.K. Productivity and Structural Change: A review of the Literature. J. Econ. Surv. 2008, 22, 330–363. [Google Scholar]
  12. Rachel Ngai, L.; Pissarides, C.A. Structural Change in a Multisector Model of Growth. Am. Econ. Rev. 2007, 97, 429–443. [Google Scholar] [CrossRef] [Green Version]
  13. Lai, Y.; Chen, K.; Zhang, J.; Liu, F. Transformation of Industrial Land in Urban Renewal in Shenzhen, China. Land 2020, 9, 371. [Google Scholar] [CrossRef]
  14. Li, W.; Wang, D.; Liu, S.; Zhu, Y. Measuring urbanization-occupation and internal conversion of peri-urban cultivated land to determine changes in the peri-urban agriculture of the black soil region. Ecol. Indic. 2019, 102, 328–337. [Google Scholar] [CrossRef]
  15. Liu, F.; Zhang, Z.; Zhao, X.; Wang, X.; Zuo, L.; Wen, Q.; Yi, L.; Xu, J.; Hu, S.; Liu, B. Chinese cropland losses due to urban expansion in the past four decades. Sci. Total Environ. 2019, 650, 847–857. [Google Scholar] [CrossRef] [PubMed]
  16. Li, B.; Cao, X.; Xu, J.; Wang, W.; Ouyang, S.; Liu, D. Spatial–Temporal Pattern and Influence Factors of Land Used for Transportation at the County Level since the Implementation of the Reform and Opening-Up Policy in China. Land 2021, 10, 833. [Google Scholar] [CrossRef]
  17. Zhao, S.; Yan, Y.; Han, J. Industrial Land Change in Chinese Silk Road Cities and Its Influence on Environments. Land 2021, 10, 806. [Google Scholar] [CrossRef]
  18. Peters, M.; Schneider, M.; Griesshaber, T.; Hoffmann, V.H. The impact of technology-push and demand-pull policies on technical change—Does the locus of policies matter? Res. Policy 2012, 41, 1296–1308. [Google Scholar] [CrossRef]
  19. Yao, M.; Zhang, Y. Evaluation and Optimization of Urban Land-Use Efficiency: A Case Study in Sichuan Province of China. Sustainability 2021, 13, 1771. [Google Scholar] [CrossRef]
  20. Luo, L.; Zheng, Z.; Luo, J.; Jia, Y.; Zhang, Q.; Wu, C.; Zhang, Y.; Sun, J. Spatial Agglomeration of Manufacturing in the Wuhan Metropolitan Area: An Analysis of Sectoral Patterns and Determinants. Sustainability 2020, 12, 8005. [Google Scholar] [CrossRef]
  21. Liu, S.-C.; Lin, Y.-B.; Ye, Y.-M.; Xiao, W. Spatial-temporal characteristics of industrial land use efficiency in provincial China based on a stochastic frontier production function approach. J. Clean. Prod. 2021, 295, 126432. [Google Scholar] [CrossRef]
  22. Huang, X.; Huang, X.; Liu, M.; Wang, B.; Zhao, Y. Spatial-temporal Dynamics and Driving Forces of Land Development Intensity in the Western China from 2000 to 2015. Chin. Geogr. Sci. 2020, 30, 16–29. [Google Scholar] [CrossRef] [Green Version]
  23. Das, S.; Angadi, D.P. Assessment of urban sprawl using landscape metrics and Shannon’s entropy model approach in town level of Barrackpore sub-divisional region, India. Model. Earth Syst. Environ. 2021, 7, 1071–1095. [Google Scholar] [CrossRef]
  24. Lemoine-Rodríguez, R.; MacGregor-Fors, I.; Muñoz-Robles, C. Six decades of urban green change in a neotropical city: A case study of Xalapa, Veracruz, Mexico. Urban Ecosyst. 2019, 22, 609–618. [Google Scholar] [CrossRef]
  25. Biney, E.; Boakye, E. Urban sprawl and its impact on land use land cover dynamics of Sekondi-Takoradi metropolitan assembly, Ghana. Environ. Chall. 2021, 4, 100168. [Google Scholar] [CrossRef]
  26. Alexandridis, K.; Pijanowski, B.C. Spatially-Explicit Bayesian Information Entropy Metrics for Calibrating Landscape Transformation Models. Entropy 2013, 15, 2480–2509. [Google Scholar] [CrossRef]
  27. López, F.; Matilla-García, M.; Mur, J.; Marín, M.R. A non-parametric spatial independence test using symbolic entropy. Reg. Sci. Urban Econ. 2010, 40, 106–115. [Google Scholar] [CrossRef] [Green Version]
  28. Shukla, A.; Jain, K. Critical analysis of rural-urban transitions and transformations in Lucknow city, India. Remote Sens. Appl. Soc. Environ. 2019, 13, 445–456. [Google Scholar] [CrossRef]
  29. Fu, Y.; Zhou, T.; Yao, Y.; Qiu, A.; Wei, F.; Liu, J.; Liu, T. Evaluating efficiency and order of urban land use structure: An empirical study of cities in Jiangsu, China. J. Clean. Prod. 2021, 283, 124638. [Google Scholar] [CrossRef]
  30. Meng, F.; Liang, X.; Xiao, C.; Wang, G. Integration of GIS, improved entropy and improved catastrophe methods for evaluating suitable locations for well drilling in arid and semi-arid plains. Ecol. Indic. 2021, 131, 108124. [Google Scholar] [CrossRef]
  31. Ma, L.; Cui, X.; Yao, Y.; Liu, S. Gradient Difference of Structure of Rural Construction Land in Loess Hilly Region: A Case Study of Yuzhong County, Gansu Province, China. Land 2021, 10, 349. [Google Scholar] [CrossRef]
  32. Zhang, G.; Zhang, N.; Liao, W. How do population and land urbanization affect CO2 emissions under gravity center change? A spatial econometric analysis. J. Clean. Prod. 2018, 202, 510–523. [Google Scholar] [CrossRef]
  33. Barrell, J.; Grant, J. Detecting hot and cold spots in a seagrass landscape using local indicators of spatial association. Landsc. Ecol. 2013, 28, 2005–2018. [Google Scholar] [CrossRef]
  34. Yuting, Y.; Guanghui, J.; Qiuyue, Z.; Dingyang, Z.; Yuling, L. Does the land use structure change conform to the evolution law of industrial structure? An empirical study of Anhui Province, China. Land Use Policy 2019, 81, 657–667. [Google Scholar] [CrossRef]
  35. Zhou, Y.; Lin, H.; Liu, Y.; Ding, W. A novel method to identify emerging technologies using a semi-supervised topic clustering model: A case of 3D printing industry. Scientometrics 2019, 120, 167–185. [Google Scholar] [CrossRef] [Green Version]
  36. Zhou, Y.; Zang, J.; Miao, Z.; Minshall, T. Upgrading Pathways of Intelligent Manufacturing in China: Transitioning across Technological Paradigms. Engineering 2019, 5, 691–701. [Google Scholar] [CrossRef]
Figure 1. Transfer area of industrial land types in various provinces of China.
Land 10 01272 g001
Figure 2. Information entropy and equilibrium degree of industrial land-use structure in various provinces of China.
Land 10 01272 g002
Figure 3. Standard deviation ellipses of various industrial land transfers in China.
Land 10 01272 g003
Figure 4. Cold and hot spot spatial distribution of industrial land supply in China’s provinces from 2010 to 2019.
Land 10 01272 g004
Table 1. Industry classification.
Industry after MergerIndustry Name before Merger
Mining industryMining; non-metallic ore mining and dressing industry; coal mining and washing industry; other mining industries; limestone gypsum mining; oil and gas exploitation industry; iron ore mining and beneficiation; clay and other soil, sand, and stone mining; mining and beneficiation of other ferrous metal ores; copper mining and beneficiation; nonferrous metal mining and dressing industry.
Food and textile industriesTextile and clothing, shoes and hats manufacturing; textile industry; furniture manufacturing; cotton, chemical fiber textile and printing and dyeing finishing; agriculture, forestry, animal husbandry, and fishery; agricultural and sideline food processing industry; agriculture; leather, fur, feather (down), and their manufacturing industry; food manufacturing; tobacco manufacturing; beverage manufacturing; fisheries; papermaking and paper products industry; bicycle manufacturing.
Raw material processing industryNon-metallic mineral products industry; recycling and processing industry of waste resources and waste materials; steel calendering; ferrous metal smelting and rolling processing industry; wood processing and wood, bamboo, rattan, palm, and grass products; chemical fiber manufacturing; chemical raw materials and chemical products manufacturing; steelmaking from smelt iron; forestry; aluminum smelting; petroleum processing, coking, and nuclear fuel processing industry; manufacture of cement, lime, and gypsum; ferroalloy smelting; copper smelting; nonferrous metal smelting and rolling industry.
Energy industryProduction and supply of electricity, gas, and water; production and supply of electricity and heat; thermal power generation; gas production and supply industry; nuclear power generation;
Construction industryEstate; housing and civil engineering; project preparation; construction and installation industry; building decoration industry; manufacturing of brick, tile, stone, and other building materials.
Culture and sports hygiene industriesRadio, television, film, and audio-visual industry; education; sports; hygiene; culture and art industry; press and publication industry; entertainment; cultural, educational, and sporting goods manufacturing industry; reproduction of printing industry and recording media.
Modern manufacturingManufacturing of ships and floating devices; manufacturing of household air conditioners; manufacturing of household refrigeration appliances; transportation equipment manufacturing; motorcycle manufacturing; automobile manufacturing; manufacturing of railway transportation equipment; general equipment manufacturing; special equipment manufacturing.
High-tech industrySoftware industry; manufacturing of communication equipment, computers, and other electronic equipment; information transmission, computer service, and software industry; pharmaceutical manufacturing; instrument and culture; office machinery manufacturing.
Industrial supporting servicesCatering; warehousing; urban public transport; telecommunications and other information transmission services; public administration and social organizations; public facilities management industry; pipeline transportation industry; international organizations; national institutions; air transport industry; environmental management industry; transportation, storage, and postal services; finance; residential services and other services; science and technology exchange and promotion services; retail; wholesale and retail; other services; other financial services; business services; research and experimental development; banking; postal service; professional and technical services.
Other industriesOther industries
Table 2. Spearman correlation coefficients.
Mining IndustryFood and Textile
Industries
Raw Material Processing
Industry
Energy
Industry
Construction IndustryCulture and Sports
Hygiene
Industries
Modern
Manufacturing
High-Tech IndustryIndustrial Supporting ServicesOther
Industries
Mining industry1.000.10−0.020.816 **0.24−0.640 **−0.752 **−0.479 **0.35−0.03
Food and textile industries0.101.000.030.120.429 *0.19−0.33−0.020.01−0.28
Raw material
processing
industry
−0.020.031.000.10−0.050.02−0.14−0.456 *−0.443 *−0.02
Energy industry0.816 **0.120.101.000.11−0.651 **−0.780 **−0.546 **0.05−0.06
Construction
industry
0.240.429 *−0.050.111.00−0.04−0.290.070.439 *−0.16
Culture and sports hygiene industries−0.640 **0.190.02−0.651 **−0.041.000.427 *0.506 **0.07−0.34
Modern
manufacturing
−0.752 **−0.33−0.14−0.780 **−0.290.427 *1.000.589 **−0.10−0.17
High-tech industry−0.479 **−0.02−0.456 *−0.546 **0.070.506 **0.589 **1.000.28−0.22
Industrial
supporting
services
0.350.01−0.443 *0.050.439 *0.07−0.100.281.00−0.28
Other industries−0.03−0.28−0.02−0.06−0.16−0.34−0.17−0.22−0.281.00
**: Significant at the level of 0.01 (two-tailed); *: Significant at the level of 0.05 (two-tailed).
Table 3. Regional distribution of advantage index of industrial land transfer scale in China.
Transfer Type of Industrial LandThe Top Five ProvincesThe Bottom Five Provinces
Mining industryInner Mongolia, Shanxi, Shaanxi, Xinjiang, YunnanTianjin, Shanghai, Fujian, Jiangsu, Hubei
Food and textile industriesHeilongjiang, Hainan, Fujian, Henan, HubeiQinghai, Anhui, Beijing, Chongqing, Tianjin
Raw material processing industryNingxia, Hebei, Shandong, Inner Mongolia, LiaoningBeijing, Qinghai, Shanghai, Jilin, Hunan
Energy industryQinghai, Inner Mongolia, Shanxi, Hainan, HeilongjiangShanghai, Tianjin, Fujian, Zhejiang, Jiangsu
Construction industryHunan, Guangxi, Guizhou, Jiangxi and HainanBeijing, Fujian, Qinghai, Ningxia, Jiangsu
Culture and sports hygiene industriesFujian, Guangdong, Zhejiang, Beijing, JiangxiAnhui, Qinghai, Xinjiang, Inner Mongolia, Sichuan
Modern manufacturingShanghai, Tianjin, Beijing, Zhejiang, AnhuiQinghai, Xinjiang, Inner Mongolia, Yunnan, Heilongjiang
High-tech industryShanghai, Beijing, Chongqing, Jiangxi, JilinQinghai, Xinjiang, Inner Mongolia, Ningxia, Liaoning
Industrial supporting servicesBeijing, Hunan, Guizhou, Anhui, GansuZhejiang, Fujian, Qinghai, Tianjin, Jiangsu
Other industriesQinghai, Jiangsu, Gansu, Xinjiang, JilinBeijing, Hainan, Hubei, Hunan, Hebei
Table 4. Ratio of major and minor half axes of various transferred industrial land in China.
Type of Industrial LandOblatenessFully Covered ProvincesPartially Covered Provinces
Mining industry1.56Beijing, Tianjin, Hebei, Shandong, Shanxi, Henan, Shaanxi, Hubei, Ningxia and ChongqingLiaoning, Inner Mongolia, Gansu, Qinghai, Sichuan, Guizhou, Hunan, Jiangxi, Zhejiang and Jiangsu
Food and textile industries1.48Jiangsu, Shanghai, Zhejiang, Shandong, Beijing, Tianjin, Shanxi, Shaanxi, Ningxia, Chongqing, Hubei, Henan and AnhuiLiaoning, Hebei, Inner Mongolia, Gansu, Qinghai, Sichuan, Yunnan, Guizhou, Hunan, Yunnan, Guangdong, Jiangxi and Fujian
Raw material processing industry1.22Jiangsu, Shanghai, Anhui, Henan and HubeiBeijing, Tianjin, Hebei, Shanxi, Shaanxi, Gansu, Sichuan, Chongqing, Guizhou, Hunan, Guangxi, Jiangxi, Fujian and Zhejiang
Energy industry1.60Beijing, Tianjin, Jiangsu, Shanxi, Shaanxi, Henan, Anhui, Hubei, Chongqing, NingxiaHebei, Shandong, Liaoning, Shanghai, Zhejiang, Jiangxi, Hunan, Guizhou, Sichuan, Qinghai, Inner Mongolia, Gansu
Construction industry1.44Jiangsu, Zhejiang, Shanghai, Shanxi, Henan, Anhui, Jiangxi, Shaanxi, Ningxia, Hubei, Hunan, Chongqing, JiangxiBeijing, Tianjin, Hebei, Shandong, Fujian, Kanto, Guangxi, Guizhou, Yunnan, Sichuan, Qinghai, Gansu and Inner Mongolia
Culture and sports hygiene industries1.17Jiangsu, Zhejiang, Shanghai, Anhui, Henan, Jiangxi, Hubei and HunanHebei, Tianjin, Shandong, Shanxi, Shaanxi, Gansu, Chongqing, Sichuan, Guizhou, Guangxi, Guangdong and Fujian
Modern manufacturing1.30Jiangsu, Shanghai, Shandong, Anhui, Henan and HubeiZhejiang, Fujian, Jiangxi, Hunan, Chongqing, Guizhou, Sichuan, Gansu, Shanxi, Shanxi, Hebei, Beijing and Tianjin
High-tech industry1.39Jiangsu, Shanghai, Anhui, Henan, Hubei, Hunan, JiangxiTianjin, Hebei, Shandong, Shanxi, Shaanxi, Sichuan, Chongqing, Guizhou, Guangxi, Guangdong, Fujian and Zhejiang
Industrial supporting services1.37Jiangsu, Shanghai, Zhejiang, Shandong, Beijing, Tianjin, Shanxi, Shanxi, Ningxia, Chongqing, Hubei, Hunan, Henan and AnhuiHebei, Liaoning, Inner Mongolia, Gansu, Qinghai, Sichuan, Yunnan, Guizhou, Guangxi, Guangdong, Jiangxi and Fujian
Other industries1.95Jiangsu, Shanghai, Zhejiang, Shandong, Tianjin, Beijing, Shanxi, Henan, Anhui, Hubei, Shaanxi, Ningxia and ChongqingLiaoning, Hebei, Inner Mongolia, Gansu, Qinghai, Sichuan, Guizhou, Hunan, Jiangxi and Fujian
Publisher’s Note: MDPI stays neutral with regard to jurisdictional claims in published maps and institutional affiliations.

