Article

The Impact of Farmland Transfer on Rural Households’ Income Structure in the Context of Household Differentiation: A Case Study of Heilongjiang Province, China

1
School of Geography and Planning, Sun Yat-Sen University, Xingang Xi Road, Guangzhou 510275, China
2
Guangdong Key Laboratory for Urbanization and Geo-Simulation, Sun Yat-Sen University, Xingang Xi Road, Guangzhou 510275, China
3
School of Architecture and Urban Planning, Shenzhen University, Shenzhen 518060, China
4
Guangdong Guodi Land Planning Technology Co., Ltd., Guangzhou 510650, China
*
Author to whom correspondence should be addressed.
Submission received: 7 March 2021 / Revised: 29 March 2021 / Accepted: 30 March 2021 / Published: 1 April 2021
(This article belongs to the Special Issue Land Use Transitions under Rapid Urbanization)

Abstract

:
Farmland transfer is an important factor affecting rural households’ income and sustainable development of rural areas in developing countries. However, recent studies have reached controversial conclusions on how farmland transfer affects rural households’ income because of ignoring the household differentiation and the difference in the impacts of farmland transfer-in and transfer-out on the income structure. Taking the Heilongjiang province, the major cereal production area in China, as the study area, the paper aims to estimate the impacts of farmland transfer-in or transfer-out of different rural households on income structure based on the Propensity Score Matching (PSM) model. Results showed that the total income of all rural households transferring-in farmland increased significantly while the income decreased after transferring-out farmland, and I part-time households have the largest increase, followed by pure-agricultural households and II part-time households, whereas I part-time households has the smallest reduction, followed by pure-agricultural households and II part-time households. Because the increase in the agricultural income and subsidies was greater than the decrease in the outworking income for I part-time households transferring-in farmland, while the outworking income not increasing but decreasing when II part-time households transferring-out farmland. We can conclude that (1) encouraging pure-agricultural and I part-time households to transfer farmland in and II part-time households to transfer out of farmland, and develop mutual assistance for the aged in rural areas should be strengthened. (2) Improving the farmland transfer market and promoting non-agricultural employment of surplus-labor need to be synchronized. (3) Agricultural subsidies should be provided to cultivators.

1. Introduction

Farmland is one of the most important productive assets of rural households in many countries, and it can be sold, leased, or exchanged [1,2,3]. How farmland is owned, used, and exchanged has far-reaching implications for productivity, equity, and overall economic growth, and there is a large and growing body of literature on the impacts of land tenure security on farmland investments and agricultural productivity, and consider that the establishment of private land ownership and tenure security facilitates transactions in land rental and sales markets by reducing transaction costs, stimulates land investment by assuring investment returns [2,4,5]. However, how to realize the positive role of farmland transactions in the case of the inability to obtain land ownership remains to be explored in depth. Unlike in many countries, under the Household Contract Responsibility System of China (HCRS), village collectives own farmlands, and farming households contract farmland from collectives and receive the land contract and management rights, while rural households are not allowed to sell their farmland, and they only have farmland usage rights rather than ownership, and they can trade their farmland usage rights to other households or economic organizations for enlarging or reducing their farmland scale. The trade of farmland usage rights is often referred to as “farmland transfer” in China, and it includes transfer, lease, exchange, shareholding, etc. [6,7,8], which has been considered as a typical way of land use transitions [9], because it involves the changes in planting structure by solving the farmland fragmentation and changing the planting scale, helping to achieve agricultural modernization [8,10,11,12], particularly for China where agricultural production has dominated by the traditional small-scale household economies, and the significance of optimizing farmland achieving the optimal allocation of rural land resources and agricultural scale management through farmland transfer is particularly prominent. Thus, a series of policies have been issued to promote farmland transfer. According to the data of the Ministry of Agriculture of the People’s Republic of China, the transferred area of farmland reached 2.69 × 10⁷ hm2 by the end of 2018, accounting for 30.4% of the total area of household-contracted farmland, approximately 20% higher than in 2012 [13], and a more important reason for farmland transfer flourishing in China is that the government expected to promote rural households’ income through farmland transfer [14]. Because the income gap between urban and rural is the important cause of the large population migration in rural China, which further caused “hollowing village” and the countryside decline [15,16,17]. Hence, increasing the income of rural households through farmland transfer is a necessary prerequisite for retaining rural elites and realizing rural revitalization.
In this context, the No.1 Central Committee’s Documenting China has addressed the farmland transfer with the aim of positively influence farmers’ income, which has also received considerable attention from academia. Although farmland transfer undoubtedly has an impact on the income of rural households, the positivity or negativity of its effects has caused a lot of controversies. One view is that farmland fragmentation has a significant negative impact on farmland efficiency, while farmland transfer can promote fragmented land to be concentrated into the pure-agricultural with a large area of farmland and improve economies of scale, finally increasing farmers’ income to a certain degree [18,19,20]. Empirical research shows that farmland transfer can increase the income of any households and farmer households who have participated in farmland transfer by 19% and 33%, respectively [10]. However, another point of view considers that farmland transfer has a significant negative on the increase of rural households’ income [21,22]. Some scholars also found the average cost curve of farmers is “U” shaped; that is, the average cost first decreases then increases with the expansion of the farm-scale [23,24], and if considering the farmland cost, farmland transfer will have a negative impact on agricultural production efficiency in China [25].
Hence, there is no comprehensive knowledge concerning the circumstances under which farmland transfer derives significant negative or positive effects on the rural households’ income. Some research has classified households’ income, but these studies ignored the difference in the impact of farmland transfer-in and transfer-out on rural households’ income [26,27]. A few studies further investigated the impact of farmland transfer on households’ total income by dividing rural households transferring-in farmland and transferring-out farmland and by analyzing the changes of agricultural machinery value, non-agricultural income, and rental-land income [21], while it does not eliminate the impact of management without farmland transfer on households’ income. It is worth noting that some research has adopted the propensity score matching (PSM) method to estimate the impacts [10,28], eliminating the deviation caused by natural changes in households’ income. Nonetheless, most of these studies have ignored the heterogeneity of rural households, and they also have paid less attention to the causes of farmland transfer affecting the income structure of different rural households. Hence, putting farmland transfer-in and transfer-out, household differentiation, and household income structure in the same framework, and considering the differences that farmland transfer-in and transfer-out affecting the income structure in the context of rural household differentiation need to be further explored.
With the ongoing rural labor migration, the non-agricultural income of rural households has gradually become the main source of households’ income [29]. However, agricultural income is still the main source of most rural households’ income in Heilongjiang province as the grain production and food-commodity supply area. Especially under the current macroeconomic environment of economic decline in Northeast China [30], how to stabilize and strengthen agricultural production, improving agricultural productivity through farmland transfer, and ultimately increase rural households’ income is extremely important. Therefore, this paper takes Heilongjiang province as the case, quantitatively estimates the impacts of farmland transfer-in or transfer-out on the total incomes in the context of household differentiation; secondly, this study further explores the underlying mechanisms and causes by analyzing the changes in the income structures of different rural households adopting the PSM model. Investigating the impacts of farmers regarding their production factors is of great significance for the study of the joint development of the labor force and land factors.
Based on the above, the contribution of this study mainly is that we have estimated the impacts of rural households’ with farmland transfer-in and farmland transfer-out on households’ total income in the case of the elimination of bias coming from the change of households’ income when they do not transfer farmland, and further explored the difference in changes in income structure of different types of rural households after they transferring-in or transferring-out farmland based on detailed micro-data, which fills the gap that the current research fails to reasonably and accurately guide different types of rural households to carry out farmland transfer [10,24,25,26], and also provides a reference for guiding the farmland transfer of different types of rural households reasonably in such areas for main grain production and food-commodity supply. The remainder of this paper is structured as follows. Section 2 describes the theoretical framework and research hypotheses about the changes in income structure between households with transferring-in farmland and transferring-out farmland. Section 3 displays the source of data, the descriptive analysis of variables as well as the introduction of the empirical model (Propensity Score Matching model). Empirical results of the model are presented in Section 4, and Section 5 presents the discussion for the results, whereas Section 6 concludes with a summary of our main findings and a discussion of policy implications.

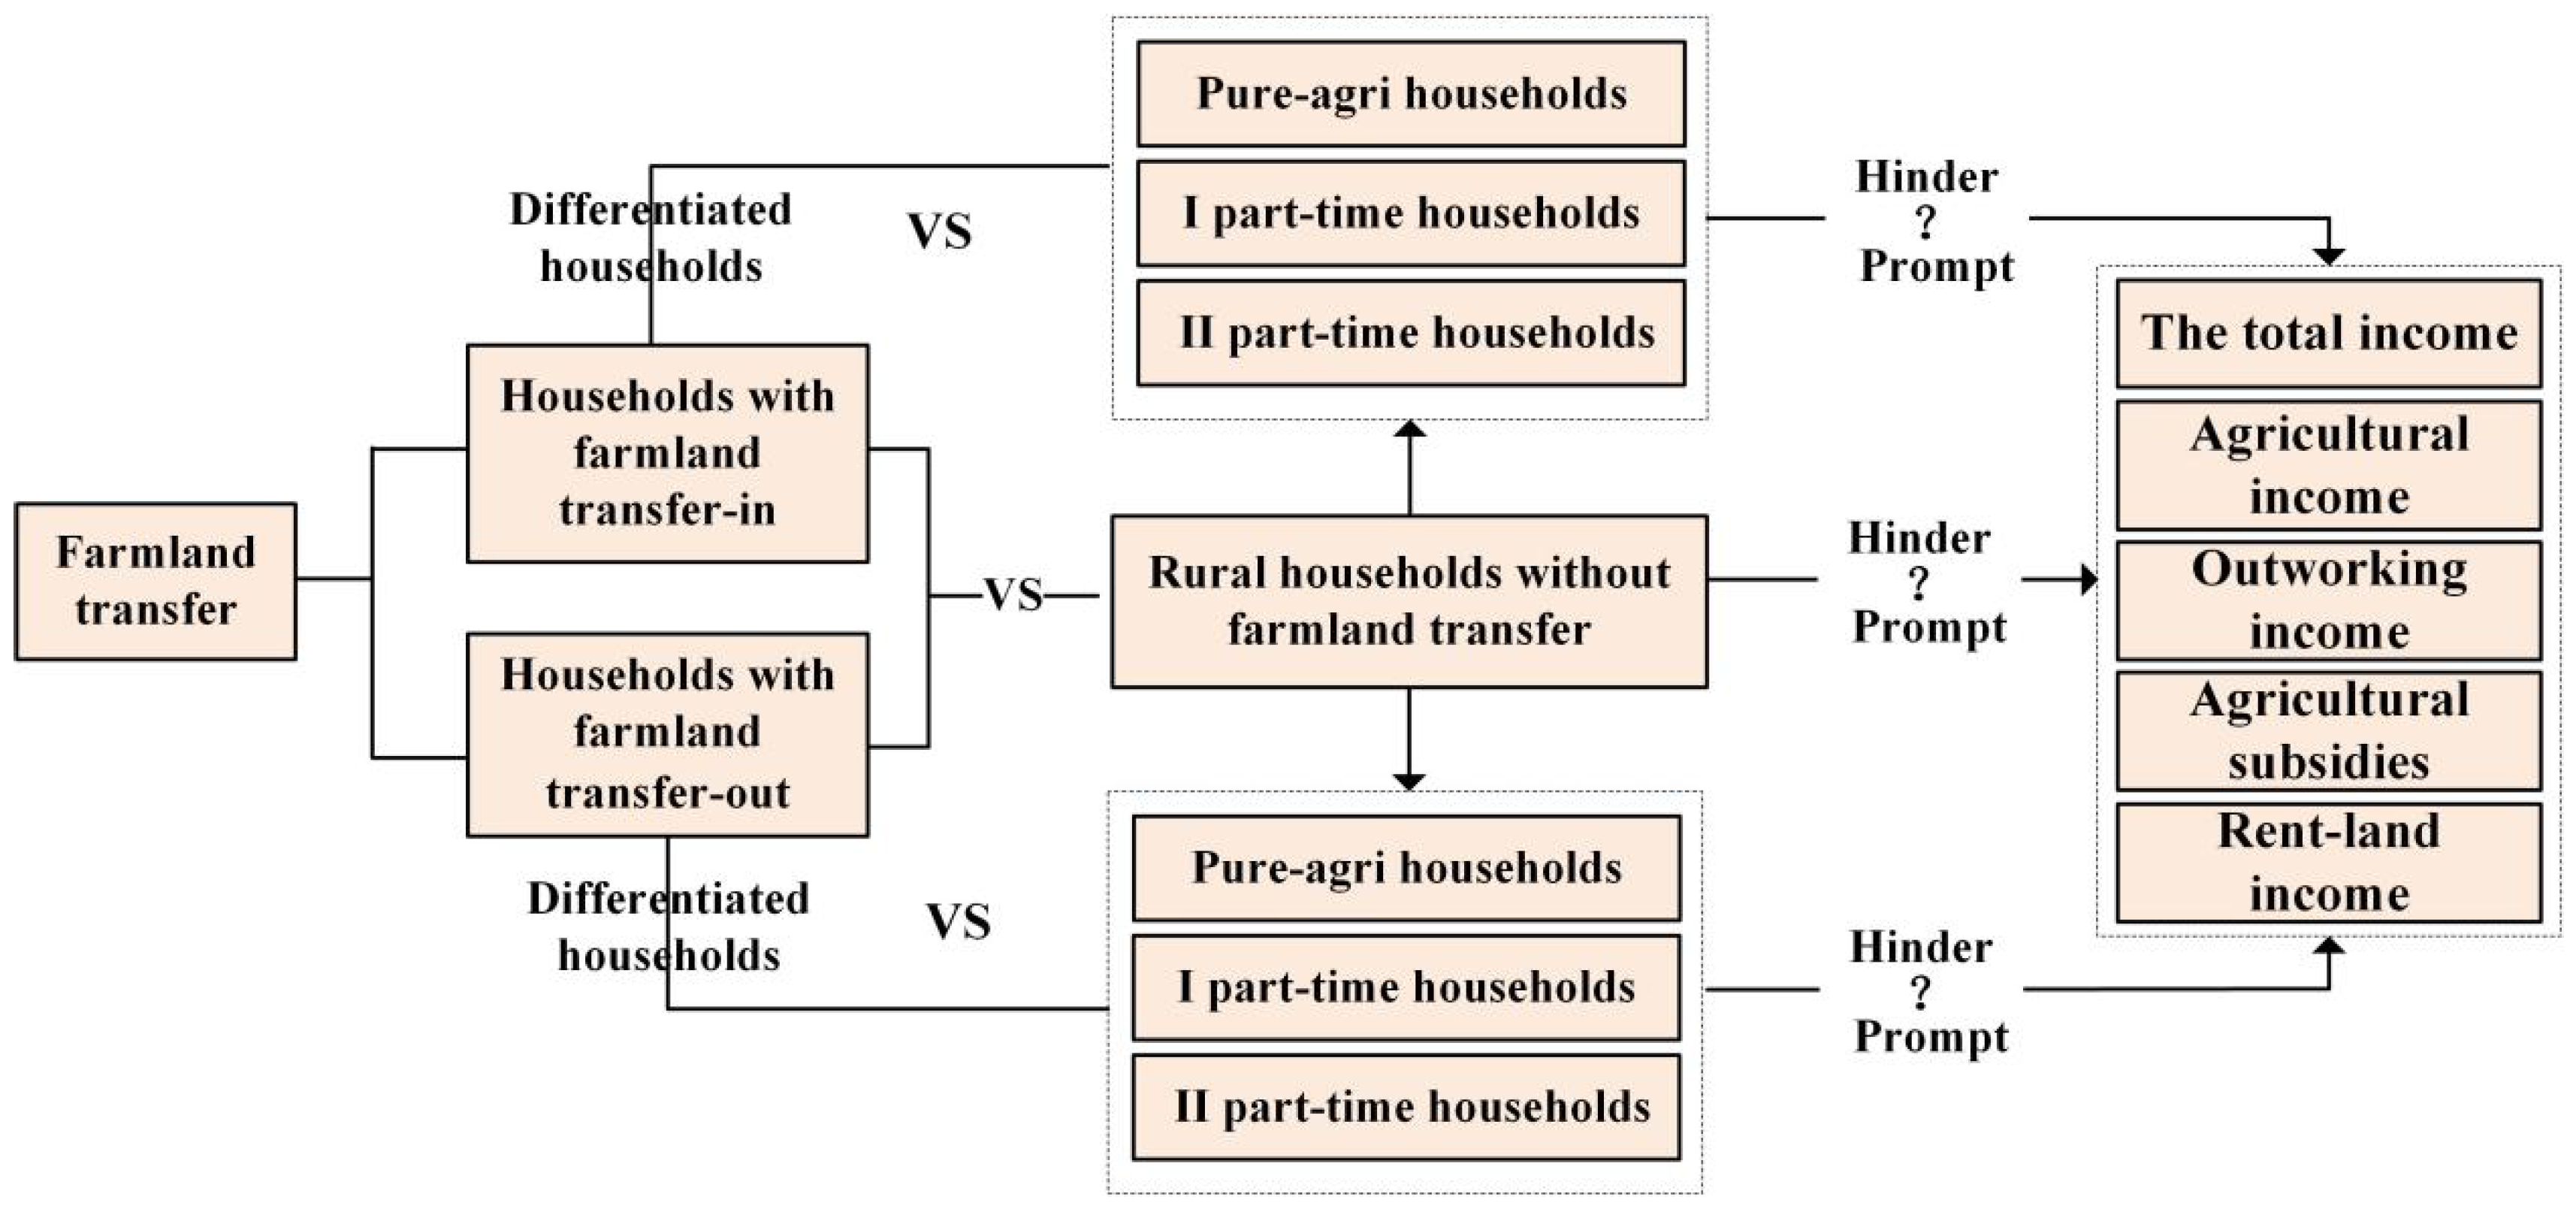
2. Theoretical Analysis and Research Hypotheses

Due to differences in the original state of agricultural operations and the stability of non-agricultural income, different rural households will make different decisions to transfer farmland [11], and also will obtain different agricultural productivity and agricultural income after transferring-out or transferring-in farmland [22,26]. Firstly, pure-agricultural households generally have large-scale farmland and rich agricultural production experience, and invested enough time and energy in agricultural production, and may be more inclined to transfer farmland in and expand production scale to optimize their endowment to maximize profits [31]. Empirical studies show that the application of organic fertilizer in some households has increased significantly compared to households with small-scale farmland after they expanding the size of their farmland by farmland transfer, which not only decreased the production cost, but also increased the agricultural production [32]. Meanwhile, small-scale households are reluctant to apply technology, and the expansion of farmland scale leads to more family resource inputs to agricultural production, increasing agricultural income [33]. While if they transfer their farmland out, more labor will be allocated to non-agricultural employment, leading to increase the non-agricultural income, but the surplus-labor might not be engaged in non-agricultural employment on time because of lacking non-agricultural employment experience, which is likely to lead to a decrease in total household income. Secondly, Ranis and Fei pointed out that the labor whose agricultural production efficiency is not zero but is lower than the non-agricultural wage will be absorbed by the modern industrial sector, and if the agricultural production efficiency is not improved accordingly, then agricultural production will be negatively affected [34]. Because I part-time labor conduct agricultural work seasonally and spend the rest of their time on non-agricultural work, which will further lower production efficiency, thus they would be likely to transfer their farmland out, engaging labor in the non-agricultural sector, which could subsequently increase outworking and rental-land incomes whilst decreasing the agricultural income. However, the less stability rural households have—for the non-employment—the less likely they will be to transfer their farmland out [35,36]. Thus, they may be worried that unstable non-agricultural income might enough to support them to completely separate from the farmland and live in the urban [16,37,38]. Meanwhile, also because of this, the non-agricultural income they may get is not very high even if they transferred farmland out. Because a rational household will naturally adjust farmland resources based on the principle of households’ utility maximization [39,40]. As a result, they would not transfer farmland out or even transfer it in, and their non-agricultural income can be re-invested in agricultural production and used to expand their farmland scale. Theoretically, with a farmland size increase, they would increase agricultural inputs—such as fertilizers, pesticides, or agricultural machinery—which could significantly contribute to their agricultural and total incomes, thereby promoting farmland productivity [26,41,42,43,44]. Lastly, because the non-agricultural income is the main source of the total households’ income, II part-time rural households are less dependent on farmland than I part-time households due to the fact of a more stable non-agricultural employment. They do not expect to increase income through agricultural production to a large extent [45,46]; thus, they are more likely to transfer their farmland out, which would allow them to spend more time and energy on their non-agricultural employment, thereby making more outworking income as well as some rental-land income eventually increasing their total income. Moreover, many studies also have proved that less efficient farm households that are more successful in non-agricultural employment can gradually opt-out of agriculture by renting out their land, thus increasing off-farm income [2,47]. Nevertheless, there might also be another situation with relatively small probability, where II part-time rural households might re-invest outworking income into agricultural production and further transfer some farmland in, expanding the scale of the farmland and increasing the agricultural income and subsidies received, but this cannot make up the decrease in outworking income due to the reduction of time and energy spent on non-agricultural employment, eventually decreasing the total income.
Based on the above, the farmland transfer-in and transfer-out have different impacts on three types of rural households. Therefore, the present study aimed to test the following hypotheses:
Hypotheses (H1).
The total income of all rural households who transferred-in their farmland will increase because the increase in agricultural income and subsidies will overcome the decrease in outworking income. Conversely, the total income of all rural households who transferred-out their farmland will decrease because the increase in the outworking and rental-land incomes will be lower than that in the agricultural income and subsidies.
Hypotheses (H2).
Pure-agricultural households transferring-in their farmland will increase their total income by expanding the farmland scale and obtaining more agricultural income and subsidies, while non-agricultural income will decrease. However, the total income of pure-agricultural households transferring-out their farmland will decrease because of the reduction of the agricultural income and subsidies, while rental-land will increase, and non-agricultural income has hardly changed.
Hypotheses (H3).
Both farmland transfer-in or transfer-out by I part-time rural households will increase the total income. If participating in farmland transfer-in, I part-time rural households will increase their agricultural income and subsidies whilst decreasing the non-agricultural income. Conversely, if participating in farmland transfer-out, their agricultural income and subsidies will decrease while the outworking and rental-land incomes will increase.
Hypotheses (H4).
II part-time rural households participating in farmland transfer-out will increase the total income because of the increase of their outworking and rental-land incomes. Conversely, II part-time rural households transferring-in their farmland will increase their agricultural income and agricultural subsidies, yet not making up for the decrease in the outworking income and the eventual decrease in the total income.

3. Materials and Methods
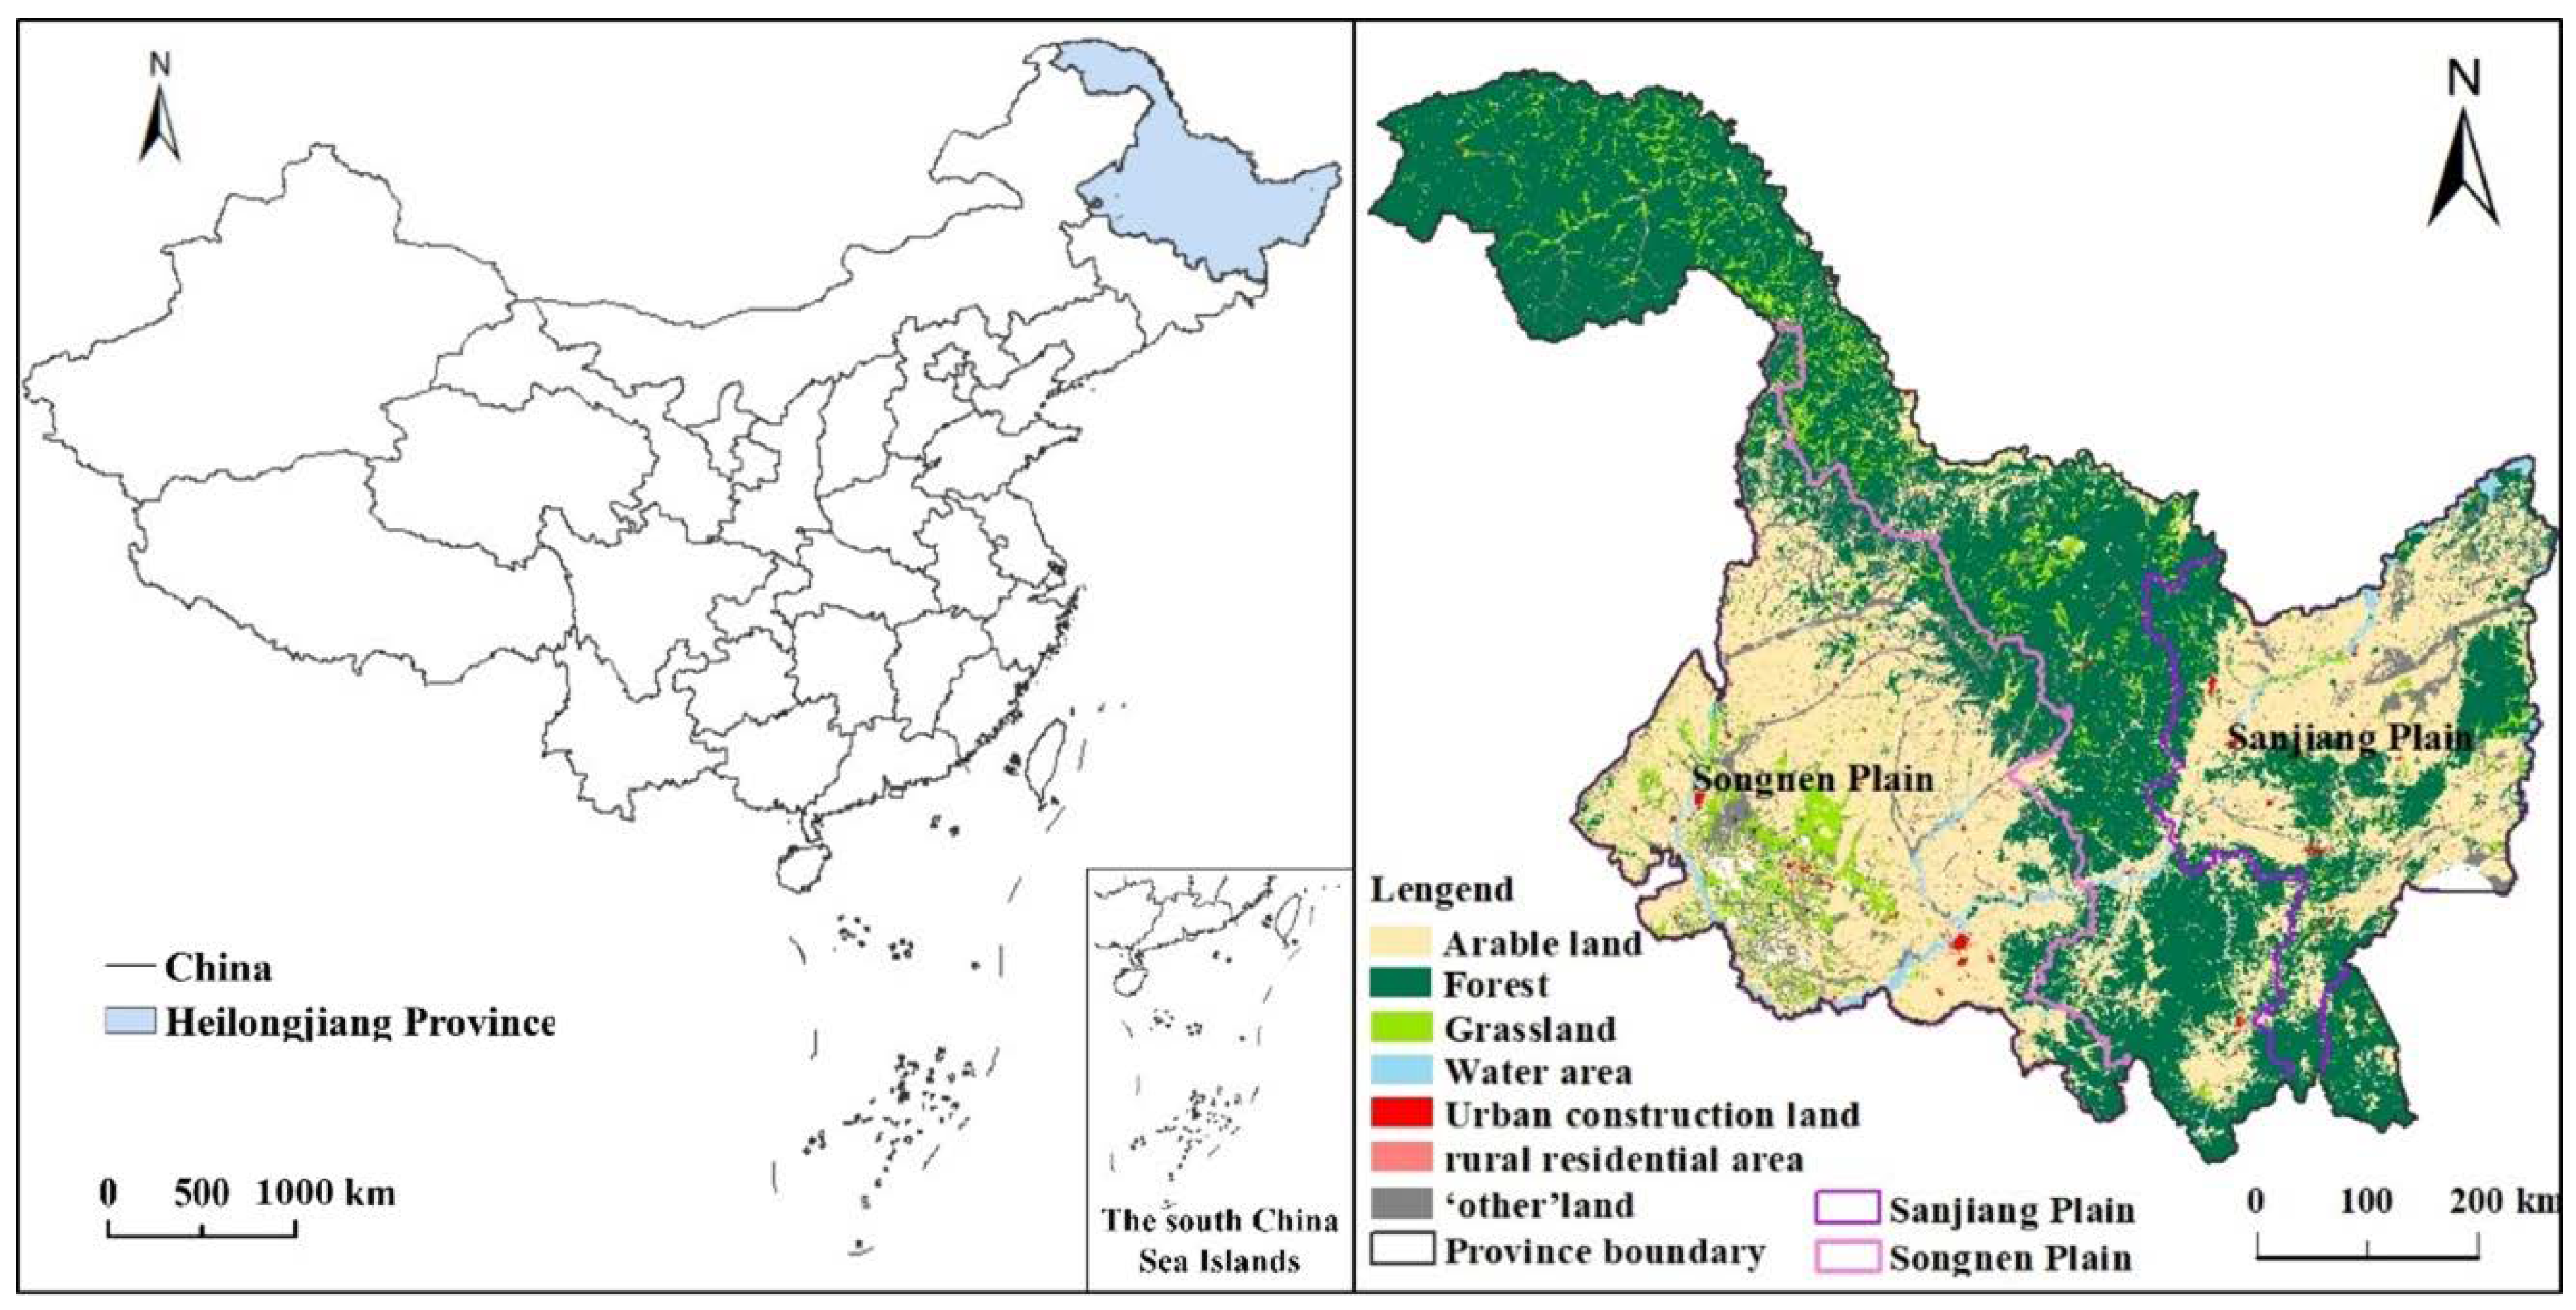
3.1. Study Area

The Heilongjiang province—located in the north-eastern part of China (Figure 1)—has a cultivated land area of 1.59 million km2, that is, 11.7% of cultivated land in the whole country; it is regarded as a particularly important place in China for grain production and food-commodity supply, playing a vital role in safeguarding national food security. In this context, the Overall Program for the Comprehensive Reform of Modern Agriculture in the "two Great Plains" of the Heilongjiang province promulgated in 2013, aiming to improve agricultural production, guard food security, and increase farmers’ income, addressed that farmland transfer is an important way for improving the income of rural households. Therefore, the exploration of the relationship between farmland transfer and households’ income—and, subsequently, the rational guidance of the farmland transfer—is an essential step for national food security and social stability of China.

3.2. Data Sources and Descriptive Statistics

The study data were derived from the Rural Fixed Observation Point Survey of the Heilongjiang province in 2014, which covered more than 1000 households distributed in 14 villages located in the study area. The Rural Fixed Observation Point Survey was established in 1984, guided by the policy research office of the central committee of the communist party of China and the ministry of agriculture and rural affairs of the People’s Republic of China, which was established by the state to conduct a long-term monitoring survey on rural households and rural development issues. All survey samples include more than 360 villages and more than 24,000 rural households, covering 346 counties (cities, districts) in 31 provinces (regions, cities) across the whole country. The annual regular survey indicators include nearly 2000 items, involving many aspects of rural economy and society, and it is very representative to reflect the micro problems of households. According to the criteria of rural-household differentiation in the Rural Fixed Observation Point Office of the Ministry of Agriculture, that is, rural households whose agricultural income accounts for more than 80% are classified as pure-agricultural households, and those with agricultural income accounting for 50% to 80% of total income are classified as I part-time rural households, and those with agricultural income accounting for less than 50% are classified II part-time rural households. Meanwhile, rural households participating in farmland transfer are divided into farmland transfer-in households (renting the farmland to other households or economic organizations) and transfer-out households (taking over this leased farmland from other households). Meanwhile, according to the income structure, the households’ total income was divided into four types: agricultural income, outworking income (from non-agricultural employment), subsidy income (from government incentives and subsidies for agricultural production), and rental-land income (from farmland lease, farmland shareholding, and farmland exchange). We tried to compare changes in the total income between rural households who transferred their farmland either in or out, as well as to investigate the mechanisms underlying the impacts of farmland transfer on the income structure of different households based on the PSM model, and the detailed research framework is shown in Figure 2.
By eliminating the abnormal data of indicators needed in this study, we finally selected 484 households who did not transfer their farmland, and 304 who transferred their farmland; of these last, 178 and 126 were transferred-in and transferred-out, respectively. In terms of household type, our sample included 259 pure-agricultural, 119 I part-time, and 106 II part-time rural households.
Table 1 summarizes the average annual income structures. Rural households who transferred-in their farmland had the highest total income (111,394¥), followed by rural households who did not transfer their farmland (62,109¥) and rural households who transferred-out their farmland (39,522¥). Comparing the total income of different types of rural households not participating in farmland transfer, the pure-agricultural households had the highest income (69,040¥), followed by I part-time (57,149¥) and II part-time households (51,441¥).
Comparing the income structure in different types of rural households, four noteworthy features have been identified:
(1)
Rural households who transferred-in their farmland had the highest annual average agricultural income (94,180¥) followed by rural households who did not transfer their farmland (46,927¥) and rural households who transferred-out their farmland (0¥, since they did not conduct any agricultural production). Moreover, pure-agricultural households had the highest income (63,971¥), followed by I part-time (34,465¥) and II part-time households (19,271¥).
(2)
Rural households who transferred-out their farmland had the highest annual average outworking income (26,286¥), followed by households who did not transfer their farmland (11,273¥) and households who transferred-in their farmland (8455¥). Among the different types of rural households who did not transfer their farmland, II part-time households had the highest outworking income (33,403¥), followed by I part-time (13,564¥) and pure-agricultural households (1164¥). Moreover, the outworking income of rural households who transferred-out their farmland is 7117¥ lower than II part-time households’ income; this is the primary reason why the total income of rural households who transferred-out their farmland is lower than rural households who did not transfer it.
(3)
Rural households who transferred-in their farmland had the highest subsidy income (3991¥). The difference in the annual average subsidy between rural households who transferred-out their farmland (2347¥) and those who did not transfer it (2212¥) was negligible (135¥). In addition, pure-agricultural households had the highest annual average subsidy (2653¥) among different rural households who did not transfer their farmland, followed by II part-time (2101¥) and I part-time households (1256¥).
(4)
Only the rural households transferring-out farmland had a rental-land income (10,177¥).
Further, it is worth noting that farmland transfer is a “self-selection”; thus, the statistical differences of all the indicators shown in Table 1 might not be the results of farmland transfer only, but they might have been influenced by other factors. Therefore, we need to objectively consider the results in Table 1 and to perform a causal analysis to test the impacts of farmland transfer on households’ income structures.

3.3. Propensity Score Matching Model

The households’ decision to participate in farmland transfer is not completely random, yet closely related to the different characteristics of the households themselves (a virtual endogenous variable), which would imply selection bias [18,48,49]. Nevertheless, the PSM model based on a counterfactual analysis framework can deal with such bias [50,51,52]. The counterfactual analysis framework concerning the impacts of farmland transfer on households’ income structures is a comparison between the factual and counterfactual results [53].
First, the factual result is based on the actually observed income of farmland-transferring households in order to extrapolate a first expected income, whereas the counterfactual result is based on the hypothetical income of farmland-transferring households if they would not participate in farmland transfer to calculate a second expected income; then, the impacts of farmland transfer on rural households’ income can be obtained by comparing the two expected incomes. Second, the central “matching” idea of the PSM model is to use a control group to emulate a randomized experiment. The matching involves treatment units and comparison units, turning them into observable characteristics except for the selection of farmland transfer. Thus, the samples of rural households without farmland transfer behaviors are taken as the control groups and used to simulate the “counterfactual situation” of rural households participating in farmland transfer.
The specific steps of the PSM model based on the counterfactual analysis framework are the following:
(1)
Covariates selection: Relevant variables likely affecting the households’ decision-making process of farmland transfer were included to ensure the validity of the conditional independence assumption). Related factors were selected as covariates, namely rural households who contracted farmland areas (CL), household laborers (LA), agricultural productive fixed assets (APFA), non-agricultural productive fixed assets (NAPFA), and the education level of the rural householder (ELHH).
(2)
Propensity scores estimation: The Logit model was used to estimate the possibility of transferring farmland of rural households (i.e., estimation of the propensity scores) [52,54].
(3)
PSM model implementation: Households who transferred-in or transferred-out their farmland were matched to those who did not participate in farmland transfer, subsequently constructing matching groups. To ensure the robustness of the matching results, we chose two kinds of matching algorithms, namely, the radius matching method and kernel matching method.
(4)
Matching quality assessment: First, because we did not condition on all covariates but the estimated propensity score, we checked whether the matching procedure could balance the distribution of the relevant variables in both the control and treatment groups [51]. Second, the common support condition, as conventionally measured, is a major source of evaluation bias [48,55]. There are two methods of estimating balancing property: the first method is to compare the situation before and after matching. If there is no systematic difference after conditioning on the propensity score, and a likelihood ratio test on the joint significance of all regressors can be performed in the Logit model and should be rejected before but after matching, meanwhile, the Pseudo-R2 may lower, which indicates matching on the score is successful; the other method consists of requiring that the standardized deviation of samples after matching cannot be greater than 20; otherwise it would imply the failure of the matching process [56].
(5)
Calculation of the average treatment effect on the treated (ATT) [57]: After having identified the matching samples using the radius and kernel matching methods, the ATT of rural households with transferred farmland can be calculated to determine the impacts of farmland transfer on their income; thus, according to the matched samples, the counterfactual result is obtained for each rural household with transferred farmland under the assumption of not transferring it. This result is then compared with the factual result calculated by the actual observable income.

4. Results

4.1. Analysis of Covariates Affecting the Households’ Decision-Making for Farmland Transfer

In this study, the Logit model was used to construct the decision-making equation of farmland transfer to compare the differences in terms of income structure among different rural households and then to calculate the propensity score. The treatment groups of the two types of equations were households with farmland transfer-in and transfer-out, whereas the control groups were households without farmland transfer. Then, each type of equation was further divided into four equations with different making-decisions processes, according to the three types of different households without farmland transfer in the control group. The control group of equation 1 comprises households without farmland transfer, while the control groups of equations 2, 3, and 4 comprise pure-agricultural, I part-time, and II part-time households, respectively.
The estimated results of decision-making equations on households’ farmland transfer using the Logit model are shown in Table 2. Firstly, the impact of covariates on the decision-making of farmland transfer showed that CL was negatively associated with the decision-making process of farmland transfer-in, yet positively associated with that of farmland transfer-out. Further, the relationship between CL and the decision-making process on farmland transfer was significantly different for the three types of different rural households. For I part-time and II part-time households, the more CL they had, the more likely they were to participate in farmland transfer; furthermore, with the same CL, II part-time households were more likely to participate in farmland transfer than I part-time households, which means to some extent that the higher the proportion of non-agricultural income, the more likely rural households were to participate in farmland transfer. Secondly, the number of LA was positively associated with the decision-making process of farmland transfer-in yet negatively associated with the decision-making process of farmland transfer-out. Comparing the three types of different rural households, the more LA they had, the more likely pure-agricultural households had, the more likely they will transfer farmland in, and less likely they will transfer farmland out; and for the other two types of rural households, the higher non-agricultural incomes and the more LA rural households had, the less likely they were to participate in farmland transfer-in or transfer-out. Thirdly, APFA had no significant relationship with the decision-making process of farmland transfer-in but it was negatively associated with the decision-making process on farmland transfer-out. While the more APFA II part-time households had, the more likely they will transfer farmland in, and less likely will transfer their farmland out. Fourthly, NAPFA either had no significant association with the decision-making process on farmland transfer, while among three types of rural households, those with the higher non-agricultural income and the more NAPFA were more likely to transfer their farmland in, meaning that II part-time households were more willing to participate in farmland transfer than I part-time households, and the latter in turn were more willing to participate in farmland transfer than pure-agricultural households. Fifthly, ELHH had no significant relationship with the decision-making on farmland transfer.

4.2. Matching Effect Estimation

Finding out whether the matched results could be used as counterfactual results requires matching effect estimation. This section mainly estimated and tested the common support of matched samples and balancing properties of matched results by adopting standardized bias, pseudo-R2, and a likelihood ratio test on the joint significance.
As shown in Table 3 and Table 4, the results of testing the region of common support of the matched samples indicate that most of the matched samples were in the region of the common support by adopting either radius or kernel matching, as well as that the proportion of lost individuals was small, meaning that the matching quality posed a few problems and could be better guaranteed.
Related research showed that the smaller the absolute value of standardized bias, the better the matching effect. The results of the testing balancing property of matched results showed that the maximum value of the average standardized bias is less than 11.4% and much less than the average standardized bias of the pre-matching group, which greatly reduces the total bias of the matched group. In addition, comparing the pseudo-R2s before and after matching, the estimation results show that pseudo-R2s after matching are fairly low, which indicates there is no obvious difference between treatment units and comparison units after matching, and the results of a likelihood ratio test on the joint significance (LR chi2 (p)) of matched groups show that it was not rejected before matching but be rejected after matching. All of these indicate the appropriateness of the matching effects, as well as that the matching results passed the balancing test.

4.3. Analysis of the Impacts of Farmland Transfer on the Income Structure of Different Rural Households

4.3.1. Results of Farmland Transfer by Differentiated Rural Households Based on the ATTs

We tested the ATTs for total, agricultural, and outworking incomes as well as for subsidies of rural households who participated in farmland transfer (Table 5). The obtained estimation results are the same after having matched with the radius and kernel matching methods, indicating that the estimation results are robust. Therefore, the average values in the following analysis had been to be adopted. Further, the standard errors of the ATT results were calculated using a 200-replication bootstrap method.
Based on Table 5, combining the income structure of rural households before farmland transfer, the changes in the income structure of different rural households after farmland transfer-in or transfer-out are estimated and some important indicators also are calculated, such as the changes in the ratios between either agricultural income or non-agricultural income and the total income (Table 6).

4.3.2. Analysis of Impacts of Farmland Transfer of Pure-Agricultural Households on the Income Structure

(1)
Impacts of farmland transfer on the income structure of all rural households
As shown in Table 5 and Table 6, compared with all rural households without farmland transfer, the total income of all rural households after participating in farmland transfer-in increased, and the ratio increased as much as 61.39% with an average increase of 38,129¥. About the income structure, the average agricultural and outworking incomes significantly increased by 39,176¥ and decreased by 3736¥, respectively, indicating that the ratio of the agricultural in total incomes increased by 10.34% while the share of non-agricultural income decreased 10.63%. In addition, agricultural subsidies also significantly increased by 1709¥ on average. However, the coefficients of the total income of all rural households who transferred-out their farmland were negatively significant at p < 0.01, indicating that the ratio of total income significantly decreased, specifically by 16.25% with an average increase of 10,094¥. Meanwhile, the agricultural income significantly decreased by 33,366¥, highlighting that the ratio of the agricultural in total incomes decreased by 49.48%. By contrast, the average outworking income increased 14,104¥, and its share increased by 30.64%. In addition, the rent-land income also significantly increased, with an average increase of 9843¥. However, a change in agricultural subsidies was not observed. Therefore, H1 is supported by empirical evidence.
(2)
Impacts of farmland transfer on the income structure of pure-agricultural households
Compared with pure-agricultural households without farmland transfer, the ratio of the total income of pure-agricultural households after farmland transfer-in significantly increased by 31.32%, with an average increase of 21,626¥. Further, agricultural income was significant at p < 0.05 or p < 0.1. The agricultural income increased by 12,341¥, but the average ratio of the agricultural and total incomes decreased by 8.49%. Conversely, the outworking income decreased by 6843¥ and its share in the total income decreased by 7.95%. In addition, the agricultural subsidies also have significantly increased by 1423¥ on average. However, the ratio of total income and the ratio of agricultural income in total income after pure-agricultural households transferring-out their farmland has significantly decreased by 27.96% and 77.50%, with an average decrease of 19,305¥ and 56,433¥, respectively. By contrast, the average share of the outworking income in households’ total income greatly increased by 53.61%, with an increase of 26,335¥. In addition, the rent-land income also significantly increased by 10,684¥. However, changes in agricultural subsidies were not observed. Therefore, empirical evidence partially confirmed the H2, because the outworking income increased significantly after their farmland transfer-out, hence the refusal of the assumption according to which the outworking income would have changed hardly. Since rural households in China often have small pieces of arable land and the actual production scale of these households is often lower than it could be [58], and some rural labor may be the surplus-labor, so they are optimally allocated when households transferring-in farmland.
(3)
Impacts of farmland transfer on the income structure of I part-time rural households
Compared with I part-time households without farmland transfer, the ratio of total income significantly increased by 56.45% after I part-time households transferring-in farmland, with an average increase of 29,038¥. Meanwhile, the coefficients of the agricultural and outworking incomes were significant at 1% level, and their shares separately increased by 22.81% and 21.59%, with an average increase of 37,811¥ and 9716¥. By contrast, the outworking income decreased by 9716¥, and its share in the total income decreased by 21.59%. In addition, agricultural subsidies did not show any significant changes. However, the coefficients of the total income after they transferring-out farmland was negative and significant at p < 0.05, showing its ratio decreased by 24.56%, with a decrease of 12,636¥. Meanwhile, the average agricultural, outworking and rent-land incomes were significant at p < 0.01. The average agricultural income decreased by 34,329¥ and its average ratio in the total income decreased greatly by 66.65%. Conversely, the average share of the outworking income and rent-land income increased by 12,823¥ and 9591¥, respectively, and the former’s ratio in the total income increased by 41.63%. As a result, empirical evidence leads to refusing the H3. In fact, it is not that both farmland transfer-in and transfer-out could increase the total income. Not all I part-time labor’s non-agricultural income can offset the loss caused by giving up agricultural production after farmland transfer, particularly for low-skilled and low-educated labor.
(4)
Impacts of farmland transfer on the income structures of II part-time households
Compared with II part-time households without farmland transfer, the ratio of the total income of II part-time households who transferring-in farmland increased by 27.80%, with an average increase of 15,889¥. Meanwhile, the average agricultural income increased by 39,654¥ and its average share in the total income increased by 46.96%, and agricultural subsidies also significantly increased by 920¥. By contrast, the outworking income decreased by 24,160¥, and its share in the total income decreased by 45.79%. While the total income and agricultural income after they transferring-out farmland separately decreased by 22,709¥ and 18,486¥, and their ratio decreased by 39.74% and 31.44%, but the rent-land income increased by 7082¥. However, inconsistently with a part of hypothesis H4, although the share of outworking income in the total income also increased by 18.68%, the average outworking income decreased by 6840¥. Therefore, empirical evidence leads to refusing the H4, because there is a clear division of labor between two generations in II part-time households, and most II part-time labor is generally undertaken by younger people who are not original participants in agricultural production, whereas the middle-aged and elderly are the mainstays of agricultural production with lower opportunity costs due to limited opportunities for outworking [59]. When they transferring-out their farmland, the middle-aged and elderly are most unlikely to be engaged in another non-agricultural employment and find a non-agricultural job. Instead, they are likely to live with young children, which will more or less affect the outworking (non-agricultural) income of the latter since they will have to take care of their parents. Consequently, the outworking income slightly decreased after II part-time households transferred their farmland out; meanwhile, due to the reduction in their agricultural activities, their agricultural incomes fell sharply.

5. Discussion

This paper answers the question of how farmland transfer of different rural households impacts the income structure, filling the gap that the current research does not analyze the changes in income structure of different types of rural households after they transferring-in or out of farmland [10,26], and also providing a scientific basis for guiding different types of rural households to carry out farmland transfer accurately for maximizing benefits of the whole society that not be documented by current research [24,25,26].
(1)
The total income significantly increased after rural households transferring-in farmland, consistently with the results of the most recent studies [10,26,28,60]. The expansion of farmland scale and the significant increase in agricultural incomes are the primary reasons. However, the increased ratio in the agricultural income of different rural households showed some differences. China is a mountainous country, with 70% of its land area being hilly. However, unlike many other districts, Heilongjiang province is a typical plain area, its farmland area is vast and the connectivity among arable land plots is high, and the level of modern mechanized agriculture is also relatively high, an appropriate management scale should be larger than that in other regions in China [61]. Moreover, a large amount of empirical experience proves that an appropriate management scale could effectively promote grain production [62,63]. Because of this, regardless of the type of households in the study area, they can increase their agricultural income after transferring-in that proved in our study. Therefore, regardless of the type of rural household in the study area, transferring-in farmland will contribute to achieving an appropriate-scale operation and forming a scale economy, saving production cost, and improving agricultural productivity, which could greatly increase the agricultural income, particularly II part-time. Because there are still stable farmers in I part-time households engaged in agricultural production, and they still can basically maintain their agricultural operations even if they transfer in arable land due to limited availability of arable land area and, where there are large family sizes, the actual scale of production may be smaller than the scale of management appropriate to the situation, especially in Heilongjiang province [61,64,65], while II part-time needs to transfer more labor working in the non-agricultural sector to be more engaged in agricultural production when they transferring-in farmland; thus, the outworking labor in II part-time households is the most affected by farmland transfer-in, as well as the one which fell the most, followed by I part-time households, and pure-agricultural households. Therefore, the increase in the total income is, from high to low: I part-time households, pure-agricultural households, and II part-time households, and it highlights that pure-agricultural and I part-time households transferring-in farmland are more suitable than II part-time households, which further could contribute to achieving the appropriate-scale management of Heilongjiang province.
(2)
Regardless of different rural households, the total income decreased after they transferring-out farmland, and the drastic decrease in the agricultural income was greater than the increase in the outworking income. The decreased ratio in the total income is, from high to low: II part-time households, pure-agricultural households, and I part-time households, the important reason is the decrease in outworking income of II part-time households while it increased in other rural households, although the agricultural income of II part-time households had the smallest reduction. As analyzed in Section 4.3.2, the key is to handle the issue of support for the elderly who have quit farming, so that II part-time households can better perform their non-agricultural work. Meanwhile, it further indicates that the urbanization peace and economic level of the study area may not be consistent with the speed of the migration of rural laborers because even the increase in non-agricultural income cannot offset the decrease in agricultural income. Related studies showed that the Heilongjiang province has the highest rate of agricultural surplus-labor among the three provinces of north-eastern China. There were 4.75 million laborer surpluses by the end of 2012, which is 60.3% of the total agricultural laborers in Heilongjiang province [66]. Therefore, promoting the non-employment of surplus-labor may greatly contribute to the increase of rural households’ total and outworking income when they transferring-out farmland. However, the promotion of farmland transfer should be a gradual process. In fact, “pure-agricultural households → I part-time households → II part-time households” reflects the process of the rural households gradually moving towards non-agriculturalization, and the strengthening of this process is inevitable in the future [67], which also indicates there are different stages of farmland transfer correspondingly, and farmland transfer needs to be further promoted. Studies show that there is a mutual feedback mechanism for land use transition and the formulation of land management policies and institutions [63], it is, therefore, important to form and adjust related policies is based on the situation of farmland transfer and non-agriculture of households in different periods, preventing farmers’ life or ecological environment problems caused by excessively promoting farmland transfer.
Interestingly, agricultural subsidies of different rural households when transferring-out farmland showed no significant changes, while it increased when households transferring-in farmland. Firstly, because the samples of transferring-in farmland and transferring-out farmland in this paper are not in one-to-one correspondence, this may also a shortcoming of this research, and how to select the samples that matching the rural households who transferring-in farmland and transferring-out needs to be further explored. Secondly, this may be related to the differences in the subjects of agricultural subsidies in different regions. Surveys show that the real targets of 69.2% of agriculture subsidies are rural households with land-contract right, are not the actual cultivator [68], although most of the policy documents stipulate that the subsidy is based on the actual planting area of grain, in practice, even if rural households with land-contract right transferred their farmland out, they still can obtain the same agricultural subsidies as before the transfer [69,70]. This could have a negative impact on rural-urban migration of surplus-labor, and may also reduce farmers’ enthusiasm for agricultural production, which is not conducive for farmers to transfer to land and form large-scale operations [26,69]. Thus, the direct subsidies for growing grain such as the Generalized System of Preference (GSP) [71] should be issued, which will help the increase of the agricultural subsidies-related income, as well as that of the total income.

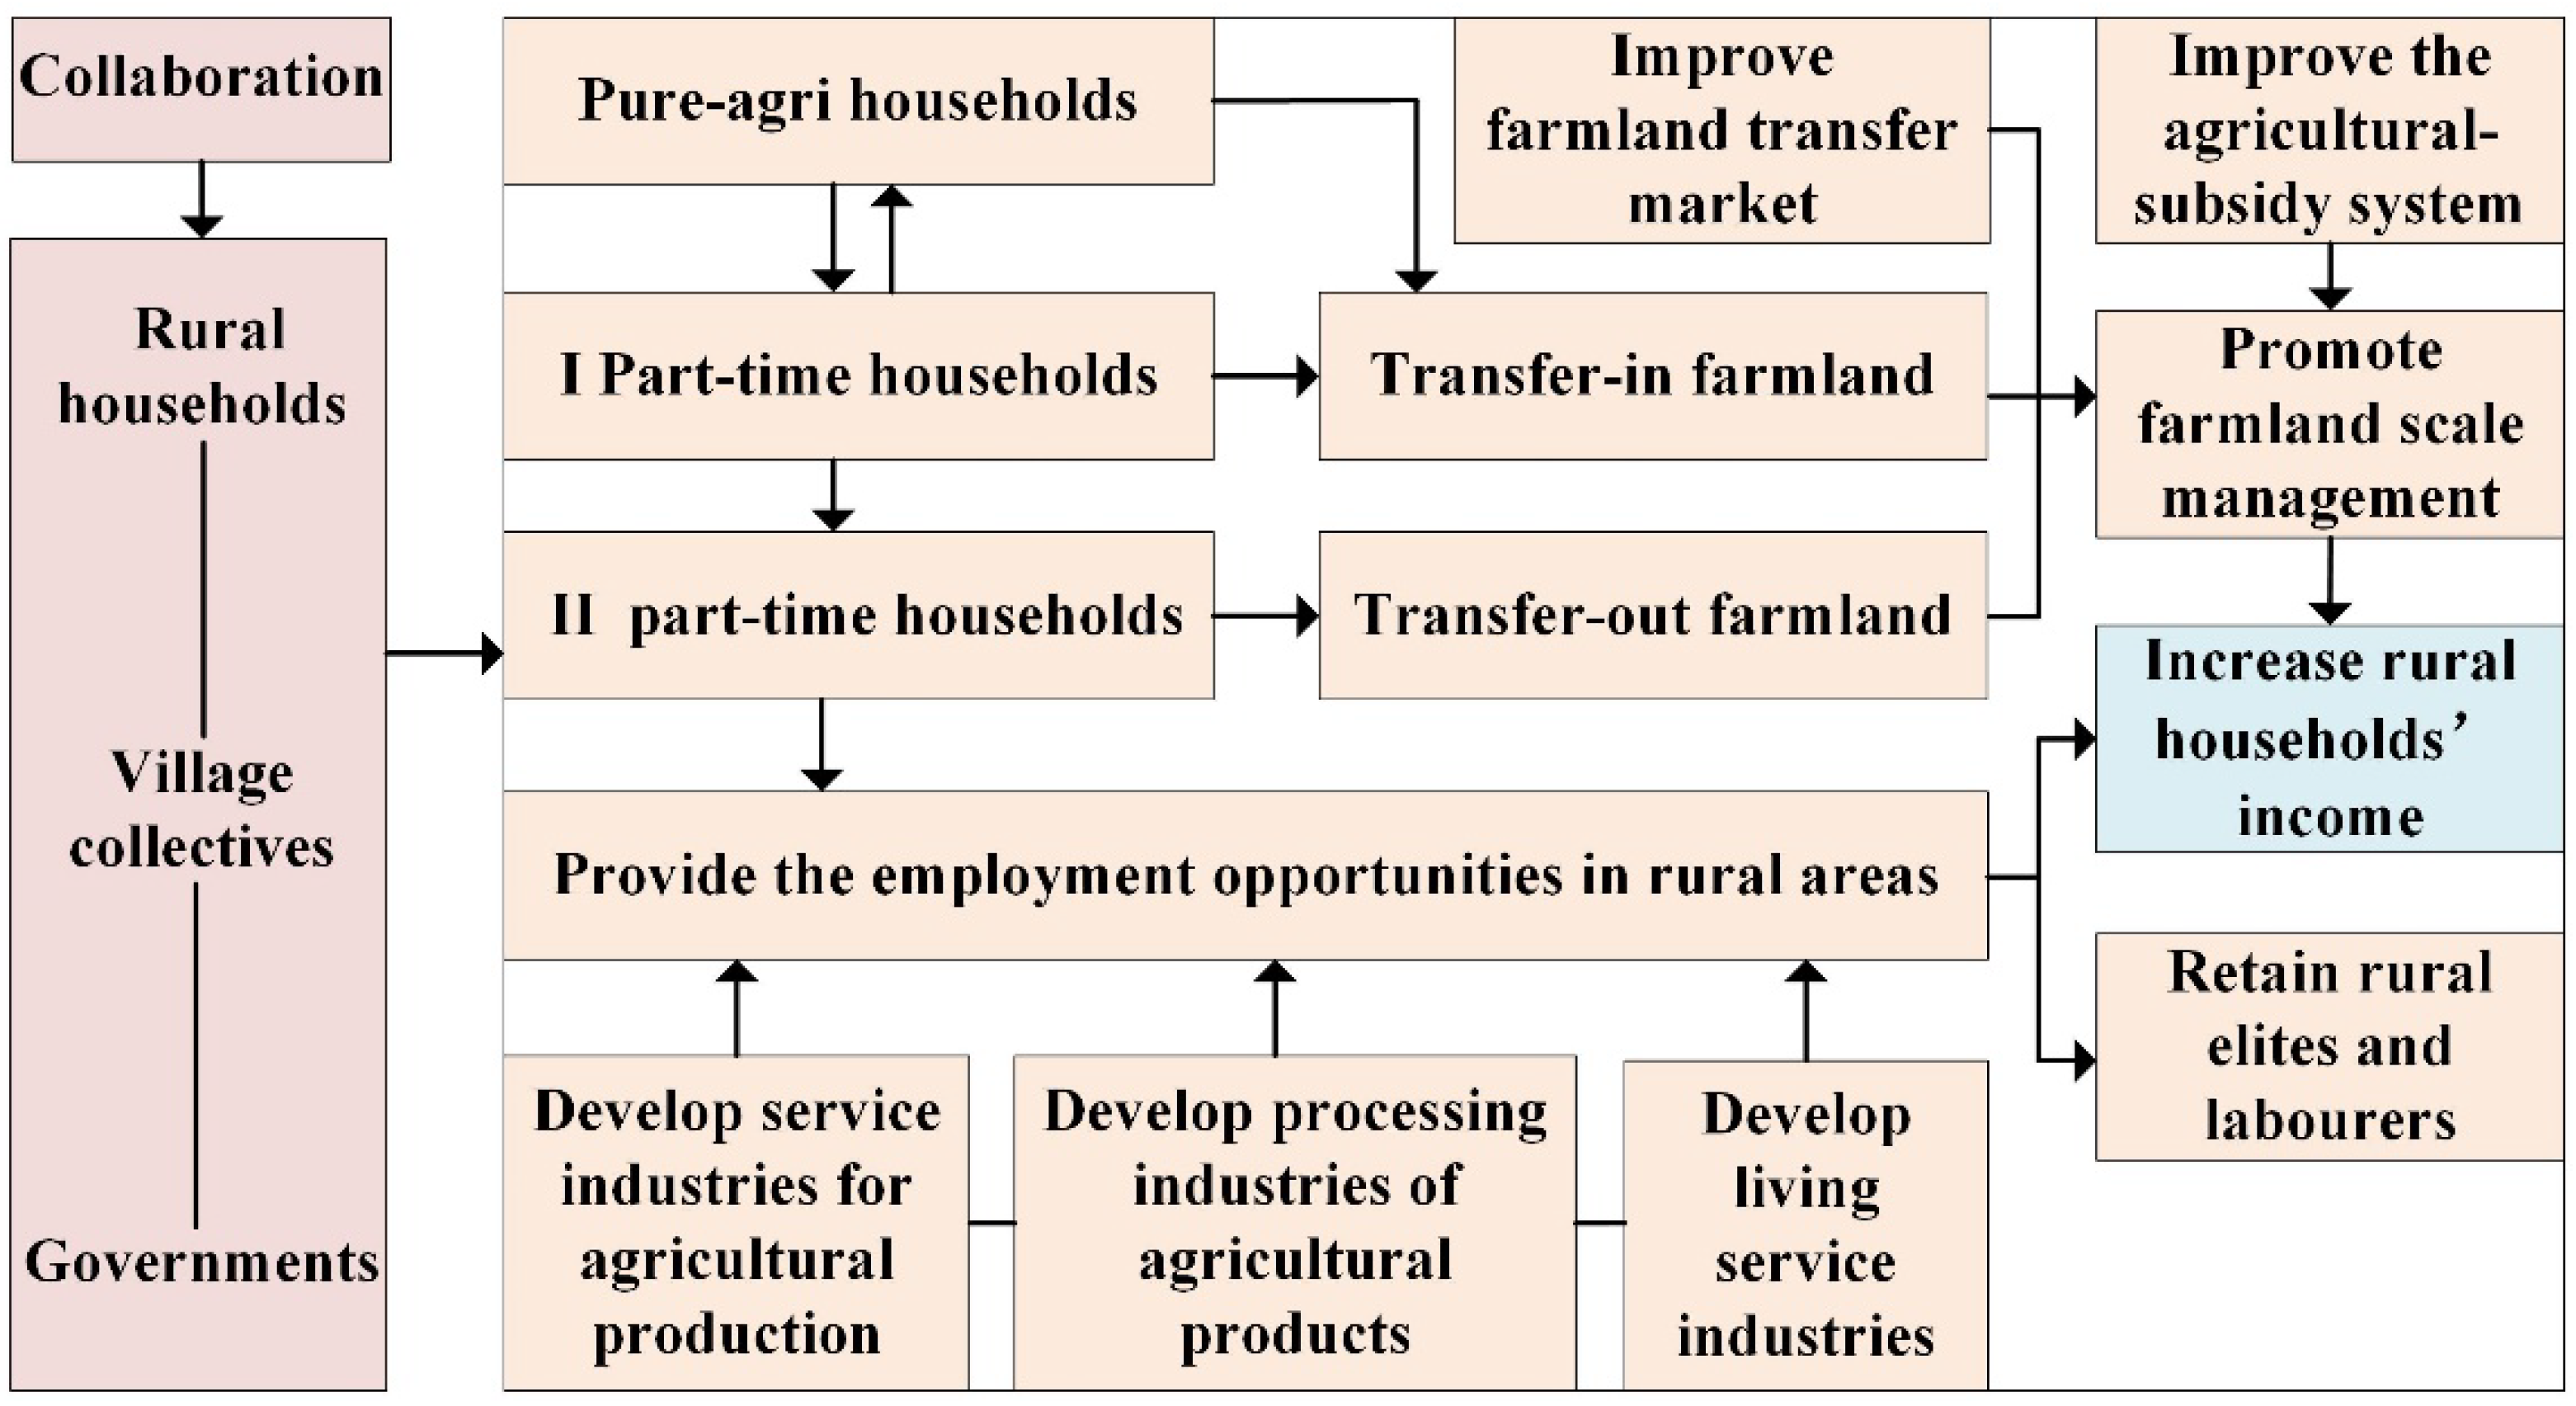
6. Conclusions and Policy Implications

The main contribution of this study lies in the inclusion of different rural households and income structures into the same framework, allowing for a thorough sectional exploration of the impacts of farmland transfer. Further, this study has introduced the PSM method based on the counterfactual analysis framework, solving the "self-selection" issues related to rural households’ farmland transfer behaviors and the subsequent potential endogenous problems and selectivity bias, and the study provides a scientific basis to reasonably plan farmland-transfer guidance of different rural households. More specifically, the paths to increase rural households’ income are summed up (Figure 3), and the major three conclusions and policy implications that have been drawn are as follows:
(1)
Promoting farmland transfer-in to pure-agricultural and I part-time households and transfer-out to II part-time households. Despite all types of rural households after farmland transfer-out will experience a decrease in households’ total income, some rural households must be prompted to transfer out of their farmland to consolidate small plots for large-scale farming, to form scale-management, to improve the overall income of farmland transfer, and to eventually boost economic growth in the entire rural area. Because the increase in the total income of II part-time households with farmland transfer-in was the smallest, while the outworking not increasing but decreasing is the main reason for the decrease in total income after II part-time households transferring-out farmland. Therefore, it is vital and reasonable to prompt II part-time households to transfer their farmland out, as well as to prompt pure-agricultural and I part-time households to transfer their farmland in, and at the meantime to develop mutual assistance for the aged in rural areas for solving the problem of taking care of the elderly who quit agricultural production and promoting II part-time labor to be better engaged in non-agricultural work.
(2)
Improving the farmland transfer market and promoting non-agricultural employment of surplus-labor need to be synchronized. No matter China or other countries, the great farmland transfer/rental market is an important condition for promoting transferring farmland and improve rural households’ income [2,3,10], and a platform providing the farmland transfer information, price assessment and negotiation guidance should be set up to reduce the cost of farmland transfer and ensure farmland transfer-out or transfer-in smoothly and fairly. When farmland can be transferred smoothly, the surplus-labor will inevitably increase. Studies show that nonagricultural employment effectively promotes the development of the farmland transfer market [35], and in turn, the development of the farmland transfer market could promote nonagricultural employment of rural labor [72]. Only combining the transformation from agriculture to non-agriculture of rural labor with promoting farmland transfer market can lower farmland fragmentation, improve agricultural productivity, and achieve agricultural modernization. The one key to promoting non-agricultural employment of rural labor is the improvement of the capacity of attracting labor in rural areas. Because rural elites are crucial actors in the transformational development of relatively successful villages [73]. Firstly, the government could provide financial supports and policy services to encourage the establishment of the agricultural products processing industry. Secondly, the village collectives could implement and assist in the establishment of agricultural production services or products processing industries. Especially after this COVID-19, it is well-known that if villages and towns can provide enough non-agricultural employment opportunities for rural surplus-labor, and a part of outflowing rural labor could be engaged in non-agricultural industries located in nearby town or villages, which not only could reduce the spread of the epidemic, but also could make the impacts of the work of outflow rural labor (most of the part-time labor) and the economy of villages and towns less affected by the epidemic. Meanwhile, different villages can selectively develop related enterprises, such as leisure tourism, health care, shared farms, and rural e-commerce (Taobao villages) according to the villages or towns’ geographical location, resource conditions, villagers’ willingness, etc. Another key to promoting non-agricultural employment of rural labor is the improvement of the welfare of migrant workers working in urban areas so that they can gradually settle down in cities or towns. The special household registration system in China is regarded as the main factor affecting the non-agricultural transformation of rural labor, where rural labor engaged in non-agricultural work in urban areas (nongmingong) cannot enjoy the same welfare and benefits as urban residents, such as education and medical resources, pension, etc. [74,75]. Similar to China, some studies in other countries show that high-wage firms, which tie pension benefits to the earnings of the worker, avoid hiring low-wage workers, as they have to offer all full-time workers the same health benefits. As a result, health insurance is mostly offered to full-time high-wage workers rather than part-time low-wage workers [39,76]. Thus, related policies and measures should be formulated to lower the conditions and improve the welfare for rural labor working in urban areas (nongmingong) entering cities and gradually settle down.
(3)
Improve the agricultural-subsidy system. The agricultural-subsidy is not only directly related to rural households’ income, but also directly affect the enthusiasm of farmers in agricultural production, further affecting food security [69,70]. Thus, build a reasonable agricultural subsidy system is of vital importance. Firstly, agricultural subsidies should be provided to farmers with actually growing grain, ensuring benefits to farmers engaged in agricultural production. Therefore, follow-up mechanisms on the distribution of agricultural subsidies could be implemented. Secondly, a flexible policy of the number of agricultural subsidies would be recommended; more specifically, since the number of agricultural subsidies depends on the farmland area cultivated by farmers, the total crops, and the market price of crops the agricultural subsidies per unit weight of the crops could be increased when the market price of crops drops and decreased when the latter rises. This could eventually incentivize subsidized agricultural management.
Although our study showed that farmland transfer has different effects on different types of rural households, and drew the paths to increase households’ income, the internal influence mechanism of farmland transfer on different types of rural households’ income is not clear, for example, the increase in agricultural income of pure-agricultural households after they transferring-in farmland, is it because the expansion of the farmland scale improves the agricultural production efficiency or is it because the agricultural production cost is reduced? And have I part-time rural households after they transferring-in farmland promoted the application of agricultural mechanization, thereby increasing the agricultural production efficiency and improving the agricultural production efficiency? These question relate to how do different types of rural households participating in farmland land, affect agricultural production technology and production materials and further affect rural households’ income need to be explored in future study.

Author Contributions

Conceptualization, L.C., C.Z., and H.C.; Data processing and Methodology, L.C. and C.Z.; Formal analysis, L.C., C.Z., and Y.L.; Funding acquisition, L.C. and H.C.; Project administration, H.C. and L.C.; Supervision, H.C.; Writing—original draft, L.C. and C.Z.; Writing—review and editing, L.C. and H.C. All authors have read and agreed to the published version of the manuscript.

Funding

This research was funded by the National Natural Science Foundation of China, grant number 51908114 and China Postdoctoral Science Foundation, grant number 2020M683149.

Institutional Review Board Statement

Not applicable.

Informed Consent Statement

Not applicable.

Data Availability Statement

Data used in this study were derived from the Rural Fixed Observation Point Survey in 2014 (http://www.moa.gov.cn/govpublic/zcggs/201911/t20191127_6332466.htm, accessed on 30 March 2021), which was guided by the policy research office of the central committee of the communist party of China and the ministry of agriculture and rural affairs of the People’s Republic of China.

Acknowledgments

Thank you to Ge Song, at Northeast University for your advice throughout this project, and thank you to Hongsheng Zhao at the University of Cambridge for writing help throughout this project.

Conflicts of Interest

The authors declare no conflict of interest.

References

  1. Ranjan, P.; Wardropper, C.B.; Eanes, F.R.; Reddy, S.M.; Harden, S.C.; Masuda, Y.J.; Prokopy, L.S. Understanding barriers and opportunities for adoption of conservation practices on rented farmland in the US. Land Use Policy 2019, 80, 214–223. [Google Scholar] [CrossRef]
  2. Jin, S.; Jayne, T.S. Land Rental Markets in Kenya: Implications for Efficiency, Equity, Household Income, and Poverty. Land Econ. 2013, 89, 246–271. [Google Scholar] [CrossRef]
  3. Kijima, Y.; Tabetando, R. Efficiency and equity of rural land markets and the impact on income: Evidence in Kenya and Uganda from 2003 to 2015. Land Use Policy 2020, 91, 91. [Google Scholar] [CrossRef] [Green Version]
  4. Do, Q.; Iyer, L. Land Titling and Rural Transition in Vietnam. Econ. Dev. Cult. Chang. 2008, 56, 531–579. [Google Scholar] [CrossRef] [Green Version]
  5. Mwesigye, F.; Matsumoto, T.; Otsuka, K. Population pressure, rural-to-rural migration and evolution of land tenure institutions: The case of Uganda. Land Use Policy 2017, 65, 1–14. [Google Scholar] [CrossRef] [Green Version]
  6. Gao, J.; Song, G.; Sun, X. Does labor migration affect rural land transfer? Evidence from China. Land Use Policy 2020, 99, 105096. [Google Scholar] [CrossRef]
  7. Zhou, C.; Liang, Y.; Fuller, A. Tracing Agricultural Land Transfer in China: Some Legal and Policy Issues. Land 2021, 10, 58. [Google Scholar] [CrossRef]
  8. Ye, J. Land Transfer and the Pursuit of Agricultural Modernization in China. J. Agrar. Chang. 2015, 15, 314–337. [Google Scholar] [CrossRef]
  9. Ma, L.; Long, H.; Tu, S.; Zhang, Y.; Zheng, Y. Farmland transition in China and its policy implications. Land Use Policy 2020, 92, 104470. [Google Scholar] [CrossRef]
  10. Mao, P.H.; Xu, J. Agricultural land system, the transfer of land management rights and the growth of farmers’ income. Manag. World 2015, 63–74+88. (In Chinese) [Google Scholar] [CrossRef]
  11. Zhang, Y.; Halder, P.; Zhang, X.; Qu, M. Analyzing the deviation between farmers’ Land transfer intention and behavior in China’s impoverished mountainous Area: A Logistic-ISM model approach. Land Use Policy 2020, 94, 104534. [Google Scholar] [CrossRef]
  12. Cao, Y.; Zou, J.; Fang, X.; Wang, J.; Li, G. Effect of land tenure fragmentation on the decision-making and scale of agricultural land transfer in China. Land Use Policy 2020, 99, 104996. [Google Scholar] [CrossRef]
  13. Wang, Y.; Yang, Q.; Xin, L.; Zhang, J. Does the New Rural Pension System Promote Farmland Transfer in the Context of Aging in Rural China: Evidence from the CHARLS. Int. J. Environ. Res. Public Health 2019, 16, 3592. [Google Scholar] [CrossRef] [Green Version]
  14. Yuan, X.; Du, W.; Wei, X.; Ying, Y.; Shao, Y.; Hou, R. Quantitative analysis of research on China’s land transfer system. Land Use Policy 2018, 74, 301–308. [Google Scholar] [CrossRef]
  15. Liu, Y.S.; Li, Y.H. Revitalize the world’s countryside. Nature 2017, 548, 275–277. [Google Scholar] [CrossRef] [PubMed]
  16. Xiao, W.; Zhao, G. Agricultural land and rural-urban migration in China: A new pattern. Land Use Policy 2018, 74, 142–150. [Google Scholar] [CrossRef]
  17. Long, H.; Tu, S.; Ge, D.; Li, T.; Liu, Y. The allocation and management of critical resources in rural China under restructuring: Problems and prospects. J. Rural. Stud. 2016, 47, 392–412. [Google Scholar] [CrossRef] [Green Version]
  18. Zhu, J.J.; Hu, J.L. Analysis on the Impact of Farmland Transfer on Farmers’ Income Distribution: Based on CHARL Data. J. Nanjing Agric. Univ. 2015, 15, 75–83. [Google Scholar]
  19. Li, Q.H.; Li, R.; Wang, Z.H. The land rental market and its welfare effects. China Econ. Q. 2012, 11, 269–288. [Google Scholar]
  20. Jin, S.; Deininger, K. Land rental markets in the process of rural structural transformation: Productivity and equity impacts from China. J. Comp. Econ. 2009, 37, 629–646. [Google Scholar] [CrossRef] [Green Version]
  21. Guo, J.P.; Qu, S.; Xia, Y.; Lv, K.Y. Income distribution effect of rural land transfer. China Popul. Resour. Environ. 2018, 28, 160–169. [Google Scholar]
  22. Xu, H.Z.; Shi, S.Q. Impact of Farmer Differentiation on Farm Households Willingness in Farmland Transference. China Land Sci. 2012, 22, 90–96. [Google Scholar]
  23. Macdonald, J.M.; McBride, W.D.; O’Donoghue, E.; Nehring, R.F.F.; Sandretto, C.; Mosheim, R. Profits, Costs, and the Changing Structure of Dairy Farming. SSRN Electron. J. 2007. [Google Scholar] [CrossRef] [Green Version]
  24. Løyland, K.; Ringstad, V. Gains and structural effects of exploiting scale-economies in Norwegian dairy production. Agric. Econ. 2001, 24, 149–166. [Google Scholar] [CrossRef]
  25. Liu, Y.; Yan, B.; Wang, Y.; Zhou, Y. Will land transfer always increase technical efficiency in China?—A land cost perspective. Land Use Policy 2019, 82, 414–421. [Google Scholar] [CrossRef]
  26. Zhang, L.; Feng, S.; Heerink, N.; Qu, F.; Kuyvenhoven, A. How do land rental markets affect household income? Evidence from rural Jiangsu, P.R. China. Land Use Policy 2018, 74, 151–165. [Google Scholar] [CrossRef]
  27. Xue, F.R.; Qiao, G.H.; Su, R.N. The effect evaluation of land transfer on farmers’ incom—Based on DID model analysis. China Rural Surv. 2011, 36–42. (In Chinese) [Google Scholar]
  28. Yang, Z.; Ma, X.L.; Zhu, P.X.; Ma, D. Land transfer and income change of peasants. China Popul. Resour. Environ. 2017, 27, 111–120. [Google Scholar]
  29. Zhu, S.E.; Yang, R.D.; Wu, B. Rural household income flow in China: 1986~2017. Manag. World 2018, 34, 63–72. [Google Scholar]
  30. Yang, L.; Zhang, X.P. Age structure, population migration and economic growth in northeast China. China Popul. Resour. Environ. 2016, 26, 28–35. [Google Scholar]
  31. Xie, H.; Lu, H. Impact of land fragmentation and non-agricultural labor supply on circulation of agricultural land management rights. Land Use Policy 2017, 68, 355–364. [Google Scholar] [CrossRef]
  32. Xu, Z.G.; Zhang, J.Y.; Lv, K.Y. The scale of operation, term of land ownership and the adoption of inter-temporal agricultural technology: An example of “straw return to soil directly. China Rural Econ. 2018, 61–74. [Google Scholar]
  33. Arslan, A.; Belotti, F.; Lipper, L. Smallholder productivity and weather shocks: Adoption and impact of widely promoted agricultural practices in Tanzania. Food Policy 2017, 69, 68–81. [Google Scholar] [CrossRef]
  34. Ranis, G.; Fei, J.C. A theory of economic development. Am. Econ. Rev. 1961, 51, 533–565. [Google Scholar]
  35. Su, B.; Li, Y.; Li, L.; Wang, Y. How does nonfarm employment stability influence farmers’ farmland transfer decisions? Implications for China’s land use policy. Land Use Policy 2018, 74, 66–72. [Google Scholar] [CrossRef]
  36. Li, H.; Zhang, X.; Li, H. Has farmer welfare improved after rural residential land circulation? J. Rural Stud. 2019. [Google Scholar] [CrossRef]
  37. Xu, Q.; Liu, J.; Qian, Y.F. Labor mobility, farmland confirmation and farmland transfer. J. Agrotech. 2017, 4–16. (In Chinese) [Google Scholar] [CrossRef]
  38. Deininger, K.; Jin, S.; Xia, F.; Huang, J. Moving Off the Farm: Land Institutions to Facilitate Structural Transformation and Agricultural Productivity Growth in China. World Dev. 2014, 59, 505–520. [Google Scholar] [CrossRef] [Green Version]
  39. Bharadwaj, L.; Findeis, J.; Chintawar, S. US Farm households: Joint decision making and impact of health insurance on labor market outcomes. Health Econ. Rev. 2013, 3, 16. [Google Scholar] [CrossRef] [Green Version]
  40. Zang, L.; Araral, E.; Wang, Y. Effects of land fragmentation on the governance of the commons: Theory and evidence from 284 villages and 17 provinces in China. Land Use Policy 2019, 82, 518–527. [Google Scholar] [CrossRef]
  41. Gray, C.L.; Bilsborrow, R.E. Consequences of out-migration for land use in rural Ecuador. Land Use Policy 2014, 36, 182–191. [Google Scholar] [CrossRef] [PubMed] [Green Version]
  42. Liu, G.; Wang, H.; Cheng, Y.; Zheng, B.; Lu, Z. The impact of rural out-migration on arable land use intensity: Evidence from mountain areas in Guangdong, China. Land Use Policy 2016, 59, 569–579. [Google Scholar] [CrossRef]
  43. Caulfield, M.; Bouniol, J.; Fonte, S.J.; Kessler, A. How rural out-migrations drive changes to farm and land management: A case study from the rural Andes. Land Use Policy 2019, 81, 594–603. [Google Scholar] [CrossRef]
  44. Maharjan, A.; Kochhar, I.; Chitale, V.S.; Hussain, A.; Gioli, G. Understanding rural outmigration and agricultural land use change in the Gandaki Basin, Nepal. Appl. Geogr. 2020, 124, 102278. [Google Scholar] [CrossRef]
  45. Hennessy, T.; Brien, M.O. Is off-farm income driving on-farm investment? Work. Pap. 2007, 13, 235–246. [Google Scholar]
  46. Damon, A.L. Agricultural Land Use and Asset Accumulation in Migrant Households: The Case of El Salvador. J. Dev. Stud. 2010, 46, 162–189. [Google Scholar] [CrossRef]
  47. Deininger, K.; Jin, S. The potential of land rental markets in the process of economic development: Evidence from China. J. Dev. Econ. 2005, 78, 241–270. [Google Scholar] [CrossRef]
  48. Locke, C.M.; Butsic, V.; Rissman, A.R. Zoning effects on housing change vary with income, based on a four-decade panel model after propensity score matching. Land Use Policy 2017, 64, 353–362. [Google Scholar] [CrossRef] [Green Version]
  49. Fei, R.; Lin, Z.; Chunga, J. How land transfer affects agricultural land use efficiency: Evidence from China’s agricultural sector. Land Use Policy 2021, 103, 105300. [Google Scholar] [CrossRef]
  50. Heckman, J.J.; Vytlacil, E.J. Chapter 71 Econometric Evaluation of Social Programs, Part II: Using the Marginal Treatment Effect to Organize Alternative Econometric Estimators to Evaluate Social Programs, and to Forecast their Effects in New Environments. Handb. Econom. 2007, 6, 4875–5143. [Google Scholar] [CrossRef]
  51. Rosenbaum, P.R.; Rubin, D.B. Constructing a Control Group Using Multivariate Matched Sampling Methods That Incorporate the Propensity Score. Am. Stat. 1985, 39, 33–38. [Google Scholar] [CrossRef]
  52. Sileshi, M.; Kadigi, R.; Mutabazi, K.; Sieber, S. Impact of soil and water conservation practices on household vulnerability to food insecurity in eastern Ethiopia: Endogenous switching regression and propensity score matching approach. Food Secur. 2019, 11, 797–815. [Google Scholar] [CrossRef]
  53. Martey, E.; Kuwornu, J.K.; Adjebeng-Danquah, J. Estimating the effect of mineral fertilizer use on Land productivity and income: Evidence from Ghana. Land Use Policy 2019, 85, 463–475. [Google Scholar] [CrossRef]
  54. Alix-Garcia, J.; Kuemmerle, T.; Radeloff, V.C. Prices, Land Tenure Institutions, and Geography: A Matching Analysis of Farmland Abandonment in Post-Socialist Eastern Europe. Land Econ. 2012, 88, 425–443. [Google Scholar] [CrossRef]
  55. Heckman, J. Instrumental Variables: A Study of Implicit Behavioral Assumptions Used in Making Program Evaluations. J. Hum. Resour. 1997, 32, 441. [Google Scholar] [CrossRef]
  56. Elizabeth, A.S. Matching methods for causal inference: A review and a look forward. Stat. Sci. 2010, 25, 1–21. [Google Scholar] [CrossRef] [Green Version]
  57. Teka, A.M.; Lee, S.-K. The impact of agricultural package programs on farm productivity in Tigray-Ethiopia: Panel data estimation. Cogent Econ. Finance 2019, 7, 7. [Google Scholar] [CrossRef]
  58. Chen, F.; Zhai, W.J. Land transfer incentive and welfare effect research from perspective of farmers’ behavior. Econ. Res. J. 2015, 50, 163–177. [Google Scholar]
  59. Huang, W.B.; Chen, F.B. Did non-farm employment inhibit land transfer?—Based on familiarity with farm work. J. Agrotech. 2020, 44–58. (In Chinese) [Google Scholar] [CrossRef]
  60. Han, X.; Zhang, A.L.; Zhu, Q.X.; Wang, K. Influence of land circulation on farmers’ income growth and household’s optimal management scale: An empirical study of Hubei and Jiangxi’s mountainous and hilly regions. Res. Agric. Mod. 2015, 36, 368–373. [Google Scholar]
  61. Chen, L.; Song, G.; Meadows, M.E.; Zou, C. Spatio-temporal evolution of the early-warning status of cultivated land and its driving factors: A case study of Heilongjiang Province, China. Land Use Policy 2018, 72, 280–292. [Google Scholar] [CrossRef]
  62. Lu, H.; Xie, H.; He, Y.; Wu, Z.; Zhang, X. Assessing the impacts of land fragmentation and plot size on yields and costs: A translog production model and cost function approach. Agric. Syst. 2018, 161, 81–88. [Google Scholar] [CrossRef]
  63. Long, H.; Qu, Y. Land use transitions and land management: A mutual feedback perspective. Land Use Policy 2018, 74, 111–120. [Google Scholar] [CrossRef]
  64. Cao, J.H.; Wang, H.Y.; Huang, X.M. Study on supply and demand willingness of rural Land transaction and evaluation of transaction efficiency. China Land Sci. 2007, 21, 54–60. (In Chinese) [Google Scholar]
  65. Chen, H.; Wang, X. Exploring the relationship between rural village characteristics and Chinese return migrants’ participation in farming: Path dependence in rural employment. Cities 2019, 88, 136–143. [Google Scholar] [CrossRef]
  66. Gao, S.; Gao, Y.; Chen, L.X. Research on the route of the rural surplus labor transferring in Northeastern area in the “limited surplus” stage. Popul. J. 2017, 39, 103–112. [Google Scholar]
  67. Zeng, J.X.; Gao, L.L.; Wang, B.; Long, W.J. Who are the Chinese professional farmers? a comparative analysis of the characteristics of the Chinese and foreign agricultural labourers. Issues Agric. Econ. 2020, 130–142. (In Chinese) [Google Scholar] [CrossRef]
  68. Zhou, M.; Hu, B.X.; Zhang, Y. The Separation of Three Rights, Contest for Agricultural Subsidies and Incentive of Agricultural Management. J. Huazhong Univ. Sci. Technol. 2019, 33, 61–68. [Google Scholar]
  69. Gale, F.H. Growth and Evolution in China’s Agricultural Support Policies; Economic Research Report 153; United States Department of Agriculture: Washington, DC, USA, 2013. [Google Scholar]
  70. Huang, J.; Wang, X.; Rozelle, S. The subsidization of farming households in China’s agriculture. Food Policy 2013, 41, 124–132. [Google Scholar] [CrossRef]
  71. Lin, G.B.; Zheng, C. The performance evaluation of the agricultural subsidy policy and the design of policy improvement in China. Rev. Econ. Manag. 2019, 35, 102–111. (In Chinese) [Google Scholar] [CrossRef]
  72. Chernina, E.; Dower, P.C.; Markevich, A. Property rights, land liquidity, and internal migration. J. Dev. Econ. 2014, 110, 191–215. [Google Scholar] [CrossRef]
  73. Li, Y.; Fan, P.; Liu, Y. What makes better village development in traditional agricultural areas of China? Evidence from long-term observation of typical villages. Habitat Int. 2019, 83, 111–124. [Google Scholar] [CrossRef]
  74. Zhou, W.; Zhao, F.; Yang, F.; Li, L. Land transfer, reform of household registration system and urbanization in China: Theoretical and simulation test. Econ. Res. J. 2017, 52, 183–197. (In Chinese) [Google Scholar]
  75. Wen, G.J.; Xiong, J. The Hukou and Land Tenure Systems as Two Middle Income Traps—The Case of Modern China. Front. Econ. China 2014, 9, 438–459. [Google Scholar]
  76. Yuan, F.; Shi, Q.H. Re-examining Inequality: Capability and Income Inequality and the Welfare of Rural Migrant Workers’. Manag. World 2013, 49–61. (In Chinese) [Google Scholar] [CrossRef]
Figure 1. The geographical location of the Heilongjiang province and its land use in 2014.
Land 10 00362 g001
Figure 2. Structure of the analysis of the impacts of farmland transfer on rural households’ income.
Land 10 00362 g002
Figure 3. The paths to increase rural households’ income.
Land 10 00362 g003
Table 1. Descriptive statistical characteristics of variables.
VariablesVariable DefinitionNo-Transfer HouseholdsTransfer-in
Households
Transfer-out
Households
Total
Samples
Pure-Agricultural
Households
I Part-Time
Households
II Part-Time
Households
OutcomesTItotal incomes (¥)62,10969,04051,44157,149111,39439,522
AIagricultural incomes (¥)46,92763,97134,46519,27194,1800
NFIoutworking incomes (¥)11,273116413,56433,403845526,286
SIsubsidy incomes (¥)221226532101125639912347
RIrental-land incomes (¥)0000010,177
CovariatesCLcontracted area (m2)23,21229,75519,14811,83418,84118,821
LAlaborers (n)2.42.32.32.62.61.7
APFAagricultural productive fixed assets (¥)17,08724,99410,401527421,2412468
NAPFAnon-agricultural productive fixed assets (¥)664689034055403726,0811746
ELHHeducation level of head of household (years)77.16.777.17.2
Note: the table refers to the average values of each type of rural households in the study area during 2014.
Table 2. Estimation results of decision-marking of equations of farmland transfer.
Variables Farmland Transfer-in EquationFarmland Transfer-out Equation
Equation 1Equation 2Equation 3Equation 4Equation 1Equation 2Equation 3Equation 4
CL–0.0104 **–0.0261 ***0.00290.0918 ***0.0217 ***–0.00040.0427 ***0.138 ***
LA0.201 **0.269 **0.281 *–0.305 *–0.836 ***–0.694 ***–0.728 ***–1.2 ***
APFA0000.0001 ***–0.0001 ***–0.0002 ***–0.0002 ***–0.0001 **
NAPFA000.0001 ***0.0001 ***000–0.0001 **
ELHH0.00410.02830.0164–0.02970.07160.09720.104–0.0133
Intercept–1.665–0.617–1.339 **–1.749 **0.1771.365 **0.3990.456
LR chi2(5)89.12 ***79.93 ***76 ***133.68 ***145.34 ***173.68 ***69.91 ***112.83 ***
Pseudo R20.11560.13530.190.35620.23390.35680.2060.3527
Note: ***, **, and * represent statistical significance at 1%, 5%, and 10%, respectively. CL, contracted farmland areas; LA, household laborers; APFA, agricultural productive fixed assets; NAPFA, non-agricultural productive fixed assets; ELHH, education level.
Table 3. Results of common support and data balancing estimation for farmland transfer-in equations.
Decision-Making EquationsMatching ApproachesEquation of Farmland Transfer-in
Common SupportPseudo R2LR chi2 (p)Standardized
Bias
Equation 1Pre-matching6620.1184.63 (0)27.6
Radius matching6560.0073.16 (0.675)8.6
Kernel matching0.0073.57 (0.613)8.9
Equation 2Pre-matching4370.1376.88 (0)34.1
Radius matching3910.0020.91 (0.969)3.8
Kernel matching0.0020.95 (0.966)3.5
Equation 3Pre-matching2970.18574.07 (0)36.2
Radius matching2720.0187.84 (0.165)11.0
Kernel matching0.0218.80 (0.117)11.4
Equation 4Pre-matching2840.358134.34 (0)43.7
Radius matching1650.0030.71 (0.982)3.4
Kernel matching0.0081.69 (0.890)6.1
Table 4. Results of common support and data balancing estimation for farmland transfer-out equations.
Decision-Making EquationsMatching ApproachesEquation of Farmland Transfer-out
Common SupportPseudoLR chi2 (p)Standardized
R2Bias
Equation 1Pre-matching6100.23084.63 (0)40.4
Radius matching5160.0023.16 (0.675)3.6
Kernel matching0.0033.57 (0.613)3.7
Equation 2Pre-matching3850.349170.08 (0)52.4
Radius matching2640.013.07 (0.689)7.4
Kernel matching0.0092.72 (0.743)6.0
Equation 3Pre-matching2450.20469.18 (0)39.1
Radius matching2220.0041.32 (0.933)5.6
Kernel matching0.0051.55 (0.907)6.5
Equation 4Pre-matching2320.353112.93 (0)49.4
Radius matching1760.0061.37 (0.928)5.4
Kernel matching0.0040.87 (0.973)4.2
Note: “Pre-matching” refers to the original samples without matching, and “Radius matching and Kernel matching” refers to the groups after matching.
Table 5. The comparison of average treatment effects on the treated (ATTs) for Propensity Score Matching (PSM) of rural households with transferring farmland.
Equations of Decision-Marking Matching Methods Equations of Farmland Transfer-InEquations of Farmland Transfer-Out
Total
Incomes
Agricultural
Incomes
Outworking
Incomes
Subsidy
Incomes
Total
Incomes
Agricultural
Incomes
Outworking
Incomes
Subsidy
Incomes
Rental-Land
Incomes
Equation 1Radius matching38,307 ***39,316 ***–3652 **1682 ***–10,080 ***–33,480 ***14,244 ***2419843 ***
Kernel matching37,951 ***39,035 ***–3819 **1735 ***–10,108 ***–33,251***13,963 ***2449843 ***
The average value38,12939,176–37361709–10,094–33,36614,1042439843
Equation 2Radius matching21,170 ***11,918 *6808 ***1417 ***–18,146 **–55,268 ***26,344 ***16110,684 ***
Kernel matching22,082 ***12,764 **6877 ***1428 ***–20,464 ***–57,598 ***26,325 ***25510,684 ***
The average value21,62612,34168431423–19,305–56,43326,33520810,684
Equation 3Radius matching29,381 ***38,098 ***–9746 ***429–12,459 **–34,147 ***12,759 ***779591 ***
Kernel matching28,695 ***37,524 ***–9686 ***354–12,813 **–34,511 ***12,886 ***489591 ***
The average value29,03837,811–9716392–12,636–34,32912,823639591
Equation 4Radius matching16,251 **39,771 ***–23,899 ***916 ***–22,637 ***–18,495 ***–6716 **2887082 ***
Kernel matching15,526 **39,537 ***–24,420 ***924 ***–22,780 ***–18,477 ***–6963 **2997082 ***
The average value15,88939,654–24,160920–22,709–18,486–68402947082
Note: ***, **, and * represent statistical significance at 1%, 5%, and 10%, respectively.
Table 6. Comparison of changes in the income structure of different rural households after transferring-in or transferring-out of farmland.
The Types of
Rural Households
The Status of Farmland TransferThe Total Income
(¥)
Changes in the Ratio of the Total Income (%)Agricultural Income (¥)Changes in the Ratio of Agri-incomes in the Total Income (%)Outworking
Income (¥)
Changes in the Ratio of Non-Agri Incomes in the Total Income (%)Agricultural Subsidies (¥)Rental-Land Income (¥)
All rural householdsWithout transfer62,109/46,927/11,273/22120
Transfer-in38,129 ***61.39 39,176 ***10.34–3736 **–10.631709 ***0
Transfer-out–10,094 *** –16.25–33,366 ***–49.4814,104 ***30.64/9843 ***
Pure-agri
households
Without transfer69,040/63,971/1164/26530
Transfer-in21,626 ***31.3212,341 **–8.49–6843 ***–7.951423 ***0
Transfer-out–19,305 ***–27.96–56,433 ***–77.5026,335 ***53.61/10,684 ***
I part-time householdWithout transfer51,441/34,465/13,564/21010
Transfer-in29,038 ***56.4537,811 ***22.81–9716 ***–21.59/0
Transfer-out–12,636 **–24.56–34,329 ***–66.6512,823 ***41.63/9591 ***
II part-time householdWithout transfer57,149/19,271/33,403/12560
Transfer-in15,889 **27.8039,654 ***46.96–24,160 ***–45.79920 ***0
Transfer-out–22,709 ***–39.74–18,486 ***–31.44–6840 **18.68/7082 ***
Note: The rows corresponding to “Farmland transfer-in” and “Farmland transfer-out” are the average values of the significant changes after farmland transfer-in or transfer-out reported in Table 5. The row corresponding to “Without farmland transfer” refers to the number of different types of income. “/” represents no data or no significant change. *** and ** represent statistical significance at 1% and 5%, respectively.
Publisher’s Note: MDPI stays neutral with regard to jurisdictional claims in published maps and institutional affiliations.

