Article

The Importance of Prevention in Tackling Desertification: An Approach to Anticipate Risks of Degradation in Coastal Aquifers

by
Javier Ibáñez
1,
Rolando Gartzia
2,
Francisco Javier Alcalá
3,4 and
Jaime Martínez-Valderrama
5,*
1
Departamento de Economía Agraria, Estadística y Gestión de Empresas, Universidad Politécnica de Madrid, 28040 Madrid, Spain
2
Departamento de Ingeniería Civil, Universidad Católica de Murcia, 30107 Murcia, Spain
3
Departamento de Desertificación y Geo-Ecología, Estación Experimental de Zonas Áridas (EEZA–CSIC), 04120 Almería, Spain
4
Instituto de Ciencias Químicas Aplicadas, Facultad de Ingeniería, Universidad Autónoma de Chile, Santiago 7500138, Chile
5
Instituto Multidisciplinar para el Estudio del Medio “Ramón Margalef”, Universidad de Alicante, Carretera de San Vicente del Raspeig s/n, 03690 San Vicente del Raspeig, Spain
*
Author to whom correspondence should be addressed.
Land 2022, 11(10), 1626; https://doi.org/10.3390/land11101626
Submission received: 1 August 2022 / Revised: 13 September 2022 / Accepted: 18 September 2022 / Published: 22 September 2022

Abstract

:
Groundwater degradation is a major issue on an increasingly hot and thirsty planet. The problem is critical in drylands, where recharge rates are low and groundwater is the only reliable resource in a context of water scarcity and stress. Aquifer depletion and contamination is a process of desertification. Land Degradation Neutrality is regarded as the main initiative to tackle land degradation and desertification. It is embedded in target 15.3 of the Sustainable Development Goals and focused on preventing these dynamics. Within this framework, we present an approach to assess risks of degradation and desertification in coastal basins with aquifers threatened by seawater intrusion. The approach utilizes an integrated system dynamics model representing the main relationships between the aquifer and an intensively irrigated area (greenhouses) driven by short- and medium-term profitability. The study area is located in a semi-arid region in Southern Spain, the Gualchos stream basin, which contains the Castell de Ferro aquifer. We found that the risk of salinization of the aquifer is 73%, while there is a 70% risk that the system would increases its demand for surface water in the future, and the chance of doubling the current demand is almost 50%. If the current system of reservoirs in the area were not able to satisfy such an increase in demand because of climate change, the basin would be at a serious risk of desertification.

1. Introduction

The vast majority of the world’s freshwater reserves are underground. Indeed, about 98–99% of total water reserves are groundwater, which amounts to about 8–10 Mkm3 of freshwater [1]. Until the 1960s, its use was limited by the technological incapability to drill deep boreholes and install pumping equipment. In that decade, however, significant advances in various scientific and technical fields (geological knowledge, well drilling, pumping technology and rural electrification) contributed to the spread of groundwater exploitation [2]. Besides its abundance, its reliability makes groundwater highly valued in drylands [1,3], where surface water is scarce and has an irregular regime. Moreover, groundwater tends to be of good quality (it requires little or no treatment), and is available where and when it is needed. This local accessibility has earned it the label of a “democratic” resource [1]. All these factors contribute to its increasing role in the water economy.
Globally, agriculture accounts for 72% of total water use [4]. The expansion of irrigated agriculture into semi-arid areas has greatly increased the reliance of irrigated crops on groundwater withdrawals [5]. These were estimated at 820 km3 yr−1 in 2018, a 19% increase relative to 2010 [6], representing around 43% of total agriculture water consumption [7]. The link between intensive agriculture and groundwater depletion seems evident since irrigated areas under stress correlate strongly with intensive groundwater use and depleting aquifers [8]. In addition, groundwater provides almost 50% of all drinking water worldwide [7], and around 2.5 billion people currently depend exclusively on groundwater as their primary source of drinking water [9].
Massive pumpings have led to a global groundwater crisis [5,9,10,11]. The evidence is mounting. For example, the water depletion observed by the Gravity Recovery and Climate Experiment (GRACE) mission shows an alarming rate of decrease in some of the largest aquifers on Earth [12,13,14], with millions of wells around the world at risk of drying up [15]. According to the first global estimate carried out by Döll and Fielder [16], groundwater recharge accounts for 32% of total water resources. Precipitation and groundwater recharge decrease as aridity increases [17]. In hyperarid areas, where groundwater bodies were formed in the geological past (hence the term fossil waters or non-renewable groundwater) [1], the recharge is virtually nil [18]. The problem is not only quantitative but also qualitative. Freshwater salinization is an emerging global problem [19] which originates from diverse anthropogenic and geological sources, including percolation of pesticides, fertilizers and other chemicals [6] and seawater intrusion in coastal aquifers [20].
Southwestern Europe is no exception to these patterns. One-third of all irrigated land in the European Union is located in Spain, where 3.8 Mha use 65% of all available water resources [21]. Between 2000 and 2016, the fraction of groundwater resources in total irrigation water increased from 4.08% to 22.4% [22] with 73% of total groundwater withdrawals (about 7 Mm3 yr−1) being used for irrigation [23]. The high profitability of the irrigated horticultural agriculture, whose products are demanded in the European markets [24,25], has led to a constant increase in the irrigation area [26]. This trend, together with the increase in the frequency and intensity of droughts in the region [27], is causing the decline and deterioration of groundwater bodies and their associated wetlands [28,29,30,31].
The Spanish Action Plan to Combat Desertification (PAND) [32] already included “Irrigated areas at risk of desertification” as one of the “desertification landscapes” (DLs) needing attention. A recent PAND update, i.e., the National Strategy to Combat Desertification in Spain [33], has added to the previous “Groundwater-dependent coastal agriculture” as a new DL.
The cross-cutting nature of desertification calls for a multidisciplinary framework to tackle it, integrating co-evolving biophysical and socioeconomic models for an effective design and implementation of groundwater policies [10,34,35]. System dynamics (SD) [36] is postulated as a suitable tool for this purpose [37], because of its capacity to represent dynamic and complex interactions between diverse factors and processes, specific to different fields of knowledge [38,39,40,41].
In previous studies, we built an early warning system (EWS) aimed at assessing the risk of desertification in Spain for all the DLs indicated by the PAND based on SD models. The approach consisted in: (i) implementing an integrated SD model for each DL, and (ii) estimating its degradation or desertification risk on the basis of Monte Carlo analyses, i.e., by simulating the model a great number of times under different parametric scenarios [42]. Now, our objective is to extend this approach to seawater intrusion in coastal aquifers driven by intensive irrigated agriculture and overpumping, one of the new DLs in Spain. To this end, we conducted our study in the Gualchos stream basin (GSB), a small basin in a semi-arid region in Southern Spain. Our findings aim to contribute to the understanding of the DL “Groundwater-dependent coastal agriculture”, and to improving the assessment of DLs in Spain.

2. Material and Methods
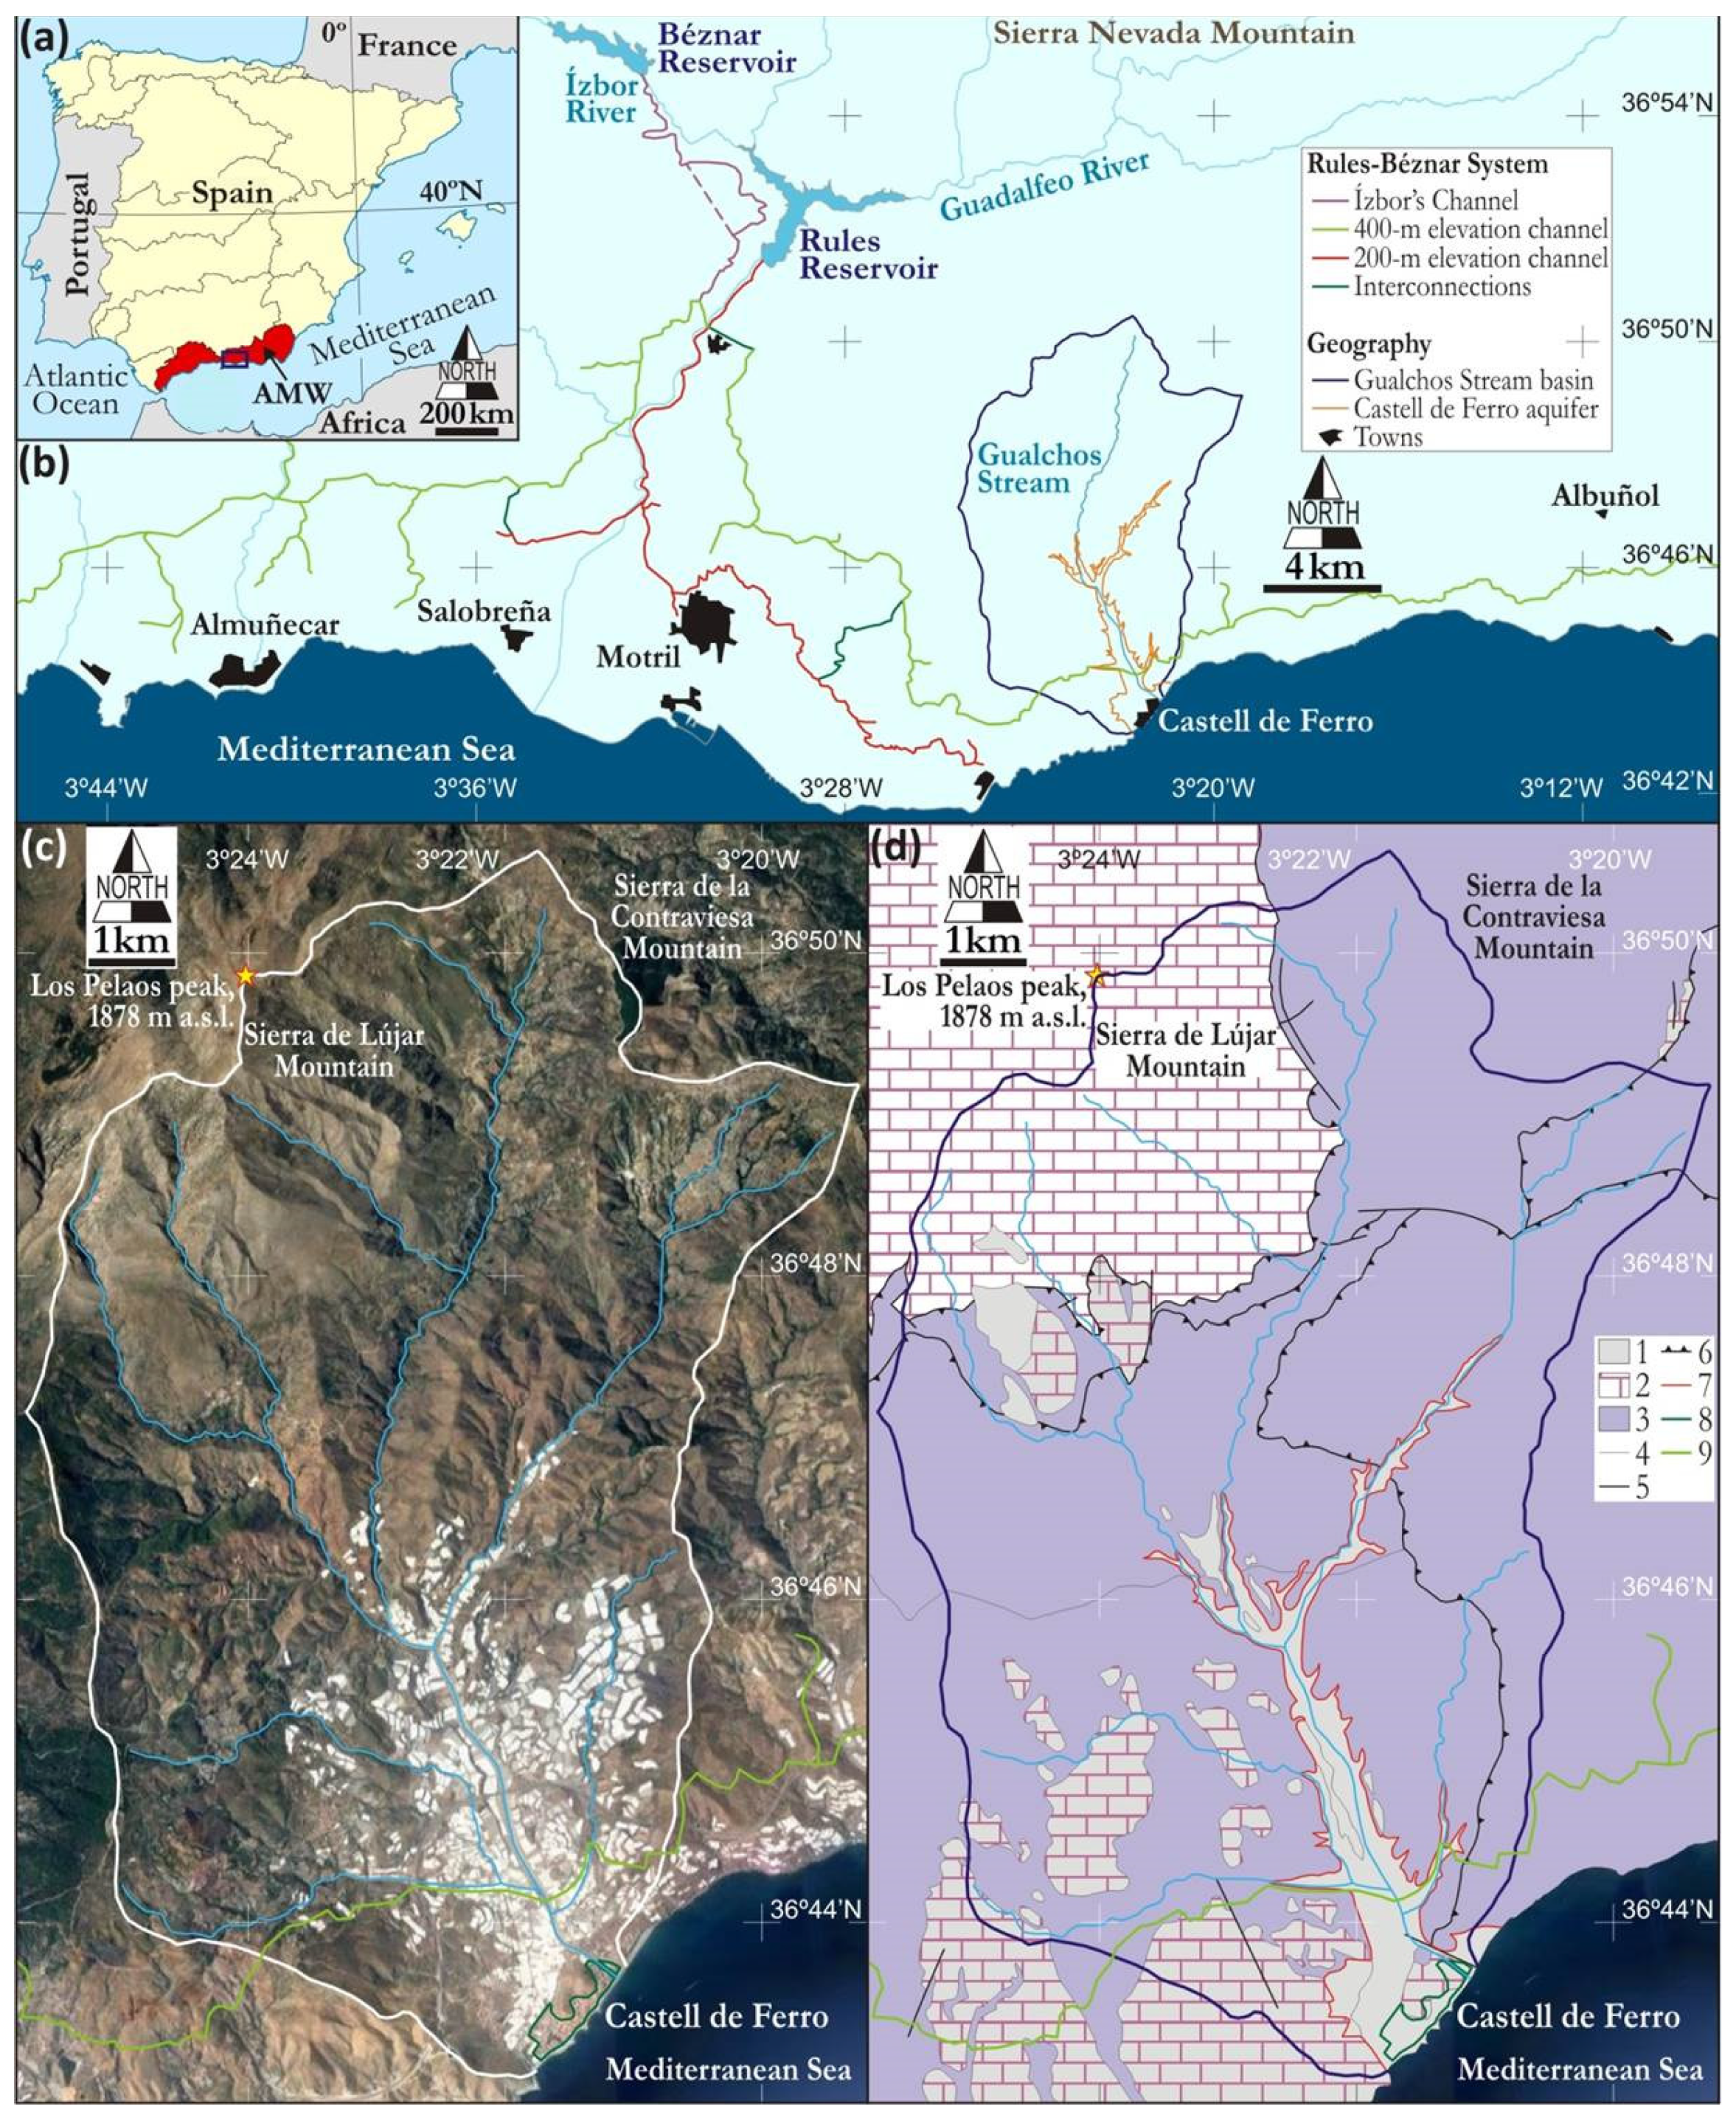
2.1. Area of Study

The coast of Granada Province, in Southern Spain, is 71 km-long (Figure 1a) and has 129,588 inhabitants [43], a figure that almost doubles during summer due to tourism [44]. This coast mainly contains ephemeral and semi-permanent rivers and streams (also called ramblas or wadis) that drain the southern slopes of coastal mountain ranges (e.g., Almijara, Guájares, Lújar, Contraviesa), with peaks of almost 1900 m above sea level (a.s.l.) [45]. The proximity of the mountains to the coastline entails steeply sloping watercourses with small plains at their mouths. The central area of the coast is occupied by the Guadalfeo River Delta. This permanent river, the only one in the area, drains the southern and southwestern slopes of the Sierra Nevada Mountains, with peaks over 3400 m.a.s.l.
Rivers and ramblas have accumulated detrital deposits, giving rise to small coastal aquifers [46] (Figure 1b). The permeability of their materials is abnormally high, leading to an underground flow velocity that is higher than what is usually found in other detrital aquifers [47]. The Castell de Ferro aquifer (CFA), whose catchment area is the GSB, is made up of sediments from the confluence of two ramblas [48] and occupies nearly 3 km2 [48] (Figure 1c,d). The maximum thickness in the CFA reaches 60 m. It is about 8.5 km-long, and its width increases from 200 m in the mid-slope area to 700 m in the low-lying area [46].
Surface runoff in the GSB is usually nil during most of the year, and only in extraordinary rainfall events does the stream flow in a torrential manner. The average annual temperature in the area is 18.9 °C, and potential evapotranspiration is 940 mm yr−1 [48]. Annual precipitation ranged between 178 and 802 mm yr−1 over the period 1980/81–2011/12, averaging 419 mm yr−1 [49]. Hence, the CFA has scarce groundwater resources, estimated at 3 Mm3 yr−1 on average. Outflows are mainly from groundwater pumping, estimated at 2 Mm3 yr–1, and groundwater discharge to the sea is estimated at 1 Mm3 yr–1 [45,50]. Groundwater salinity in the coastal sector of the CFA is high due to seawater intrusion during the dry seasons, when the lowest aquifer recharge rates and the highest groundwater pumping rates occur [48]. Groundwater salinity in the mid-slope areas and summits of the GSB is also noticeable due to a high atmospheric salinity contribution [51], resulting in a poor state of the CFA groundwater body according to the competent water authority, i.e., the Hydrological Plan of the Andalusian Mediterranean Watershed (AMW) [52].
Agricultural land uses have been highly significant in building the landscape identity of the coast of Granada [54], with its intense economic activity based on intensive agriculture and tourism. The extraordinary expansion of greenhouses has led to the disappearance of the traditional agricultural landscapes [44,55]. The origin of this land-use intensification is found in Campo de Dalías, in the Almería Province, some 50 km east of Castell de Ferro. There, field trials carried out in 1954 successfully developed a cultivation technique known as enarenado (sand plot) [56], the precursor of the modern greenhouse agriculture in the area [57]. The economic success of this intensive model, known as the “Almerian Miracle” [57,58], triggered its expansion to the nearby areas stimulated by the combination of favourable climatic conditions (mild winters and plenty of sunny hours), groundwater availability and the new scientific-technical context mentioned above.
The CFA began to be exploited for agricultural purposes in the 1970s [59]. The greenhouse area reached 452 ha in 2001, and stabilized around 631 ha in 2019 [60] (see Figure S1 in Supplementary Materials (SM)). Production is oriented to tomatoes and cucumbers, which are exported to the European markets [61]. The visual footprint of greenhouse colonization is evident (Figure 1c), as it is the impact on groundwater resources. Indeed, in the late 1980s and early 1990s, there was already evidence that the CFA was overexploited [62,63]. Pumpings lowered the water table and caused an inversion of the hydraulic gradients during most of the year, with the consequent seawater intrusion [46]. Since 1982, groundwater quality has reduced during dry periods [48]: Chloride content tripled between 1980 and 1984 [62], and in 1986, the groundwater salinity at 1 km from the coastline was practically that of seawater [46]. It was not until 1998 that a set of actions started to be considered related to the issuing of the official declaration of overexploitation [45].
The broad social support for greenhouse agriculture in the region, where it is considered a source of wealth and development [64], led to the development of infrastructures to satisfy the increasing demand for water. Nowadays, irrigation in the GSB is possible thanks to the water transfers from the Rules–Béznar System (RBS) (Figure 1b), a hydraulic infrastructure of reservoirs and channels aimed to regulate and transfer the surface water resources generated in Sierra Nevada mountains. This system has been supplying water to the areas affected by seawater intrusion in the coast of Granada since 2003. As a result, the limiting factor for the expansion of greenhouses in the GSB has been the orography of the area and not the deterioration of groundwater resources. Although drip irrigation technology reaches 85–95% efficiency in the region [65,66], the demand for larger allocations of water has not ceased [67,68,69], constituting an outstanding example of the so-called “rebound effect” [70].

2.2. System Dynamics

SD is a tool specially designed for modelling complex systems that facilitates the awareness and representation of multiple interactions among disparate but interconnected sub-systems [71]. Thus, SD is suitable to explore the long-term impacts of alternative scenarios in socioecological systems, given the looseness, or even the absence, of laws regulating its behaviour, and the relative scarcity of data that usually characterize them [72].
In essence, a SD model is a system of ordinary differential equations that makes a stock-and-flow representation of the system under study, i.e., changes in a stock variable are determined by the flows that affect it. The model’s structure as a whole, which is made up of causal feedback loops, including non-linear relationships and delays, constitutes a holistic and easily overlooked cause of its behaviour [73]. The basic output of an SD model consists of the time trajectories of all of its variables during a simulation period determined by the user (Section 3.1). This output depends on the parametric scenario under which the model is run. Thus, a common application of a SD model is to carry out “what-if” analyses where the outputs of different scenarios are compared with that of a default scenario (Section 3.2).

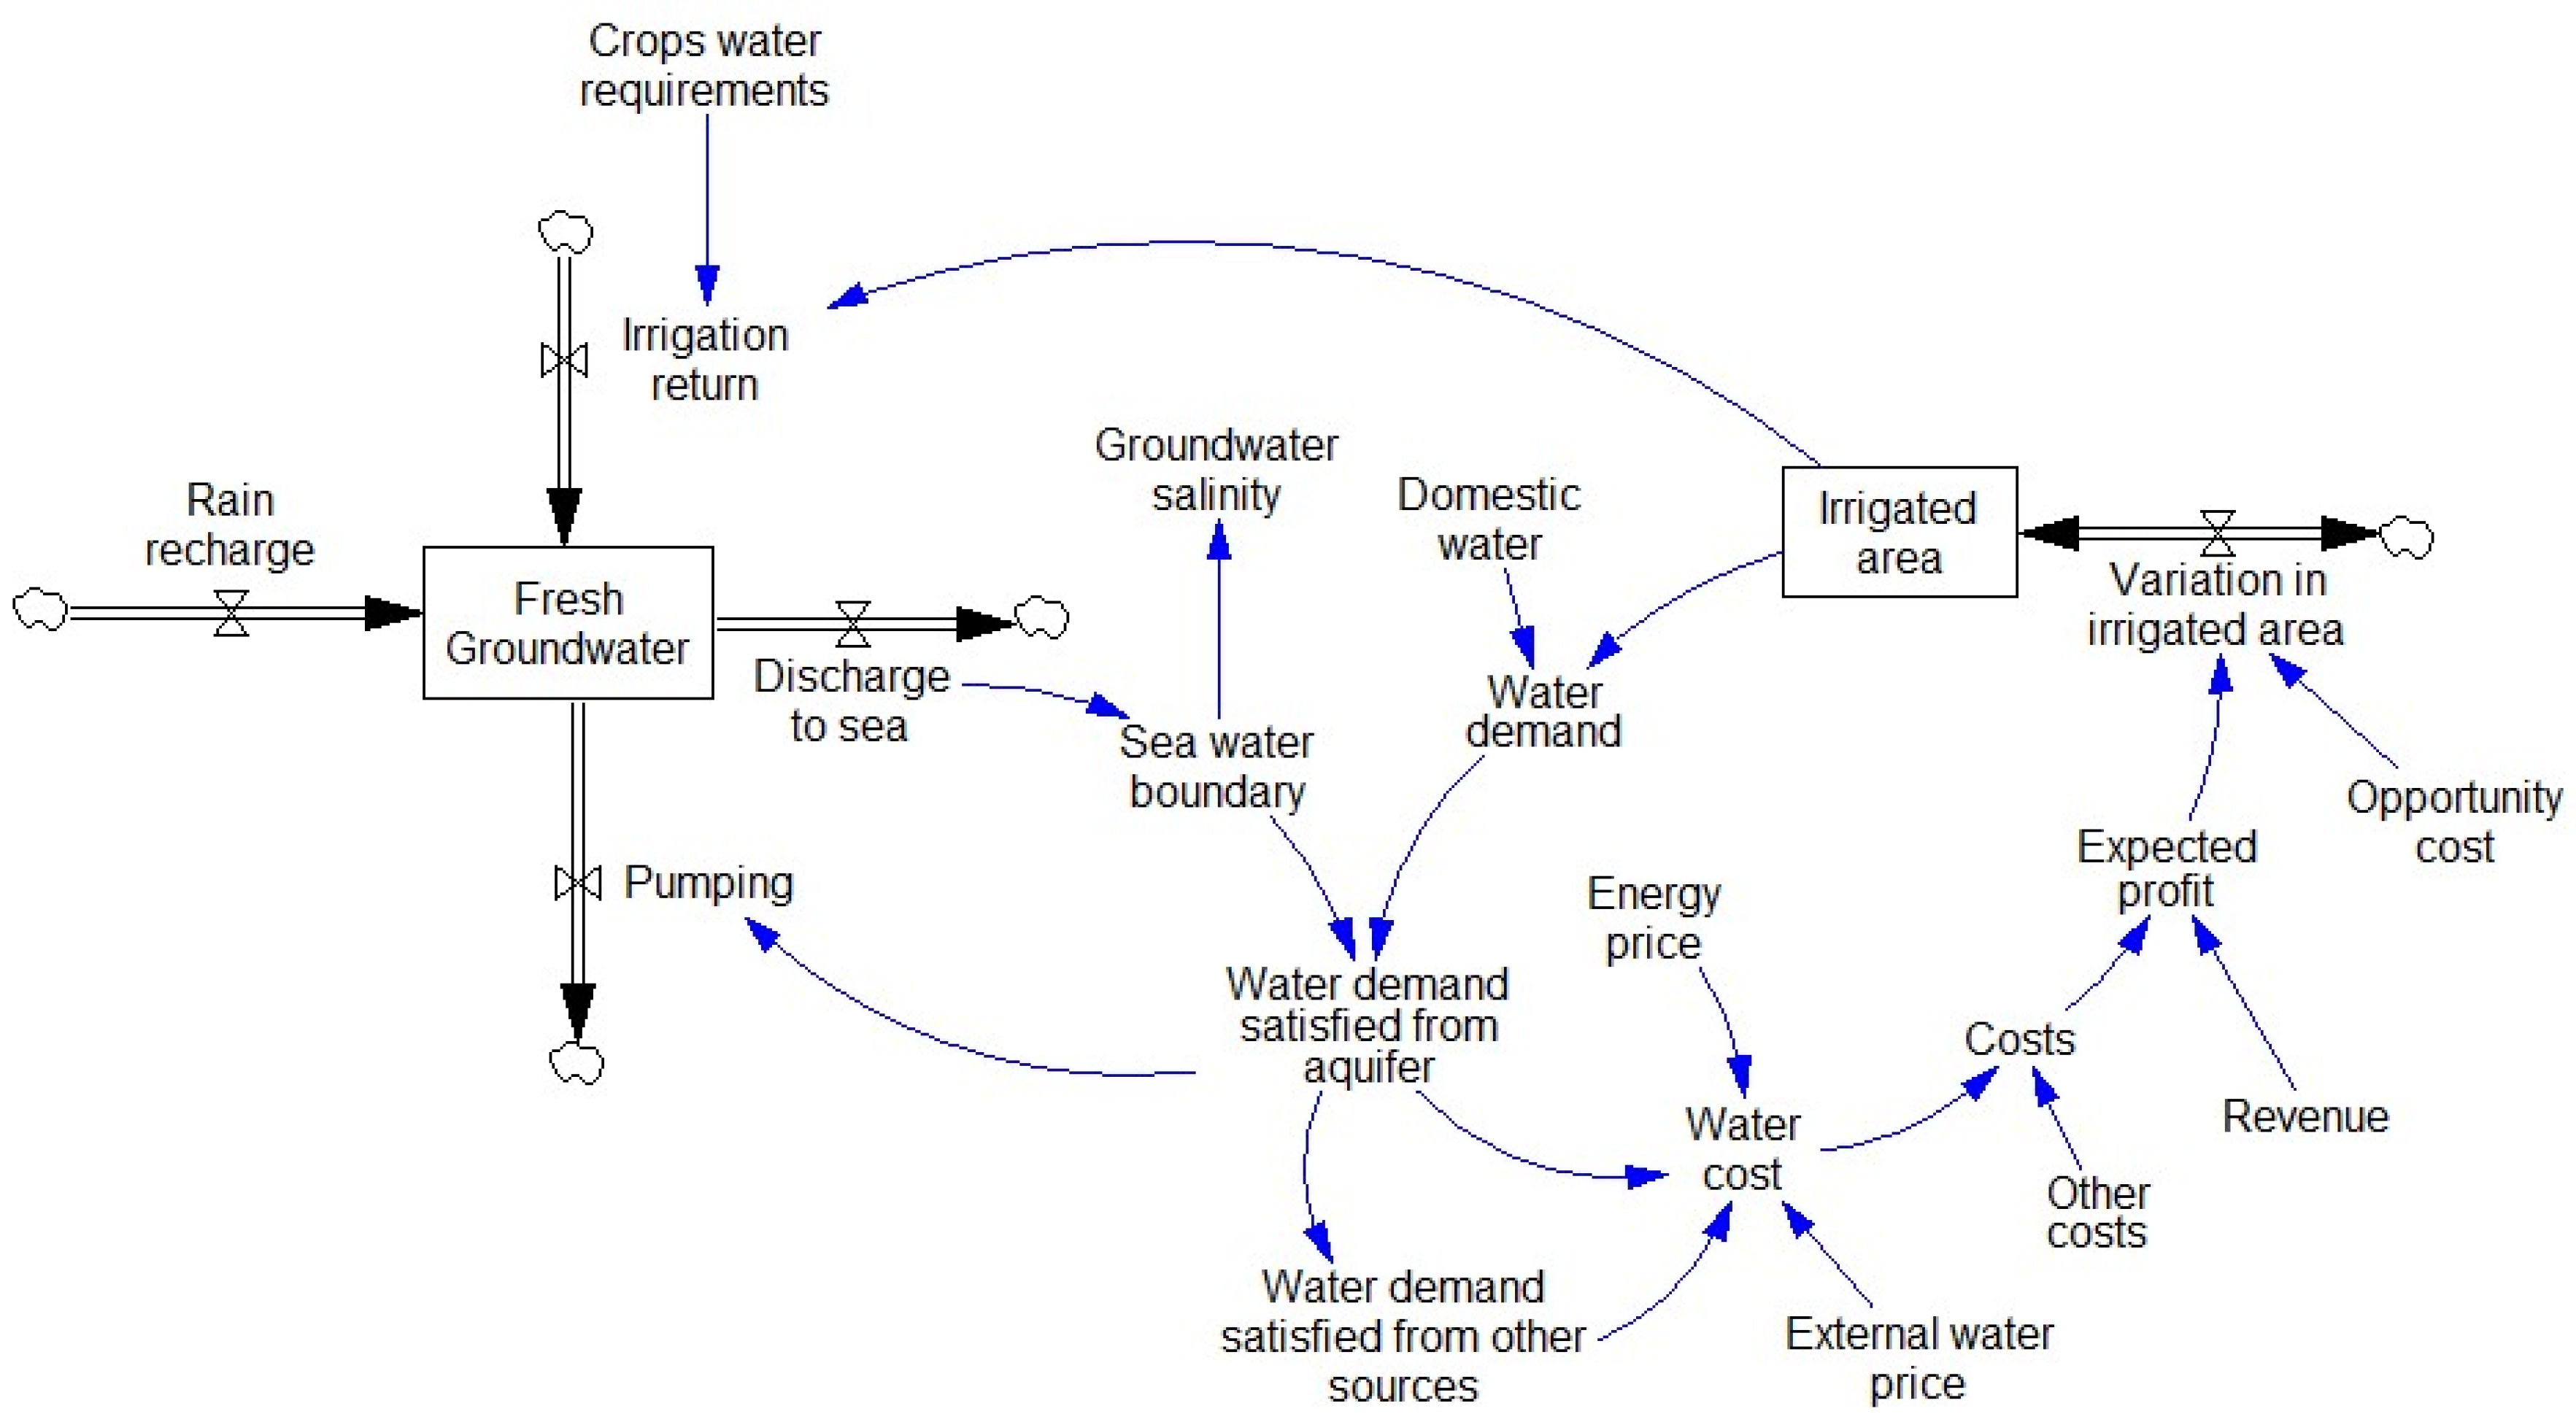
2.3. The Aquacoast Model

The SD approach has been applied before to study the interaction between groundwater dynamics and the evolution of intensive irrigation agriculture in drylands [74,75,76,77,78]. The Aquacoast model [79] belongs to a saga of integrated models developed to study desertification [42], based on a generic eight-equation SD model [80] that resembles a classic predator–prey dynamic model [81,82], where human activities are the predators, and natural resources are the preys [83,84]. Specifically, in this application, we have upgraded the Aquacoast model where groundwater is predated by hectares of irrigated crops (greenhouses) whose expansion depends on medium- and short-term profitability. What follows is a brief description of the model based on the sketch shown in Figure 2. An in-depth description and the complete list of equations are provided in the Supplementary Materials.
The model represents the interactions between two stock variables, “Fresh groundwater” and “Irrigated area” (Figure 2). The dynamics of the former reflects the aquifer’s water balance. While under a natural regime, the flows in the aquifer would only be rainfall recharge and discharge to the sea, whereas under a disturbed regime of groundwater exploitation, two flows are added: groundwater pumping to satisfy domestic and irrigation demands; and the return to the aquifer of a fraction of the water used for irrigation.
The coastal aquifer modelled is hydraulically connected to the sea, meaning that a saltwater–freshwater interface (“Sea water boundary”; Figure 2) moves inward when groundwater storage decreases, and returns towards the sea otherwise. Therefore, such a movement has a seasonal component linked to the seasonality in rainfall recharge, and a yearly component linked to the development of irrigated agriculture and variations in pumpings. In the model, which represents both components, “Groundwater salinity” (Figure 2) is essentially given by a weighted average of the salinities of fresh and sea water, where the weights are the lengths of the sections saturated with both kinds of water in the aquifer (see Equations (S20) and (S21) in Supplementary Materials for details). “Groundwater salinity” is one of the indicators chosen to assess the risks of degradation and desertification in this case study.
The other stock variable, “Irrigated area” (Figure 2), follows a goal-seeking scheme, which is a well-known basic behaviour in SD modelling [73]. In short, the irrigated area converges towards the desired irrigated area, which is determined by the ratio of the expected profit per farm to the opportunity cost of a farmer, i.e., the returns (s)he expects from other alternative economic activities. Thus, the irrigated area will increase when the agricultural business is relatively profitable and will decrease otherwise (see Equations (S8) and (S9) in Supplementary Materials for details).
The expected profit per farm is a moving average of past profits, which result from the evolution of revenues and costs. In the context of this study, the cost of water has a special role. It has two components, the cost of water coming from the aquifer (“Water demand satisfied from aquifer”; Figure 2), which mainly depends on the price of energy, and the cost of water from the RBS (“Water demand satisfied from other sources”; Figure 2), which depends on its price. The dependency of the system on external sources of water is measured by aggregating the values of “Water demand satisfied from other sources” over each year of a simulation. The results of such aggregations are stored in a variable called “Water imported annually”, which is the other indicator chosen to estimate risks in this case study.

2.4. Data Sources, Model Calibration and Validation

The first information about the CFA was collected in the late 1980s [50] and updated in several studies [45,48,49]. These sources provided most of the hydrogeological information, namely data on the aquifer’s water balance, its geometry, seawater intrusion and groundwater quality. Although these data are not very detailed, they allowed specifying reference values for the main variables involved (Supplementary Table S1 in SM).
Agronomic, economic and social information was much more abundant. Additionally, it was compiled from different sources, ranging from local to regional and national sources: Junta de Andalucía [49,52,60,85]; local studies [44,86]; the Spanish Statistical Office (INE) [87], WWF [66], the Spanish Ministry of Industry [88], Cajamar Foundation [89,90] and other studies [91,92]. Supplementary Table S1 shows all the data provided by these sources and indicates the origin of each value. Supplementary Table S2 shows the parameters lacking an external source. The set of parameter values included in these two Supplementary Tables constitute the default scenario of the model.
The model was quantitatively validated by checking that it satisfactorily fitted both the time trajectory of the irrigated area, for which time series data were available, and the reference values of the six variables showed in Supplementary Table S1 in SM. However, fitting historical and reference observations is insufficient to validate a model whose purpose is to explore possible states of the system different from the one observed so far [93,94]. For this reason, a qualitative validation of the model was also carried out in the way advised by the SD approach [62,69,86,88]. Thus, it was checked that variables were adequately bounded by model structure, and not by an ad hoc mechanism, and that the model behaved coherently under extreme scenarios (e.g., absence of aquifer recharge).

2.5. Risks of Degradation and Desertification

We estimated risks of degradation and desertification [95] in the study following these steps:
(1)
Selecting the parameters for specifying the simulated scenarios. We chose a climate-related parameter, “average rainfall recharge” (Supplementary Table S1 in SM), and a farm profitability parameter, “revenue per hectare” (Supplementary Table S1 in SM).
(2)
Assuming probability distributions for the parameters selected in (1): a log-normal distribution for “average rainfall recharge”, and a normal distribution, for “revenue per hectare” (see Section S2 in Supplementary Materials).
(3)
Specifying a high number of simulation scenarios, each of them considering a different combination of values for the selected parameters. All the parameter values are independently sampled from parameter probability distribution. A total of 200 scenarios were specified in this case.
(4)
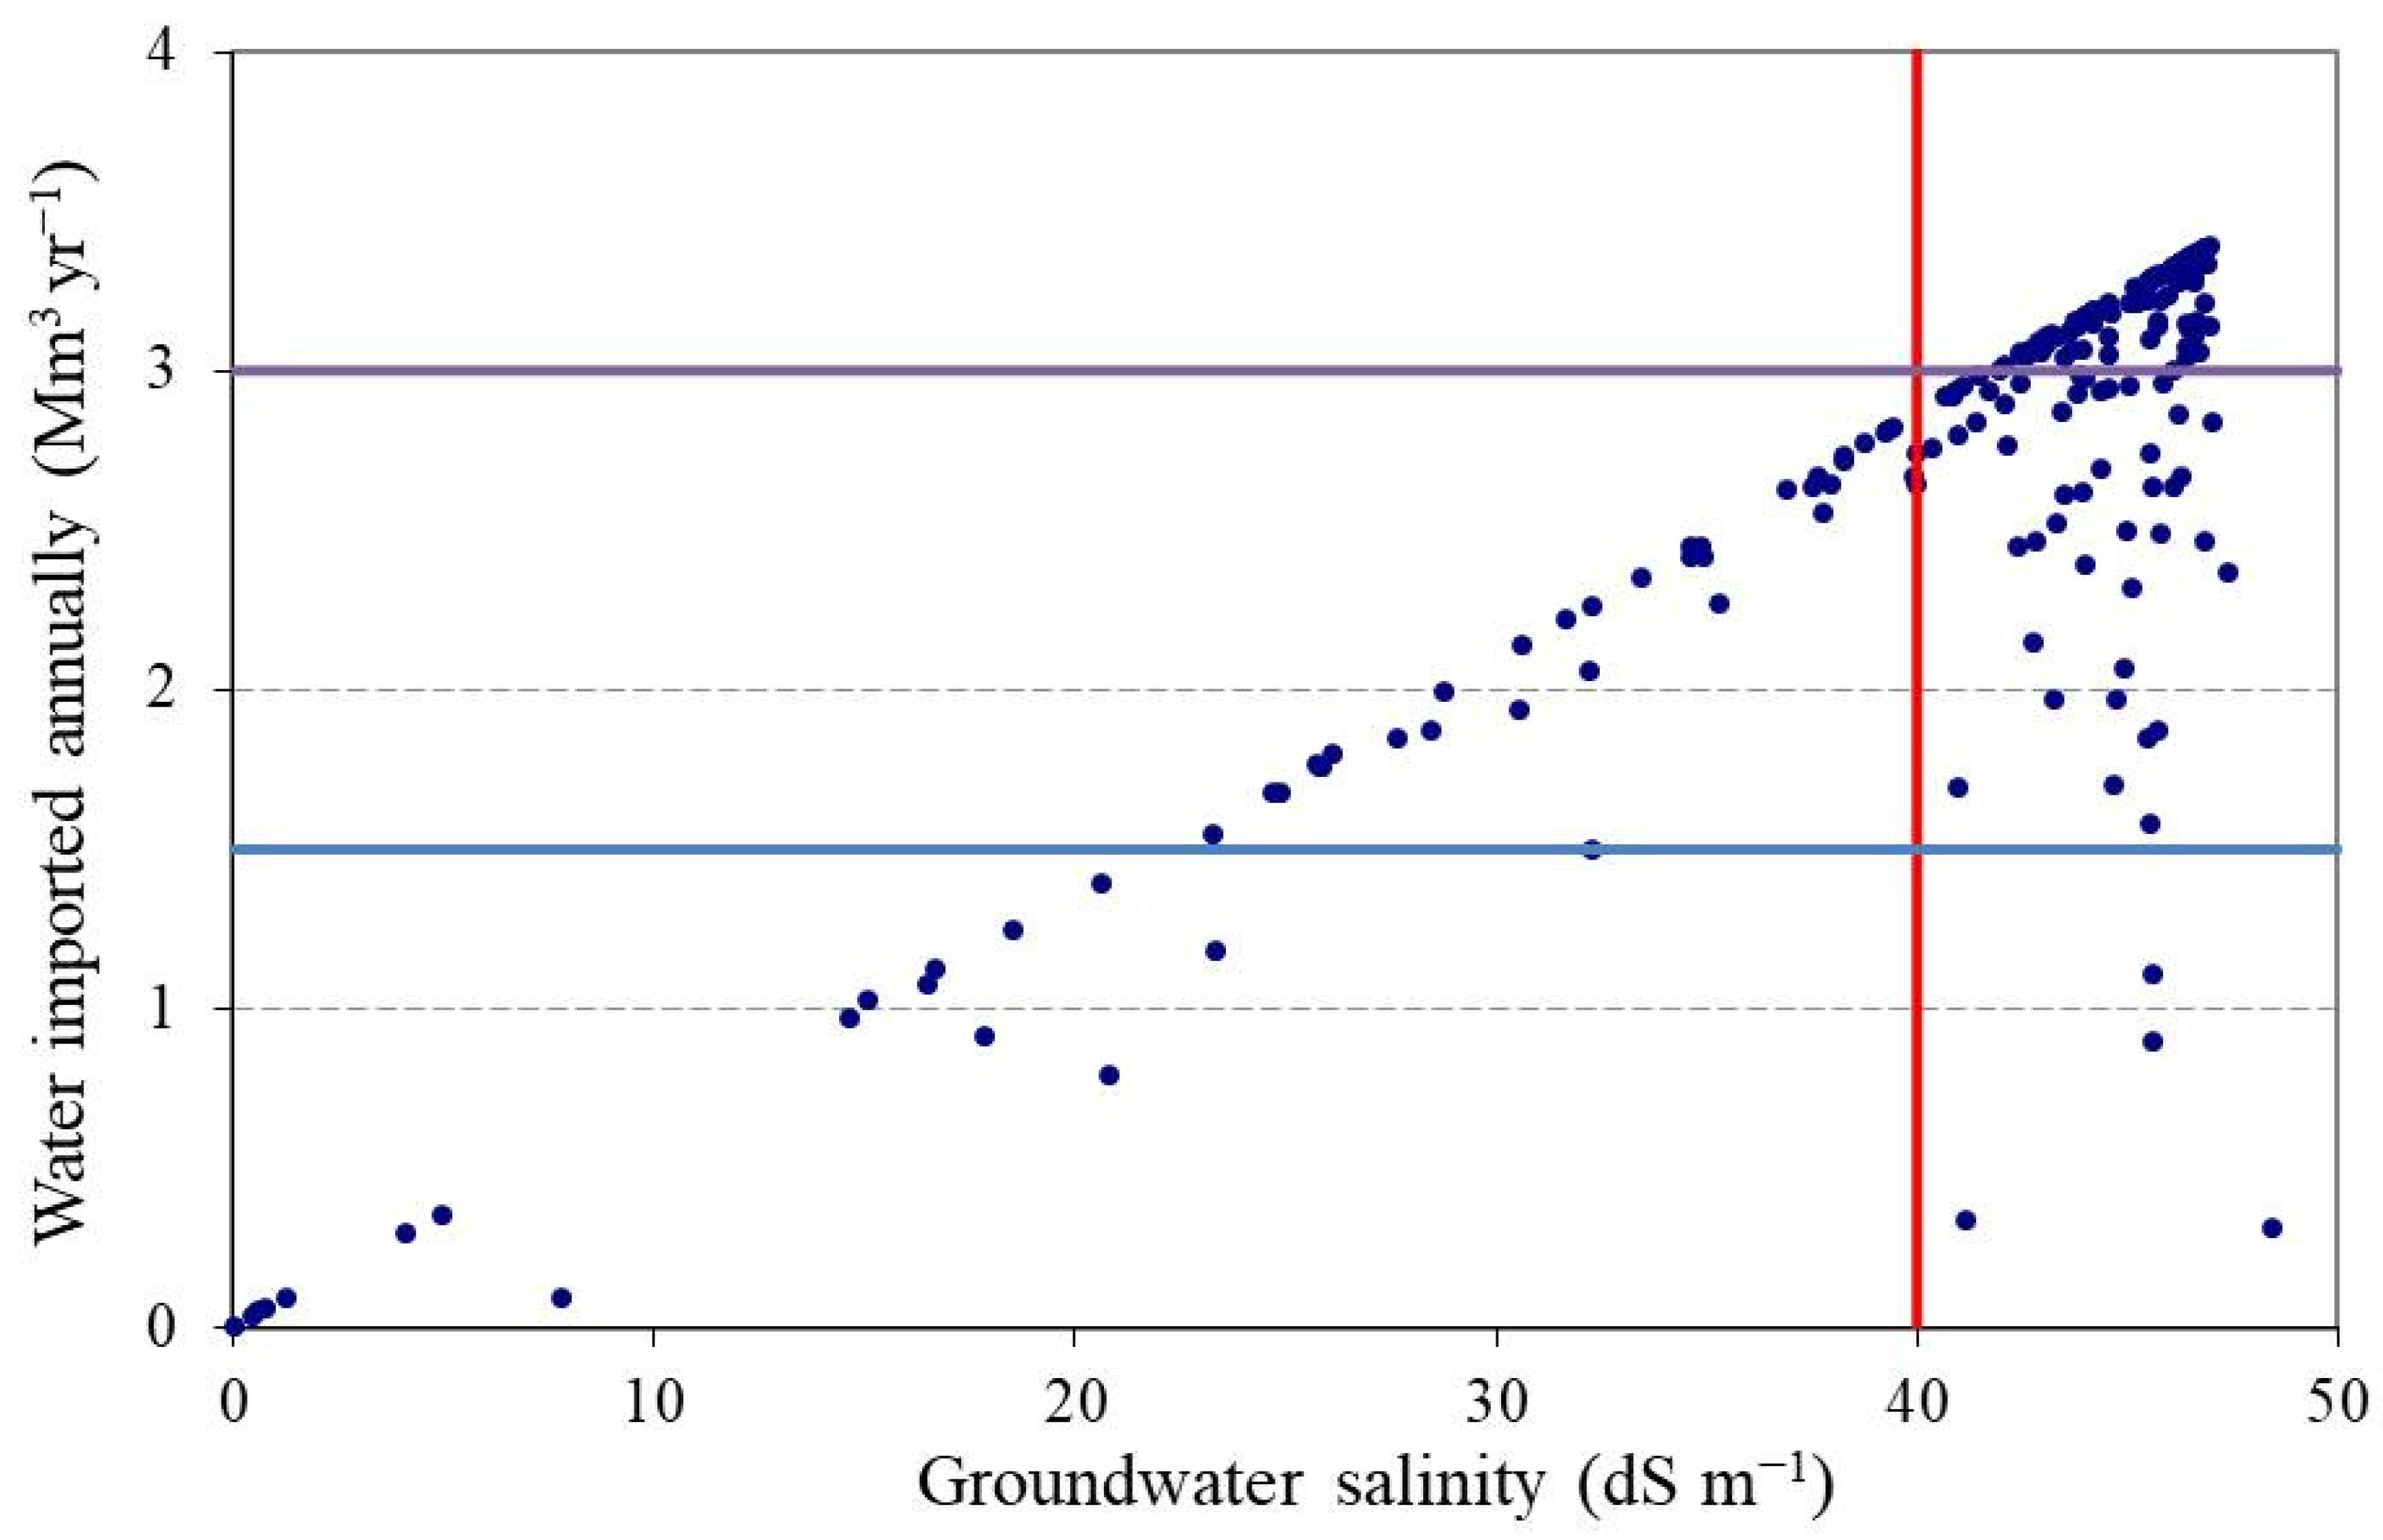
Selecting model variables that serve as indicators of the state of degradation of the system. We chose “Groundwater salinity” as indicator of the groundwater quality of groundwater, and “Water imported annually” as indicator of the scarcity of water resources in the basin.
(5)
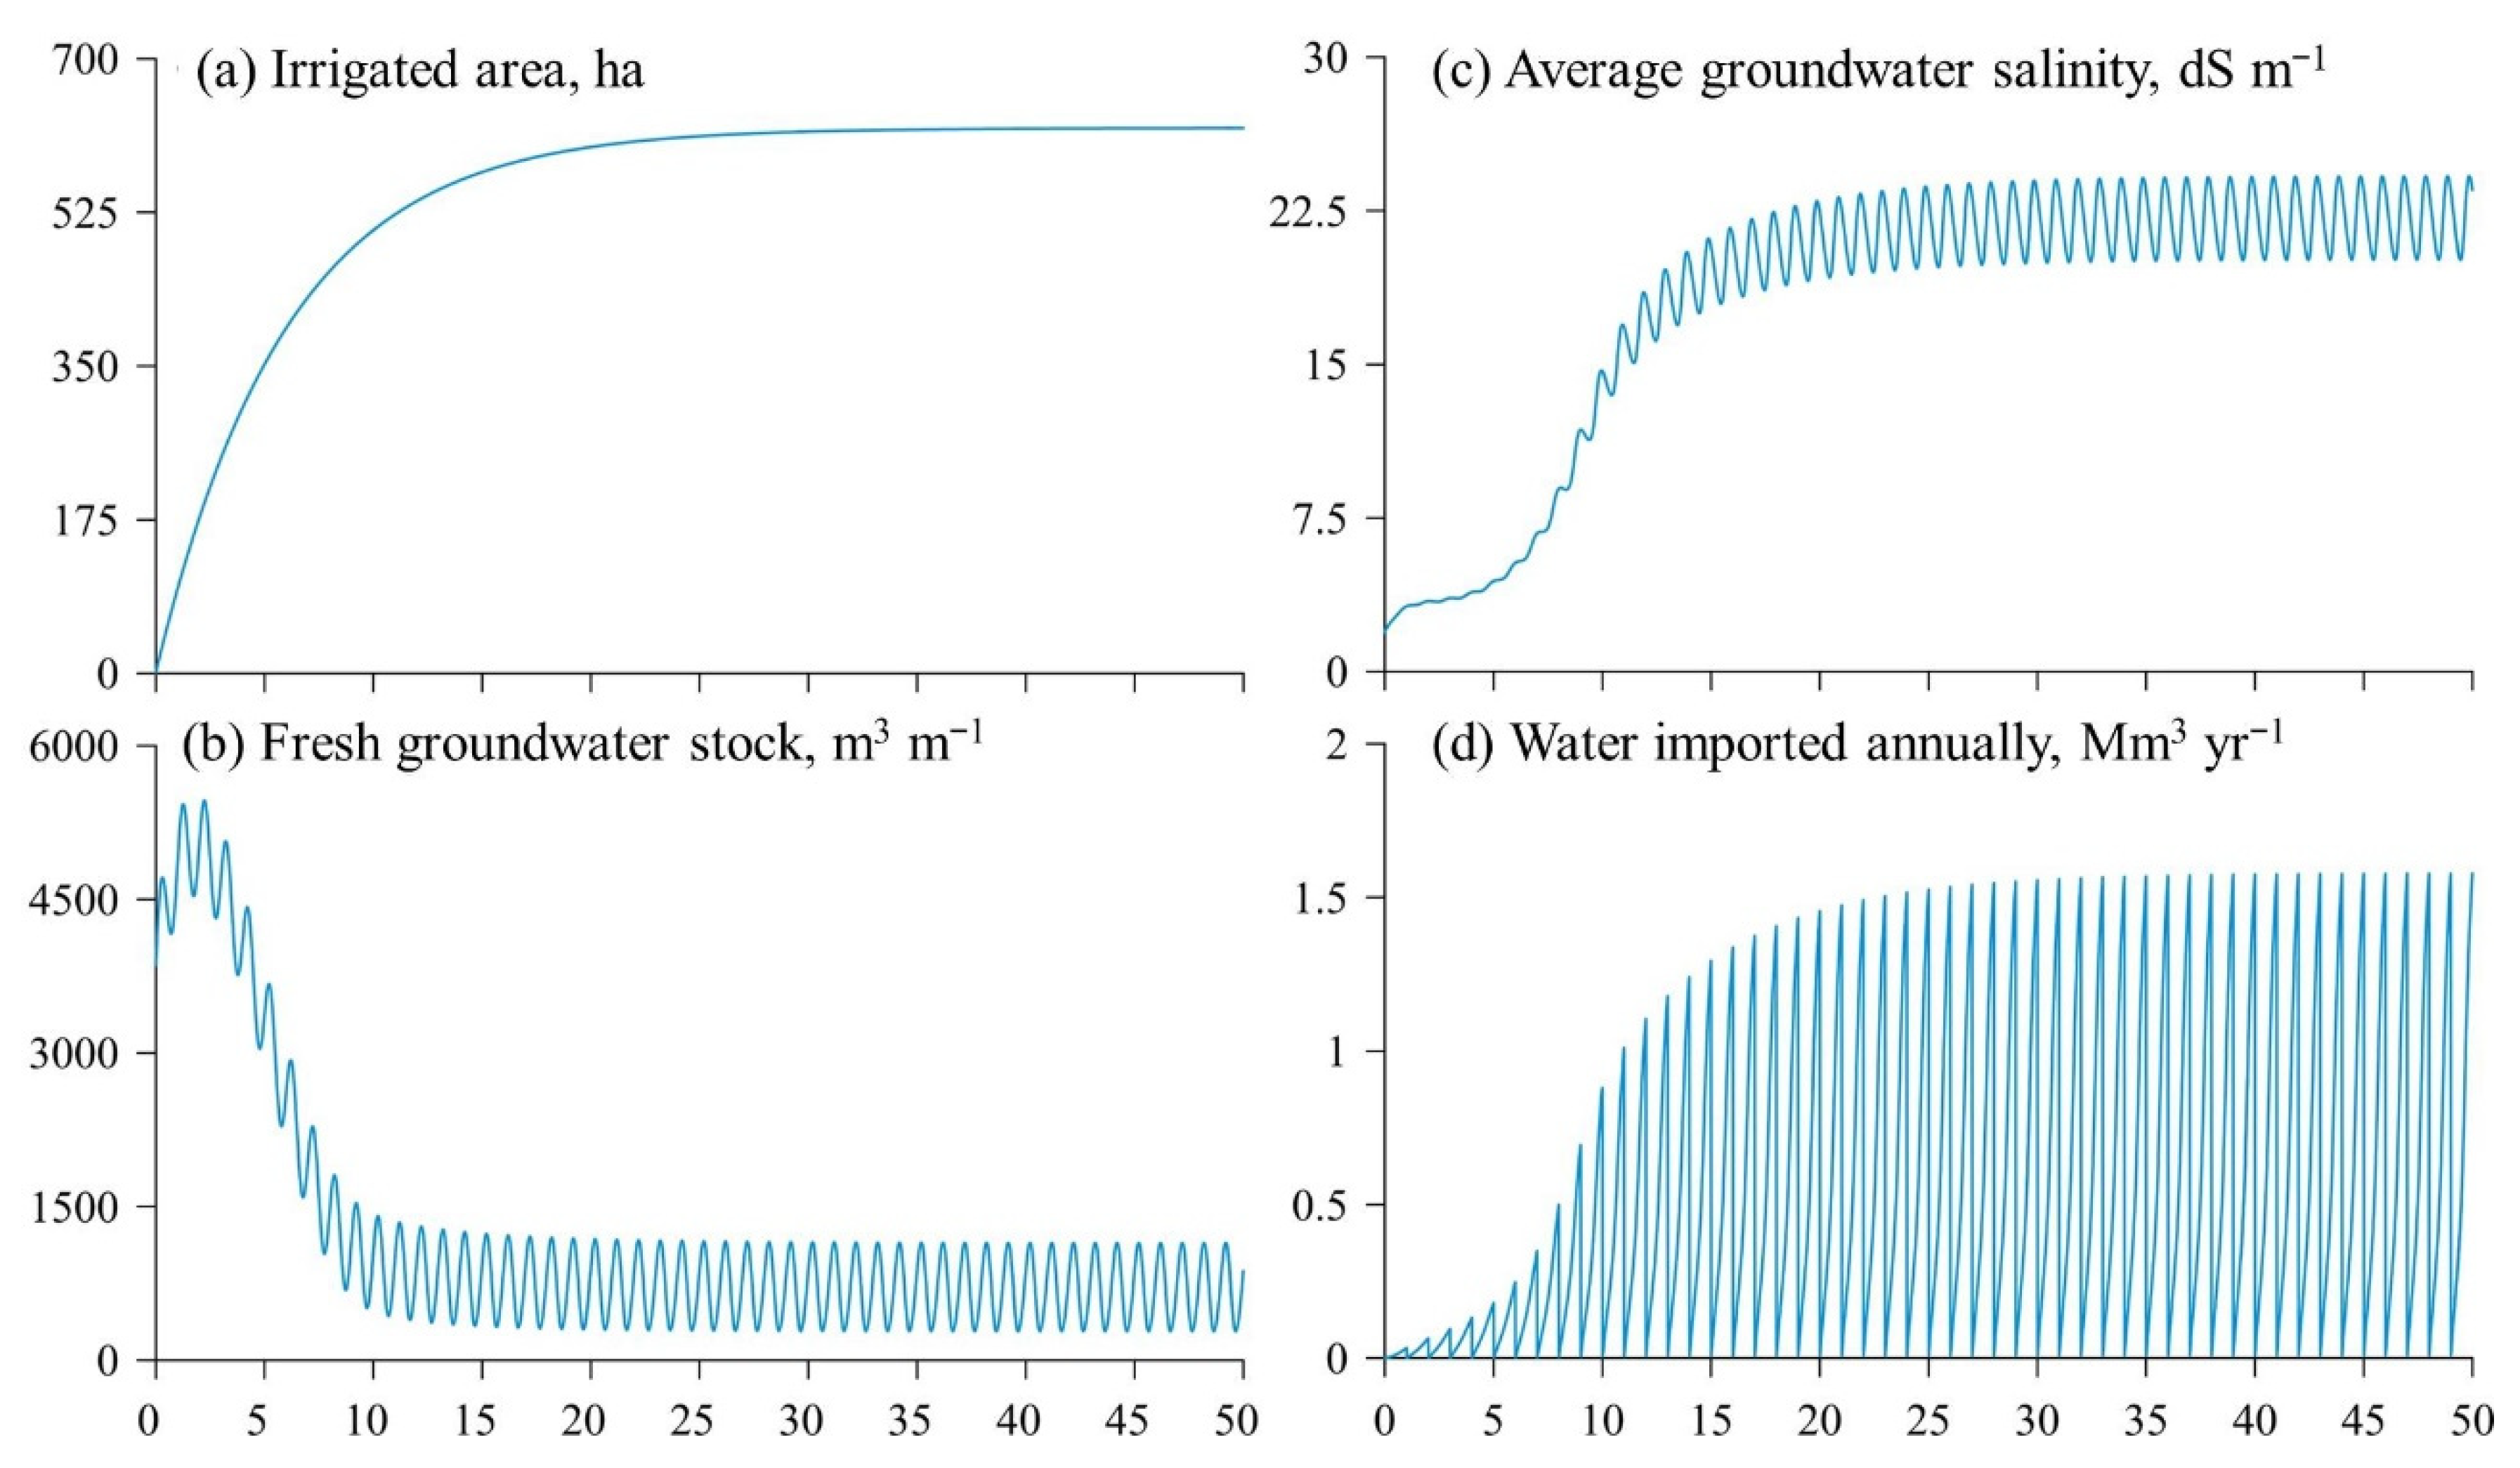
Simulating the model under every scenario specified in (3) for a simulation period long enough for the whole system to reach equilibrium [80], and the values of the indicators at that point (“end-values”) were recorded. A 50-year simulation period allowed the system ample time to reach equilibrium (Figure 3).
(6)
Calculating the percentage of scenarios in which the indicator end values are above degradation or desertification thresholds. This percentage is the estimated risk for the case study. In this case, we considered a threshold of 40 dS m−1 for “Groundwater salinity”. A value above this threshold indicates that seawater intrusion affects the whole aquifer all year round (see Section 2.3). Since estimating the maximum amount of water that could potentially be transferred to the GSB is quite difficult due to the climatic, physical, technical or/and economic reasons influencing it, we considered two tentative thresholds for “Water imported annually”: 1.5 Mm3 yr−1, which is the amount of water annually imported at present, and 3 Mm3 yr−1, which doubles it.

3. Results

3.1. Trajectories under the Default Scenario

Figure 3 shows the time trajectories of the main variables under the default scenario. These trajectories reflect the description of the GSB system made in Section 2.1. Indeed, the expansion of the irrigated area to approximately 630 ha (Figure 3a) leads to a remarkable reduction in the stock of freshwater (Figure 3b) and an increase in groundwater salinity (Figure 3c). For farms to cope with this situation, they must import annually around 1.5 mm3 of water from the RBS (Figure 3d). Since “Water imported annually” aggregates the amounts of water imported at every time step within a year (Section 2.3), the variable is reset to zero at the beginning of every year, and consequently, only the values at the end of each year must be considered for this variable in Figure 3d.
Additionally, Figure 3 allows us to see how the model represents the seasonal fluctuations in the trajectories of the stock of freshwater and groundwater salinity caused by the seasonality of precipitation (Section 2.3).

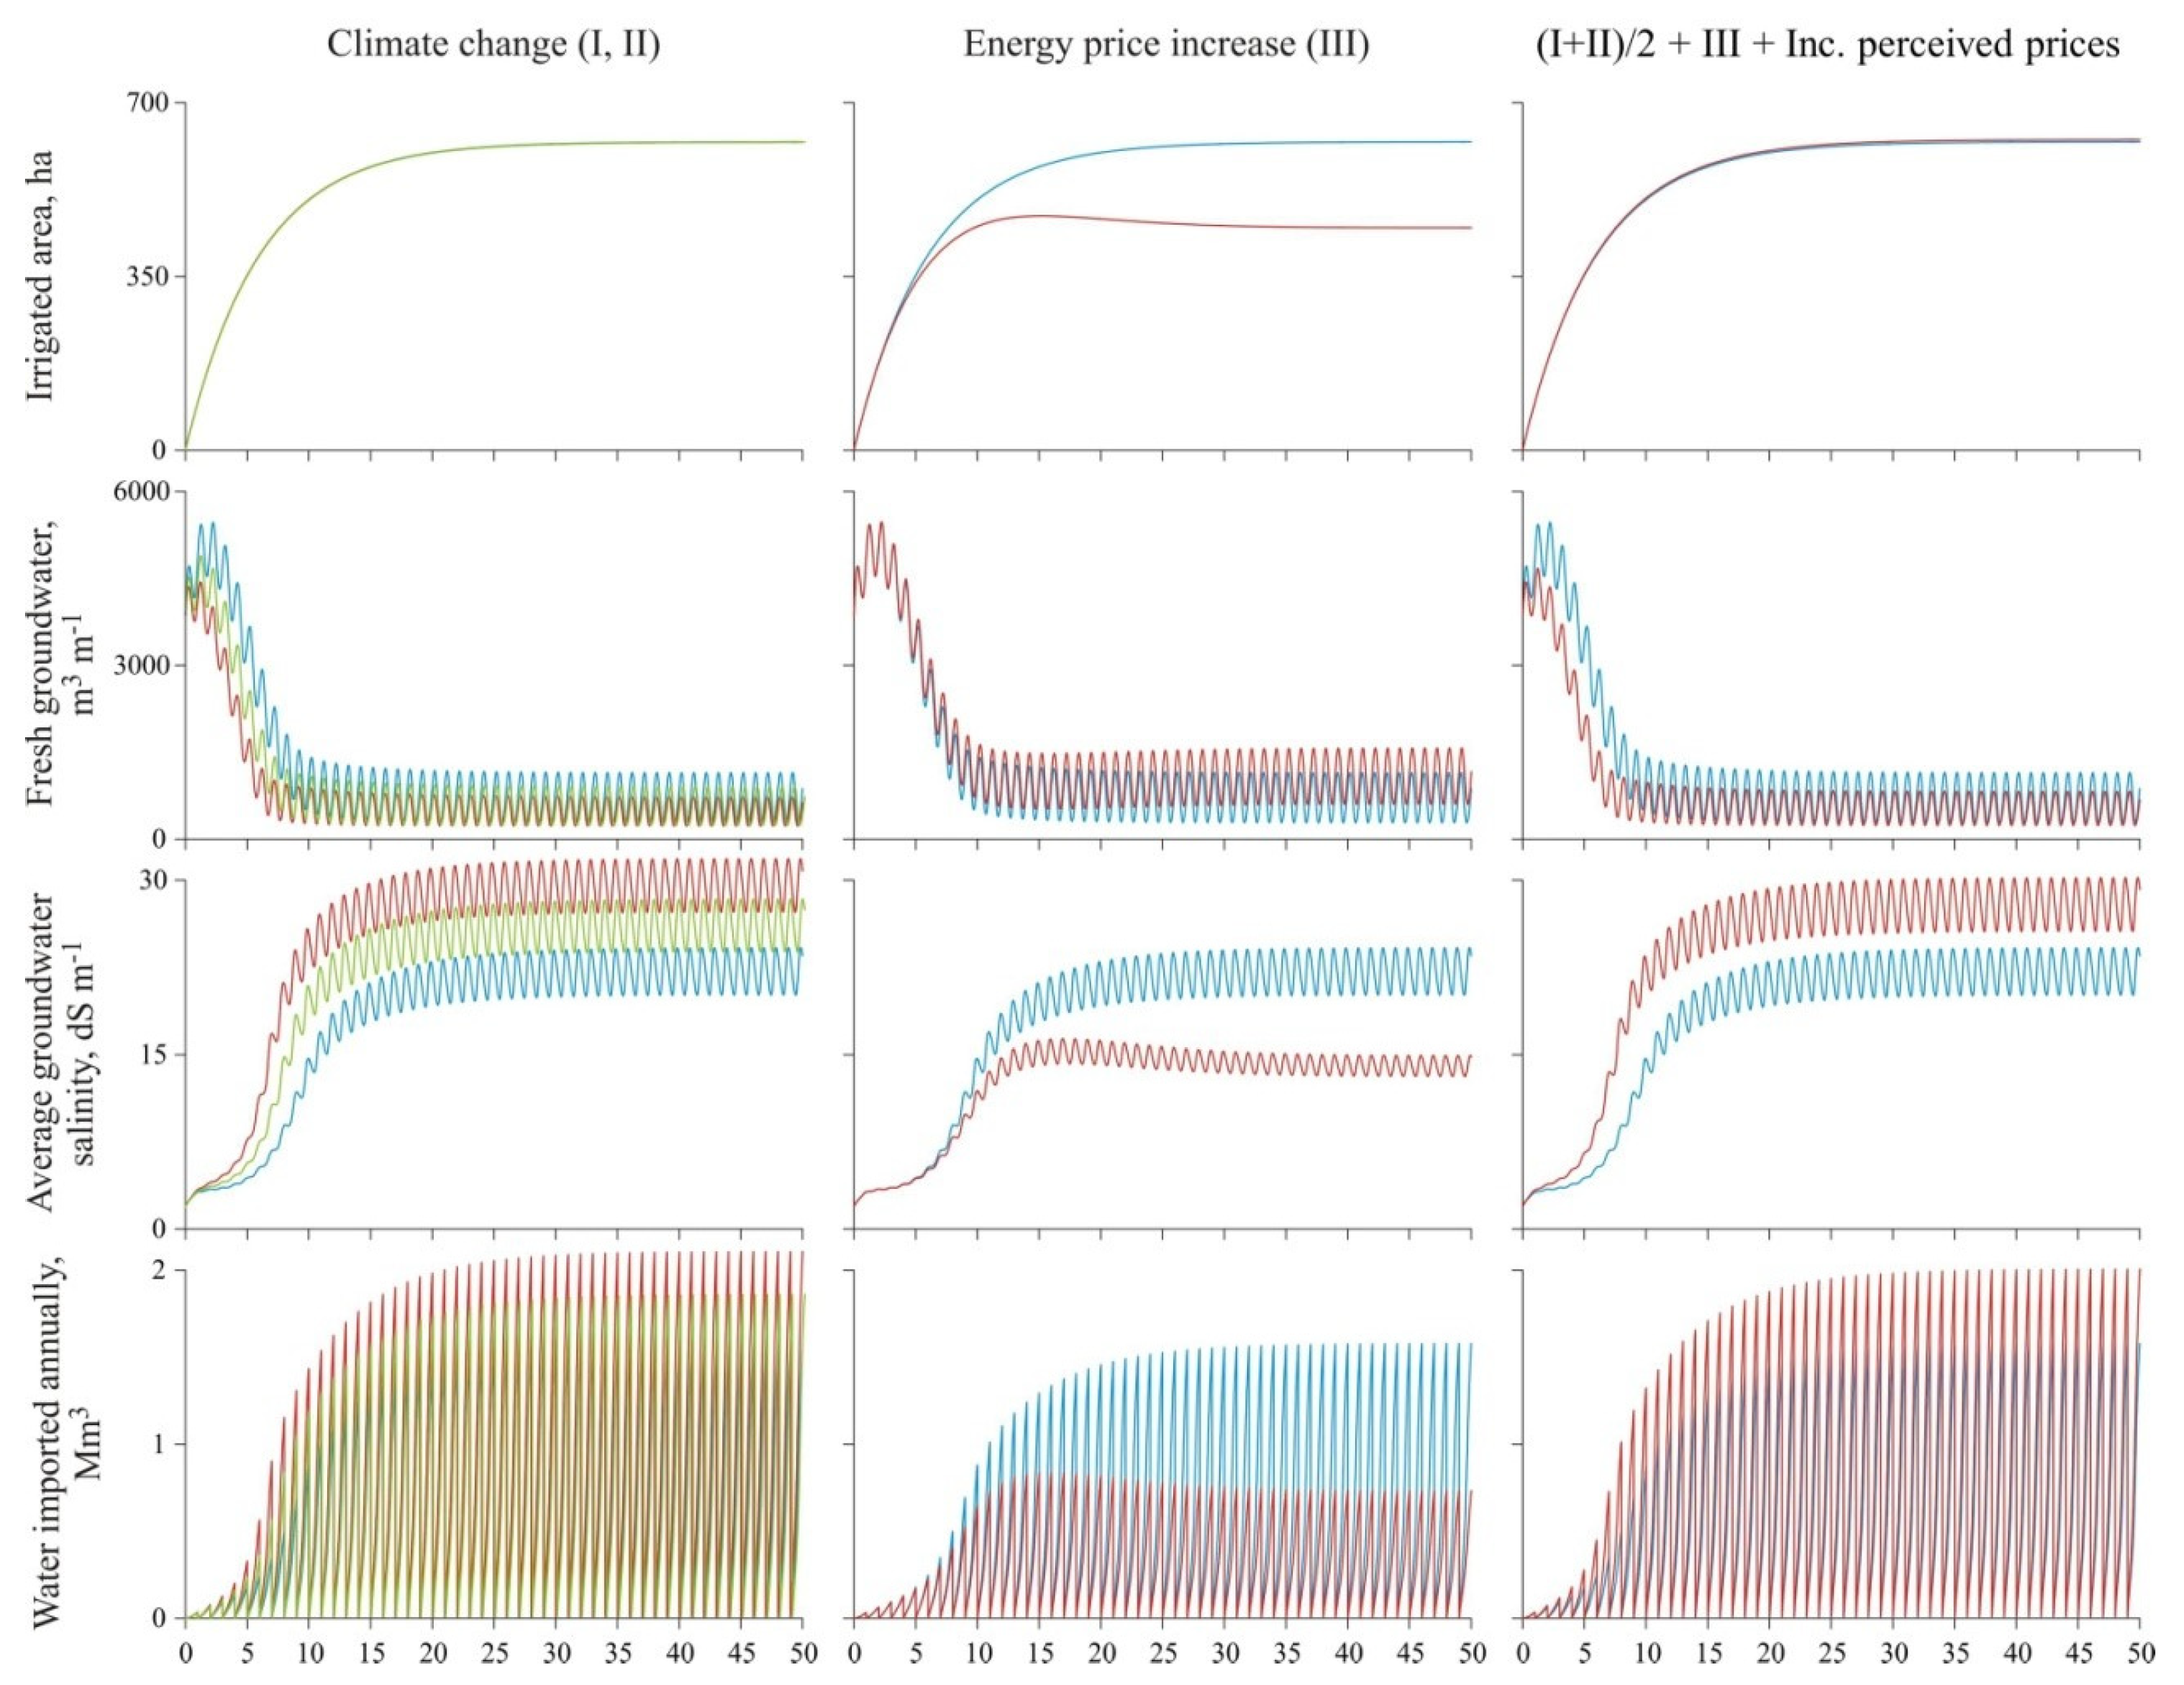
3.2. “What-If” Analyses

Four alternative scenarios were specified in order to investigate the possible effects of climate change and the current energy crisis on the modelled system. The parameter values of these scenarios are detailed in Supplementary Table S3.
Scenarios I and II result from reducing the parameter “average rainfall recharge” in relation to the default scenario. Scenario I reduces it by 14.4%, and Scenario II, by 26.6% (Supplementary Table S3). These percentages define the confidence interval of the reduction in precipitation expected for the eastern Andalusia region as a result of climate change [96]. The effects of these scenarios on the trajectories of the main model variables can be seen in Figure 4, first column. The aquifer deteriorates further, since the reserve of “Fresh groundwater” diminishes and “Groundwater salinity” increases in relation to the default scenario. However, the irrigated area remains the same as water transfers increase to compensate for the additional degradation.
Scenario III reflects a loss in the profitability of the farms. It results from increasing the “energy price” parameter by 85%, and the “other costs per hectare” and “price one cubic meter external water” parameters by 35% (Supplementary Table S3). These variations reflect data released by the Ministry of Agriculture, Fisheries and Food showing that the cost of energy for agriculture increased by 83.09%, and the prices paid by farmers increased by 35.09%, on average, as a consequence of the current energy crisis [97]. As can be seen in Figure 4, the irrigated area decreases considerably (by 27.8%) under this scenario, and the pressure on water resources is relieved. Both groundwater quantity and quality notably improve, and the amount of water imported halves.
Finally, Scenario IV reflects a plausible scenario for the system in the near future where the “average rainfall recharge” parameter reduces by 20.5% (the average of the reductions considered in Scenarios I and II); the costs increase as specified in Scenario III, and the “revenue per hectare” parameter experiences a 35% increase (Supplementary Table S3). The latter corresponds to the average rise in the prices of fruits and vegetables observed in the region as a consequence of the energy crisis [98]. The effects of this scenario can be seen in Figure 4, third column. The increase in revenues offsets the effects of the increase in costs, so the trajectory of the irrigated area equals that of the default scenario. On the other hand, the trajectories of “Fresh groundwater”, “Groundwater salinity” and “Water imported annually” are approximately the average of the trajectories obtained under Scenarios I and II. Again, Scenario IV shows that farmers would cope with the additional degradation of the aquifer by transferring more water from the RBS.

3.3. Risks of Degradation and Desertification in the GSB

The “what-if” scenarios cast some shadow about the likely behaviour of the system in the future. Although the number of scenarios considered was too low for the results to be deemed significant, risk estimates are aimed at dealing with this drawback. As explained in Section 2.5, to make such estimations, the model was run 200 times under scenarios that combine different random values of a climate parameter (i.e., “average rainfall recharge”,) and a profitability parameter (i.e., “revenue per hectare”). The results of these scenarios were summarized by the end values of “Groundwater salinity” and “Water imported annually”. Figure 5 shows the cloud of points of these 200 end values after the simulations.
The points shaping the conspicuous diagonal correspond to simulations where the irrigated area reached its maximum, i.e., 630 ha. Under this particular circumstance, the diagonal illustrates the linear relationship between the two indicators established in the model. The under-diagonal points correspond to simulations where the irrigated area did not reach its potential value because “revenue per hectare” took low values.
Inspecting “Groundwater salinity”, we find that 73% of the points are to the right of the degradation threshold considered for this indicator (40 dS m−1; Section 2.5), suggesting that the risk of complete salinization of the CFA is very high.
Considering the two indicators simultaneously, we found that in 71% of the simulations “Groundwater salinity” exceeded 40 dS m−1, and “Water imported annually” exceeded 1.5 Mm3 yr−1, which is the amount of water currently transferred to the basin. In 45.5% of the simulations, “Groundwater salinity” exceeded 40 dS m−1, and the amount of “Water imported annually” exceeded 3 mm3 yr−1, doubling the amount of water transferred at present. These results suggest that it is likely that seawater will completely saturate the aquifer, thereby pressuring the farms to highly increase their current water demand.

4. Discussion

4.1. Degradation of Water Resources and Desertification

Desertification is an ambiguous and complex concept [99] with still no existing consensus about the true extent of the problem, while solutions so far have not been as effective as intended.
Historical desertification maps have evaluated desertification through soil and vegetation cover trends while remote sensing techniques have gradually become the foremost means of monitoring and assessing desertification [100]. The use of the Normalised Difference Vegetation Index (NDVI) [101], a proxy for Net Primary Productivity (NPP) [102], prevails among such techniques. These methods are inadequate to assess the degradation of water resources, since increases in NDVI typically observed in irrigated areas can be interpreted as re-greening, and thus, as improvements in land condition. However, irrigation agriculture may take a heavy toll on water resources to the point of putting them at risk of depletion [18].
Thus, unless irrigated areas are explicitly identified as anomalies [103], they may be taken as a solution to address desertification in cases where, in fact, they are aggravating it. It is necessary to complement the techniques focused on land productivity with measures of the impacts on water resources. Satellite observations, such as the GRACE mission [104], provide new space-based insights into the global nature of groundwater depletion [9] and benefit water management [105]. Complementarily, the use of integrated simulation models, such as the one presented here, expanded with risk analyses, can significantly contribute to developing an EWS able to provide a more holistic assessment of desertification in sociohydrological systems [95].

4.2. SD as a Suitable Tool to Help Achieve Land Degradation Neutrality

Land Degradation Neutrality (LDN) seeks “maintain or enhance the land-based natural capital, which comprises the edaphic, geomorphological, hydrological and biotic features of a site” [106]. Target 15.3 of the Sustainable Development Goal 15 [107] aims “to achieve a land degradation neutral world” as a tool to combat desertification [108], while the United Nations Convention to Combat Desertification (UNCCD) has also focused on LDN as a result of the lack of progress in tackling desertification [108].
Combating desertification implies preserving the amount and quality of land resources, but also offering economic opportunities to the population [109]. This is especially difficult in drylands where, given the scarcity of precipitations, intensive land uses pose a serious threat to their sustainability. Some authors claim that those lands where rainfall is less than 250–300 mm yr−1 should be kept under pastoralism [110]. However, this would mean dooming enormous populations to living in poverty. Indeed, about 72% of drylands are in developing countries [111], accounting for 90% of the two billion people living in drylands [112]. Thus, to combat desertification in drylands without excluding its economic component, it would be necessary to transfer water resources from wetter areas (“source zones”) to dry areas that can take advantage of some favourable conditions (“sink areas”) [106]. However, this requires wise land-use planning for LDN to be achieved at a spatial scale including source and sink zones, avoiding spreading unsustainability to other territories [110].
The approach presented here has proved to be useful in assisting this type of land-use planning. Our analyses allowed us to assess not only the effects of economic activities in the GSB, but also their off-site effects. It showed that LDN is not achieved in the basin because the amount and quality of its water resources do not remain stable over time. To achieve LDN, this sociohydrological system must import increasing amounts of water resources from the RBS. In addition, our assessment has showed that it is likely that the amount of water demanded by the GSB will more than double the amount demanded at present. If we take into account that other similar basins in the area will likely experience the same situation, it can be expected that the total demand for surface water resources in the coast of Granada will exceed the availability of water resources for the area, i.e., those of the RBS, especially in the face of climate change. Under this reality, water transfers would not be guaranteed. A reduction in the precipitation would impact the availability of water resources, and the RSB would be at a serious risk of desertification. Therefore, the development model based on intensive agriculture is becoming an exporter of water shortages to other regions [113]. To counteract this pathway, a combination of measures should be undertaken to increase water availability by increasing the use of rainwater harvesting systems, using reclaimed water, artificially recharging the aquifer with water saved from torrential storms and water pricing [114]. However, measures should also stimulate shifting to crops adapted to aridity [115] or/and diversifying the economic activities [116] (e.g., through sustainable tourism, since massive tourism can also contribute to degradation of the system [78]).

4.3. On the Adequacy of the Proposed Model

In order to carry out the analyses presented here, we opted for a “policy model” as opposed to a “research model” [117]. This implies that our model: (i) has a level of complexity and a resolution determined by the availability of data (low, as is common in drylands), rather than by the nature of the processes represented; (ii) addresses practical policy issues and provides useful output, rather than testing hypotheses or further understanding the real system; (iii) is based on well-known, rather than on scientifically innovative, theories and methodologies; and (iv) is transparent and user-friendly since stakeholder and policy makers are its target users.
It is argued that simple models are difficult to apply to particular systems, and that there would be a trade-off between simplicity and generality [118]. However, our model has been fruitfully applied to a particular case study, i.e., the GSB, and has achieved some generality by suggesting the probable situation in the coast of Granada as a result of climate change.
Moreover, groundwater sustainability is being currently assessed by means of approaches that are much simpler than the one presented here [119]. A good example is the well-known ratio of groundwater abstraction to groundwater recharge, which implies a necessary but insufficient condition for sustainability. Indeed, it is likely that some drop in the water table will happen at the onset of groundwater exploitation, and this might be due to pumping exceeding recharge. However, the possibility that the negative feedbacks in the system (e.g., a decrease in yields due to salinization; the increase in the cost of pumping as the water table drops) will cause the system to limit itself and finally reach an acceptable state in the long term cannot be dismissed. Therefore, it is not sufficient to observe variations in the ratio of pumping to recharge; the state of the system in the long-term must also be assessed. The model presented here was specifically conceived to serve this more ambitious purpose.
Finally, the number of unknowns grows with the number of processes represented in a model [120]. Consequently, the application of more complex models is limited to the academic environments [121].

5. Conclusions

In this study, we have proposed an approach to anticipate risks of degradation and desertification in coastal aquifers and their catchment areas. The approach essentially consists of performing Monte Carlo simulations on an integrated SD model that represents the main relationships between groundwater dynamics and the development of irrigation agriculture. This approach has been applied to a coastal aquifer in a semi-arid area in the province of Granada, Southern Spain. We deem the approach fruitful and appropriate for areas with a limited availability of data, which is a common case in drylands. Thus, it can help with the integrated land-use planning required to achieve LDN.
Results show high risks of salinization of the CFA, and of desertification of the GSB. Additionally, they have suggested that this sociohydrological system is exporting water shortages to surrounding areas. Therefore, “Groundwater-dependent coastal agriculture” is a DL needing urgent attention within the National Strategy to Combat Desertification in Spain.

Supplementary Materials

The following supporting information can be downloaded at: https://0-www-mdpi-com.brum.beds.ac.uk/article/10.3390/land11101626/s1. Model description; Stochastic values for parameters involved in the assessment of desertification risk; Figure S1: Evolution of the greenhouse land occupation in the Gualchos Stream basin; Table S1: Parameter values and reference values for some variables obtained from different sources: Table S2: Calibrated parameters and unknown parameters; Table S3: Alternative scenarios for what if questions.

Author Contributions

Conceptualization, J.M.-V.; formal analysis, J.I. and J.M.-V.; methodology, J.I.; investigation, R.G. and J.M.-V.; original draft preparation, J.M.-V.; writing—review and editing, J.I. and J.M.-V.; visualization, J.M.-V. and F.J.A.; supervision, J.M.-V.; funding acquisition, J.M.-V. and F.J.A. All authors have read and agreed to the published version of the manuscript.

Funding

This research was funded by the European Research Council (ERC grant agreement 647038 (BIODESERT)) and by the project 101086497 funded by European Union’s Horizon-CL6-2022-Governance-01-07 research and innovation program.

Informed Consent Statement

Not applicable.

Data Availability Statement

The data used have been appropriately cited. Those official databases are open access.

Acknowledgments

We are very grateful to the reviewers for their valuable comments, which helped to improve the paper. The authors would like to thank Elsa Varela for her valuable comments and revisions of the text.

Conflicts of Interest

The authors declare no conflict of interest.

References

  1. Margat, J.; van der Gun, J. Groundwater around the World; CRC Press (Taylor & Francis): Boca Raton, FL, USA, 2013; ISBN 9780203772140. [Google Scholar]
  2. Foster, S.S.D.; Chilton, P.J. Groundwater: The processes and global significance of aquifer degradation. Philos. Trans. R. Soc. London Ser. B-Biol. Sci. 2003, 358, 1957–1972. [Google Scholar] [CrossRef] [PubMed]
  3. Vaux, H. Groundwater under stress: The importance of management. Environ. Earth Sci. 2011, 62, 19–23. [Google Scholar] [CrossRef]
  4. FAO. UN Progress on Level of Water Stress: Global Status and Acceleration Needs for SDG Indicator 6.4.2; FAO: Rome, Italy, 2021. [Google Scholar]
  5. Bierkens, M.F.P.; Wada, Y. Non-renewable groundwater use and groundwater depletion: A review. Environ. Res. Lett. 2019, 14, 063002. [Google Scholar] [CrossRef]
  6. FAO. The State of the World’s Land and Water Resources for Food and Agriculture—Systems at Breaking Point; Synthesis Report; FAO: Rome, Italy, 2021. [Google Scholar]
  7. Smith, M.; Cross, K.; Paden, M.; Laban, P. Spring—Managing Groundwater Sustainably; IUCN: Gland, Switzerland, 2016; ISBN 978-2-8317-1789-0. [Google Scholar]
  8. FAO. The State of Food and Agriculture 2020—Overcoming Water Challenges in Agriculture; FAO: Rome, Italy, 2020. [Google Scholar]
  9. Famiglietti, J.S. The global groundwater crisis. Nat. Clim. Chang. 2014, 4, 945–948. [Google Scholar] [CrossRef]
  10. Gleeson, T.; Cuthbert, M.; Ferguson, G.; Perrone, D. Global Groundwater Sustainability, Resources, and Systems in the Anthropocene. Annu. Rev. Earth Planet. Sci. 2020, 48, 431–463. [Google Scholar] [CrossRef]
  11. Famiglietti, J.S.; Ferguson, G. The hidden crisis beneath our feet. Science 2021, 372, 344–345. [Google Scholar] [CrossRef]
  12. Voss, K.A.; Famiglietti, J.S.; Lo, M.; De Linage, C.; Rodell, M.; Swenson, S.C. Groundwater depletion in the Middle East from GRACE with implications for transboundary water management in the Tigris-Euphrates-Western Iran region. Water Resour. Res. 2013, 49, 904–914. [Google Scholar] [CrossRef]
  13. Scanlon, B.; Faunt, C.; Longuevergne, L.; Reedy, R.; Alley, W.; McGuire, V.; Mcmahon, P. Groundwater Depletion and Sustainability of Irrigation in the US High Plains and Central Valley. Proc. Natl. Acad. Sci. USA 2012, 109, 9320–9325. [Google Scholar] [CrossRef]
  14. Feng, W.; Zhong, M.; Lemoine, J.-M.; Biancale, R.; Hsu, H.-T.; Xia, J. Evaluation of groundwater depletion in North China using the Gravity Recovery and Climate Experiment (GRACE) data and ground-based measurements. Water Resour. Res. 2013, 49, 2110–2118. [Google Scholar] [CrossRef]
  15. Jasechko, S.; Perrone, D. Global groundwater wells at risk of running dry. Science 2021, 372, 418–421. [Google Scholar] [CrossRef]
  16. Döll, P.; Fiedler, K. Global-scale modeling of groundwater recharge. Hydrol. Earth Syst. Sci. 2008, 12, 863–885. [Google Scholar] [CrossRef]
  17. D’Odorico, P.; Bhattachan, A.; Davis, K.; Ravi, S.; Runyan, C. Global desertification: Drivers and feedbacks. Adv. Water Resour. 2013, 51, 326–344. [Google Scholar] [CrossRef]
  18. Martínez-Valderrama, J.; Guirado, E.; Maestre, F.T. Desertifying deserts. Nat. Sustain. 2020, 3, 572–575. [Google Scholar] [CrossRef]
  19. Kaushal, S.S.; Likens, G.E.; Pace, M.L.; Reimer, J.E.; Maas, C.M.; Galella, J.G.; Utz, R.M.; Duan, S.; Kryger, J.R.; Yaculak, A.M.; et al. Freshwater Salinization Syndrome: From Emerging Global Problem to Managing Risks; Springer International Publishing: Berlin/Heidelberg, Germany, 2021; Volume 154, ISBN 0123456789. [Google Scholar]
  20. Alfarrah, N.; Walraevens, K. Groundwater overexploitation and seawater intrusion in coastal areas of arid and semi-arid regions. Water 2018, 10, 143. [Google Scholar] [CrossRef]
  21. Martínez-Valderrama, J.; del Barrio, G.; Sanjuán, M.E.; Guirado, E.; Maestre, F.T. Desertification in Spain: A Sound Diagnosis without Solutions and New Scenarios. Land 2022, 11, 272. [Google Scholar] [CrossRef]
  22. Hernández, M.; Morote, A.F. Evolución de los sistemas agrarios mediterráneos intensivos. Uso del agua y de la tierra (2000–2016). In El Regadío en el Mediterráneo Español. Una Aproximación Multidimensional; Garrido, A., Pérez-Pastor, A., Eds.; Cajamar: Almería, Spain, 2019; pp. 35–75. [Google Scholar]
  23. De Stefano, L.; Martínez-Cortina, L.; Chico, D. An overview of groundwater resources in Spain. In Water, Agriculture and the Environment in Spain: Can We Square the Circle? Llamas, R., De Stefano, L., Eds.; Fundación Botín: Santander, Spain, 2012; pp. 87–104. ISBN 9780203096123. [Google Scholar]
  24. Puigdefábregas, J.; Mendizábal, T. Perspectives on desertification: Western Mediterranean. J. Arid Environ. 1998, 39, 209–224. [Google Scholar] [CrossRef]
  25. Antonelli, M.; Basile, L.; Gagliardi, F.; Isernia, P. Land Use Policy The future of the Mediterranean agri-food systems: Trends and perspectives from a Delphi survey. Land Use Policy 2022, 120, 106263. [Google Scholar] [CrossRef]
  26. De Stefano, L.; Fornés, J.M.; López-Geta, J.A.; Villarroya, F. Groundwater use in Spain: An overview in light of the EU Water Framework Directive. Int. J. Water Resour. Dev. 2015, 31, 640–656. [Google Scholar] [CrossRef]
  27. Intergovernmental Panel on Climate Change. IPCC Climate Change and Land: An IPCC Special Report on Climate Change, Desertification, Land Degradation, Sustainable Land Management, Food Security, and Greenhouse Gas Fluxes in Terrestrial Ecosystems; Shukla, P.R., Skea, J., Calvo Buendia, E., Masson-Delmotte, V., Pörtner, H.-O., Roberts, D.C., Zhai, P., Slade, R., Connors, S., van Diemen, R., et al., Eds.; Intergovernmental Panel on Climate Change: Geneva, Switzerland, 2019. [Google Scholar]
  28. Custodio, E.; Andreu-Rodes, J.M.; Aragón, R.; Estrela, T.; Ferrer, J.; García-Aróstegui, J.L.; Manzano, M.; Rodríguez-Hernández, L.; Sahuquillo, A.; del Villar, A. Groundwater intensive use and mining in south-eastern peninsular Spain: Hydrogeological, economic and social aspects. Sci. Total Environ. 2016, 559, 302–316. [Google Scholar] [CrossRef]
  29. Hernández-Mora, N.; Martínez Cortina, L.; Llamas, R.; Custodio, E. Groundwater issues in Southern EU Member States. In Spain Country Report Groundwater in the Southern Member States of the European Union: An Assessment of Current Knowledge and Future Prospects; Country report for Spain; European Union: Madrid, Spain, 2007. [Google Scholar]
  30. Murillo, J.M.; Vega, L. Groundwater and protected natural areas in spain. The hydrogeological characterization of national parks. Bol. Geol. Min. 2019, 130, 549–592. [Google Scholar]
  31. Alcalá, F.J.; Martín-Martín, M.; Guerrera, F.; Martínez-Valderrama, J.; Robles-Marín, P. A feasible methodology for groundwater resource modelling for sustainable use in sparse-data drylands: Application to the Amtoudi Oasis in the northern Sahara. Sci. Total Environ. 2018, 630, 1246–1257. [Google Scholar] [CrossRef] [PubMed]
  32. MAGRAMA. Programa de Acción Nacional contra la Desertificación. Madrid; Ministerio de Agricultura y Medio Ambiente: Madrid, Spain, 2008. [Google Scholar]
  33. MITERD. Estrategia Nacional de Lucha Contra la Desertificación en España; MITERD: Madrid, Spain, 2022. [Google Scholar]
  34. Sivapalan, M.; Blöschl, G. Time scale interactions and the coevolution of humans and water. Water Resour. Res. 2015, 51, 6988–7022. [Google Scholar] [CrossRef]
  35. Wheater, H.S.; Gober, P. Water security and the science agenda. Water Resour. Res. 2015, 51, 5406–5424. [Google Scholar] [CrossRef]
  36. Forrester, J.W. Industrial Dynamics; The MIT Press: Cambridge, UK, 1961. [Google Scholar]
  37. Martínez-Valderrama, J.; Ibáñez, J.; Gartzia, R.; Alcalá, F.J. Dinámica de Sistemas para comprender los procesos de desertificación. Ecosistemas 2021, 30, 2091. [Google Scholar]
  38. Costanza, R. Ecological Economics: Reintegrating the Study of Humans and Nature. Ecol. Appl. 1996, 6, 978–990. [Google Scholar] [CrossRef]
  39. Reynolds, J.F.; Stafford Smith, D.M. Do humans cause deserts? In Global Desertification: Do Humans Cause Deserts? Dahlem Workshop Report 88; Reynolds, J.F., Stafford Smith, D.M., Eds.; Dahlem University Press: Berlin, Germany, 2002; pp. 1–21. [Google Scholar]
  40. Maestre, F.T. Plant Species Richness and Ecosystem Multifunctionality in Global Drylands. Science 2012, 214, 214–218. [Google Scholar] [CrossRef]
  41. Vetter, S. Rangelands at equilibrium and non-equilibrium: Recent developments in the debate. J. Arid Environ. 2005, 62, 321–341. [Google Scholar] [CrossRef]
  42. Martínez-Valderrama, J.; Ibáñez, J.; Del Barrio, G.; Sanjuán, M.E.; Alcalá, F.J.; Martínez-Vicente, S.; Ruiz, A.; Puigdefábregas, J. Present and future of desertification in Spain: Implementation of a surveillance system to prevent land degradation. Sci. Total Environ. 2016, 563–564, 169–178. [Google Scholar] [CrossRef]
  43. Instituto Nacional de Estadística Contabilidad Nacional Anual de España: Agregados por Rama de Actividad. Available online: https://www.ine.es/dyngs/INEbase/es/operacion.htm?c=Estadistica_C&cid=1254736177056&menu=resultados&idp=1254735576581 (accessed on 20 May 2022).
  44. Matarán Ruiz, A. Environmental Efficiency of Greenhouse Agriculture in the Coast of Granada (Spain): Towards New Planning and Management Criteria. Open Environ. Sci. 2008, 2, 114–123. [Google Scholar] [CrossRef]
  45. IGME (Instituto Geológico Minero de España); Junta de Andalucía. Acuíferos de la costa Granadina. In Atlas Hidrogeológico de Andalucía; Junta de Andalucia: Sevilla, Spain, 1998; pp. 168–171. [Google Scholar]
  46. Calvache, M.L. Acuíferos detríticos de la costa de Granada. In Aportaciones al Conocimiento de los Acuíferos Andaluces. Libro Homenaje a Manuel del Valle Cardenete; Rubi Campos, J.C., López Geta, J.A., Eds.; IGME, CHG, Instituto del Agua de Andalucía, Diputación Provincial de Granada: Madrid, Spain, 2002; pp. 425–444. [Google Scholar]
  47. Calvache, M.L.; Pulido-Bosch, A. Effects of geology and human activity on the dynamics of salt-water intrusion in three coastal aquifers in Southern Spain. Environ. Geol. 1997, 30, 215–223. [Google Scholar] [CrossRef]
  48. Pulido-Leboeuf, P. Seawater intrusion and associated processes in a small coastal complex aquifer (Castell de Ferro, Spain). Appl. Geochem. 2004, 19, 1517–1527. [Google Scholar] [CrossRef]
  49. Junta de Andalucía. Consejería de Medio Ambiente. Ciclo de Planificación Hidrológica 2015/2021. Plan Hidrológico. Demarcación Hidrográfica de las Cuencas Mediterráneas Andaluzas, Anejo II. Inventario de Recursos Hídricos; Junta de Andalucía: Sevilla, Spain, 2016. [Google Scholar]
  50. Benavente, J.; Fernández-Rubio, R.; Almócija, C. Hidrogeología de los acuíferos del sector oriental de la costa de Granada. In Proceedings of the Los Acuíferos Costeros de Andalucía Oriental: TIAC’88; López Geta, J.A., Ramos González, G., Fernández Rubio, R., Eds.; Almuñecar: Granada, Spain, 1988; pp. 171–208. [Google Scholar]
  51. Alcalá, F.J.; Custodio, E. Natural uncertainty of spatial average aquifer recharge through atmospheric chloride mass balance in continental Spain. J. Hydrol. 2015, 524, 642–661. [Google Scholar] [CrossRef]
  52. Junta de Andalucía. Demarcación Hidrográfica de las Cuencas Mediterráneas Andaluzas. Revisión de Tercer Ciclo (2021–2027). Apéndice 2. Fichas de Caracterización Adicional de las Masas de Agua Subterránea; Junta de Andalucía: Sevilla, Spain, 2021. [Google Scholar]
  53. IGME Hydrogeological Map of Spain, scale 1:200,000; Sheet no 83, Granada–Málaga. Available online: https://info.igme.es/cartografiadigital/tematica/Hidrogeologico200.aspx (accessed on 23 May 2022).
  54. Fernández Ales, R.; Martín, A.; Ortega, F.; Ales, E.E. Recent changes in landscape structure and function un a mediterranean region of SW Spain (1950–1984). Landsc. Ecol. 1992, 7, 3–18. [Google Scholar] [CrossRef]
  55. Aguilera, F.B.; Matarán, A.R.; Pérez, R.C.; Valenzuela, L.M.M. Simulating Greenhouse Growth in Urban Zoning on the Coast of Granada (Spain) BT. In Modelling Environmental Dynamics: Advances in Geomatic Solutions; Paegelow, M., Olmedo, M.T.C., Eds.; Springer: Berlin/Heidelberg, Germany, 2008; pp. 269–295. ISBN 978-3-540-68498-5. [Google Scholar]
  56. Sánchez-Picón, A.; Aznar-Sánchez, J.A.; García-Latorre, J. Economic cycles and environmental crisis in arid southeastern Spain. A historical perspective. J. Arid Environ. 2011, 75, 1360–1367. [Google Scholar] [CrossRef]
  57. Tout, D. The Horticulture Industry of Almería Province, Spain. Geogr. J. 1990, 156, 304–312. [Google Scholar] [CrossRef]
  58. Wolosin, R.T. El Milagro De Almeria, Espana: A Political Ecology of Landscape Change and Greenhouse Agriculture; University of Montana: Missoula, MT, USA, 2008. [Google Scholar]
  59. Matarán Ruiz, A. La Valoración Ambiental-Territorial de las Agriculturas de Regadío en el Litoral Mediterráneo: El Caso de Granada; University of Granada: Granada, Spain, 2005. [Google Scholar]
  60. Junta de Andalucía. Cartografía de Invernaderos en Almería, Granada y Málaga, Año 2019; Junta de Andalucía: Sevilla, Spain, 2019. [Google Scholar]
  61. Pérez-Mesa, J.C.; Aballay, L.; Serrano-Arcos, M.; Sánchez-Fernández, R. Analysis of Intermodal Transport Potentials for Vegetables Export from Southeast Spain. Sustainability 2020, 12, 8502. [Google Scholar] [CrossRef]
  62. Benavente, J. Consecuencias de la sobreexplotación en el acuífero costero de la rabla de Gualchos (Granada). In Proceedings of the IV Simposium Nacional de Hidrogeología, Palma de Mallorca, Spain, 5–9 October 1987; pp. 685–696. [Google Scholar]
  63. Calvache, M.L. Simulación Matemática del Contacto Agua Dulce-Agua Salada en Algunos Acuíferos de la Costa del Sol; Universidad de Granada: Granada, Spain, 1991. [Google Scholar]
  64. De Stefano, L.; Lopez-Gunn, E. Unauthorized groundwater use: Institutional, social and ethical considerations. Water Policy 2012, 14, 147–160. [Google Scholar] [CrossRef]
  65. Alcalá, F.J.; Martínez-Pagán, P.; Paz, M.C.; Navarro, M.; Pérez-Cuevas, J.; Domingo, F. Combining of MASW and GPR Imaging and Hydrogeological Surveys for the Groundwater Resource Evaluation in a Coastal Urban Area in Southern Spain. Appl. Sci. 2021, 11, 3154. [Google Scholar] [CrossRef]
  66. WWF. Manual de Buenas Prácticas de Riego; WWF: Madrid, Spain, 2009. [Google Scholar]
  67. Navarrete, M. Un Conflicto Entre Comunidades deja sin riego los Invernaderos de Castell. Ideal 2014. Available online: https://www.ideal.es/granada/costa/201409/22/conflicto-entre-comunidades-deja-20140921233214.html?ref=https%3A%2F%2Fwww.google.com%2F (accessed on 30 July 2022).
  68. Fernández, R. Agua de Rules a Través de la Contraviesa. Granada Hoy 2016. Available online: https://www.granadahoy.com/granada/Agua-Rules-traves-Contraviesa_0_1020798290.html (accessed on 30 July 2022).
  69. Fernández Motril, R. Sos: La Costa Oriental Agoniza sin Agua para Regar sus Cultivos. Granada Hoy. 2014. Available online: https://www.granadahoy.com/granada/Sos-Costa-oriental-agoniza-cultivos_0_845615819.html (accessed on 30 July 2022).
  70. Paul, C.; Techen, A.K.; Robinson, J.S.; Helming, K. Rebound effects in agricultural land and soil management: Review and analytical framework. J. Clean. Prod. 2019, 227, 1054–1067. [Google Scholar] [CrossRef]
  71. Phan, T.D.; Bertone, E.; Stewart, R.A. Critical review of system dynamics modelling applications for water resources planning and management. Clean. Environ. Syst. 2021, 2, 100031. [Google Scholar] [CrossRef]
  72. Aracil, J. Introducción a la Dinámica de Sistemas; Alianza Editorial: Spain, Madrid, 1986. [Google Scholar]
  73. Sterman, J.D. Business Dynamics: Systems Thinking and Modeling for a Complex World; Mc Graw Hill: New York, NY, USA, 2000; ISBN 0-07-231135-5. [Google Scholar]
  74. Akhavan, A.; Gonçalves, P. Managing the trade-off between groundwater resources and large-scale agriculture: The case of pistachio production in Iran. Syst. Dyn. Rev. 2021, 37, 155–196. [Google Scholar] [CrossRef]
  75. Martínez Fernández, J.; Selma, M.A.E. The dynamics of water scarcity on irrigated landscapes: Mazarrón and Aguilas in south-eastern Spain. Syst. Dyn. Rev. 2004, 20, 117–137. [Google Scholar] [CrossRef]
  76. Martínez-Valderrama, J.; Ibañez, J.; Alcalá, F.J.; Dominguez, A.; Yassin, M.; Puigdefábregas, J. The use of a hydrological-economic model to assess sustainability in groundwater-dependent agriculture in drylands. J. Hydrol. 2011, 402, 80–91. [Google Scholar] [CrossRef]
  77. De Wit, M.; Crookes, D.J. Improved decision-making on irrigation farming in arid zones using a system dynamics model. S. Afr. J. Sci. 2013, 109, 1–8. [Google Scholar] [CrossRef]
  78. Alcalá, F.J.; Martínez-Valderrama, J.; Robles-Marín, P.; Guerrera, F.; Martín-Martín, M.; Raffaelli, G.; de León, J.T.; Asebriy, L. A hydrological-economic model for sustainable groundwater use in sparse-data drylands: Application to the Amtoudi Oasis in southern Morocco, northern Sahara. Sci. Total Environ. 2015, 537, 309–322. [Google Scholar] [CrossRef]
  79. Martinez-Valderrama, J.; Ibáñez, J.; Alcalá, F.J. AQUACOAST: A Simulation Tool to Explore Coastal Groundwater and Irrigation Farming Interactions. Sci. Program. 2020, 20, 9092829. [Google Scholar] [CrossRef]
  80. Ibáñez, J.; Martínez-Valderrama, J.; Puigdefábregas, J. Assessing desertification risk using system stability condition analysis. Ecol. Modell. 2008, 213, 180–190. [Google Scholar] [CrossRef]
  81. Lotka, A.J. Elements of Mathematical Biology; Dover Publications: New York, NY, USA, 1956. [Google Scholar]
  82. Volterra, V. Variations and fluctuations of the number of individuals in animal species living together. In Animal Ecology; Chapman, B.M., Ed.; McGraw-Hill: New York, NY, USA, 1931; pp. 409–448. [Google Scholar]
  83. Noy-Meir, I. Stability of grazing systems: An application of predator-prey graphs. J. Ecol. 1975, 63, 459–481. [Google Scholar] [CrossRef]
  84. Rosenzweig, M.L.; MacArthur, R.H. Graphical representation and stability conditions of predator-prey interactions. Am. Nat. 1963, 97, 209–223. [Google Scholar] [CrossRef]
  85. Junta de Andalucía Observatorio de Precios y Mercados [Price and Market Observatory]. Available online: https://www.juntadeandalucia.es/agriculturaypesca/observatorio/servlet/FrontController?ec=default (accessed on 2 February 2020).
  86. Valenzuela Montes, L.M.; Matarán Ruiz, A. Environmental indicators to evaluate spatial and water planning in the coast of Granada (Spain). Land Use Policy 2008, 25, 95–105. [Google Scholar] [CrossRef]
  87. INE (Instituto Nacional de Estadística) Estadística sobre el Suministro y Saneamiento del Agua. Año 2018. Available online: https://www.ine.es/prensa/essa_2018.pdf (accessed on 15 June 2022).
  88. Government of Spain, Ministry of Industry, Trade and Tourism. Precio neto de la Electricidad para uso Doméstico y uso Industrial. Available online: https://www.mincotur.gob.es/es-es/IndicadoresyEstadisticas/BoletinEstadistico/Energ%C3%ADa%20y%20emisiones/4_12.pdf (accessed on 15 June 2022).
  89. Cajamar Análisis de Campaña Hortofrutícola de Almería [Analysis of the Fruit and Vegetable Season in Almeria]. 2001–2022. Available online: https://www.publicacionescajamar.es/series-tematicas/informes-coyuntura-analisis-de-campana/pagina/1 (accessed on 20 April 2022).
  90. Valera, D.; Molina, D.; Belmonte, J.; López, A. Greenhouse Agriculture in Almeria. A Comprenhensive Techno-Economic Analysis; Cajamar: Almeria, Spain, 2016. [Google Scholar]
  91. Samper, J. Apuntes sobre acuíferos costeros. Hidrol. Subterranea 2013. Available online: https://www.docsity.com/es/acuiferos-costeros-hidrologia-subterranea-apuntes/155449/ (accessed on 15 February 2021).
  92. CottonInfo Fundamentals of Energy Use in Water Pumping; Australian Government, Department of Industry and Science: Narrabri, Australia, 2015.
  93. Perry, G.L.W.; Millington, J.D.A. Spatial modelling of succession-disturbance dynamics in forest ecosystems: Concepts and examples. Perspect. Plant Ecol. Evol. Syst. 2008, 9, 191–210. [Google Scholar] [CrossRef]
  94. Sterman, J. All models are wrong: Reflections on becoming a systems scientist. Syst. Dyn. Rev. 2002, 18, 501–531. [Google Scholar] [CrossRef]
  95. Martínez-Valderrama, J.; Ibáñez, J.; Alcalá, F.J.; Martínez, S. SAT: A Software for Assessing the Risk of Desertification in Spain. Sci. Program. 2020, 2020, 7563928. [Google Scholar] [CrossRef]
  96. Junta de Andalucia. El Clima de Andalucía en el Siglo XXI. Escenarios Locales de Cambio Climático de Andalucía. Resultados. Actualización al 4o Informe del Grupo Intergubernamental de Expertos Sobre el Cambio Climático; Junta de Andalucia: Sevilla, Spain, 2014. [Google Scholar]
  97. EFEAgro La Electricidad y los Abonos Dispararon los Costes Agrícolas en 2021 2022. 2022. Available online: https://efeagro.com/la-electricidad-abonos-2021/ (accessed on 21 May 2022).
  98. Madueño, J.J. El precio de las frutas y las verduras ha subido un 35% en el último año. ABC Andal. 2022. Available online: https://sevilla.abc.es/andalucia/malaga/sevi-precio-frutas-y-verduras-subido-35-por-ciento-ultimo-202203152032_noticia.html (accessed on 30 July 2022).
  99. Reynolds, J.F. Desertification is a prisoner of history: An essay on why young scientists should care. Ecosistemas 2021, 30, 2302. [Google Scholar] [CrossRef]
  100. Smith, W.K.; Dannenberg, M.P.; Yan, D.; Herrmann, S.; Barnes, M.L.; Barron-gafford, G.A.; Biederman, J.A.; Ferrenberg, S.; Fox, A.M.; Hudson, A.; et al. Remote sensing of dryland ecosystem structure and function: Progress, challenges, and opportunities. Remote Sens. Environ. 2019, 233, 111401. [Google Scholar] [CrossRef]
  101. Tucker, C.J. Red and photographic infrared linear combinations for monitoring vegetation. Remote Sens. Environ. 1979, 8, 127–150. [Google Scholar] [CrossRef]
  102. Prince, S.D. A model of regional primary production for use with coarse resolution satellite data. Int. J. Remote Sens. 1991, 12, 1313–1330. [Google Scholar] [CrossRef]
  103. del Barrio, G.; Puigdefabregas, J.; Sanjuan, M.E.; Stellmes, M.; Ruiz, A. Assessment and monitoring of land condition in the Iberian Peninsula, 1989–2000. Remote Sens. Environ. 2010, 114, 1817–1832. [Google Scholar] [CrossRef]
  104. Tapley, B.D.; Bettadpur, S.; Ries, J.C.; Thompson, P.F.; Watkins, M.M. GRACE Measurements of Mass Variability in the Earth System. Science 2004, 305, 503–505. [Google Scholar] [CrossRef] [PubMed]
  105. Zaitchik, B.F.; Rodell, M.; Reichle, R.H. Assimilation of GRACE Terrestrial Water Storage Data into a Land Surface Model: Results for the Mississippi River Basin. J. Hydrometeorol. 2008, 9, 535–548. [Google Scholar] [CrossRef]
  106. Cowie, A.L.; Orr, B.J.; Castillo Sanchez, V.M.; Chasek, P.; Crossman, N.D.; Erlewein, A.; Louwagie, G.; Maron, M.; Metternicht, G.I.; Minelli, S.; et al. Land in balance: The scientific conceptual framework for Land Degradation Neutrality. Environ. Sci. Policy 2018, 79, 25–35. [Google Scholar] [CrossRef]
  107. UNCCD. Report of the Conference of the Parties on Its Twelfth Session, Held in Ankara from 12 to 23 October 2015. Part Two: Actions Taken by the Conference of the Parties at Its Twelfth Session; ICCD/ COP(12)/20/Add; UNCCD: Bonn, Germany, 2015. [Google Scholar]
  108. Safriel, U. Land degradation neutrality (LDN) in drylands and beyond—Where has it come from and where does it go. Silva Fenn. 2017, 51, 20–24. [Google Scholar] [CrossRef] [Green Version]
  109. Grainger, A. Is Land Degradation Neutrality feasible in dry areas? J. Arid Environ. 2015, 112, 14–24. [Google Scholar] [CrossRef]
  110. Mainguet, M.; Da Silva, G.G. Desertification and drylands development: What can be done? L. Degrad. Dev. 1998, 9, 375–382. [Google Scholar] [CrossRef]
  111. Kratli, S. Valuing Variability; International Institute for Environment and Development: London, UK, 2015; ISBN 9781784311575. [Google Scholar]
  112. UN. Global Drylands: A UN System-Wide Response; UN: San Francisco, CA, USA, 2011. [Google Scholar]
  113. Molle, F. Why enough is never enough: The societal determinants of river basin closure. Int. J. Water Resour. Dev. 2008, 24, 217–226. [Google Scholar] [CrossRef]
  114. Mysiak, J.; Gómez, C.M. Water Pricing and Taxes: An Introduction. In Use of Economic Instruments in Water Policy; Lago, M., Mysiak, J., Gómez, C.M., Delacámara, G., Maziotis, A., Eds.; Springer: Cham, Switzerland, 2015; pp. 15–20. ISBN 9783319182872. [Google Scholar]
  115. Nabhan, G.P.; Riordan, E.C.; Monti, L.; Rea, A.M.; Wilder, B.T.; Ezcurra, E.; Mabry, J.B.; Aronson, J.; Barron-Gafford, G.A.; García, J.M.; et al. An Aridamerican model for agriculture in a hotter, water scarce world. Plants People Planet 2020, 2, 627–639. [Google Scholar] [CrossRef]
  116. Mukherji, A. Political ecology of groundwater: The contrasting case of water-abundant West Bengal and water-scarce Gujarat, India. Hydrogeol. J. 2006, 14, 392–406. [Google Scholar] [CrossRef]
  117. Oxley, T.; McIntosh, B.S.; Winder, N.; Mulligan, M.; Engelen, G. Integrated modelling and decision-support tools: A Mediterranean example. Environ. Model. Softw. 2004, 19, 999–1010. [Google Scholar] [CrossRef]
  118. Evans, M.R.; Grimm, V.; Johst, K.; Knuuttila, T.; de Langhe, R.; Lessells, C.M.; Merz, M.; O’Malley, M.A.; Orzack, S.H.; Weisberg, M.; et al. Do simple models lead to generality in ecology? Trends Ecol. Evol. 2013, 28, 578–583. [Google Scholar] [CrossRef]
  119. Vrba, J.; Hirata, R.; Girman, J.; Haie, N.; Lipponen, A.; Neupane, B.; Shah, T.; Wallin, B. Groundwater Resources Sustainability Indicators. In Proceedings of the International Symposium on Groundwater Sustainability (ISGWAS), Alicante, Spain, 24–27 January 2006; pp. 33–52. [Google Scholar]
  120. Jakeman, A.J.; Letcher, R.A. Integrated assessment and modelling: Features, principles and examples for catchment management. Environ. Model. Softw. 2003, 18, 491–501. [Google Scholar] [CrossRef]
  121. Harou, J.J.; Pulido-Velazquez, M.; Rosenberg, D.E.; Medellín-Azuara, J.; Lund, J.R.; Howitt, R.E. Hydro-economic models: Concepts, design, applications, and future prospects. J. Hydrol. 2009, 375, 627–643. [Google Scholar] [CrossRef] [Green Version]
Figure 1. (a) Location of the Andalusian Mediterranean Watershed in Southern Spain. (b) Location of the Rules–Béznar System (RBS, box in (a) of hydraulic infrastructures (reservoirs and channels) in the coastal fringe of the Granada Province. Coastal aquifers are brown areas. (c) Satellite image of the GSB in 2021 (source: Google Earth), showing the greenhouses occupation (white spots). (d) Simplified hydrogeological map of the GSB from [45,53], showing the main aquifers (1—Quaternary alluvial; 2—Triassic carbonates) and bedrock (3—metapelitic rocks), as well as other geographic features (4—geological contact; 5—Castell de Ferro alluvial aquifer; 6—urban area; 7—the 400 m elevation channel from RBS).
Land 11 01626 g001
Figure 2. Stock and flow structure of the Aquacoast model adapted for the GSB case. Rectangles represent the stock variables of the model and double arrows and valves represent flow variables. The rest of elements in the sketch are auxiliary variables and parameters, whose influences are shown by blue solid arrows.
Land 11 01626 g002
Figure 3. Time trajectories under the default scenario of (a) irrigated area, (b) fresh groundwater, (c) groundwater salinity and (d) water imported annually to the GSB.
Land 11 01626 g003
Figure 4. Comparison of the default scenario (blue line) with alternative scenarios (green and red lines). The scenarios are specified in Supplementary Table S3. In Scenario I, a 14.4% drop in “average rainfall recharge” is simulated (green line in the left column charts). In Scenario II, this drop is 26.6% (red line in the left column charts). Scenario III includes an 85% increase in “energy price”, and a 35% in “price of one cubic meter of external water” and “other costs per hectare” (red line in the middle column charts). Finally, Scenario IV includes a 20.5% reduction in the parameter “average rainfall recharge”, the same increases in costs as Scenario III and a 35% increase in the parameter “revenue per hectare” (red line in the right column charts).
Land 11 01626 g004
Figure 5. Cloud of the indicator end values after simulating 200 scenarios that combine different random values of the parameters “average rainfall recharge” and “revenue per hectare”. The red line indicates the degradation threshold considered for “Groundwater salinity” (40 dS m−1). Blue and purple lines indicate the thresholds considered for “Water imported annually” (1.5 and 3 mm3 yr−1).
Land 11 01626 g005
Publisher’s Note: MDPI stays neutral with regard to jurisdictional claims in published maps and institutional affiliations.

