
Assessing the Water Conservation Function Based on the InVEST Model: Taking Poyang Lake Region as an Example
Institute of Ecological Civilization, Jiangxi University of Finance and Economics, Nanchang 330013, China
*
Author to whom correspondence should be addressed.
Land 2022, 11(12), 2228; https://0-doi-org.brum.beds.ac.uk/10.3390/land11122228
Submission received: 22 November 2022
/
Revised: 2 December 2022
/
Accepted: 6 December 2022
/
Published: 7 December 2022
(This article belongs to the Special Issue Land Use and Rural Sustainability)
Abstract
:This paper analyzes the spatiotemporal patterns, water yield and water conservation function of different land use types in Poyang Lake Region, China, during 1990–2020 by using national land use, meteorological, soil, DEM data, etc., based on the InVEST model. The results showed that: (1) Cultivated land, forestland and water area were the main land use types in Poyang Lake Region during 1990–2020. Construction land and forestland were increasing, while grassland, unused land, cultivated land and water area were decreasing. (2) The increasing construction land was mainly derived from cultivated land. Mutual transfer existed between cultivated land and forestland, as well as between cultivated land and water area. (3) With a downward–upward–downward fluctuating trend, the average annual water yield of Poyang Lake Region was 16.17 × 10⁹ m³, and the water conservation was 53.11 × 10⁸ m³. The average water conservation capacity was 270.98 mm. The vegetation cover area with high water conservation value was mainly concentrated in the northwest of Jiujiang City and the northeast of Poyang County. (4) The average water conservation of different land use types during 1990–2020 was ranked as follows: water area > cultivated land > forestland > construction land > grassland > unused land. The water conservation capacity was ranked as follows: water area > grassland > forestland > cultivated land > construction land > unused land.
1. Introduction
With the shortage of water resources becoming a global concern, water conservation has become one of the most important service functions and the key factor in the sustainable development of watershed ecosystems [1]. Generally, the water conservation function refers to the process and ability of an ecosystem to retain water by intercepting, infiltrating, and storing precipitation in a certain spatial and temporal scale through the forest canopy, litter, soil, lakes, reservoirs, etc. [2]. It not only affects the regional ecosystem productivity, nutrient cycling, environmental purification, etc., but also influences the sustainable development of the regional socio-economic system [3,4]. Spatial-temporal variations of water conservation not only directly affect the status of natural elements and ecosystem processes in the basin, but also indirectly affect the ecosystems and water resources in downstream areas, initiating a new round of human–water interaction synergistic effects [2]. Therefore, studies on the water conservation function have become a hotspot in ecology, hydrology, social economics, environmental science and other related disciplines [5,6]. Previous studies showed that changes in land use could affect ecosystem patterns and local ecohydrological processes, resulting in indirect impacts. In some regions, land use acts as the dominant factor influencing the water conservation function. Therefore, the study of the spatiotemporal variation of the water conservation function under changing land-use patterns is also a focus of attention [7].
Common methods for regional water conservation assessment include the water balance method, soil water storage method [8], precipitation storage method [9], annual runoff method [10], underground runoff growth method [11], comprehensive water storage method, canopy interception method, etc. [12]. Among them, the water balance method based on the process of water conservation is characterized by easy operation, convenient data acquisition and high accuracy, which make it the most widely used method of water conservation assessment at present. The InVEST model jointly developed by Stanford University, the World Wide Fund for Nature and the Nature Conservancy enables the evaluation of a variety of ecological functions and is advantageous in dynamic monitoring, use cost and open access. Its multi-module design provides an effective tool for the assessment of ecological services. Taking water balance as the basic principle, the water yield module of the InVEST model calculates the actual evapotranspiration through the Budyko theory, then calculates the water yield produced by a grid cell by combining data regarding rainfall, soil, and root depth coefficient. Compared with the traditional methods, it has a good performance in visualization and strong dynamics and has been widely used in water yield studies [13,14,15,16,17,18].
Poyang Lake is the largest freshwater lake in China and the largest river-communicating lake in the Yangtze River Basin. It is also an important wetland and wintering place for migratory birds with world influence, playing an irreplaceable role in water conservation, flood regulation, climate regulation, water purification, regional biodiversity maintenance, etc. [19]. Owing to its extremely important ecological status, Poyang Lake Wetland was included in the “List of Most Important Wetlands in the World” by the United Nations Scientific and Educational Organization (UNESCO) in 1995. With the rapid development of social economy, human activities such as reclaiming land from lakes, sand mining, and construction of water conservancy projects have affected the water level and volume of Poyang Lake, threatening its water conservation function. Furthermore, the climate change, vegetation change, population growth and urbanization experienced in the Poyang Lake Region during the past decades have exacerbated the uncertainty of the water conservation function. As one of the world’s important ecological areas designated by the World Wide Fund for Nature, protecting the water conservation function of Poyang Lake Region is particularly important for realizing a sustainable use of regional water resources. In the context of climate change and human interference, quantitatively assessing the impact of land use change on the water conservation function in the region is of great practical significance for watershed ecological restoration, regional water resources management, ecological barrier optimization and coping with climate change risks. It also provides a theoretical basis for understanding and applying the water conservation function.
Previous studies regarding Poyang Lake Region have covered fields including land use and landscape pattern changes [20], land use sustainability measurement [21], landscape ecological risk assessment [22], key ecological spaces identification [19], ecological security evaluation [23], ecosystem service evaluation [24], spatiotemporal difference analysis of cultivated land use intensity [25], NDVI evolution and drivers [26], etc., while studies on the water conservation function associated with land use change are still insufficient. Therefore, this study aimed to solve the following scientific questions:
- (1)
- How did the land use pattern change in Poyang Lake Region during 1990–2020?
- (2)
- What was the evolutionary trend of the water conservation function in Poyang Lake Region during 1990-2020?
- (3)
- What were the effects of different land use patterns on the water conservation function?
Taking Poyang Lake Region as an example, using land use data from 1990, 2000, 2010 and 2020, this paper analyzed the land-use spatiotemporal changes and transfer characteristics in Poyang Lake Region and then evaluated the water conservation function of Poyang Lake Region through the InVEST model by combining meteorological, soil, DEM data etc., so as to provide a scientific basis for the protection and management of the water conservation function in Poyang Lake Region.
2. Methods and Data
2.1. Overview of the Study Area
Poyang Lake (28°22′~29°45′, 115°47′~116°45′ E), located on the south bank of the middle and lower reaches of the Yangtze River, in the north of Jiangxi Province, is the largest freshwater lake in China. It is an alternately filled water-carrying seasonal lake, with an annual flow of about 1.457 × 10¹¹ m3 into the Yangtze River, accounting for about 15.6% of the Yangtze River water volume. With an average annual rainfall of 1542 mm [27], the region has a subtropical humid monsoon climate, which is characterized by cold winter and spring, a rainy summer, and a dry autumn due to the influence of the Siberian cold current and subtropical high pressure [28]. As an important water ecological safety barrier in the middle and lower reaches of the Yangtze River, Poyang Lake plays a great role in regulating the water level of the Yangtze River, water conservation, improving the local climate and maintaining an ecological balance in the surrounding areas. The Poyang Lake Region (Figure 1) includes 13 counties and municipalities, including Po-yang, Yugan, Duchang, Hukou, Yongxiu, Gongqingcheng, Lushan, Xunyang, Lianxi, De’an, Nanchang, Xinjian, and Jinxian, with a land area of 19,598.83 km², accounting for 11.74% of the total area of Jiangxi Province in China. The gross domestic product (GDP) of the Poyang Lake Region in 2020 was CNY 407.306 billion, accounting for 17.55% of Jiangxi’s GDP [29].
2.2. Data Sources
(1) Land use data and classification. Land use data were derived from Zenodo [30]. Using raster data with a spatial resolution of 30 m in 1990, 2000, 2010 and 2020, the microscopic characteristics of changes in land use and water conservation function can be better revealed. Through ArcGIS extraction and reclassification, the land use types are divided into the following six categories (Figure 2): cultivated land, forestland, grassland, water area, unused land and construction land.
(2) Soil data, including soil depth, soil type and organic matter content. Derived from the World Soil Database, soil data were defined and projected, and a raster attribute table was constructed and clipped.
(3) Rainfall data. The annual data of 1990–2020 with a resolution of 1 km were used; they were cropped and processed. They were derived from the National Science and Technology Basic Conditions Platform-National Earth System Science Data Center (http://www.geodata.cn, accessed on 1 July 2022).
(4) Potential evapotranspiration data. The monthly data of 1990–2020 with a resolution of 1 km were reclassified and cropped. They were derived from the National Earth System Science Data Center (http://www.geodata.cn, accessed on 1 July 2022), the National Science and Technology Basic Conditions Platform.
(5) DEM data. Shuttle Radar Topography Mission (SRTM) data from the U.S. Space Shuttle Endeavour with a spatial resolution of 30 m were adopted.
(6) Watershed data of the study area. Based on the DEM data, they were extracted by ArcGIS10.7 (ESRI, Inc, Redlands, CA, USA) hydrological analysis tools.
(7) Zhang coefficient. Z is an empirical constant used to capture local precipitation patterns and hydrogeological features, with typical values ranging from 1 to 30. According to Donohue et al. [31], Z can be estimated as 0.2*N, where N is the number of rainfall events per year. The average of rainfall events from 2011 to 2021 was obtained through a historical weather query (https://lishi.tianqi.com, accessed on 1 July 2022), and Z was finally determined as 9.74.
(8) Table of biophysical parameters. This table contains vegetation evapotranspiration coefficients and maximum root depths for different land use/cover types (see Table 1 for relevant research results [32,33] and the InVEST Model Manual) [34].
The data used in the study used a same projected coordinate system with a resolution of 30 m × 30 m.
2.3. Land Use Type Transfer Matrix
The land use type transfer matrix was derived from system analysis [35] by applying the Markov’s model of land use change. It can quantify the direction and amount of transfer between different land use types and clearly displays spatiotemporal changes [36,37]. It can be expressed as follows [38]:
In Formula (1), S is the land area; n is the number of types of land use; i, j are the types of land use at the beginning and end of the study period, respectively.
2.4. Water Conservation Module of the InVEST Model
2.4.1. Water Yield Assessment Model
The water yield module of the InVEST model, based on the Budyko curve [39] and annual precipitation, determines the annual water yield of each grid cell. The calculation and formulas are as follows:
In Formula (2), Y(x) represents the annual water yield of a grid cell (mm); P(x) represents the annual precipitation (mm) of a raster cell; AET(x) represents the annual actual evapotranspiration of a grid cell in mm. (AET(x))/(P(x)) is the ratio of the actual evapotranspiration to rainfall, which is calculated as follows [40]:
In Formula (3), R(x) is the dryness index, dimensionless; W(x) is the ratio of available water for plants to precipitation, dimensionless. They can be calculated by Equations (4) and (5), respectively:
In Formulas (4) and (5), is the vegetation evapotranspiration coefficient; is the potential evapotranspiration of a raster cell (consistent with the meaning of the reference evapotranspiration in the model). The data are calculated by the Hargreaves method [41]. is the usable moisture content (mm) of vegetation, which is calculated by Equation (6):
In Formula (6), indicates the maximum depth of the land; indicates the maximum depth of the root system; PAWC is the water content available to vegetation (%), which is calculated by Equation (7) [42]:
In formula (7), Sand, Silt, Clay, OM denote the soil sand content (%), powder content (%), clay content (%) and organic matter content (%), which are derived from national soil data. Among them, the soil organic matter content is calculated by the soil organic carbon content, which is 1.724 times the soil organic carbon content [43].
2.4.2. Estimation of Water Conservation
The annual water yield is the difference between annual rainfall and evapotranspiration for each grid cell, including surface water yield, canopy interception, soil moisture content and litter retention [44]. According to the principle of water balance, the water conservation of grid cells is obtained by correcting the runoff coefficients [45,46] of different land use types. The calculation is as follows:
In Formulas (8) and (9), denotes the water conservation of a grid cell; is the surface runoff of a grid cell; is the runoff coefficient. The detailed research framework is shown in Figure 3.
3. Results and Analysis
3.1. Analysis of Land Use Change
The change scale of different land use types in Poyang Lake Region during 1990–2020 is shown in Figure 4. Cultivated land, forestland and water area, with the average proportion of 55.63%, 22.52% and 17.62%, respectively, were the main regional land use types. The average proportion of construction land was 4.04%. The total proportion of grassland and unused land was less than 1%.
The area of each land use type was calculated by ArcGIS (Table 2). The area and structure of each land use type in Poyang Lake Region changed to varying degrees during 1990–2020. The total area of cultivated land, grassland, water area and unused land decreased, while forestland and construction land increased from 1990 to 2020. Specifically, the cultivated land area decreased by 666.49 km², accounting for 3.4% of the total area of Poyang Lake Region, which is 19,598.83 km². The grassland area decreased by 39.30 km², accounting for 0.20%. The water area decreased by 188.46 km², accounting for 0.96%. The unused land area with a small proportion decreased from 17.30 km² to 9.78 km², with a decrease of 43.47%. Among the land use types with an increased area, the construction land area increased from 414.64 km² to 1202.06 km², with an stunning increase of 189.91%, while the increase in forestland was 114.34 km², with an increase of 2.66%.
3.2. Land Use Type Transfer Changes
Based on the land use transfer matrix and spatial distribution by the ArcGIS tool (Figure 5), a Sankey map was adopted to visualize the transfer of land use types from 1990 to 2020 (Figure 6). The land use types are shown at the left and right sides of the Sankey map. In Figure 5, the width of the column bar represents the flow size, that is, the area of each land use type. The line thickness of the flow direction represents the proportional size of the land use type transfer. Table 3 shows the values of the land use type transfer, including the transfer area and the proportions of transferred-in and transfer-out areas.
Referring to Figure 4 and Table 3, the transfer-in area of cultivated land was 1096.56 km², while the transfer-out area was 1763.05 km², 1.61 times that of the transfer-in area. It is obvious that the cultivated land area was greatly reduced. The cultivated land was mainly converted into forestland, water area and construction land, amounting to 685.73 km², 385.30 km² and 690.53 km² and accounting for 38.89%, 21.85% and 39.17%, respectively. The transfer-in cultivated land was mainly converted from forestland and water area, amounting to 535.17 km² and 547.89 km² and accounting for 48.80% and 49.96%, respectively. The transfer-out area of forestland was 584.3 km², while the transfer-in area was 698.65 km², i.e., 1.2 times that of the transfer-out area. The total forestland area increased slightly. Forestland was mainly converted into cultivated land and construction land, amounting to 535.17 km² and 42.93 km² and accounting for 91.59% and 7.35%, respectively. The transfer-in forestland was mainly converted from cultivated land, accounting for 98.15%. It is obvious that a mutual conversion existed between cultivated land and forestland. The transfer-out water area was 608.90 km², while the transfer-in area was 420.44 km². The transfer-out area was 1.45 times the transfer-in area, and the water area saw a decrease during 1990–2020. A frequent mutual conversion existed between water area and cultivated land. We found that 91.64% of transfer-in water area was converted from cultivated land, and 89.98% of transfer-out water area was converted into cultivated land. The area of grassland and unused land was small, and most of the area was converted into construction land and water area. The transfer-out area of construction land was 16.20 km², while the transfer-in area was 803.62 km², almost 50 times the transfer-out area. The construction land, which grew exponentially, was mainly converted from cultivated land, amounting to 690.53 km². It accounted for almost 85.93% of the transfer-in construction land, while forestland and water area accounted for 5.34% and 5.94%, respectively.
The land conversion in Poyang Lake during 1990–2020 showed that the transfer-out land mainly included cultivated land, forestland and water area, while the transfer-in land was mainly construction land. Cultivated land was usually converted into forestland, water area, and construction land. A mutual conversion existed between forestland, water area and cultivated land. The massive construction land expansion in the past 30 years mainly derived from the conversion of cultivated land, which coincided with a reduction in the cultivated land area. Though the grassland and unused land areas were small, most of them were converted into water area and construction land.
3.3. Assessment of the Water Conservation Function
3.3.1. Temporal and Spatial Variation of Water Conservation
The average annual water yield in Poyang Lake was 14.11 × 10⁹ m³ from 1990 to 2020. During 1990–2000, the water yield decreased to a minimum of 11.07 × 10⁹ m³, with an annual change rate of 2.51%, but it increased significantly to a maximum of 22.46 × 10⁹ m³, with an annual growth rate of 7.33% during 2000–2010, and the water yield decreased by 54.81 × 10⁸ m³ during 2010–2020. In general, the water yield showed an increasing trend with fluctuations, with an average annual increase of 9.30 × 10⁸ m³ during 1990–2020 (Table 4).
According to the runoff coefficient of different land use types, the water yield obtained by the InVEST model was modified to evaluate the extent of water conservation. Consistent with the fluctuating trend in water yield, water conservation in Poyang Lake Region showed an upward trend with “downward–upward–downward” fluctuations during 1990–2020, with an annual average water conservation of 53.11 × 10⁸ m³. Increasing from a minimum of 20.76 × 10⁸ m³ in 2000 to a maximum of 93.57 × 10⁸ m³ in 2010, water conservation saw the largest fluctuation with an annual growth rate of 16.25% during 2000–2010. As water yield and water conservation were affected by multiple factors such as rainfall, evapotranspiration, altitude, etc. [47,48], the fluctuations of water yield and water conservation were inconsistent with the change in land area in the past 30 years. While the precipitation in Poyang Lake Region in 2000 was little, the year 2010 turned out to be abundant in precipitation. The substantially increased rainfall offset the reduction of water yield and water conservation due to the decreased water area.
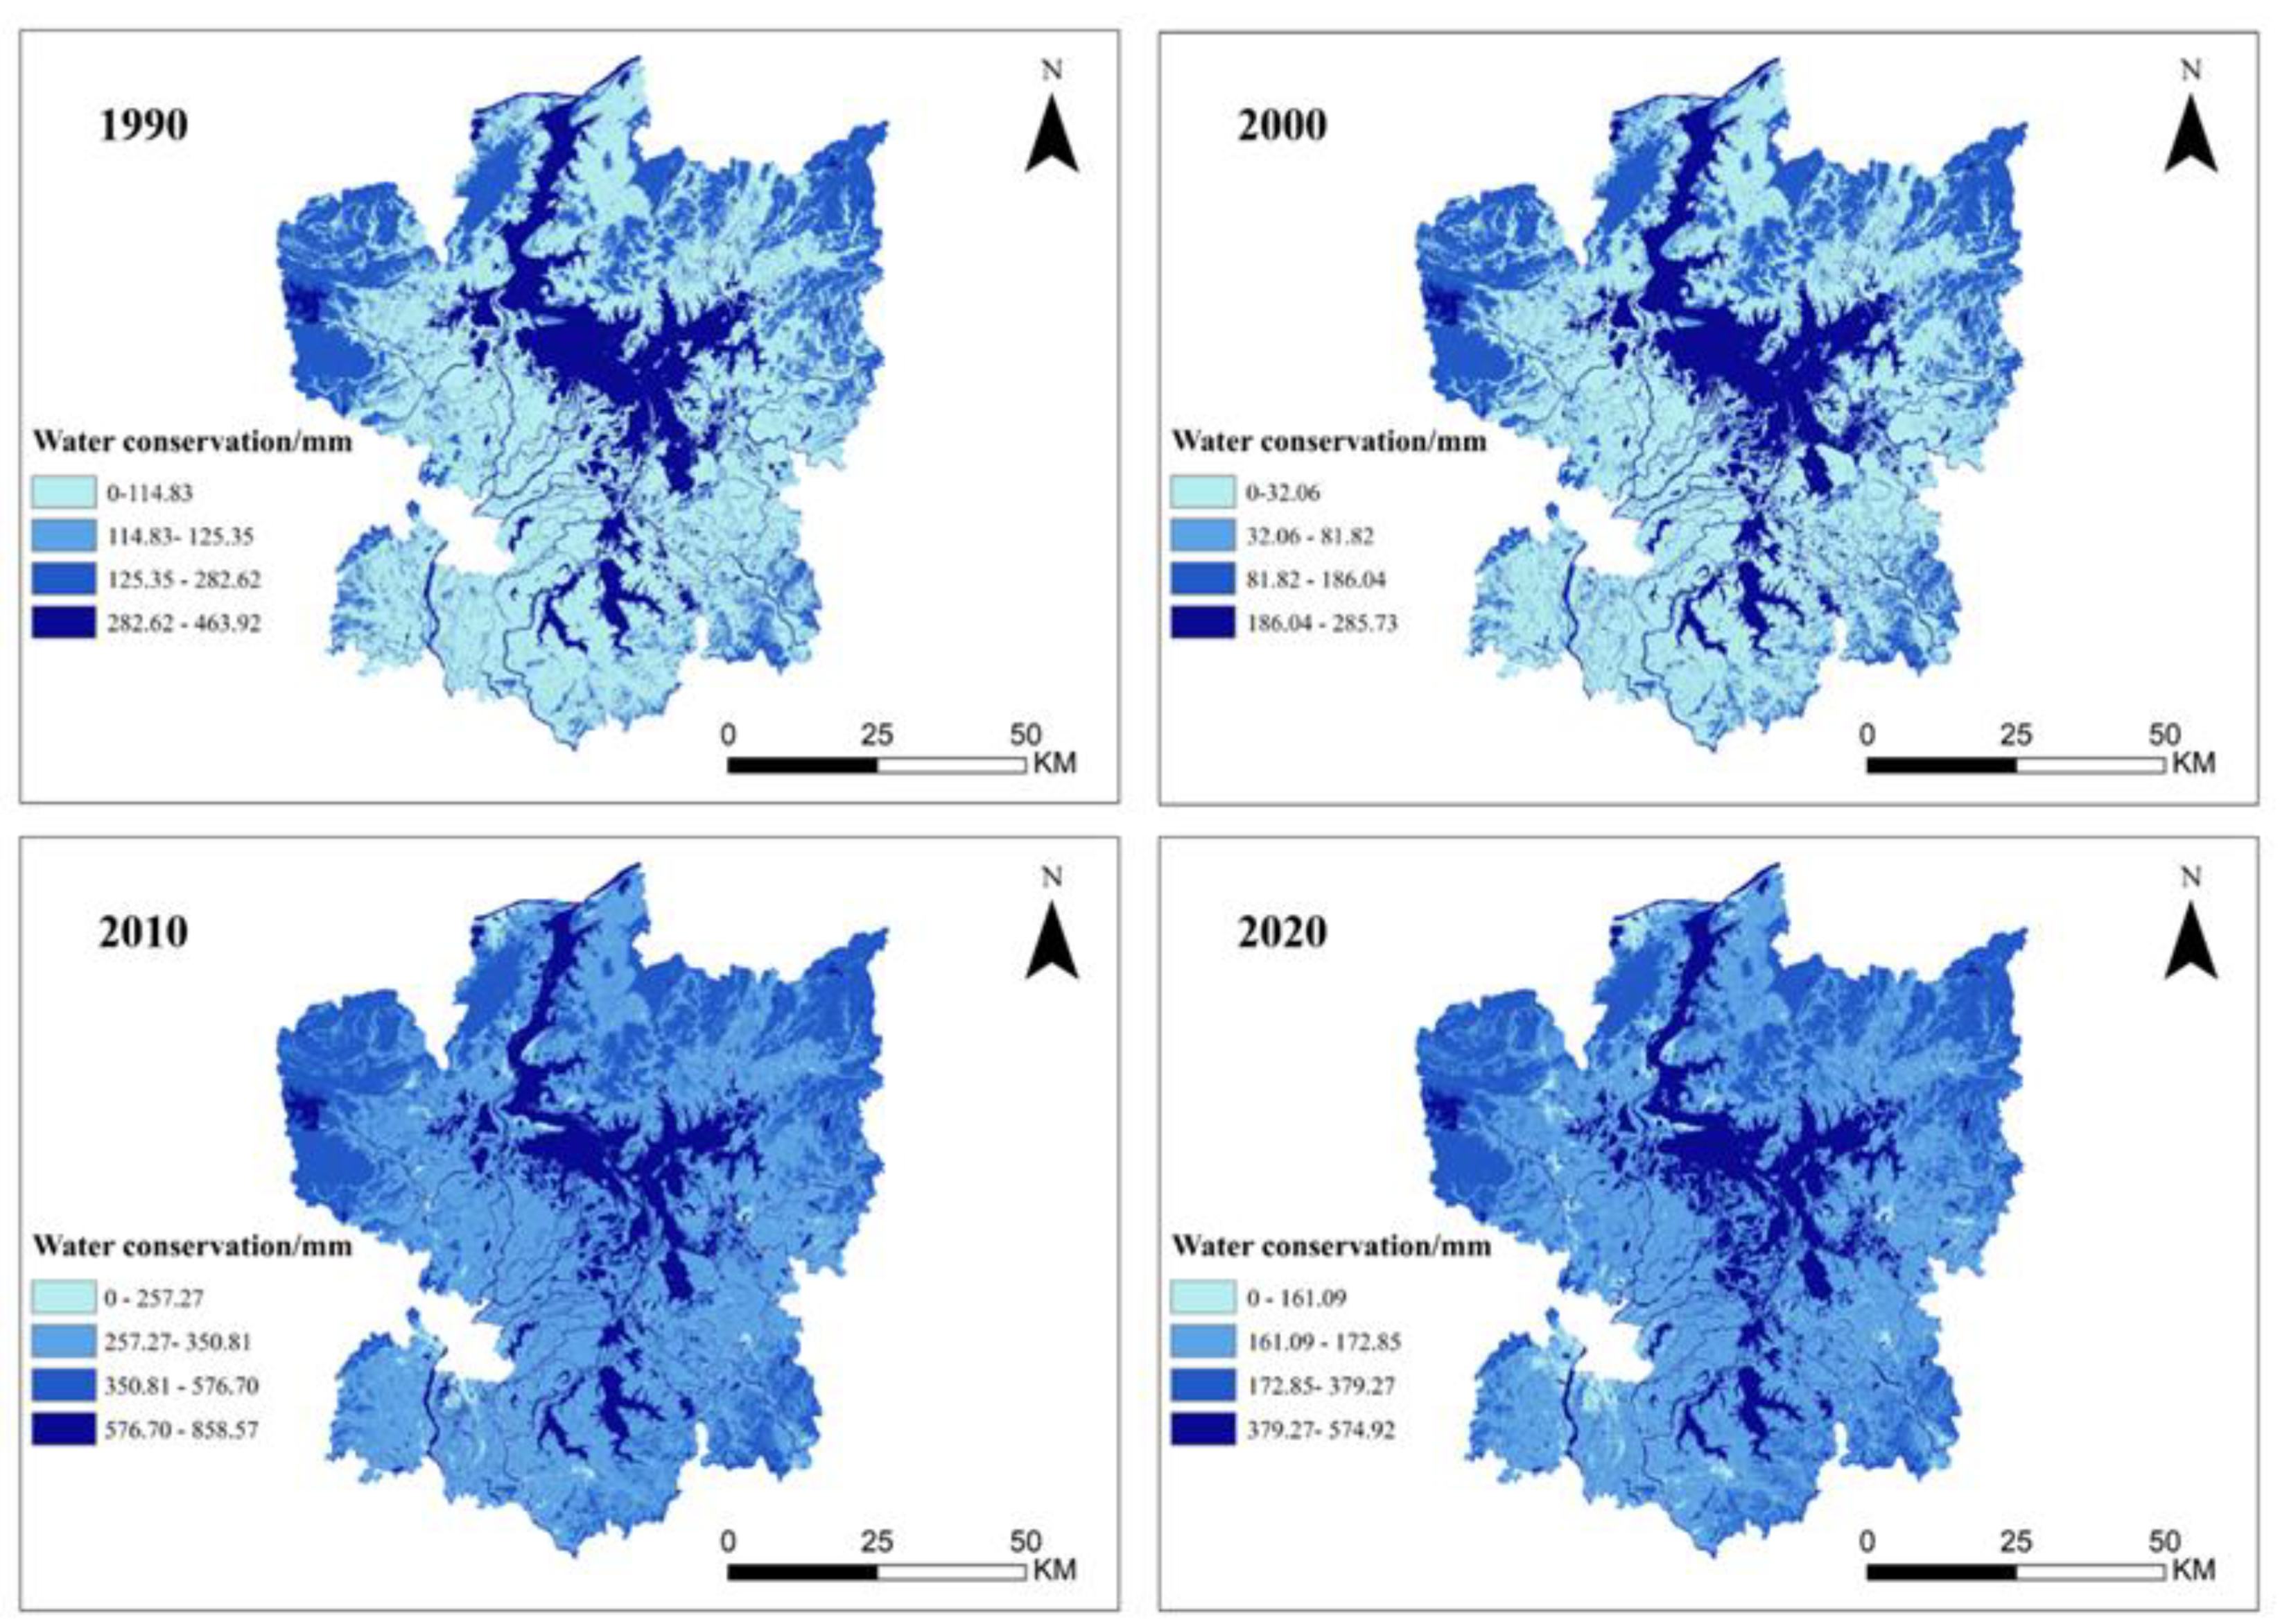
The spatial distribution of the water conservation function of Poyang Lake Region in 1990, 2000, 2010 and 2020 remained consistent (Figure 7). Vegetation-covered areas with high water conservation values were mainly concentrated in the northwest of Jiujiang City (De’an County, Yongxiu County) and the northwest of Poyang County. On the whole, the water conservation capacity in Poyang Lake Region increased with fluctuations, showing a downward–upward–downward trend during 1990–2020, and the annual average water conservation capacity was 270.98 mm. In 1990, the average water conservation capacity was 213.23 mm, with an annual maximum of 463.92 mm. In 2000, the water conservation capacity decreased significantly to an annual average of 105.94 mm due to a sharp decline in rainfall. In 2010, the water conservation capacity increased by 371.49 mm compared with 2000 and was nearly three times that of 2000. During 2010–2020, the water conservation capacity decreased, with an average water conservation capacity of 287.33 mm. Overall, the water conservation capacity showed an upward trend during 1990–2020, with an average increase of 70.09 mm.
3.3.2. Water Conservation of Different Land Use Types
The annual average water yield fluctuations of different land use types (Table 5) were consistent with the overall fluctuations in Poyang Lake Region during 1990–2020 (Table 4). Due to the varied areas of the different land use types, the average annual water yield of cultivated land was the largest, amounting to 10.19 × 10⁹ m³. It was followed by forestland, water, and construction land, which were 29.98 × 10⁸ m³, 18.48 × 10⁸ m³, 10.95 × 10⁸ m³, respectively. The water yield of grassland and unused land was small, with an average annual yield of 0.2 × 10⁸ m³.
The fluctuating trend of water conservation for different land use types varied during 1990–2020 (Table 4). Due to a massive reduction in grassland area, the water conservation of grassland decreased by 0.11 × 10⁸ m³, while the total water conservation of cultivated land, forestland, water area and construction land increased by 5.39 × 10⁸ m³, 5.01 × 10⁸ m³, 2.86 × 10⁸ m³, 1.36 × 10⁸ m³, respectively. The average water conservation of different land use types in Poyang Lake Region during 1990–2020 ranked as follows: water area > cultivated land > forestland > construction land > grassland > unused land. The water conservation capacity of different land use types ranked as follows: water area > grassland > forestland > cultivated land > construction land > unused land.
4. Discussion
4.1. Effects of Different Land Use Patterns on the Water Conservation Function
This study supports the idea that the land use pattern is one of the major factors affecting water conservation variations, which is consistent with [8]. This study found that mutual conversions existed between cultivated land and water in Poyang Lake Region. This was mainly due to the widespread phenomenon of reclaiming cultivated land from lakes before the 1980s [49]. In 1998, due to the catastrophic flood disaster in the Yangtze River basin, the Jiangxi Provincial Government implemented the project of “leveling embankments for flood discharge, returning farmland to lake, and resettling people to build towns” in the Poyang Lake basin [50]. The policy of returning farmland to the lake promoted the conversions of cultivated land into lake. Mutual conversions also existed between cultivated land and forestland. Before 2000, the prevalence of deforestation and land reclamation resulted in the conversion of forestland into cultivated land. In 2000, the Chinese government implemented the project of “returning cultivated land to forest”, and cultivated land were gradually converted into forests. With the development of social economy and urbanization, the construction land area increased continuously and was mainly derived from the conversion of cultivated land and forestland. The period 1990–2000 saw the expansion of Chinese urbanization [51]. With a growth rate of 58.8%, construction land increased from 414.64 km2 in 1990 to 658.45 km2 in 2000. With the implementation of a national strategy for the construction of Poyang Lake as an ecological and economic zone in 2009, the period 2010–2020 saw the largest increase in construction land area [52].
The average water conservation capacity of different land use types in Poyang Lake Region ranked as follows: water area > grassland> forestland > cultivated land> construction land > unused land. Similar to what reported by Huang et al. [53], the water conservation capacity of forestland was smaller than that of grassland. The main reason was that forestland with the moisture collected by the litter layer as the main body was not dominant in the InVEST model, and the evapotranspiration of forestland cover was much higher than that of grassland cover; therefore, the average water yield of forestland (677.32 mm) was smaller than that of grassland (949.89 mm) and further affected water conservation.
The project of returning farmland to forest, returning farmland to lakes, resettling people to build towns, as well as the expansion of towns were important reasons for the change of land use pattern and the decrease in water conservation. Especially in recent years, the total water body of Poyang Lake has decreased sharply due to climate change, water conservancy construction projects and irrational land use modes including lake filling and wetland occupation. Particularly, the drought of Poyang Lake in 2022 has resulted in a steady drop in the water level, shrinking the water area by 90% and devastating the water storage capacity. According to the Hydrological Monitoring Center of Jiangxi Province, the water level of Poyang Lake in 2022 has reached the red warning standard for dry water, refreshing the record of the lowest water level since 1951. In this situation, it is necessary to strengthen the protection of water resources in Poyang Lake Region and promote the implementation of ecological protection, restoration and construction projects to improve the water conservation capacity. As the proportion of construction land is negatively correlated with water conservation [54], the regional development intensity should be controlled, the regional space control should be strengthened, and the processes of economic development and ecological environmental protection should be well coordinated [55].
4.2. Evolutionary Trend of Water Conservation from 1990 to 2020 and Related Research
The average annual water yield in Poyang Lake area is 825.15 mm, the average water conservation is 53.11 × 10⁸ m³, and the annual average water conservation capacity is 270.98 mm. The water conservation capacity is directly affected by the water yield. From 1990 to 2020, the overall water yield was increased, with an average annual increase of 9.30 × 10⁸ m³, and the average annual increase in water conservation was 0.48 × 10⁸ m³. Both water yield and water conservation showed a fluctuating “downward–upward–downward” trend. Water conservation varies according to land use types. Due to the large decrease in grassland area, the water conservation of grassland decreased by 0.11 × 10⁸ m³, while the water conservation of arable land, forest land, water areas and construction land increased by 5.39 × 10⁸ m³, 5.01 × 10⁸ m³, 2.86 × 10⁸ m³, 1.36 × 10⁸ m³, respectively. The inconsistency between the evolutionary trend of water conservation of different land use types and that of the land areas is mainly due to the various factors influencing water conservation, including rainfall, evapotranspiration, soil, altitude, slope, etc. [56]. Further, the extent of the influence of different factors deserves in-depth study in future. The average water conservation capacity of Poyang Lake area is similar to that of the middle and lower reaches of the Yangtze River [57] and provides a reference for the construction of a Poyang Lake water conservancy hub and other related projects because of its influence on the ecological environment.
4.3. Limitation and Future Research
Using a water yield model to assess the regional water conservation function dynamically based on the principle of water balance is an effective strategy [58]. However, as the impact of groundwater and surface water are not taken into consideration in the model, and the biophysical table and runoff coefficient are obtained from previous studies, errors are likely to exist to a certain extent. As the model is constructed at a watershed scale, the influence of the land use pattern on the water conservation function might be biased at pixel level. In the future, it is necessary to further calculate relevant elements [59,60] in relation to the size of basin and sub-basins, and the influence of seasonal factors [61] should be taken into consideration to improve research accuracy. In terms of the parameter setting, the Zhang value reflects the local precipitation model and other hydrogeological characteristics in the Invest model; therefore, the Zhang value determines the accuracy and effectiveness of the model to a certain extent. However, as an empirical constant, the selection of the parameter Z is uncertain [62]. The methods for the determination and modification of the Z value require further study in the future. This paper contributes to the analysis of the water conservation function from the perspective of land use change. The research results provide a theoretical and practical reference for water resources protection and ecological environmental protection in Poyang Lake area. As one of the most important functions of ecosystem regulation services, the measurement of water conservation is of great significance. The evaluation of the water conservation value [63] and its realization are important research topics in the future.
5. Conclusions
Using the national land use data of 30 m × 30 m in 1990, 2000, 2010 and 2020, taking Poyang Lake Region as an example, this paper analyzed the quantitative changes and conversion of different land use types in the past 30 years. Combining rainfall, evapotranspiration, soil, DEM data, etc., the spatial and temporal changes of water yield and water conservation of different land use types in Poyang Lake Region during 1990–2020 were quantitatively analyzed by the InVEST model. The main conclusions are as follows.
(1) From 1990 to 2020, cultivated land, forestland and water areas in Poyang Lake area were mostly transferred out, while construction land was mostly transferred in. The areas of arable land, water, grassland and unused land showed an overall downward trend. As the total area of grassland and unused land was very small, the impact of their fluctuations on the overall area was negligible. The areas of forest land and construction land generally increased. The continuously increasing construction land area mainly derived from cultivated land.
(2) From 1990 to 2020, the average annual water yield capacity of Poyang Lake Region was 825.15 mm, and the water conservation capacity was 53.11 × 10⁸ m³, showing a downward–upward–downward fluctuating trend. Obvious changes were seen in the water conservation of different land use types. The water conservation of grassland decreased by 0.11 × 10⁸ m³, while that of cultivated land, forestland, water area and construction land increased by 5.39 × 10⁸ m³, 5.01 × 10⁸ m³, 2.86 × 10⁸ m³, 1.36 × 10⁸ m³, respectively.
(3) Different land use patterns have different impacts on the water conservation function. The average water conservation of different land use types during 1990–2020 ranked as follows: water area > cultivated land > forestland > construction land > grassland > unused land. The water conservation capacity of different land use types ranked as follows: water area > grassland > forestland > cultivated land > construction land > unused land.
Author Contributions
Q.C. and X.X. conceptualized the research and performed the validation. Q.C. administrated the project. J.W. developed the methodology. J.Z. curated the data. X.X. and J.W. conducted the formal analysis, produced visualizations and wrote and prepared the original draft manuscript. Q.C. and X.X. reviewed and edited the manuscript. Q.C. acquired funding. X.X. and M.W. contributed to drafting the manuscript and approved the final version of the manuscript. All authors have read and agreed to the published version of the manuscript.
Funding
This study was supported by the National Natural Science Foundation of China (No. 42261050).
Institutional Review Board Statement
Not applicable.
Informed Consent Statement
Not applicable.
Data Availability Statement
Not applicable.
Acknowledgments
The authors would like to thank the reviewers and the editor whose suggestions greatly improved the manuscript.
Conflicts of Interest
The authors declare no conflict of interest.
References
- Li, M.; Liang, D.; Xia, J.; Song, J.; Cheng, D.; Wu, J.; Cao, Y.; Sun, H.; Li, Q. Evaluation of water conservation function of Danjiang River Basin in Qinling Mountains, China based on InVEST model. J. Environ. Manag. 2021, 286, 112212. [Google Scholar] [CrossRef] [PubMed]
- Wang, Y.F.; Ye, A.Z.; Qiao, F.; Li, Z.X.; Miao, C.Y.; Di, Z.H.; Gong, W. Review on connotation and estimation method of water conservation. South-North Water Transf. Water Sci. Technol. 2021, 19, 1041–1071. (In Chinese) [Google Scholar]
- Hu, W.; Li, G.; Gao, Z. Assessment of the impact of the Poplar Ecological Retreat Project on water conservation in the Dongting Lake wetland region using the InVEST model. Sci. Total. Environ. 2020, 733, 139423. [Google Scholar] [CrossRef] [PubMed]
- Xu, W.; Xiao, Y.; Zhang, J.; Yang, W.U.; Zhang, L.U.; Hull, V.; Wang, Z.; Zheng, H.; Liu, J.; Polasky, S.; et al. Strengthening protected areas for biodiversity and ecosystem services in China. Proc. Natl. Acad. Sci. USA 2017, 114, 1601–1606. [Google Scholar] [CrossRef] [PubMed] [Green Version]
- Xie, H.; He, Y.; Choi, Y.; Chen, Q.; Cheng, H. Warning of negative effects of land-use changes on ecological security based on GIS. Sci. Total. Environ. 2019, 704, 135427. [Google Scholar] [CrossRef]
- Brauman, K.A.; Daily, G.C.; Duarte, T.K.E.; Mooney, H.A. The Nature and Value of Ecosystem Services: An Overview Highlighting Hydrologic Services. Annu. Rev. Environ. Resour. 2007, 32, 67–98. [Google Scholar] [CrossRef]
- Wang, Y.; Ye, A.; Peng, D.; Miao, C.; Di, Z.; Gong, W. Spatiotemporal variations in water conservation function of the Tibetan Plateau under climate change based on InVEST model. J. Hydrol. Reg. Stud. 2022, 41, 101064. [Google Scholar] [CrossRef]
- Novak, J.M.; Busscher, W.J.; Watts, D.W.; Amonette, J.E.; Ippolito, J.A.; Lima, I.M.; Gaskin, J.; Das, K.C.; Steiner, C.; Ahmedna, M.; et al. Biochars Impact on Soil-Moisture Storage in an Ultisol and Two Aridisols. Soil Sci. 2012, 177, 310–320. [Google Scholar] [CrossRef] [Green Version]
- Thomas, A.C.; Reager, J.T.; Famiglietti, J.S.; Rodell, M. A GRACE-based water storage deficit approach for hydrological drought characterization. Geophys. Res. Lett. 2014, 41, 1537–1545. [Google Scholar] [CrossRef] [Green Version]
- Vetter, T.; Reinhardt, J.; Flörke, M.; Van Griensven, A.; Hattermann, F.; Huang, S.; Koch, H.; Pechlivanidis, I.; Plötner, S.; Seidou, O.; et al. Evaluation of sources of uncertainty in projected hydrological changes under climate change in 12 large-scale river basins. Clim. Chang. 2016, 141, 419–433. [Google Scholar] [CrossRef]
- Hou, Y.Z.; Zhang, Y.; Cao, K.Y. Forest Resource Accounting; China Science & Technology Press: Beijing, China, 2005. (In Chinese) [Google Scholar]
- Zhang, C.S.; Xie, G.D.; Liu, C.L.; Fan, N.; Wang, X.K. Evaluation of water conservation of China’s ecosystems based on benchmark. Acta Ecol. Sin. 2022, 22, 1–11. (In Chinese) [Google Scholar]
- Wang, J.; Wu, T.; Li, Q.; Wang, S. Quantifying the effect of environmental drivers on water conservation variation in the eastern Loess Plateau, China. Ecol. Indic. 2021, 125, 107493. [Google Scholar] [CrossRef]
- He, C.; Zhang, D.; Huang, Q.; Zhao, Y. Assessing the potential impacts of urban expansion on regional carbon storage by linking the LUSD-urban and InVEST models. Environ. Model. Softw. 2016, 75, 44–58. [Google Scholar] [CrossRef]
- Hu, W.; Li, G.; Li, Z. Spatial and temporal evolution characteristics of the water conservation function and its driving factors in regional lake wetlands—Two types of homogeneous lakes as examples. Ecol. Indic. 2021, 130, 108069. [Google Scholar] [CrossRef]
- Yang, X.; Chen, R.; Meadows, M.E.; Ji, G.; Xu, J. Modelling water yield with the InVEST model in a data scarce region of northwest China. Water Supply 2020, 20, 1035–1045. [Google Scholar] [CrossRef]
- Cong, W.; Sun, X. Comparison of the SWAT and InVEST models to determine hydrological ecosystem service spatial patterns, priorities and trade-offs in a complex basin. Ecol. Indic. 2020, 112, 106089. [Google Scholar] [CrossRef]
- Yang, D.; Liu, W.; Tang, L.; Chen, L.; Li, X.; Xu, X. Estimation of water provision service for monsoon catchments of South China: Applicability of the InVEST model. Landsc. Urban Plan. 2019, 182, 133–143. [Google Scholar] [CrossRef]
- Xie, H.L.; Yao, G.; He, Y.F.; Zhang, D.B. Study on spatial identification of critical ecological space based on GIS: A case study of Poyang Lake Ecological Economic Zone. Acta Ecol. Sin. 2018, 38, 5926–5937. (In Chinese) [Google Scholar]
- Wen, Y.L.; Li, H.B.; Zhang, X.L.; Wang, X.L.; Huang, Q.; Cai, Y.J. Changes of land use and landscape pattern in the peripheral region of Poyang Lake in recent 30years. Acta Sci. Circumstantiae 2022, 42, 501–510. (In Chinese) [Google Scholar]
- Xie, H.; Liu, Q.; Yao, G.R.; Tan, M. Measuring regional land use sustainability of the Poyang Lake Eco-economic Zone based on PSR modeling. Resour. Sci. 2015, 37, 0449–0457. (In Chinese) [Google Scholar]
- Xie, H.; Wen, J.; Chen, Q.; Wu, Q. Evaluating the landscape ecological risk based on GIS: A case-study in the Poyang Lake region of China. Land Degrad. Dev. 2021, 32, 2762–2774. [Google Scholar] [CrossRef]
- He, Y.F.; Xie, H.; Zhu, Z.H. Research on Land Use Change and Ecological Security Warning in Poyang Lake Region; China Meteorological Press: Beijing, China, 2020. [Google Scholar]
- Chen, M.K.; Xu, X.B. Lake Poyang ecosystem services changes in the last 30 years. J. Lake Sci. 2021, 33, 309–318. (In Chinese) [Google Scholar]
- Xie, H.; He, Y.; Zou, J.; Wu, Q. Spatio-temporal difference analysis of cultivated land use intensity based on emergy in the Poyang Lake Eco-economic Zone of China. J. Geogr. Sci. 2016, 26, 1412–1430. [Google Scholar] [CrossRef]
- Liu, H.; Zheng, L.; Huang, Y.F.; Wang, M. Spatial and temporal dynamics and its driving factors of vegetation cover before and after the establishment of Poyang Lake Eco-economic Zone. Chin. J. Ecol. 2020, 39, 11–22. (In Chinese) [Google Scholar]
- Qi, L.; Huang, J.; Huang, Q.; Gao, J.; Wang, S.; Guo, Y. Assessing aquatic ecological health for lake Poyang, China: Part I index development. Water 2018, 10, 943. [Google Scholar] [CrossRef] [Green Version]
- Ran, F.; Luo, Z.; Wu, J.; Qi, S.; Cao, L.; Cai, Z.; Chen, Y.Y. Spatiotemporal patterns of the trade-off and synergy relationship among ecosystem services in Poyang Lake Region, China. J. Appl. Ecol. 2019, 30, 995–1004. [Google Scholar]
- Jiangxi Provincial Bureau of Statistics. Jiangxi Statistical Yearbook. 2021. Available online: http://tjj.jiangxi.gov.cn/col/col38595/index.html (accessed on 1 July 2022).
- Yang, J.; Huang, X. The 30 m annual land cover dataset and its dynamics in China from 1990 to 2019. Earth Syst. Sci. Data 2021, 13, 3907–3925. [Google Scholar] [CrossRef]
- Donohue, R.J.; Roderick, M.L.; McVicar, T.R. Roots, storms and soil pores: Incorporating key ecohydrological processes into Budyko’s hydrological model. J. Hydrol. 2012, 436, 35–50. [Google Scholar] [CrossRef]
- Fu, B.; Xu, P.; Wang, Y.K.; Peng, Y.; Ren, J. Spatial Pattern of Water Retetnion in Dujiangyan County. Acta Ecol. Sin. 2013, 33, 0789–0797. [Google Scholar]
- Hu, Y.; Peng, J.; Liu, Y.; Tian, L. Integrating ecosystem services trade-offs with paddy land-to-dry land decisions: A scenario approach in Erhai Lake Basin, southwest China. Sci. Total. Environ. 2018, 625, 849–860. [Google Scholar] [CrossRef]
- Sharp, R.; Douglass, J.; Wolny, S.; Arkema, K.; Bernhardt, J.; Bierbower, W.; Chaumont, N.; Denu, D.; Fisher, D.; Glowinski, K.; et al. InVEST 3.9.0 User’s Guide; The Natural Capital Project, Stanford University: Stanford, CA, USA; University of Minnesota: Minneapolis, MN, USA; The Nature Conservancy: Arlington, VA, USA; World Wildlife Fund: Grang, Switzerland, 2020. [Google Scholar]
- Liu, J.; Lang, X.D.; Su, J.R.; Liu, W.D.; Liu, H.Y.; Tian, Y. Evaluation of water conservation function in the dry-hot valley area of Jinsha River Basin based on INVEST model. Acta Ecol. Sin. 2021, 41, 8099–8111. (In Chinese) [Google Scholar]
- Huang, H.; Zhou, Y.; Qian, M.; Zeng, Z. Land Use Transition and Driving Forces in Chinese Loess Plateau: A Case Study from Pu County, Shanxi Province. Land 2021, 10, 67. [Google Scholar] [CrossRef]
- Song, Q.; Feng, C.H.; Ma, Z.Q.; Wang, N.; Ji, W.J.; Peng, J. Simulation of land use change in oasis of arid areas based on Landsat images from 1990 to 2019. Remote Sens. Nat. Resour. 2022, 34, 198–209. (In Chinese) [Google Scholar]
- Yu, Z.; Guo, X.; Zeng, Y.; Koga, M.; Vejre, H. Variations in land surface temperature and cooling efficiency of green space in rapid urbanization: The case of Fuzhou city, China. Urban For. Urban Green. 2018, 29, 113–121. [Google Scholar] [CrossRef]
- Zhang, L.; Hickel, K.; Dawes, W.R.; Chiew, F.H.S.; Western, A.W.; Briggs, P.R. A rational function approach for estimating mean annual evapotranspiration. Water Resour. Res. 2004, 40, W02502. [Google Scholar] [CrossRef]
- Zhang, L.; Dawes, W.R.; Walker, G.R. Response of mean annual evapotranspiration to vegetation changes at catchment scale. Water Resour. Res. 2001, 37, 701–708. [Google Scholar] [CrossRef]
- Peng, S.; Ding, Y.; Wen, Z.; Chen, Y.; Cao, Y.; Ren, J. Spatiotemporal change and trend analysis of potential evapotran-spiration over the Loess Plateau of China during 2011–2100. Agric. For. Meteorol. 2017, 233, 183–194. [Google Scholar] [CrossRef] [Green Version]
- Zhou, W.Z. Study on Soil Effective Water Content of Main Soil Types in China Based on GIS; Nanjing Agricultural University: Nanjing, China, 2003. (In Chinese) [Google Scholar]
- Song, K.Y.; Yin, Y.F.; Ma, Y.P.; Shi, S.Y.; Zhou, Y.; Gao, R. Effects of Biochar Amendment on Soil Organic Carbon Fractions under Simulated Nitrogen Deposition. J. Soil Water Conserv. 2022, 36, 247–254. (In Chinese) [Google Scholar]
- Scordo, F.; Lavender, T.; Seitz, C.; Perillo, V.; Rusak, J.; Piccolo, M.; Perillo, G. Modeling Water Yield: Assessing the Role of Site and Region-Specific Attributes in Determining Model Performance of the InVEST Seasonal Water Yield Model. Water 2018, 10, 1496. [Google Scholar] [CrossRef] [Green Version]
- Gong, S.H.; Xiao, Y.; Zheng, H.; Xiao, Y.; Ouyang, Z.Y. Spatial patterns of ecosystem water conservation in China and its impact factors analysis. Acta Ecol. Sin. 2017, 37, 2455–3462. (In Chinese) [Google Scholar]
- Bai, Y.; Ochuodho, T.O.; Yang, J. Impact of land use and climate change on water-related ecosystem services in Kentucky, USA. Ecol. Indic. 2019, 102, 51–64. [Google Scholar] [CrossRef]
- Han, H.; Hyun, S.S. What influences water conservation and towel reuse practices of hotel guests? Tour. Manag. 2018, 64, 87–97. [Google Scholar] [CrossRef]
- Zhao, G.; Mu, X.; Wen, Z.; Wang, F.; Gao, P. Soil erosion, conservation, and eco-environment changes in the loess plateau of China. Land Degrad. Dev. 2013, 24, 499–510. [Google Scholar] [CrossRef]
- Mei, X.; Dai, Z.; Fagherazzi, S.; Chen, J. Dramatic variations in emergent wetland area in China’s largest freshwater lake, Poyang Lake. Adv. Water Resour. 2016, 96, 1–10. [Google Scholar] [CrossRef] [Green Version]
- Zhang, T.; Gao, Y.; Li, C.; Xie, Z.; Chang, Y.; Zhang, B. How Human Activity Has Changed the Regional Habitat Quality in an Eco-Economic Zone: Evidence from Poyang Lake Eco-Economic Zone, China. Int. J. Environ. Res. Public Health 2020, 17, 6253. [Google Scholar] [CrossRef]
- Liu, B.L.; Zhu, J.F. The Urbanization Development of the People’s Republic of China in the Past 70 Years: Process, Problems and Prospects. Res. Econ. Manag. 2019, 40, 3–14. (In Chinese) [Google Scholar]
- Xie, H.; Liu, G.Y.; Hu, H.S.; Gong, Z.J. Study on Resource Utilization and Exploitation Mode of Poyang Lake Ecological Economic Zone; China Environment Press: Beijing, China, 2013. [Google Scholar]
- Huang, J.; Fan, J.H.; He, X.R. InVest-Model Based Evaluation of Water Conservation Function in Zhangjiakou Area, China. Mt. Res. 2021, 39, 327–337. (In Chinese) [Google Scholar]
- Xue, J.; Li, Z.X.; Feng, Q.; Miao, C.; Deng, X.; Di, Z.; Ye, A.; Gong, W.; Zhang, B.; Gui, J. Spatiotemporal variation characteristics of water conservation amount in the Qilian Mountains from 1980 to 2017. J. Glaciol. Geocryol. 2022, 44, 1–13. (In Chinese) [Google Scholar]
- Yao, G.R.; Xie, H. Study on land use in Poyang Lake Ecological Economic Zone; China Environment Press: Beijing, China, 2014. [Google Scholar]
- González-García, A.; Palomo, I.; González, J.A.; López, C.A.; Montes, C. Quantifying spatial supply-demand mismatches in ecosystem services provides insights for land-use planning. Land Use Policy 2010, 94, 104493. [Google Scholar] [CrossRef]
- Li, Y.Y.; Ma, X.S.; Qi, G.H.; Wu, Y.L. Studies on Water Retention Function of Anhui Province Based on InVEST Model of Parameter Localization. Resour. Environ. Yangtze Basin 2022, 31, 313–325. (In Chinese) [Google Scholar]
- Liu, F.; Qin, T.; Girma, A.; Wang, H.; Weng, B.; Yu, Z.; Wang, Z. Dynamics of Land-Use and Vegetation Change Using NDVI and Transfer Matrix: A Case Study of the Huaihe River Basin. Pol. J. Environ. Stud. 2018, 28, 213–223. [Google Scholar] [CrossRef]
- Krisnayanti, D.S.; Bunganaen, W.; Frans, J.H.; Seran, Y.A.; Legono, D. Curve Number Estimation for Ungauged Watershed in Semi-Arid Region. Civ. Eng. J. 2021, 7, 1070–1083. [Google Scholar] [CrossRef]
- Kansoh, R.; Abd-El-Mooty, M.; Abd-El-Baky, R. Computing the Water Budget Components for Lakes by Using Meteorological Data to the literature review. Civ. Eng. J. 2020, 6, 1255–1265. [Google Scholar] [CrossRef]
- Suwarno, I.; Ma’arif, A.; Raharja, N.M.; Nurjanah, A.; Ikhsan, J.; Mutiarin, D. IoT-based Lava Flood Early Warning System with Rainfall Intensity Monitoring and Disaster Communication Technology. Emerg. Sci. J. 2021, 4, 154–166. [Google Scholar] [CrossRef]
- Sharp, R.; Tallis, H.T.; Ricketts, T.; Guerry, A.D.; Wood, S.A.; Chaplin-Kramer, R.; Nelson, E.; Ennaanay, D.; Wolny, S.; Olwero, N.; et al. InVEST 3.2.0 User’s Guide; The Natural Capital Project: Stanford, CA, USA, 2015. [Google Scholar]
- Xie, H.; Zhang, Y.; Choi, Y.; Li, F. A Scientometrics Review on Land Ecosystem Service Research. Sustainability 2020, 12, 2959. [Google Scholar] [CrossRef]
Figure 1.
Geographical location of Poyang Lake Region.

Figure 2.
Land use types in Poyang Lake region from 1990 to 2020.

Figure 3.
Research framework.

Figure 4.
Clustered bar chart of land use types from 1990 to 2020.

Figure 5.
Spatial distribution of transfer-out (left) and transfer in (right) land during 1990–2020.
Figure 5.
Spatial distribution of transfer-out (left) and transfer in (right) land during 1990–2020.

Figure 6.
Sankey map of the land use transfer matrix from 1990 to 2020.

Figure 7.
Spatial distribution of water conservation during 1990–2020.


Table 1.
Biophysical parameters used for the InVEST water yield model.
| Lucode | LULC_desc | LULC_veg | Kc | Root_depth/mm |
|---|---|---|---|---|
| 1 | Cultivated land | 0.65 | 300 | |
| 2 | Forestland | 11 | 0.9 | 5000 |
| 3 | Grassland | 1 | 0.65 | 500 |
| 5 | Water area | 0 | 1 | 0 |
| 7 | Unused land | 0 | 0.3 | 1 |
| 8 | Construction land | 0 | 0.3 | 1 |
Note: Lucode, a unique integer for each LULC class. LULC_desc, descriptive names for land use/land cover categories. LULC_veg, with the exception of wetlands, the land use value in the presence of vegetation is 1, and the land use value without vegetation is 0. Kc, evapotranspiration coefficients of various land use/land cover plants. Root_depth (mm), maximum root depth of the vegetation land use grade.
Table 2.
Areas of land use types from 1990 to 2020.
| Land Use Type | Area/km2 | |||
|---|---|---|---|---|
| 1990 | 2000 | 2010 | 2020 | |
| Cultivated land | 11,280.95 | 10,784.43 | 10,934.18 | 10,614.46 |
| Forestland | 4286.08 | 4438.05 | 4529.04 | 4400.43 |
| Grassland | 45.48 | 20.60 | 17.74 | 6.18 |
| Water area | 3554.38 | 3678.29 | 3212.83 | 3365.92 |
| Unused land | 17.30 | 19.01 | 15.51 | 9.78 |
| Construction land | 414.64 | 658.45 | 889.52 | 1202.06 |
Table 3.
Area and proportion of land conversion during 1990–2020.
| In 1990 | In 2020 | |||||||
|---|---|---|---|---|---|---|---|---|
| Cultivated Land | Forestland | Grassland | Water Area | Unused Land | Construction Land | Transfer Out | ||
| Cultivated land | A | 685.73 | 0.98 | 385.30 | 0.51 | 690.53 | 1763.05 | |
| B | 38.89% | 0.06% | 21.85% | 0.03% | 39.17% | |||
| C | 98.15% | 28.09% | 91.64% | 7.75% | 85.93% | |||
| Forestland | A | 535.17 | 0.28 | 5.90 | 0.02 | 42.93 | 584.30 | |
| B | 91.59% | 0.05% | 1.01% | 0.00% | 7.35% | |||
| C | 48.80% | 8.13% | 1.40% | 0.27% | 5.34% | |||
| Grassland | A | 7.49 | 1.85 | 10.40 | 4.44 | 18.63 | 42.80 | |
| B | 17.49% | 4.32% | 24.30% | 10.36% | 43.53% | |||
| C | 0.68% | 0.26% | 2.47% | 67.27% | 2.32% | |||
| Water area | A | 547.89 | 11.02 | 0.76 | 1.52 | 47.71 | 608.90 | |
| B | 89.98% | 1.81% | 0.13% | 0.25% | 7.84% | |||
| C | 49.96% | 1.58% | 21.76% | 23.04% | 5.94% | |||
| Unused land | A | 1.43 | 0.02 | 1.40 | 7.43 | 3.82 | 14.11 | |
| B | 10.16% | 0.15% | 9.91% | 52.69% | 27.10% | |||
| C | 0.13% | 0.00% | 39.95% | 1.77% | 0.48% | |||
| Construction land | A | 4.59 | 0.03 | 0.07 | 11.41 | 0.11 | 16.20 | |
| B | 28.27% | 0.16% | 0.44% | 70.45% | 0.68% | |||
| transfer in | C | 0.42% | 0.00% | 2.06% | 2.71% | 1.67% | ||
| 1096.56 | 698.65 | 3.50 | 420.44 | 6.59 | 803.62 | |||
Note: A denotes the area of land use type conversion during 1990–2020, in km². B denotes the proportion of transfer-out land in 1990. C denotes the proportion of transfer-in land in 1990.
Table 4.
Water yield and water conservation of different land use types during 1990–2020.
| Land Use Type | Water Yield/(×108 m3) | Water Conservation/(×108 m3) | ||||||
|---|---|---|---|---|---|---|---|---|
| 1990 | 2000 | 2010 | 2020 | 1990 | 2000 | 2010 | 2020 | |
| Cultivated land | 94.14 | 73.76 | 138.32 | 101.39 | 12.95 | 3.46 | 38.36 | 18.35 |
| Forestland | 25.48 | 18.85 | 43.21 | 32.39 | 11.68 | 6.22 | 25.20 | 16.69 |
| Grassland | 0.38 | 0.14 | 0.23 | 0.06 | 0.13 | 0.04 | 0.10 | 0.02 |
| Water area | 16.49 | 10.51 | 27.58 | 19.35 | 16.49 | 10.51 | 27.58 | 19.35 |
| Unused land | 0.21 | 0.21 | 0.25 | 0.13 | 0.02 | 0.02 | 0.04 | 0.02 |
| Construction land | 5.17 | 7.21 | 14.97 | 16.44 | 0.52 | 0.52 | 2.29 | 1.88 |
| Whole area | 141.87 | 110.67 | 224.57 | 169.76 | 41.79 | 20.76 | 93.57 | 56.31 |
Table 5.
Average water yield and water conservation of different land use types during 1990–2020.
| Land Use Type | Average Water Yield/(mm) | Average Water Conservation/(mm) | ||||||
|---|---|---|---|---|---|---|---|---|
| 1990 | 2000 | 2010 | 2020 | 1990 | 2000 | 2010 | 2020 | |
| Cultivated land | 834.48 | 683.91 | 735.90 | 838.67 | 114.83 | 32.06 | 350.81 | 172.86 |
| Forestland | 594.48 | 424.62 | 491.34 | 585.61 | 272.41 | 140.22 | 556.31 | 379.27 |
| Grassland | 835.97 | 686.18 | 764.73 | 866.20 | 282.62 | 186.04 | 576.70 | 375.88 |
| Water area | 463.92 | 285.73 | 352.40 | 449.43 | 463.92 | 285.73 | 858.58 | 574.92 |
| Unused land | 1237.36 | 1096.54 | 1137.90 | 1239.69 | 125.27 | 81.82 | 249.09 | 161.09 |
| Construction land | 1246.44 | 1095.13 | 1145.20 | 1249.85 | 125.35 | 78.64 | 257.28 | 156.56 |
Publisher’s Note: MDPI stays neutral with regard to jurisdictional claims in published maps and institutional affiliations. |
© 2022 by the authors. Licensee MDPI, Basel, Switzerland. This article is an open access article distributed under the terms and conditions of the Creative Commons Attribution (CC BY) license (https://creativecommons.org/licenses/by/4.0/).
Share and Cite
MDPI and ACS Style
Chen, Q.; Xu, X.; Wu, M.; Wen, J.; Zou, J. Assessing the Water Conservation Function Based on the InVEST Model: Taking Poyang Lake Region as an Example. Land 2022, 11, 2228. https://0-doi-org.brum.beds.ac.uk/10.3390/land11122228
AMA Style
Chen Q, Xu X, Wu M, Wen J, Zou J. Assessing the Water Conservation Function Based on the InVEST Model: Taking Poyang Lake Region as an Example. Land. 2022; 11(12):2228. https://0-doi-org.brum.beds.ac.uk/10.3390/land11122228
Chicago/Turabian StyleChen, Qianru, Xin Xu, Manyu Wu, Jiaming Wen, and Jinlang Zou. 2022. "Assessing the Water Conservation Function Based on the InVEST Model: Taking Poyang Lake Region as an Example" Land 11, no. 12: 2228. https://0-doi-org.brum.beds.ac.uk/10.3390/land11122228
Note that from the first issue of 2016, this journal uses article numbers instead of page numbers. See further details here.