Article

Effects of Tillage and Winter Cover Management in a Maize Soybean Rotation on Soil Bacterial and Fungal Community Composition

by
Nisarga Kodadinne Narayana
1,
William L. Kingery
2,
Alayna A. Jacobs
3,4,
Jon K. Allison
3 and
Shankar Ganapathi Shanmugam
1,2,*
1
Institute for Genomics, Biocomputing and Biotechnology, Mississippi State University, Starkville, MS 39762, USA
2
Department of Plant and Soil Sciences, Mississippi State University, Starkville, MS 39762, USA
3
Jamie L. Whitten Plant Materials Center, Natural Resources Conservation Service-US Department of Agriculture, Coffeeville, MS 38922, USA
4
Department of Plant and Soil Sciences, University of Kentucky, Lexington, KY 40546, USA
*
Author to whom correspondence should be addressed.
Submission received: 20 November 2022 / Revised: 6 December 2022 / Accepted: 7 December 2022 / Published: 10 December 2022

Abstract

:
The abundance and distribution of soil microbial populations, i.e., microbial diversity is widely promoted as a key tenant of sustainable agricultural practices and/or soil health. A common approach to describing microbial diversity is phylogenetic analysis with high-throughput sequencing of microbial DNA. However, owing to the tremendous amounts of data generated, a continuing effort is required to better assess the effects of agricultural management systems on soil microbial diversity. Here, we report on the combined effects of management systems on bacterial and fungal diversity in a loessal agricultural soil located in north-central Mississippi, USA. Amplicon sequencing was performed using 16S rRNA-gene and ITS2 from soil samples collected from a three-year study with combinations of maize-soybean crop rotation, tillage practices, and winter vegetative covers. Differences were found in microbial fungal β-diversity among the management systems, with distinct clustering patterns for no-tillage combined with either winter weeds or bare-fallow. Management systems showed a significant influence on soil pH and bulk density, which were positively correlated with fungal community composition. Developments in the description and interpretation of soil microbial diversity will contribute to a more accurate understanding of its role in the various functions and processes important to agricultural soil management.

1. Introduction

Soil microbial communities play essential role in enhancing soil fertility via nutrient cycling, altering biochemical soil environment, contributing to soil structure and crop productivity [1,2,3,4]. Increased microbial diversity is commonly associated with other key soil health factors and supports plant resistance to various environmental stresses [5]. Bacteria and fungi are the major microbial decomposers, releasing macronutrients, especially nitrogen (N).
Conservation agriculture (CA) practices, such as no-tillage (NT), cover crops (CC) and crop rotation alter the composition, diversity, abundance, and activity of soil microbial communities [6,7,8]. Adoption of CA practices benefits the soil by improving soil quality, reducing soil erosion, and may have synergistic effects on crop productivity over time [9]. However, some practices like cover crop systems often require significant cost and management inputs [10]. CA practices influence soil microbial community composition by increasing soil organic carbon (SOC) substrate, aeration and available moisture through improved soil structure, and moderating extreme temperatures [11,12,13]. Consequently, these changes create a microsite environment more conducive for microbial activities involved in the nutrient cycling and building of SOC [14]. On the other hand, intensive agricultural practices, such as conventional tillage, can also lead to changes in soil microbial diversity [15]. Intensive tillage can lead to soil compaction below the depth of tillage, oxidation of organic matter, and increased soil moisture loss [16]. Soil conditions under NT and CCs increase moisture retention, as residue on the soil surface promotes a cooler surface than the conventional tillage [17]. Fungi are better adapted to lower temperatures than bacteria [18]. Additionally, tillage leads to microbial habitat modifications, interference of soil pore networks and increase surface runoff which directly effects the microbial communities [19,20].
Previous studies revealed that, after 15 years of soybean-winter wheat–corn rotations, no- tillage and cover cropping increased SOC by 14% than conventional tillage (CT) [21]. Addition of crop rotation (corn, soybean, sorghum and wheat) to a monoculture with cover crops increased the SOC by 8.5% and nitrogen (N) by 12.8%, which considerably increased the soil microbial biomass C (20.7%) and N (26.1%) [22]. In addition, no-tillage with residue management in different cropping systems has improved the soil aggregation ratio and macroaggregate SOC stock by 36–66% [23].
Limited studies have compared the impacts of conservation agriculture practices between bacterial and fungal community composition. It was previously reported that in a comparison with mineral and organic fertilizers with different tillage systems, soil bacterial communities were principally structured by tillage, while fungal communities were mainly affected by fertilizer source and tillage [24]. Sun et al. [25] stated that, tillage changes the vertical distribution of soil bacterial and fungal communities, where bacterial community differences were defined by the presence and/or absence of species, while differences in the relative abundance of fungal species were observed. Zhang et al. [26] showed soils under soybean-maize rotation with organic fertilizer were dominated by bacterial communities and it reduced the percentage of fungi in soil by 24% when compared with the same fertilizer application and continuous maize-soybean.
Previous studies suggest that soil management practices shift the microbial diversity and community composition [15,27]. It is critical to understand how the combination of management systems shapes the soil microbiome. Additionally, soil microbiome differs across the soil types [28]. However, the combinational effects of differential tillage, winter cover practices and crop rotation on the soil microbial community in the silt loam soils is poorly understood. Therefore, we hypothesized that soil bacterial and fungal community composition and diversity will significantly differ across the different management systems.

2. Materials and Methods

2.1. Site Description

The study was conducted on a Grenada silt loam soil on 1.5% slope (Fine-silty, mixed, active, thermic Oxyaquic Fraglossudalfs; [29]), located at the Jamie L. Whitten Plant Materials Center (USDA) in northwest Mississippi (33°59′01″ N; 89°48′16″ W). Mean annual precipitation was reported to be 1490 mm, with a somewhat greater proportion falling in winter-spring than summer-autumn, while daily mean temperatures ranged from 10.7 °C to 23 °C [30].

2.2. Experimental Design and Treatment Description

The experiment was conducted from fall of 2015 to fall of 2018. The study was arranged as a randomized complete block design with four replications of each tillage-winter cover system. We used three replications in this study. The treatments as systems were two tillage regimes (conventional tillage and no-tillage) combined with three winter cover practices in which soybean (Glycine max (L.) Merr.) and maize (Zea mays L.) were rotated annually. The three winter cover practices were (1) bare (herbicide control of winter weeds), (2) cover crops, and (3) winter weeds. Cover crops were mixes of species that were determined using the NRCS Cover Crop Selection Tool [31]. The cover crop mixes included cereal rye [Secale cereale L.], oilseed radish [Raphanus sativus L.], and crimson clover [Trifolium incarnatum L.]). In total, the six management system treatments were (1) conventional tillage-bare (CT-B), (2) conventional tillage-cover crops (CT-CC), (3) conventional tillage-winter weeds (CT-WW), (4) no-till-bare (NT-B), (5) no-till-cover crops (NT-CC), and (6) no-till-winter weeds (NT-WW).
Soybeans were planted in the spring of 2015, followed by maize (2016) with the same rotation repeated in 2017 and 2018. The field was separated into treatment plots that were 4.1 m wide × 61 m in length and consisted of four raised bed/rows. Raised beds had 102 cm between row centers. Experimental crop management details, which include fertilization, tillage and winter cover practices, and weed control are given by Jacobs et al. [32].

2.3. Soil Sampling

Soil samples were collected in the fall after the maize harvest, in the year 2018. For each management systems, bulk samples (top 10 cm) were collected within each plot from three locations. Root debris were removed, and soil samples were composited, which were transferred in the 50mL tubes, transported to lab in coolers (4 °C) and stored at −80 °C for DNA extraction.

2.4. DNA Extraction, Sequencing, Data Processing and Analysis

Soil microbial DNA was isolated using the DNeasy Power soil kit (Qiagen, Hilden, Germany) following the manufacturer’s instructions. DNA quantity and integrity was assessed by Nanodrop® ND-1000 spectrophotometer and agarose gel electrophoresis, respectively. Extracted DNA was sent to Novogene (https://en.novogene.com/; Sacramento, CA, USA) for bacterial and fungal amplicon sequencing and sequenced on Illumina MiSeq platform (250-bp paired-end reads). The primer sets used for amplification of bacterial 16S rRNA (V4 region) and fungal ITS2 were, 515F (GTGCCAGCMGCCGCGGTAA) and 806R (GGACTACHVGGGTWTCTAAT) [33]; ITS3F (GCATCGATGAAGAACGCAGC) and ITS4R (TCCTCCGCTTATTGATATGC) [34], respectively.
The obtained paired-end raw reads were demultiplexed and subjected to quality check followed by denoising with DADA2. The allied metadata, high quality bases with phred score >Q20 were imported into QIIME via q2-import. The stitched reads were analyzed using the QIIME 2 (version 2021.11) software pipeline [35]. Amplicon Sequence Variants (ASV’s) were generated via DADA2 version, 2021.11.0 [36] using 97% similarity and taxonomy was assigned for 16S gene (using Greengenes) and ITS gene (using UNITE).
Data analysis was carried out using the MicrobiomeAnalyst software (version: 4.1.3; https://www.microbiomeanalyst.ca/ (accessed on 28 August 2022)) [37,38]. In MicrobiomeAnalyst, Marker Data Profiling (MDP) module was used to obtain the differential bacterial and fungal diversity matrices. BIOM table obtained from QIIME was used as data input. Data filtering and normalization was carried out following the steps described in one of our previous studies [27]. In brief, Alpha diversity was derived from Shannon diversity index and Chao1 (Richness). For Beta diversity, taxonomic and phylogenetic community comparisons were performed using Bray–Curtis and weighted UniFrac, respectively as the distance function using the Principal Coordinate Analysis (PCoA) ordination method. Sequence reads (raw data) were submitted to the Sequence Read Archive (SRA, NCBI) and can be accessed using the project accession number PRJNA889025.

2.5. Analyses of Soil Properties

Soil properties, pH, EC (dS/cm), total C (%), Phosphorous (P; mg/kg), Potassium (K; mg/kg), Zinc (Zn; mg/kg), Bulk density (g cm−3), Sand (%), Silt (%), Clay (%) and aggregate size were measured in the study. Soil pH was determined in 1:1 soil-water slurries [39], and soluble salts were measured as electrical conductivity [40]. Available P, K and Zn determined in Mehlich-3 extracts [41]. Samples to measure soil bulk density were collected in-tact with a hydraulic probe (Giddings, Windsor CO) from the 0–10 cm depth on top of the raised bed in the fall of 2018. Oven-dry soil mass and core volumes were used to calculate bulk density as the mean of two subsamples. Separate cores were collected for measurement of soil organic carbon (C), which determined by loss on ignition [42]. Alfisols derived from loess, such as the Grenada soil often contain hydroxy-interlayer minerals in the clay fraction, which possess interlayer water that can lead to an overestimation of total C by loss on ignition [29,43,44,45]. Loss on ignition was corrected to soil organic carbon using the quadratic equation developed by Jensen et al. [44] utilizing clay content. Particle size fractions (sand, silt, and clay) were measured by the hydrometer method [46]. Aggregate size was determined from core samples by dry-sieving [47] as aggregates retained on 100-mesh (0.149 mm openings), 200-mesh (0.074 mm openings) and 300-mesh (0.044 mm openings).

2.6. Statistical Analysis

In MicrobiomeAnalyst, statistical analysis for alpha diversity was evaluated using the Mann–Whitney/Kruskal–Wallis method at the significance level, p < 0.05. For Beta diversity, Permutational MANOVA (PERMANOVA) was used to test the significance of dissimilarity measures. Spearman’s Rank correlation analysis was used to obtain the pattern correlation graphs. ANOVA was performed to estimate the significant differences among means of treatment systems using (library—“doebioresearch”) Tukey’s HSD Test at p < 0.05 in RStudio 4.0.2. Mantel test was used to estimate the correlation between soil characteristics and microbial community composition using PC-ORD software (version 6.22; MJM Software, Gleneden Beach, OR, USA), which uses the Pearson’s correlation to compare the matrices. Canonical Correspondence Analysis (CCA) was performed using the PAST software, to explore association and the microbial community composition constrained by soil characteristics. Variation partition analysis was carried out using the CANOCO (version 4.5) software to quantify the relative contributions of soil variables and treatments to the fungal community structure.

3. Results

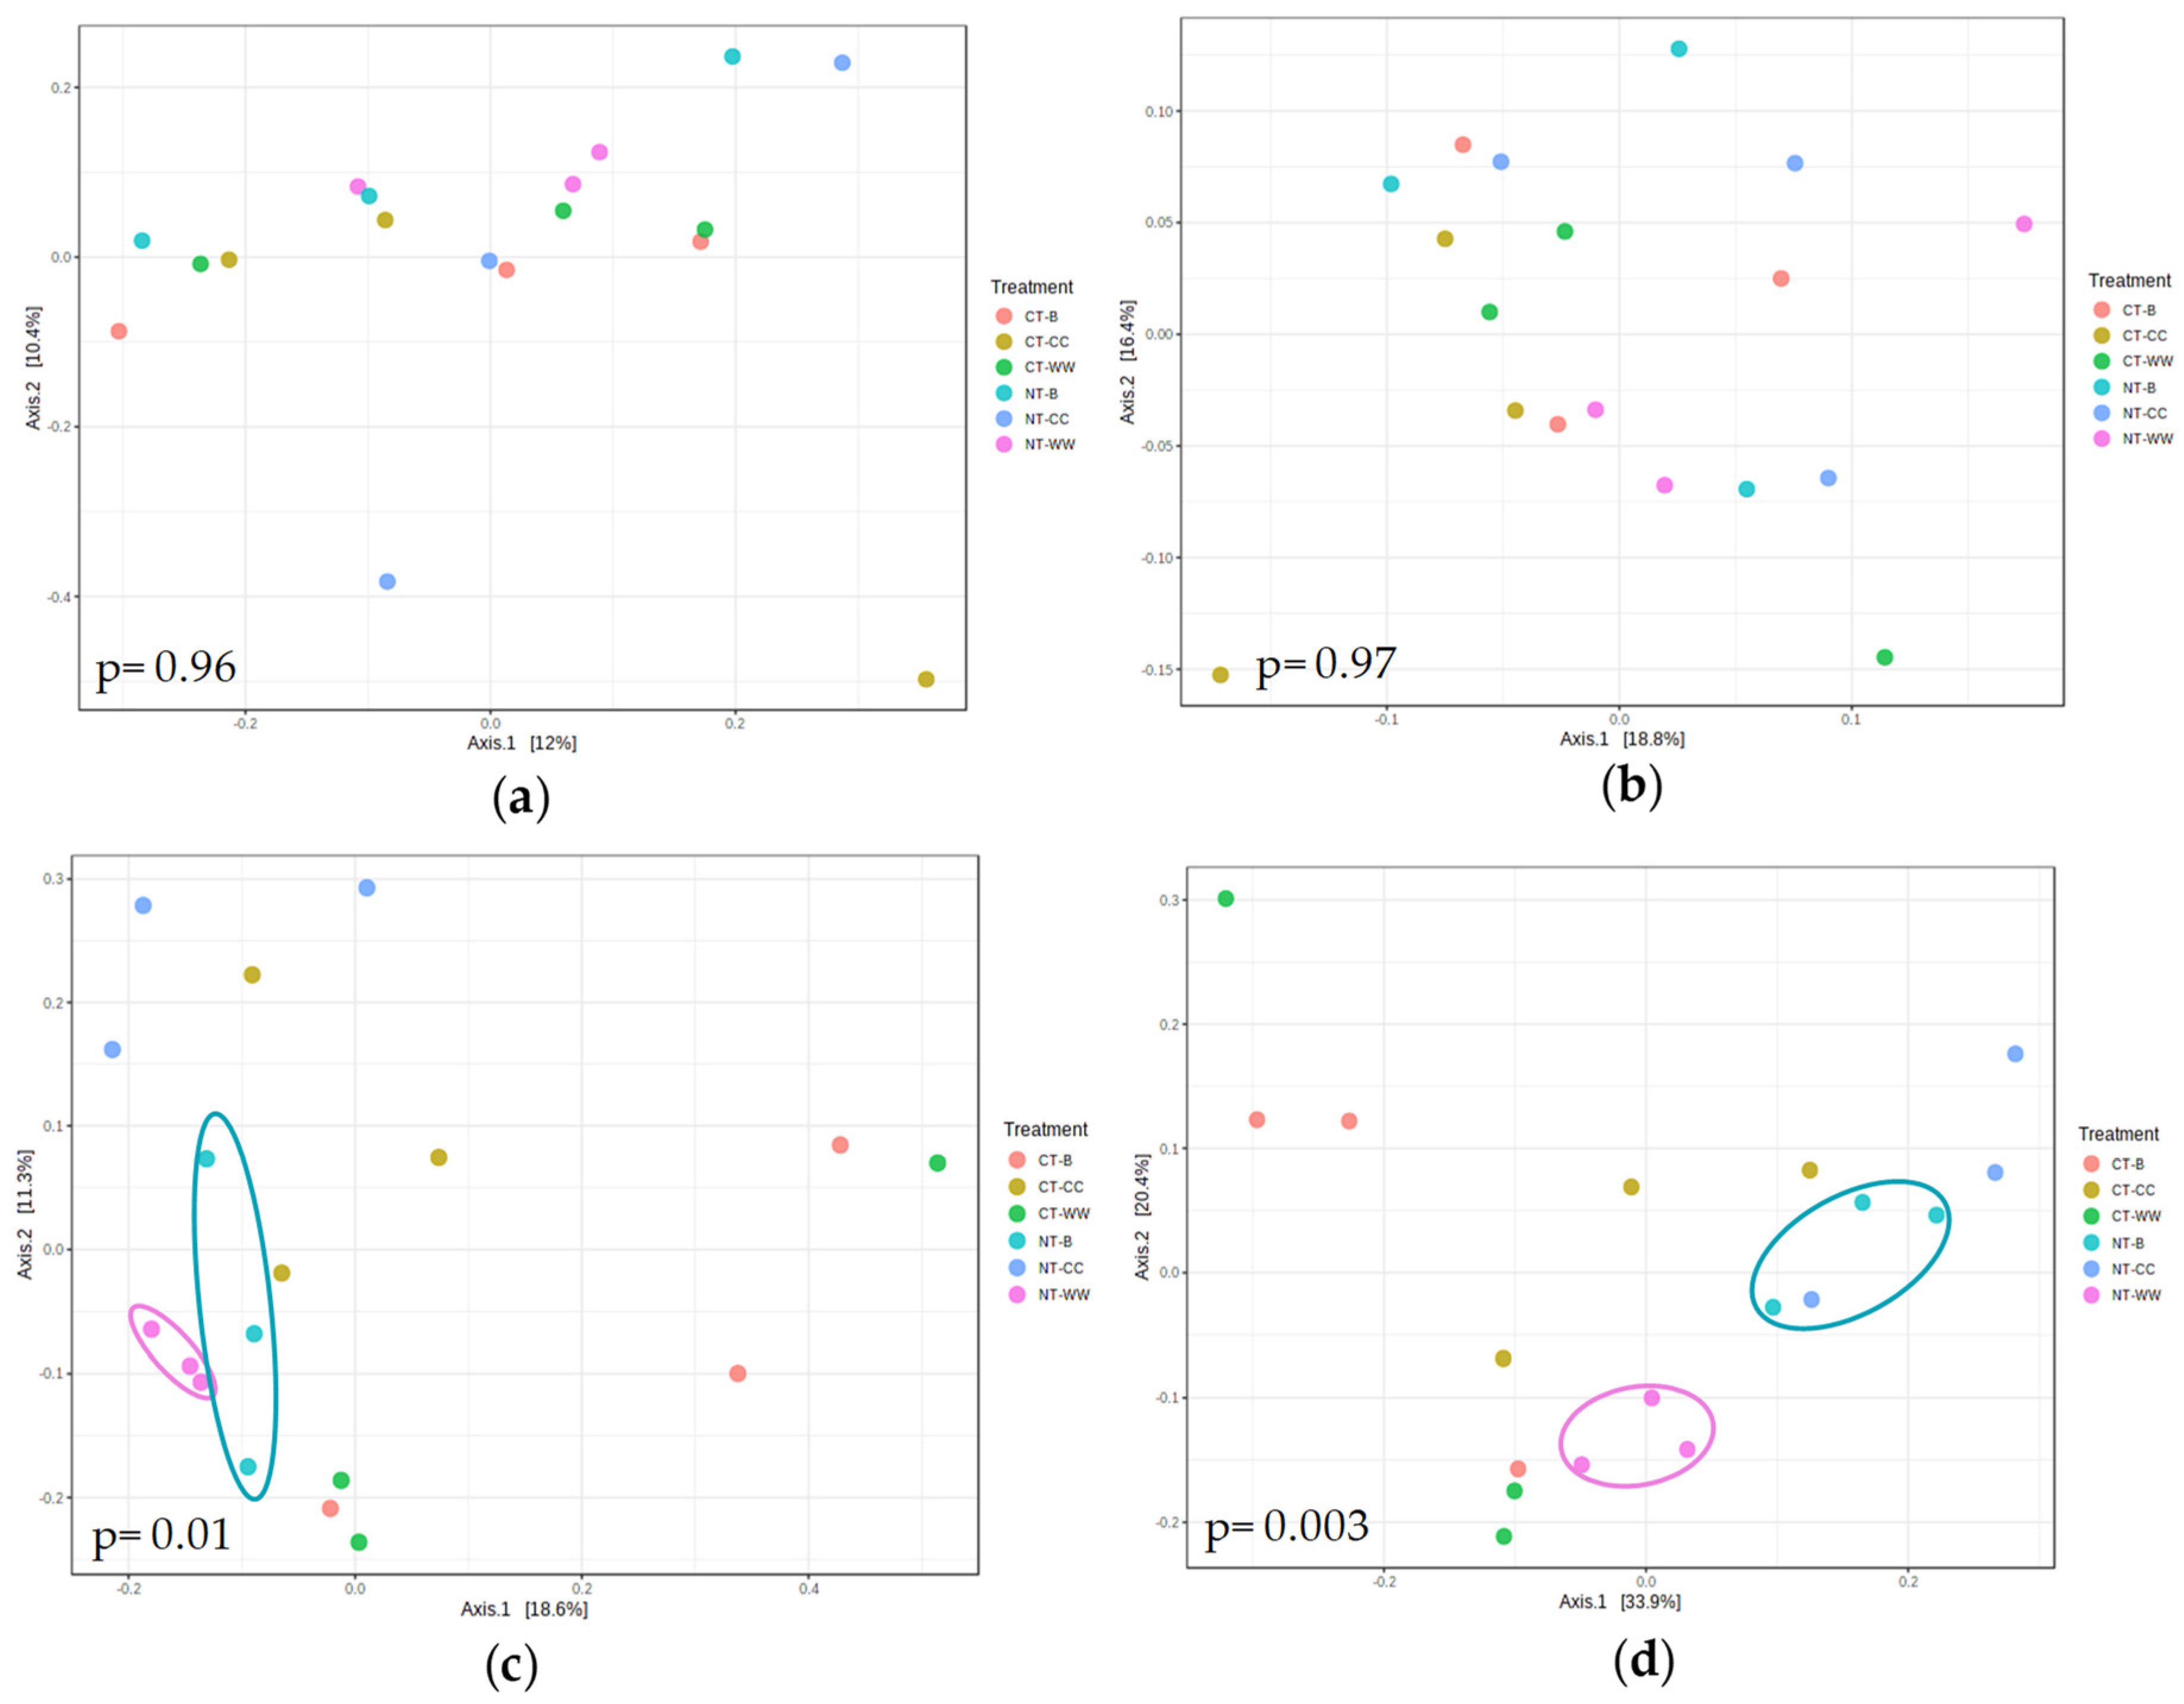
3.1. Microbial Alpha and Beta Diversity Differences in the Different Management Systems

After 3 years of management practices, i.e., the combination of crop rotation, tillage and winter cover practice, bacterial and fungal alpha diversity indices did not significantly differ among the management systems. In fungi, more variation in the average values was noticed in richness than Shannon diversity index (Table 1).
PCoA analysis of Bray–Curtis and phylogenetic tree based weighted UniFrac distances were used to visualize the beta diversity changes in the microbial communities (bacterial and fungal) under combination of tillage and winter cover systems. Soil bacterial communities showed no significant differences across the systems and distance matrices (Figure 1a,b). Fungal community composition differed significantly (p = 0.01) for Bray–Curtis distance matrix, accounting for 29.9% of total variation (Figure 1c). The fungal phylogenetic compositions (weighted UniFrac distance matrix) also showed significant (p = 0.003) differences across the systems. However, UniFrac matrix showed more of the variance in the data (54.3%) compared to Bray–Curtis distance method (Figure 1d). The systems, NT-WW and NT-B showed distinct clustering compared to the other management systems. Thus, the weighted UniFrac matrix was selected for interpretation of the results. These results revealed that no dissimilarity was observed in bacterial communities compared to fungal communities, irrespective of the management systems.

3.2. Bacterial and Fungal Community Composition in the Different Management Systems

Variations in the relative abundance at the phylum level were calculated to know the differential impacts of treatments on the microbial communities. Post hoc statistical analysis revealed no significant differences between the systems for relative abundances of bacterial communities at the phylum level (Supplementary Table S1), which is consistent with the bacterial beta diversity shown in Figure 1a,b.
The relative abundances of the top three fungal phyla were significantly different among the management systems and were dominated by the phylum, Ascomycota (Table 2). Across the management systems, relative abundance of the top three fungal populations at the phylum level were observed in the order Ascomycota > Basidiomycota > Mortierellomycota (Table 2). Higher relative abundance of Ascomycota was found with no-tillage-cover crop (84%) followed by no tillage-bare fallow (72%) and no tillage-winter weeds (67%) as compared to conventional tillage systems (Table 2). The second most abundant phylum, Basidiomycota, ranged from 44% with conventional till-bare winter to 7% in no-till-cover crop (Table 2). The third most abundant, Mortierellomycota, was highest under conventional till-winter weeds (14%) and lowest under no-till-cover crop (2.8%) (Table 2).

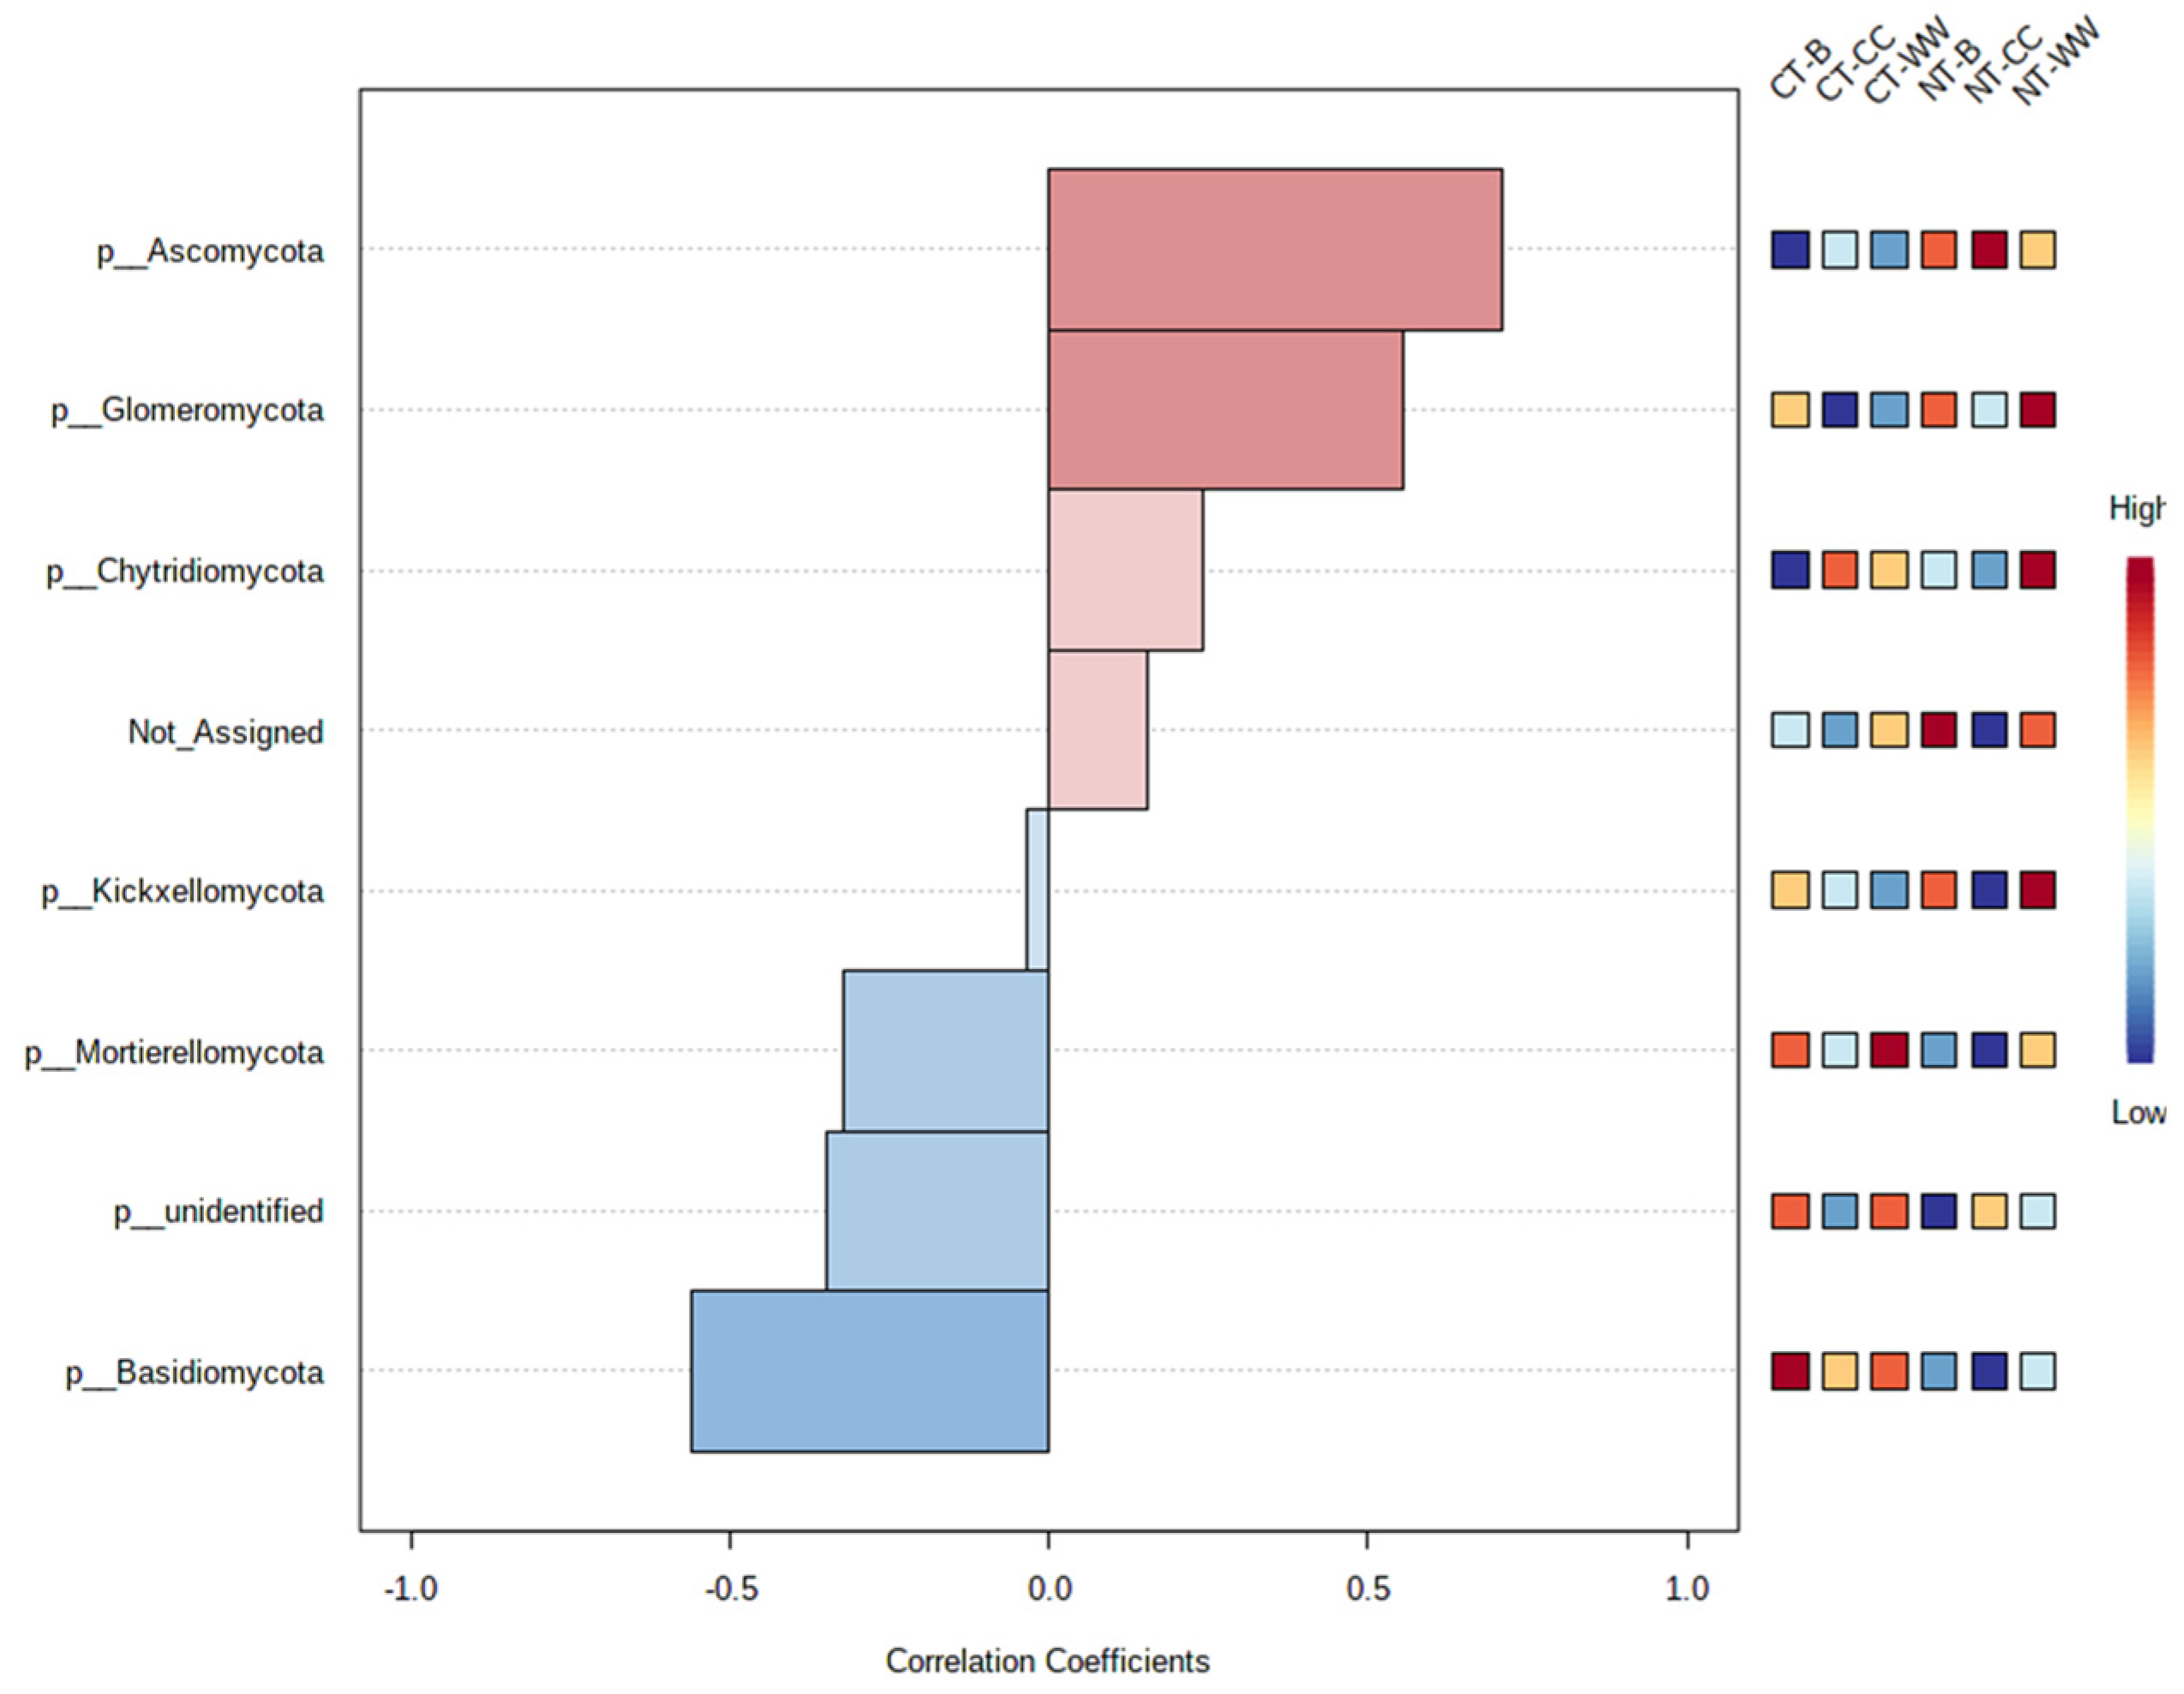
3.3. Microbial Community Profiling and Correlation Analysis

To further elucidate phylum level relative abundances, a combination of pattern correlation and heat map analyses was carried out to evaluate correlations between highly abundant bacterial or fungal phyla and management systems. In the bacterial community profile, the phylum Acidobacteria showed positive correlation (0.28) across the systems. However, many of the bacterial phyla exhibited negative correlations and no significance differences were observed between systems (Supplementary Figure S1).
For the fungi, profile analysis results were similar to relative abundance (Table 2), where strong positive correlation (0.71, p < 0.001) was observed for the phylum Ascomycota across the management systems (Figure 2). This result is complimented by the heatmap, showing highest presence of Ascomycota in the no-tillage systems, with the highest in cover crop (NT-CC), followed by bare (NT-B) and winter weeds (NT-WW) (Figure 2). This suggests that no-tillage practice is a dominant factor in fungal community composition and distribution.

3.4. Soil Properties

Soil physiochemical characteristics under different tillage and cover management systems is shown in Table 3. Soil pH and bulk density were significantly different among the systems. Soil pH was significantly lower (pH-5.8; p < 0.005) in the no-tillage-cover crop system compared to other systems. Although there were significant differences in soil bulk density among the management systems, no clear pattern was discerned (Table 3). There were no differences for total carbon (C), soil test potassium (K), phosphorus (P), and zinc (Zn), as well as percentages of sand, silt, clay, and aggregate size (Table 3).

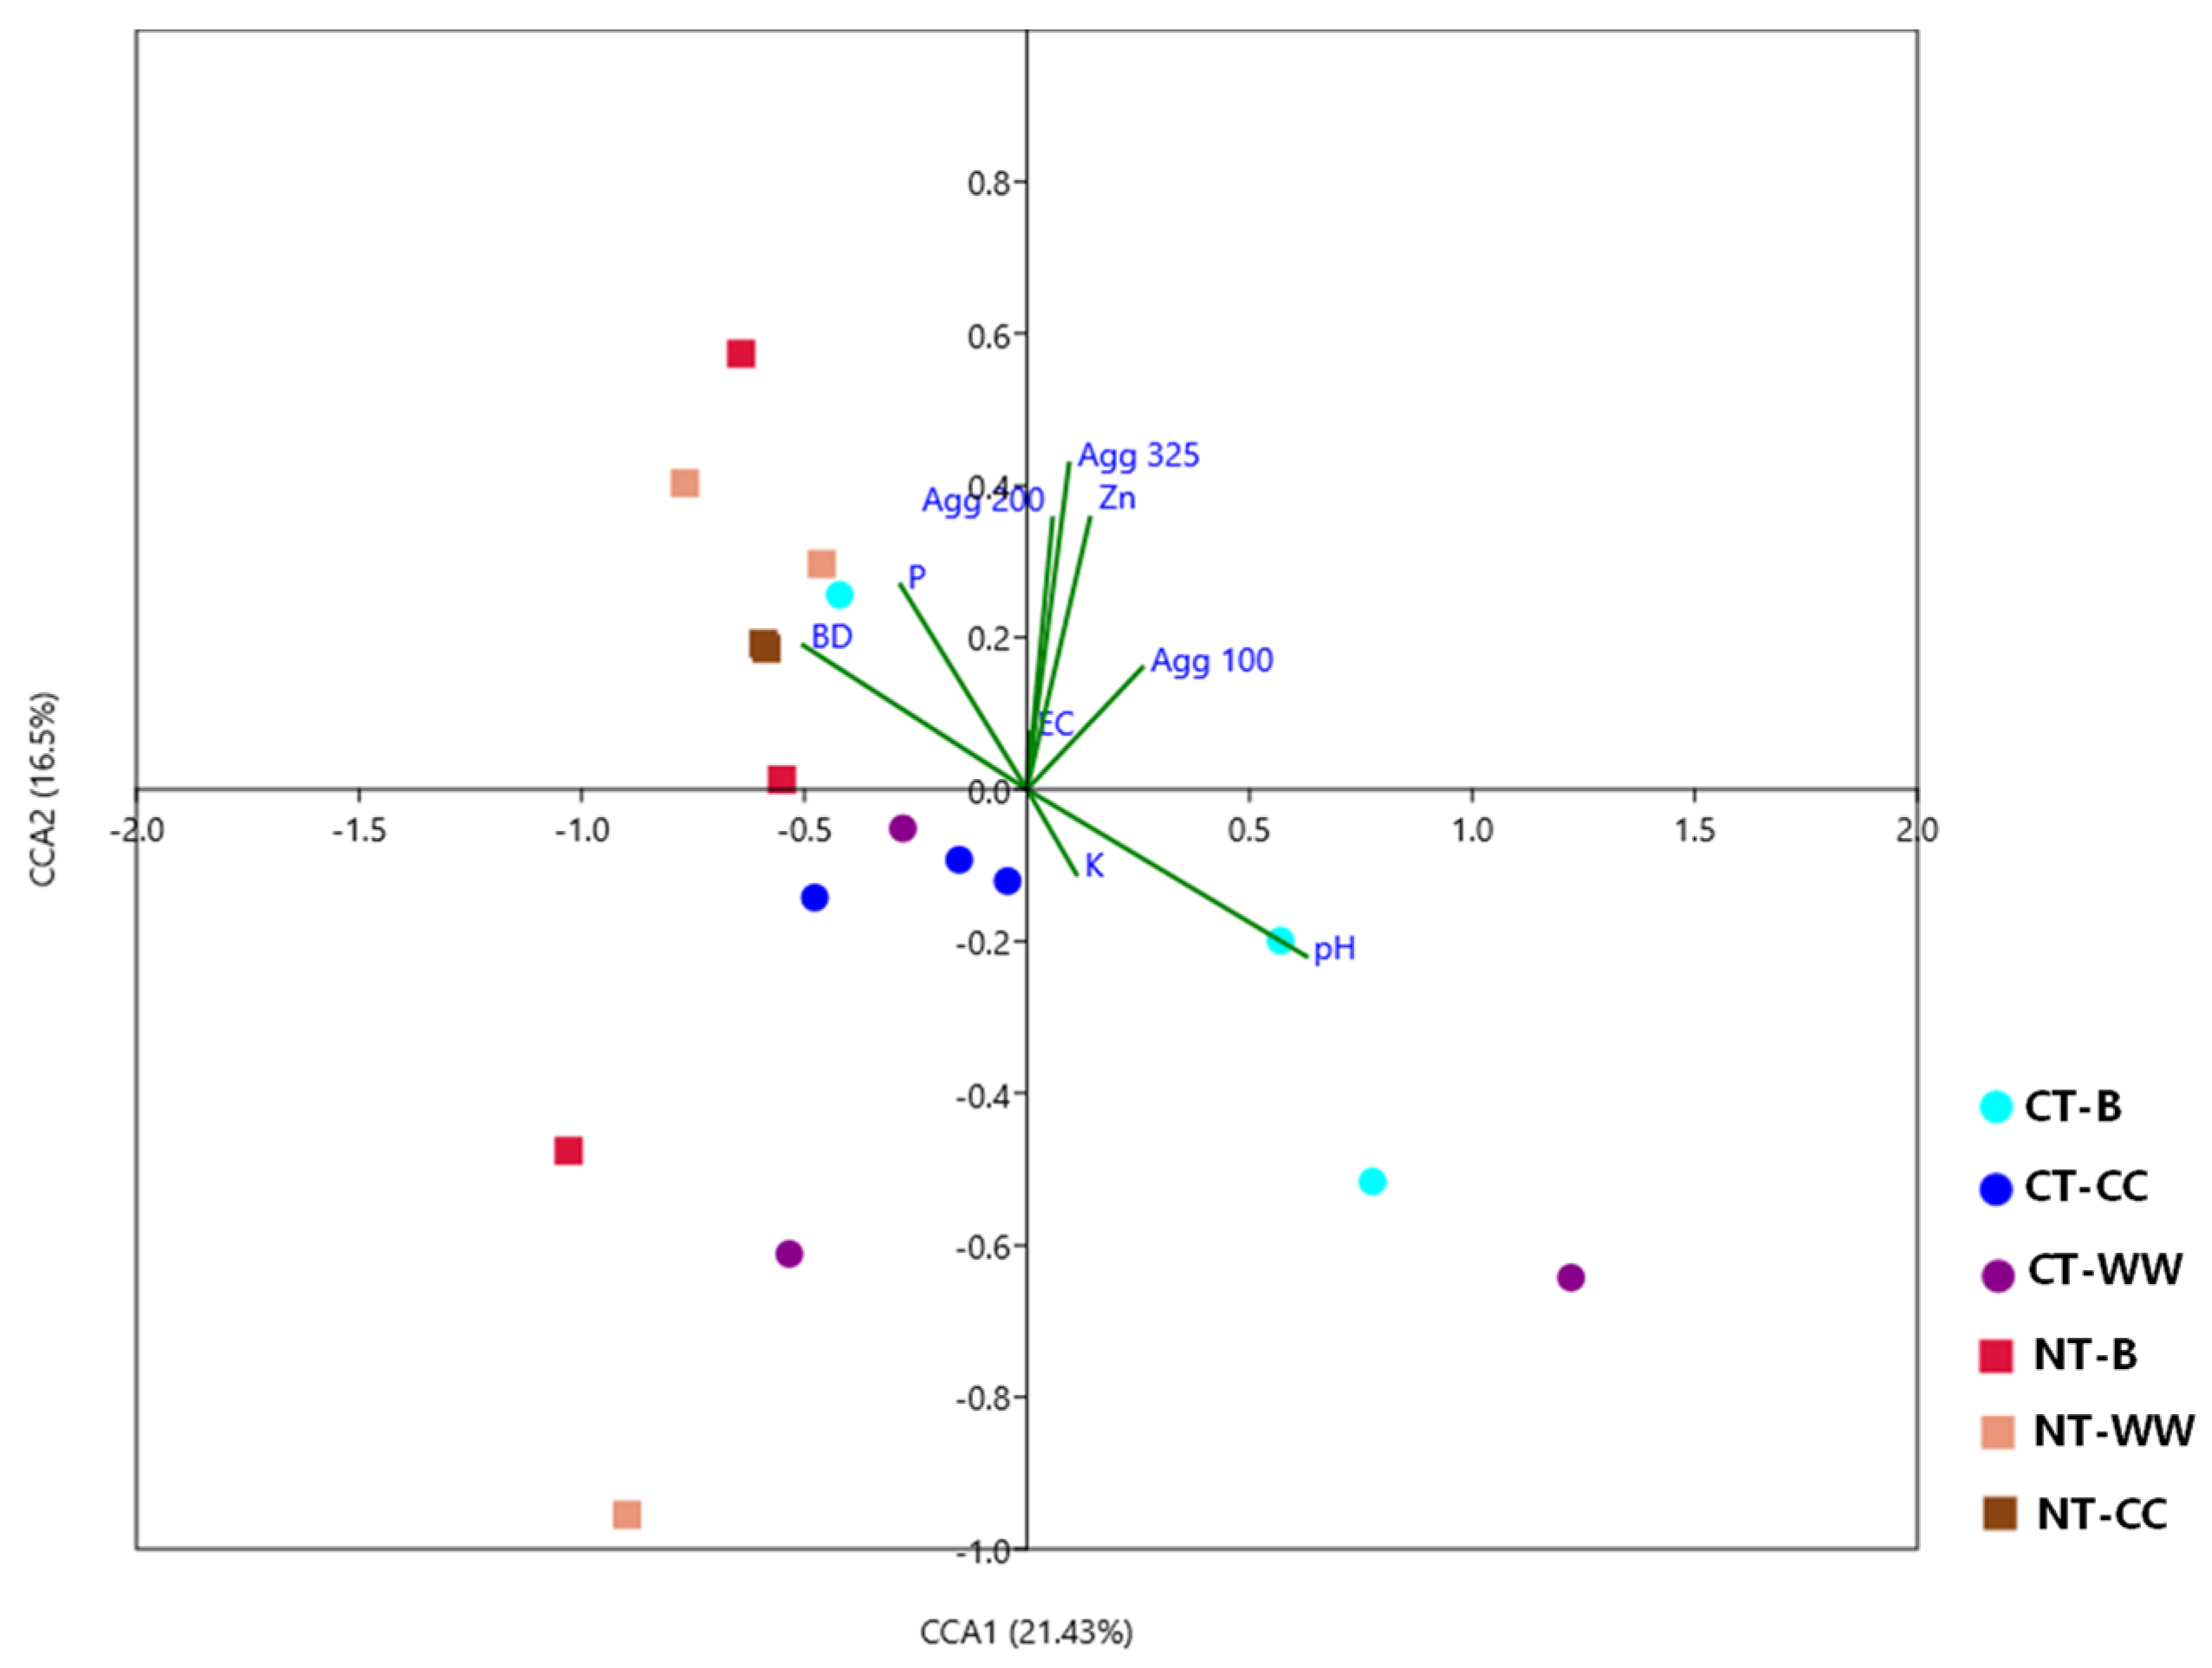
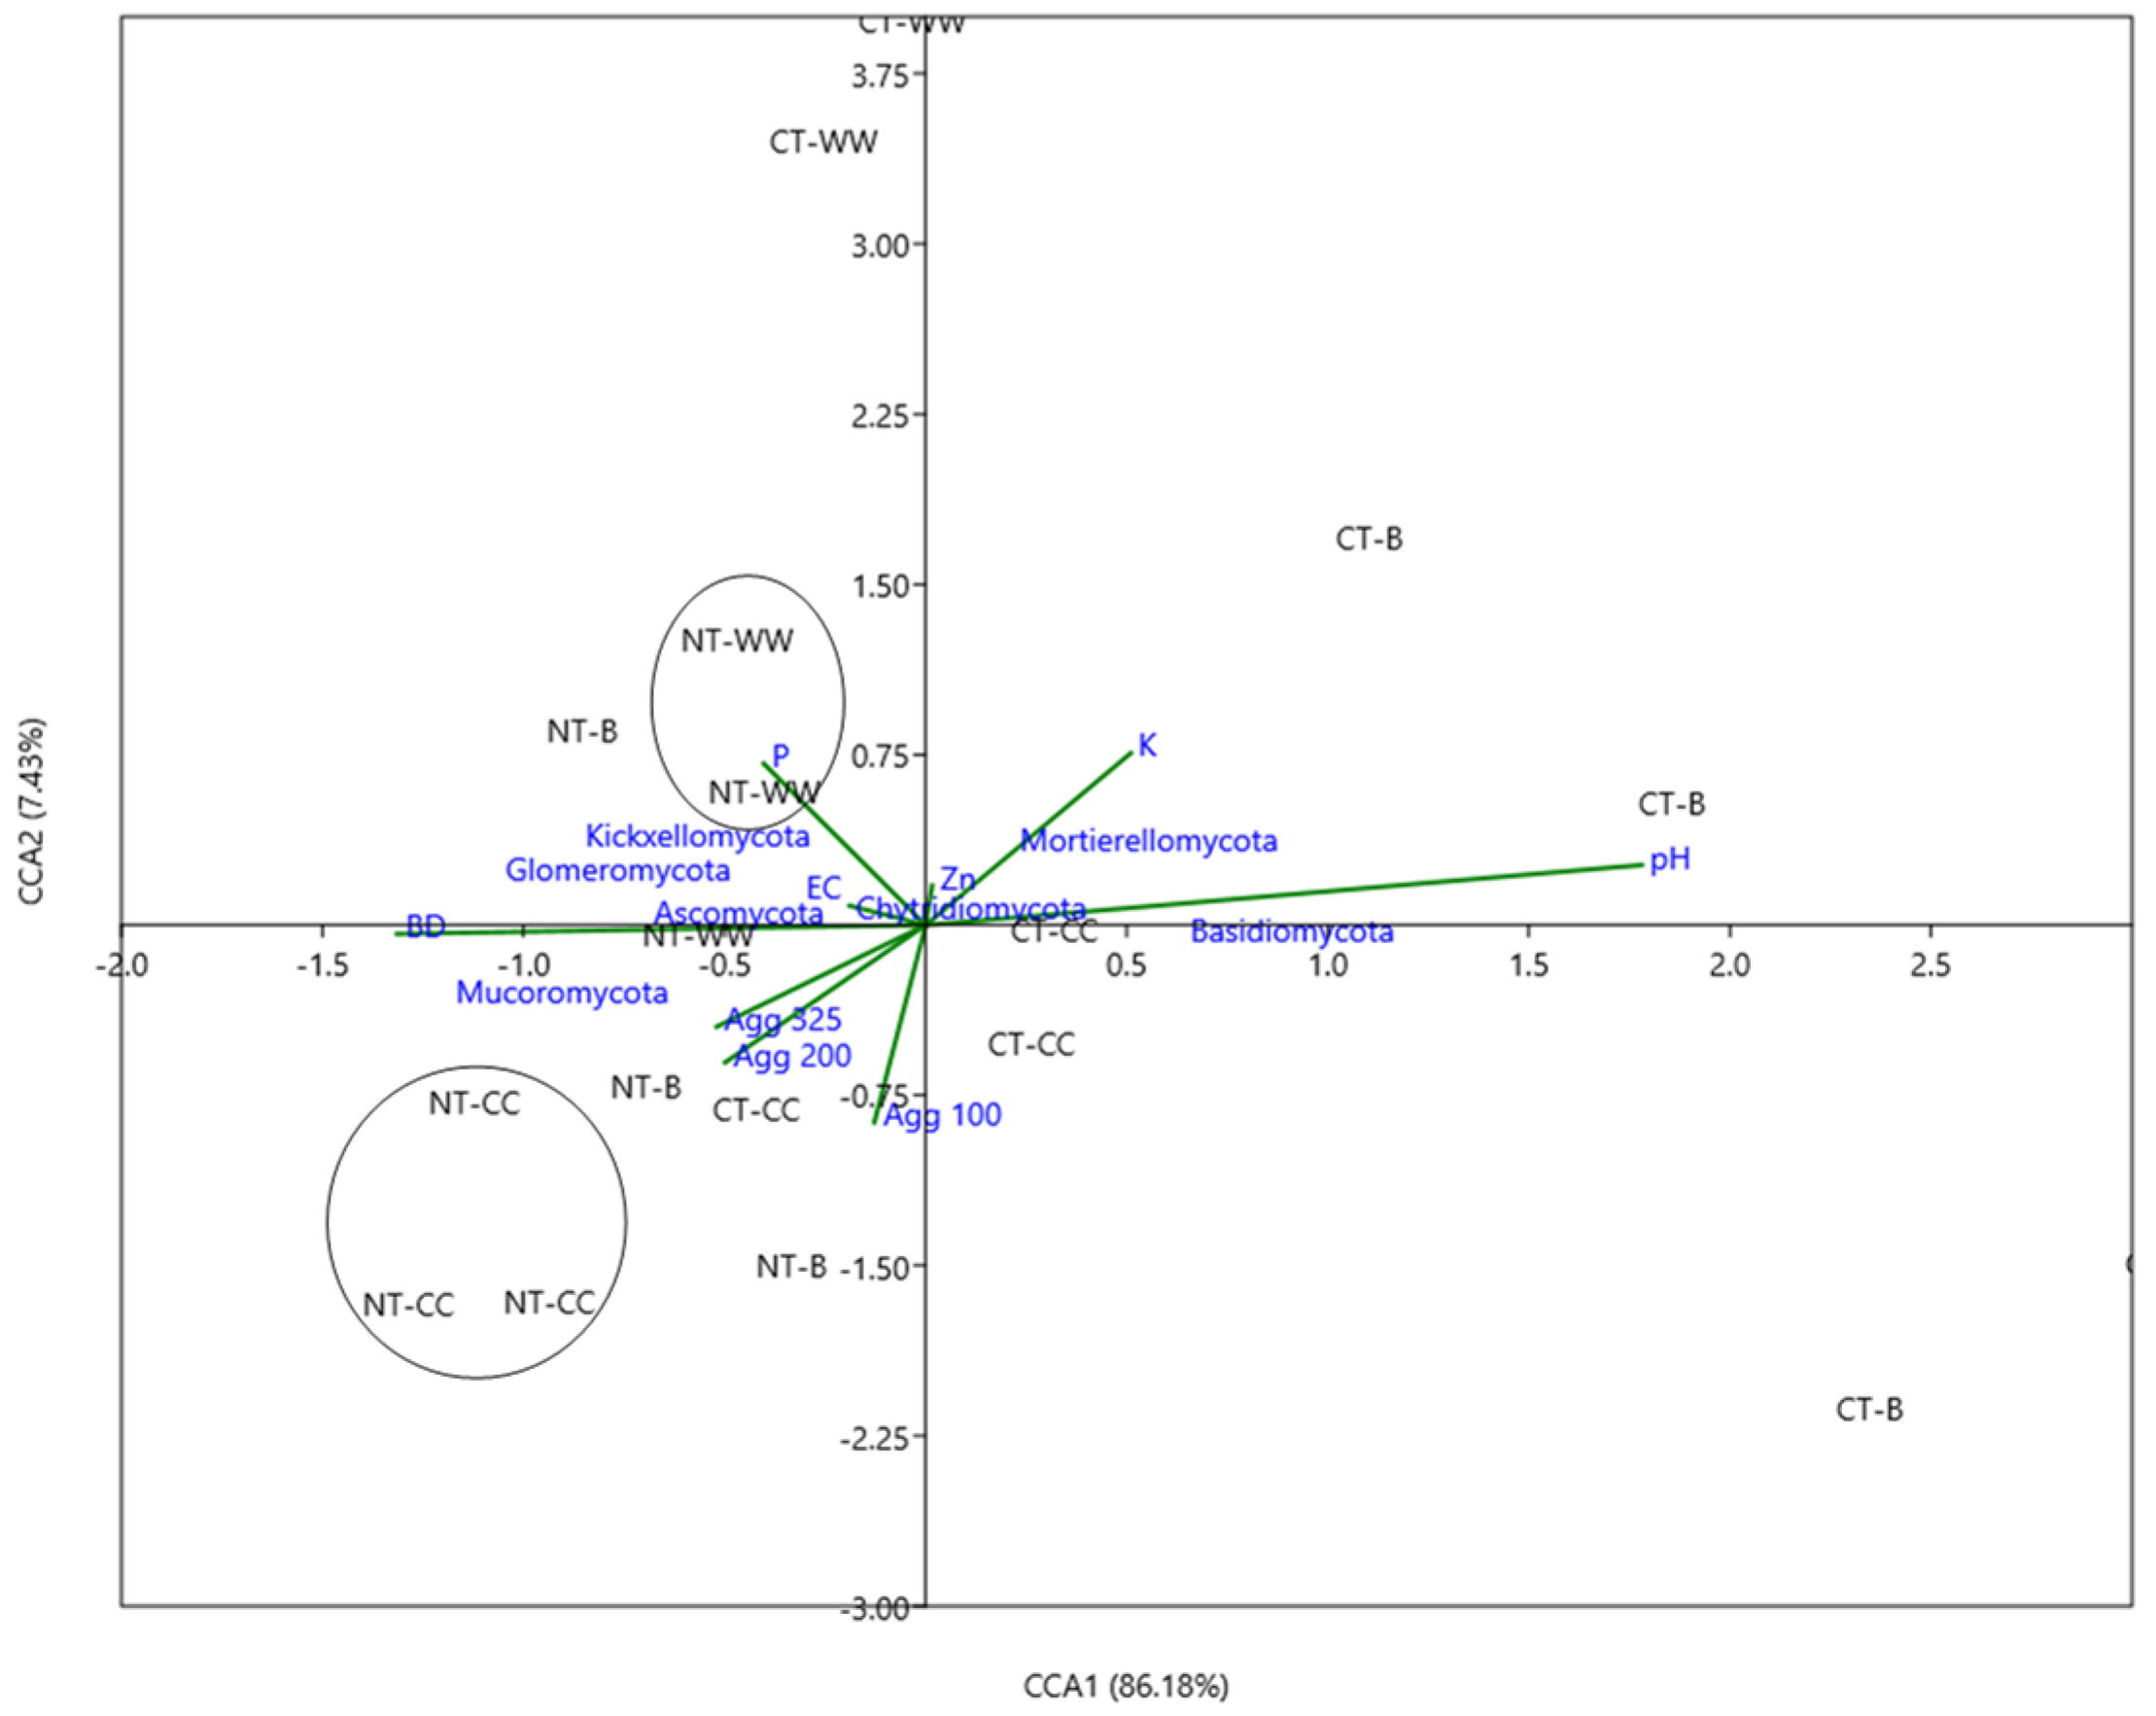
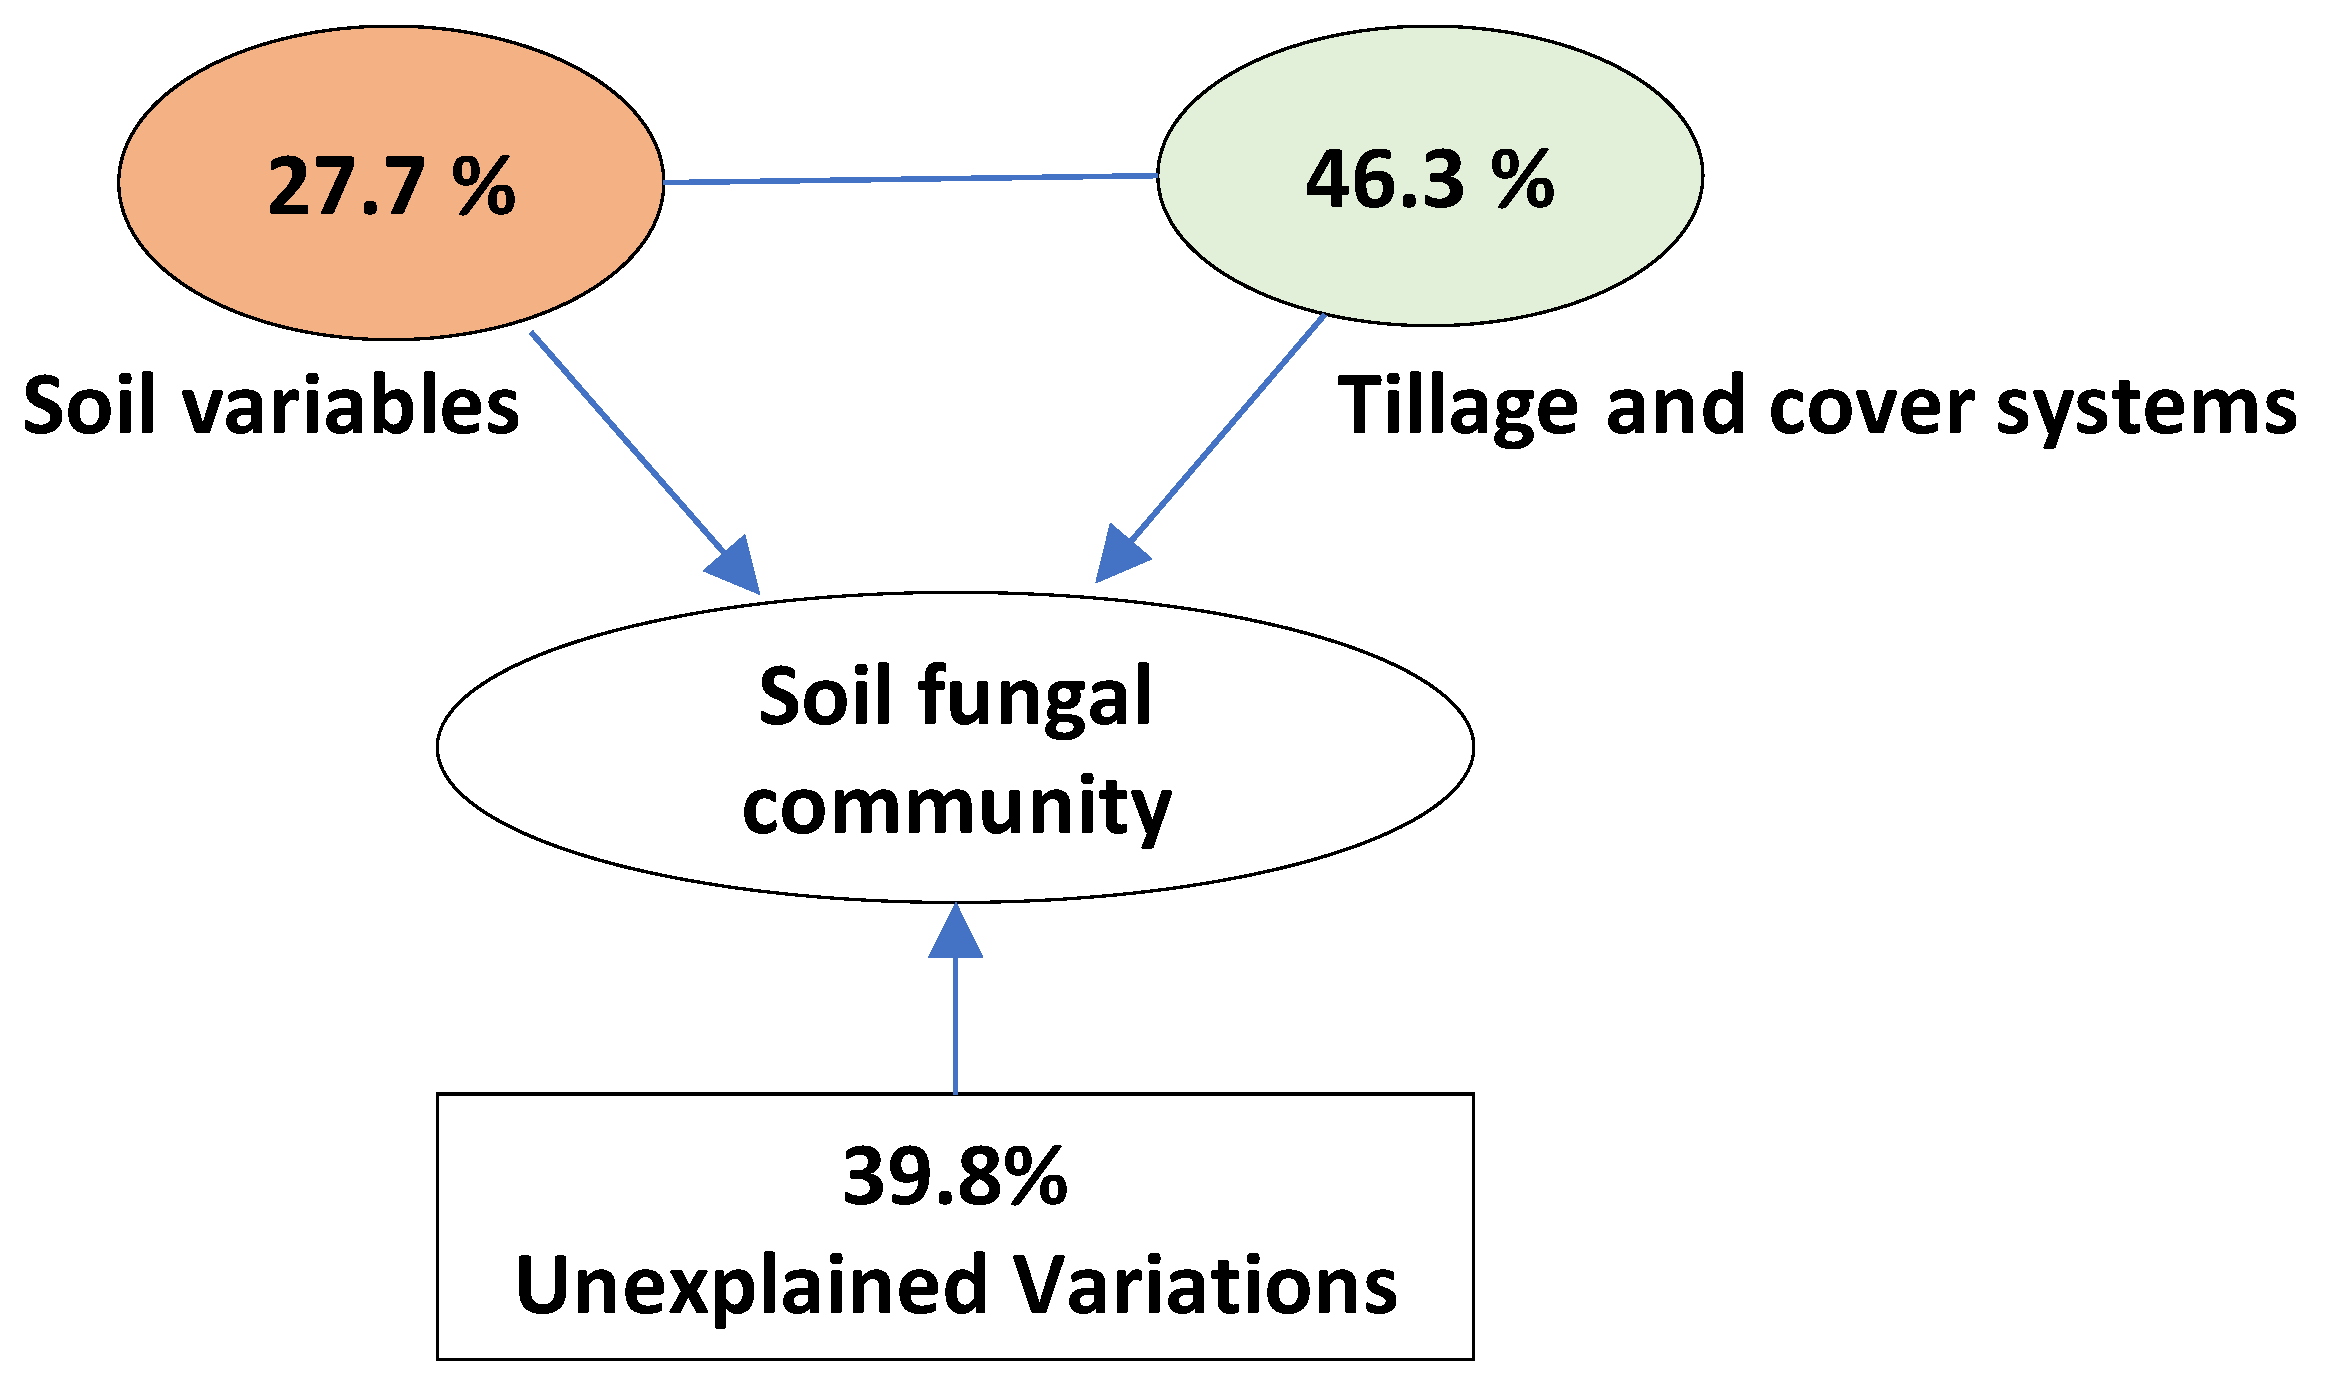
3.5. Relationship between Soil Properties and Fungal Community Composition

Canonical correspondence analysis (CCA) was conducted on ASVs to describe the relationship between fungal community composition and selected soil properties (Figure 3). This was not performed on bacterial data since no differences in the bacterial community composition were observed. CCA revealed 37.3% of total variation, where changes in the soil fungal communities were positively correlated with pH, soil test P, and negatively correlated with bulk density (Figure 3). CCA was also performed on the relative abundances according to fungal phyla (Figure 4). These results showed that the no-till-cover crop system samples grouped into a distinct clusters along first principal component axis (Figure 4). Where the strongest relationship was with soil bulk density (BD in Figure 4) and aggregate size and Ascomycota and Mucoromycota phyla (Figure 4). The no-till-winter weeds system clusters were associated with soil test P and EC and the abundance of Glomeromycota and Kickxellomycota (Figure 4). In addition, the Mantel test was used to calculate correlations between corresponding positions of fungal community composition and soil property distance matrices. Overall, soil pH was significantly correlated (p = 0.014) with the relative abundances of fungal phyla (Table 4).
Variation partitioning was combined with CCA to explain the relative contributions of management systems and soil properties to the variations in soil fungal communities. The combination of tillage-winter cover practice systems was the major factor shaping soil fungal communities, which is explained by 46.3% variation (Figure 5).

4. Discussion

In this study, after three years of maize-soybean rotation with tillage-winter cover management systems, fungal community composition varied significantly. In contrast, bacterial communities displayed no differences despite a higher number of bacterial (5120) than fungal (2400) ASVs.
Microbial alpha diversity was assessed using Shannon diversity index, which is more stable and reliable than other methods and less sensitive to sequencing errors [48]. However, it is weighted towards more abundant taxa as compared to species richness estimates. Interestingly, both bacterial and fungal diversity and richness (Chao1) were not significantly different across the management systems (Table 1). Some past studies have reported higher bacterial and fungal diversity under NT than CT [49], while others showed higher microbial alpha diversity with CT than NT [50]; several have reported no change in alpha diversity with tillage [51,52]. Additionally, microbial community composition can vary with the season and/or between soil types [53,54]. Several other factors like sampling depth may explain this response in microbial diversity, as recent studies found that soil microbial diversity increases with increasing soil depth under NT [52]. Crop diversity via rotation influences the microbial activity and community composition at different crop growth stages through root exudates, which employs microbial populations by differences in substrate quality [55,56,57]. Our results indicated that 3 years of these management systems have not affected either alpha diversity or species richness.
We hypothesized that management systems would cause significant difference in the abundance and distribution of soil microbial populations. However, in our study no differences in bacterial community compositions. In contrast, study by Smith et al. [20] had a greater impact of CT versus no-till, and NT fields had distinct bacterial communities. There were system effects on fungal communities, which was shown in clear dissimilarities (Figure 1c,d) for both the distance methods. In this study, there were similarities in the minimally disturbed systems with no tillage. Young and Ritz [19] showed an effect of CT in soil microbial community distribution. Fungal communities respond to the degree or intensity of soil disturbance as hyphal networks can be disrupted by CT [58]. Evidence from recent findings support our study where there was a greater shift in the beta diversity of fungal communities than bacteria with similar management systems [50]. Moreover, soil fungal communities in NT systems across 0–100 cm soil depth revealed high levels of stratification, where deeper depths had fungal communities with lower alpha diversity [59].
In the study, PCoA showed no clear partitioning for bacteria among the management systems for either taxonomic (Bray–Curtis) and phylogenetic (weighted UniFrac) distance methods. These results were in contrast to those of Wang et al. [60] who showed that with non-metric multidimensional scaling, comparison of conservation with conventional tillage had significant differences in bacterial community composition using either taxonomic or phylogenetic distance measures. However, with respect to fungal communities, we found that the weighted UniFrac distance measure method showed more data variation, axis 1 and 2 from the PCoA accounted for 33.9% and 20.4% of the variation across the systems, than the Bray–Curtis matrix (Figure 1c,d). Additionally, UniFrac distance matrix showed differences in the cluster pattern, which may be due to the differences existing in one or clusters of taxa in the lineages of the phylogenetic tree [61,62]. The Bray–Curtis distance method accounts for the relative abundance of each taxon, which might account for differences in the data variation. Weighted UniFrac is suited for large-scale comparisons across multiple community samples and analysis of seasonal changes which is influenced by the several factors and for exploring transient changes in microbial communities related to nutrient availability [62]. The specific ordination methods and distance measures can generate the different outcome that may lead to alternate interpretations of beta diversity. Thus, the choice of the distance measure method is crucial since the relative abundance and distribution of soil bacterial and fungal populations is critical to delineating community changes.
Across different soil management systems, we found that Ascomycota and Basidiomycota were the dominant fungal phyla. There was significant difference in the phylum Ascomycota between the systems (Table 2). These results are consistent with other studies. A similar study by Kodadinne Narayana et al. [27], where soil management practices (NT and CCs) in a dryland soybean system resulted in Ascomycota and Basidiomycota as the dominant phyla. Previous studies stated that intensive agriculture often decreases the abundance of bacterial and fungal communities [19], which is consistent with our results where a higher abundance level of Ascomycota was observed in management systems with no tillage.
Soil management practices can cause variation in soil physio-chemical properties. Generally, changes in soil properties are linked with changes in microbial communities [63]. In the study, soil pH and bulk densities were significantly different across the management systems (Table 3). Additionally, no significant differences were observed for other properties. While others have observed the increased levels of most of nutrients (soil total nitrogen, P, and exchangeable K; calcium, magnesium and Zn) with NT compared to conventional tillage [20,64]. Although there were differences in soil bulk density, there were no clear patterns based on management system. The comparatively lower pH under no-tillage-cover crop system might be due decomposition related to differences in the quality of organic matter as a substrate [65]. A meta-analysis by Li et al. [66] reported that relative to CT, NT decreased soil pH by 1.2% and 3.3% in the surface and subsoil, respectively. Consequently, no-till and cover cropped soils may aid in enrichment of soil organic matter quality in the surface layer due to accumulation of crop residues and root exudates, which is conducive for the soil microbial communities [67].
We further explored how management system-induced soil edaphic factors impacted microbial diversity and community composition. Soil pH effects on fungal diversity and community composition were observed (Table 3), which has been shown elsewhere [68]. Growth-based measurements of fungi increased 30-fold in a study where the pH varied from 8.3 to 4.5 [69]. A study by Tedersoo et al. [70] revealed that soil pH explained 1.5% of the variation in total fungal community composition in an organic matter-rich soil. However, in most cases, microbial community variation drives by multiple environmental factors rather than single driver. Change in microbial activity, e.g., carbon mineralization and microbial growth are interlinked [71]. In addition, soil type plays a major role in change of soil fungal community structure and magnitude of change depends on the management factors [28].
Overall, in this short-term study, different management systems had minor impacts on the soil microbial communities. Management systems influenced the fungal community composition, but the bacterial abundance and diversity were not affected. These results demonstrated that fungal communities are responsive to no-tillage-cover crop systems. Soil pH may have been a key factor facilitating the variation of soil fungal community composition in the NT-CC system. Our results indicated that weighted UniFrac metric outperforms the Bray–Curtis by capturing the more data variation. Further long-term research is needed to better understand the relationship between these practices and the implications of multicomponent management systems on the changes in soil microbial communities and their relation to key functions in soil, such as plant growth promotion. Finally, greater insight into the ecological functions of specific soil phylogeny is a central aim for agricultural soil microbial ecology.

Supplementary Materials

The following supporting information can be downloaded at: https://0-www-mdpi-com.brum.beds.ac.uk/article/10.3390/land11122259/s1, Table S1: Relative abundance of bacterial phyla across the tillage and winter cover practice management systems; Figure S1: Pattern correlation and heat map analysis of bacterial phyla bacterial phyla across different management systems. Bars indicate the correlation coefficients of the different phyla which are ranked by correlation and to the right, heatmap showing levels of abundance (red-higher; blue-lower) in each treatment. (CT-B: Conventional Tillage-Bare fallow; CT-CC: Conventional Tillage-Cover Crop; CT-WW: Conventional Tillage-Winter weeds; NT-B: No-tillage- Bare fallow; NT-CC: No-tillage-Cover Crop; NT-WW: No-tillage-Winter Weeds).

Author Contributions

Conceptualization, N.K.N., W.L.K. and S.G.S.; methodology, W.L.K., N.K.N. and S.G.S.; software, S.G.S. and N.K.N.; validation, S.G.S. and W.L.K.; formal analysis, S.G.S. and N.K.N.; investigation, W.L.K., A.A.J. and J.K.A.; resources, A.A.J. and J.K.A.; data curation, N.K.N., S.G.S. and W.L.K.; writing—original draft preparation, N.K.N.; writing—review and editing, N.K.N., W.L.K., A.A.J. and S.G.S.; visualization, N.K.N., W.L.K. and S.G.S.; supervision, S.G.S.; project administration, A.A.J., W.L.K. and S.G.S.; funding acquisition, A.A.J. and S.G.S. All authors have read and agreed to the published version of the manuscript.

Funding

This work was supported by the USDA-NRCS Plant Materials Program.

Data Availability Statement

The data presented in this study are available on request from the corresponding author. Raw amplicon sequence reads can be retrieved (NCBI, SRA) under BioProject ID PRJNA889025.

Acknowledgments

We are grateful for the support by the USDA-NRCS’s Jamie L. Whitten Plant Materials Center, Coffeeville, MS, USA.

Conflicts of Interest

The authors declare no conflict of interest.

References

  1. Ranjard, L.; Poly, F.; Nazaret, S. Monitoring Complex Bacterial Communities Using Culture-Independent Molecular Techniques: Application to Soil Environment. Res. Microbiol. 2000, 151, 167–177. [Google Scholar] [CrossRef] [PubMed]
  2. Sjöberg, G.; Nilsson, S.I.; Persson, T.; Karlsson, P. Degradation of Hemicellulose, Cellulose and Lignin in Decomposing Spruce Needle Litter in Relation to N. Soil Biol. Biochem. 2004, 36, 1761–1768. [Google Scholar] [CrossRef]
  3. White, P.M.; Rice, C.W. Tillage Effects on Microbial and Carbon Dynamics during Plant Residue Decomposition. Soil Sci. Soc. Am. J. 2009, 73, 138–145. [Google Scholar] [CrossRef]
  4. Stefan, L.; Hartmann, M.; Engbersen, N.; Six, J.; Schöb, C. Positive Effects of Crop Diversity on Productivity Driven by Changes in Soil Microbial Composition. Front. Microbiol. 2021, 12, 660749. [Google Scholar] [CrossRef] [PubMed]
  5. Chaparro, J.M.; Sheflin, A.M.; Manter, D.K.; Vivanco, J.M. Manipulating the Soil Microbiome to Increase Soil Health and Plant Fertility. Biol. Fertil. Soils. 2012, 48, 489–499. [Google Scholar] [CrossRef]
  6. Ceja-Navarro, J.A.; Rivera-Orduña, F.N.; Patiño-Zúñiga, L.; Vila-Sanjurjo, A.; Crossa, J.; Govaerts, B.; Dendooven, L. Phylogenetic and Multivariate Analyses To Determine the Effects of Different Tillage and Residue Management Practices on Soil Bacterial Communities. Appl. Environ. Microbiol. 2010, 76, 3685–3691. [Google Scholar] [CrossRef] [PubMed] [Green Version]
  7. Choudhary, M.; Sharma, P.C.; Jat, H.S.; Dash, A.; Rajashekar, B.; McDonald, A.J.; Jat, M.L. Soil Bacterial Diversity under Conservation Agriculture-Based Cereal Systems in Indo-Gangetic Plains. 3 Biotech 2018, 8, 304. [Google Scholar] [CrossRef]
  8. Kim, N.; Zabaloy, M.C.; Guan, K.; Villamil, M.B. Do Cover Crops Benefit Soil Microbiome? A Meta-Analysis of Current Research. Soil Biol. Biochem. 2020, 142, 107701. [Google Scholar] [CrossRef]
  9. Miguez, F.E.; Bollero, G.A. Review of Corn Yield Response under Winter Cover Cropping Systems Using Meta-Analytic Methods. Crop Sci. 2005, 45, 2318–2329. [Google Scholar] [CrossRef] [Green Version]
  10. Plastina, A.; Liu, F.; Sawadgo, W.; Miguez, F.; Carlson, S.; Marcillo, G. Annual Net Returns to Cover Crops in Iowa. J. Agric. Appl. Econ. 2018, 2, 2. [Google Scholar] [CrossRef]
  11. Huang, M.; Jiang, L.; Zou, Y.; Xu, S.; Deng, G. Changes in Soil Microbial Properties with No-Tillage in Chinese Cropping Systems. Biol. Fertil. Soils 2013, 49, 373–377. [Google Scholar] [CrossRef]
  12. Pannkuk, C.D.; Papendick, R.I.; Saxton, K.E. Fallow Management Effects on Soil Water Storage and Wheat Yields in the Pacific Northwest. Agron. J. 1997, 89, 386–391. [Google Scholar] [CrossRef]
  13. Lange, M.; Habekost, M.; Eisenhauer, N.; Roscher, C.; Bessler, H.; Engels, C.; Oelmann, Y.; Scheu, S.; Wilcke, W.; Schulze, E.-D.; et al. Biotic and Abiotic Properties Mediating Plant Diversity Effects on Soil Microbial Communities in an Experimental Grassland. PLoS ONE 2014, 9, e96182. [Google Scholar] [CrossRef] [Green Version]
  14. Cambardella, C.A.; Elliott, E.T. Particulate Soil Organic-Matter Changes across a Grassland Cultivation Sequence. Soil Sci. Soc. Am. J. 1992, 56, 777–783. [Google Scholar] [CrossRef]
  15. Shanmugam, S.G.; Buehring, N.W.; Prevost, J.D.; Kingery, W.L. Soil Bacterial Community Diversity and Composition as Affected by Tillage Intensity Treatments in Corn-Soybean Production Systems. Microbiol. Res. Int. 2021, 12, 157–172. [Google Scholar] [CrossRef]
  16. Shah, A.N.; Tanveer, M.; Shahzad, B.; Yang, G.; Fahad, S.; Ali, S.; Bukhari, M.A.; Tung, S.A.; Hafeez, A.; Souliyanonh, B. Soil Compaction Effects on Soil Health and Cropproductivity: An Overview. Environ. Sci. Pollut. Res. 2017, 24, 10056–10067. [Google Scholar] [CrossRef] [PubMed]
  17. Acharya, B.S.; Dodla, S.; Gaston, L.A.; Darapuneni, M.; Wang, J.J.; Sepat, S.; Bohara, H. Winter Cover Crops Effect on Soil Moisture and Soybean Growth and Yield under Different Tillage Systems. Soil Tillage Res. 2019, 195, 104430. [Google Scholar] [CrossRef]
  18. Pietikäinen, J.; Pettersson, M.; Bååth, E. Comparison of Temperature Effects on Soil Respiration and Bacterial and Fungal Growth Rates. FEMS Microbiol. Ecol. 2005, 52, 49–58. [Google Scholar] [CrossRef]
  19. Young, I.M.; Ritz, K. Tillage, Habitat Space and Function of Soil Microbes. Soil Tillage Res. 2000, 53, 201–213. [Google Scholar] [CrossRef]
  20. Smith, C.R.; Blair, P.L.; Boyd, C.; Cody, B.; Hazel, A.; Hedrick, A.; Kathuria, H.; Khurana, P.; Kramer, B.; Muterspaw, K.; et al. Microbial Community Responses to Soil Tillage and Crop Rotation in a Corn/Soybean Agroecosystem. Ecol. Evol. 2016, 6, 8075–8084. [Google Scholar] [CrossRef]
  21. Van Eerd, L.L.; Congreves, K.A.; Hayes, A.; Verhallen, A.; Hooker, D.C. Long-Term Tillage and Crop Rotation Effects on Soil Quality, Organic Carbon, and Total Nitrogen. Can. J. Soil Sci. 2014, 94, 303–315. [Google Scholar] [CrossRef]
  22. McDaniel, M.D.; Tiemann, L.K.; Grandy, A.S. Does Agricultural Crop Diversity Enhance Soil Microbial Biomass and Organic Matter Dynamics? A Meta-Analysis. Ecol. Appl. 2014, 24, 560–570. [Google Scholar] [CrossRef] [PubMed] [Green Version]
  23. Mondal, S.; Mishra, J.S.; Poonia, S.P.; Kumar, R.; Dubey, R.; Kumar, S.; Verma, M.; Rao, K.K.; Ahmed, A.; Dwivedi, S.; et al. Can Yield, Soil C and Aggregation Be Improved under Long-Term Conservation Agriculture in the Eastern Indo-Gangetic Plain of India? Eur. J. Soil Sci. 2021, 72, 1742–1761. [Google Scholar] [CrossRef]
  24. Hartman, K.; van der Heijden, M.G.A.; Wittwer, R.A.; Banerjee, S.; Walser, J.-C.; Schlaeppi, K. Cropping Practices Manipulate Abundance Patterns of Root and Soil Microbiome Members Paving the Way to Smart Farming. Microbiome 2018, 6, 14. [Google Scholar] [CrossRef]
  25. Sun, R.; Li, W.; Dong, W.; Tian, Y.; Hu, C.; Liu, B. Tillage Changes Vertical Distribution of Soil Bacterial and Fungal Communities. Front. Microbiol. 2018, 9, 699. [Google Scholar] [CrossRef] [PubMed]
  26. Zhang, P.; Sun, J.; Li, L.; Wang, X.; Li, X.; Qu, J. Effect of Soybean and Maize Rotation on Soil Microbial Community Structure. Agronomy 2019, 9, 42. [Google Scholar] [CrossRef] [Green Version]
  27. Kodadinne Narayana, N.; Kingery, W.L.; Shankle, M.W.; Ganapathi Shanmugam, S. Differential Response of Soil Microbial Diversity and Community Composition Influenced by Cover Crops and Fertilizer Treatments in a Dryland Soybean Production System. Agronomy 2022, 12, 618. [Google Scholar] [CrossRef]
  28. Hannula, S.E.; Di Lonardo, D.P.; Christensen, B.T.; Crotty, F.V.; Elsen, A.; van Erp, P.J.; Hansen, E.M.; Rubæk, G.H.; Tits, M.; Toth, Z.; et al. Inconsistent Effects of Agricultural Practices on Soil Fungal Communities across 12 European Long-Term Experiments. Eur. J. Soil Sci. 2021, 72, 1902–1923. [Google Scholar] [CrossRef]
  29. Grenada Series. Grenada Silt Loam Official Soil Series Description. National Cooperative Soil Survey Official Series Description. Available online: https://soilseries.sc.egov.usda.gov/OSD_Docs/G/GRENADA.html. (accessed on 6 September 2022).
  30. NOAA. Climate Normals. National Centers for Environmental Information. Available online: https://www.ncdc.noaa.gov/data-access/land-based-station-data/land-based-datasets/climate-normals/1981-2010-normals-data. (accessed on 6 September 2022).
  31. Jacobs, A.; Barrett, R.; Williams, M.; Garner, E.R. A Tool for Selecting Cover Crops for Row Crop Rotations in the Southeast. Available online: https://www.nrcs.usda.gov/wps/portal/nrcs/detail/plantmaterials/home/?cid=nrcseprd1340654. (accessed on 26 September 2022).
  32. Jacobs, A.A.; Evans, R.S.; Allison, J.K.; Garner, E.R.; Kingery, W.L.; McCulley, R.L. Cover Crops and No-Tillage Reduce Crop Production Costs and Soil Loss, Compensating for Lack of Short-Term Soil Quality Improvement in a Maize and Soybean Production System. Soil Tillage Res. 2022, 218, 105310. [Google Scholar] [CrossRef]
  33. Caporaso, J.; Lauber, C.; Walters, W.; Berg-Lyons, D.; Lozupone, C.; Turnbaugh, P.; Fierer, N.; Knight, R. Global Patterns of 16S RRNA Diversity at a Depth of Millions of Sequences per Sample. Proc. Natl. Acad. Sci. USA 2011, 108, 4516–4522. [Google Scholar] [CrossRef]
  34. Orgiazzi, A.; Lumini, E.; Nilsson, R.H.; Girlanda, M.; Vizzini, A.; Bonfante, P.; Bianciotto, V. Unravelling Soil Fungal Communities from Different Mediterranean Land-Use Backgrounds. PLoS ONE 2012, 7, e34847. [Google Scholar] [CrossRef] [PubMed]
  35. Bolyen, E.; Rideout, J.R.; Dillon, M.R.; Bokulich, N.A.; Abnet, C.C.; Al-Ghalith, G.A.; Alexander, H.; Alm, E.J.; Arumugam, M.; Asnicar, F.; et al. Reproducible, Interactive, Scalable and Extensible Microbiome Data Science Using QIIME 2. Nat. Biotechnol. 2019, 37, 852–857. [Google Scholar] [CrossRef]
  36. Callahan, B.J.; Sankaran, K.; Fukuyama, J.A.; McMurdie, P.J.; Holmes, S.P. Bioconductor Workflow for Microbiome Data Analysis: From Raw Reads to Community Analyses 2016. F1000Research 2016, 5, 1492. [Google Scholar] [CrossRef] [PubMed]
  37. Dhariwal, A.; Chong, J.; Habib, S.; King, I.L.; Agellon, L.B.; Xia, J. MicrobiomeAnalyst: A Web-Based Tool for Comprehensive Statistical, Visual and Meta-Analysis of Microbiome Data. Nucleic Acids Res. 2017, 45, W180–W188. [Google Scholar] [CrossRef] [PubMed]
  38. Chong, J.; Liu, P.; Zhou, G.; Xia, J. Using MicrobiomeAnalyst for Comprehensive Statistical, Functional, and Meta-Analysis of Microbiome Data. Nat. Protoc. 2020, 15, 799–821. [Google Scholar] [CrossRef] [PubMed]
  39. Sikora, F.J.; Kissel, D.E. Soil pH. In Soil Test Methods from the Southeastern United States; Sikora, F.J., Moore, K.P., Eds.; University of Georgia: Athens, GA, USA, 2014; p. 48. [Google Scholar]
  40. Wang, J.J.; Provin, T.; Zhang, H. Measurement of Soil Salinity and Sodicity. In Soil Test Methods from the Southeastern United States; Sikora, F.J., Moore, K.P., Eds.; University of Georgia: Athens, GA, USA, 2014; p. 185. [Google Scholar]
  41. Zhang, H.; Hardy, D.H.; Mylavarapu, R.; Wang, J.J. Mehlich-3. In Soil Test Methods from the Southeastern United States; Sikora, F.J., Moore, K.P., Eds.; University of Georgia: Athens, GA, USA, 2014; p. 101. [Google Scholar]
  42. Zhang, H.; Wang, J.J. Loss on Ignition. In Soil Test Methods from the Southeastern United States; Sikora, F.J., Moore, K.P., Eds.; University of Georgia: Athens, GA, USA, 2014; p. 155. [Google Scholar]
  43. Barnhisel, R.I.; Bertsch, P.M. Chlorites and Hydroxy-Interlayered Vermiculite and Smectite. In Minerals in Soil Environments; Soil Science Society of America Inc.: Madison, WI, USA, 1989; pp. 729–788. [Google Scholar]
  44. Jensen, J.L.; Christensen, B.T.; Schjønning, P.; Watts, C.W.; Munkholm, L.J. Converting Loss-on-Ignition to Organic Carbon Content in Arable Topsoil: Pitfalls and Proposed Procedure. Eur. J. Soil Sci. 2018, 69, 604–612. [Google Scholar] [CrossRef] [PubMed] [Green Version]
  45. Lynn, W.C.; Ahrens, R.J.; Smith, A.L. Soil Minerals, Their Geographic Distribution, and Soil Taxonomy. In Soil Mineralogy with Environmental Applications; Soil Science Society of America Inc.: Madison, WI, USA, 2002; pp. 691–709. [Google Scholar]
  46. Huluka, G.; Miller, R. Particle Size Determination by Hydrometer Method. In Soil Test Methods from the Southeastern United States; Sikora, F.J., Moore, K.P., Eds.; University of Georgia: Athens, GA, USA, 2014; pp. 180–184. [Google Scholar]
  47. Blaud, A.; Menon, M.; van der Zaan, B.; Lair, G.J.; Banwart, S.A. Effects of Dry and Wet Sieving of Soil on Identification and Interpretation of Microbial Community Composition. In Advances in Agronomy; Banwart, S.A., Sparks, D.L., Eds.; Academic Press: Cambridge, MA, USA, 2017; Volume 142, pp. 119–142. [Google Scholar]
  48. He, Y.; Zhou, B.-J.; Deng, G.-H.; Jiang, X.-T.; Zhang, H.; Zhou, H.-W. Comparison of Microbial Diversity Determined with the Same Variable Tag Sequence Extracted from Two Different PCR Amplicons. BMC Microbiol. 2013, 13, 208. [Google Scholar] [CrossRef] [Green Version]
  49. Lupwayi, N.Z.; Clayton, G.W.; O’Donovan, J.T.; Harker, K.N.; Turkington, T.K.; Rice, W.A. Soil Microbiological Properties during Decomposition of Crop Residues under Conventional and Zero Tillage. Can. J. Soil. Sci. 2004, 84, 411–419. [Google Scholar] [CrossRef]
  50. Wipf, H.M.-L.; Xu, L.; Gao, C.; Spinner, H.B.; Taylor, J.; Lemaux, P.; Mitchell, J.; Coleman-Derr, D. Agricultural Soil Management Practices Differentially Shape the Bacterial and Fungal Microbiomes of Sorghum Bicolor. Appl. Environ. Microbiol. 2021, 87, e02345-20. [Google Scholar] [CrossRef]
  51. Navarro-Noya, Y.E.; Gómez-Acata, S.; Montoya-Ciriaco, N.; Rojas-Valdez, A.; Suárez-Arriaga, M.C.; Valenzuela-Encinas, C.; Jiménez-Bueno, N.; Verhulst, N.; Govaerts, B.; Dendooven, L. Relative Impacts of Tillage, Residue Management and Crop-Rotation on Soil Bacterial Communities in a Semi-Arid Agroecosystem. Soil Biol. Biochem. 2013, 65, 86–95. [Google Scholar] [CrossRef]
  52. Schmidt, R.; Gravuer, K.; Bossange, A.V.; Mitchell, J.; Scow, K. Long-Term Use of Cover Crops and No-till Shift Soil Microbial Community Life Strategies in Agricultural Soil. PLoS ONE 2018, 13, e0192953. [Google Scholar] [CrossRef] [PubMed]
  53. Cloutier, M.L.; Murrell, E.; Barbercheck, M.; Kaye, J.; Finney, D.; García-González, I.; Bruns, M.A. Fungal Community Shifts in Soils with Varied Cover Crop Treatments and Edaphic Properties. Sci. Rep. 2020, 10, 6198. [Google Scholar] [CrossRef] [Green Version]
  54. Madegwa, Y.M.; Uchida, Y. Land Use and Season Drive Changes in Soil Microbial Communities and Related Functions in Agricultural Soils. Environ. DNA 2021, 3, 1214–1228. [Google Scholar] [CrossRef]
  55. Broeckling, C.D.; Broz, A.K.; Bergelson, J.; Manter, D.K.; Vivanco, J.M. Root Exudates Regulate Soil Fungal Community Composition and Diversity. Appl. Environ. Microbiol. 2008, 74, 738–744. [Google Scholar] [CrossRef] [PubMed] [Green Version]
  56. Haichar, F.e.Z.; Marol, C.; Berge, O.; Rangel-Castro, J.I.; Prosser, J.I.; Balesdent, J.; Heulin, T.; Achouak, W. Plant Host Habitat and Root Exudates Shape Soil Bacterial Community Structure. ISME J. 2008, 2, 1221–1230. [Google Scholar] [CrossRef] [PubMed]
  57. Benitez, M.-S.; Ewing, P.M.; Osborne, S.L.; Lehman, R.M. Rhizosphere Microbial Communities Explain Positive Effects of Diverse Crop Rotations on Maize and Soybean Performance. Soil Biol. Biochem. 2021, 159, 108309. [Google Scholar] [CrossRef]
  58. Ritz, K.; Young, I.M. Interactions between Soil Structure and Fungi. Mycologist 2004, 18, 52–59. [Google Scholar] [CrossRef] [Green Version]
  59. Schlatter, D.C.; Kahl, K.; Carlson, B.; Huggins, D.R.; Paulitz, T. Fungal Community Composition and Diversity Vary with Soil Depth and Landscape Position in a No-till Wheat-Based Cropping System. FEMS Microbiol. Ecol. 2018, 94, fiy098. [Google Scholar] [CrossRef] [Green Version]
  60. Wang, Z.; Liu, L.; Chen, Q.; Wen, X.; Liao, Y. Conservation Tillage Increases Soil Bacterial Diversity in the Dryland of Northern China. Agron. Sustain. Dev. 2016, 36, 28. [Google Scholar] [CrossRef] [Green Version]
  61. Lozupone, C.; Knight, R. UniFrac: A New Phylogenetic Method for Comparing Microbial Communities. Appl. Environ. Microbiol. 2005, 71, 8228–8235. [Google Scholar] [CrossRef]
  62. Lozupone, C.A.; Hamady, M.; Kelley, S.T.; Knight, R. Quantitative and Qualitative β Diversity Measures Lead to Different Insights into Factors That Structure Microbial Communities. Appl. Environ. Microbiol. 2007, 73, 1576–1585. [Google Scholar] [CrossRef] [PubMed] [Green Version]
  63. Song, X.; Tao, B.; Guo, J.; Li, J.; Chen, G. Changes in the Microbial Community Structure and Soil Chemical Properties of Vertisols Under Different Cropping Systems in Northern China. Front. Environ. Sci. 2018, 6, 132. [Google Scholar] [CrossRef] [Green Version]
  64. Thomas, G.A.; Dalal, R.C.; Standley, J. No-till Effects on Organic Matter, PH, Cation Exchange Capacity and Nutrient Distribution in a Luvisol in the Semi-Arid Subtropics. Soil Tillage Res. 2007, 94, 295–304. [Google Scholar] [CrossRef]
  65. López-Fando, C.; Pardo, M.T. Changes in Soil Chemical Characteristics with Different Tillage Practices in a Semi-Arid Environment. Soil Tillage Res. 2009, 104, 278–284. [Google Scholar] [CrossRef]
  66. Li, Y.; Li, Z.; Cui, S.; Zhang, Q. Trade-off between Soil PH, Bulk Density and Other Soil Physical Properties under Global No-Tillage Agriculture. Geoderma 2020, 361, 114099. [Google Scholar] [CrossRef]
  67. Vukicevich, E.; Lowery, T.; Bowen, P.; Úrbez-Torres, J.R.; Hart, M. Cover Crops to Increase Soil Microbial Diversity and Mitigate Decline in Perennial Agriculture. A Review. Agron. Sustain. Dev. 2016, 36, 48. [Google Scholar] [CrossRef] [Green Version]
  68. Ullah, S.; Ai, C.; Ding, W.; Jiang, R.; Zhao, S.; Zhang, J.; Zhou, W.; Hou, Y.; He, P. The Response of Soil Fungal Diversity and Community Composition to Long-Term Fertilization. Appl. Soil Ecol. 2019, 140, 35–41. [Google Scholar] [CrossRef]
  69. Rousk, J.; Brookes, P.C.; Bååth, E. Contrasting Soil PH Effects on Fungal and Bacterial Growth Suggest Functional Redundancy in Carbon Mineralization. Appl. Environ. Microbiol. 2009, 75, 1589–1596. [Google Scholar] [CrossRef] [Green Version]
  70. Tedersoo, L.; Bahram, M.; Põlme, S.; Kõljalg, U.; Yorou, N.S.; Wijesundera, R.; Ruiz, L.V.; Vasco-Palacios, A.M.; Thu, P.Q.; Suija, A.; et al. Global Diversity and Geography of Soil Fungi. Science 2014, 346, 1256688. [Google Scholar] [CrossRef] [Green Version]
  71. Kemmitt, S.J.; Lanyon, C.V.; Waite, I.S.; Wen, Q.; Addiscott, T.M.; Bird, N.R.A.; O’Donnell, A.G.; Brookes, P.C. Mineralization of Native Soil Organic Matter Is Not Regulated by the Size, Activity or Composition of the Soil Microbial Biomass—A New Perspective. Soil Biol. Biochem. 2008, 40, 61–73. [Google Scholar] [CrossRef]
Figure 1. Principial coordinate analysis (PCoA) plot depicting the Bray–Curtis (a,c) and weighted UniFrac distance matrix (b,d) of bacterial (a,b) and fungal (c,d) communities under combination of crop rotation, tillage practice and winter cover management systems. (CT-B: Conventional Tillage-Bare fallow; CT-CC: Conventional Tillage-Cover Crop; CT-WW: Conventional Tillage-Winter Weeds; NT-B: No-tillage- Bare fallow; NT-CC: No-tillage-Cover Crop; NT-WW: No-tillage-Winter Weeds).
Land 11 02259 g001
Figure 2. Pattern correlation and heat map analysis of fungal phyla across different management systems. Bars indicate the correlation coefficients of the different phyla which are ranked by correlation and to the right, heatmap showing levels of abundance (red-higher; blue-lower) in each system. (CT-B: Conventional Tillage-Bare fallow; CT-CC: Conventional Tillage-Cover Crop; CT-WW: Conventional Tillage-Winter Weeds; NT-B: No-tillage- Bare fallow; NT-CC: No-tillage-Cover Crop; NT-WW: No-tillage-Winter Weeds).
Land 11 02259 g002
Figure 3. The distance based canonical correspondence analysis (CCA) illustrating the influence of soil properties on fungal communities (estimated using ASV’s). Soil properties are labelled in blue and treatments are in different colors. Lengths of each arrow/vector indicates the correlation. CT-B: Conventional Tillage-Bare fallow; CT-CC: Conventional Tillage-Cover Crop; CT-WW: Conventional Tillage-Winter Weeds; NT-B: No-tillage-Bare fallow; NT-CC: No-tillage-Cover Crop; NT-WW: No-tillage-Winter Weeds.
Land 11 02259 g003
Figure 4. The distance based canonical correspondence analysis (CCA) showing the distribution of soil fungal communities (performed using fungal relative abundances) and soil characteristics in the different tillage and cover management systems. Soil properties and fungal phyla are labelled in blue and treatments are in black color. CT-B: Conventional Tillage-Bare fallow; CT-CC: Conventional Tillage-Cover Crop; CT-WW: Conventional Tillage-Winter weeds; NT-B: No-tillage- Bare fallow; NT-CC: No-tillage-Cover Crop; NT-WW: No-tillage-Winter Weeds.
Land 11 02259 g004
Figure 5. Variation partition analysis of the effects of different management systems and soil variables on the fungal community structure.
Land 11 02259 g005
Table 1. Soil bacterial and fungal alpha diversity indices under combination of crop rotation, tillage practice and winter cover management systems.
Bacterial Alpha Diversity Indices
TreatmentsShannonRichness (Chao1)
CT-B4.14 (0.18)78.41 (13.79)
CT-CC3.89 (0.60)71.91 (47.63)
CT-WW4.25 (0.34)90.01 (31.04)
NT-B4.40 (0.36)108.03 (39.83)
NT-CC3.82 (0.19)53.33 (11.23)
NT-WW4.14 (0.20)77.33 (15.04)
p-value0.290.32
Fungal Alpha Diversity Indices
CT-B3.33 (0.47)117.66 (9.38)
CT-CC4.06 (0.19)140.09 (20.14)
CT-WW3.48 (0.86)113.92 (25.12)
NT-B3.71 (0.34)115.34 (10.55)
NT-CC3.52 (0.87)129.03 (13.71)
NT-WW4.07 (0.15)132.21 (10.95)
p-value0.370.30
Note: Mean value followed by standard deviation in parenthesis. (Significance level: p = 0.05) (CT-B: Conventional Tillage-Bare fallow; CT-CC: Conventional Tillage-Cover Crop; CT-WW: Conventional Tillage-Winter Weeds; NT-B: No-tillage- Bare fallow; NT-CC: No-tillage-Cover Crop; NT-WW: No-tillage-Winter Weeds).
Table 2. Relative abundance of fungal phyla (obtained from the biom table) in the combination of crop rotation, tillage practice and winter cover management systems.
TreatmentsAscomycota
(%)
Basidiomycota
(%)
Mortierellomycota
(%)
Chytridiomycota
(%)
Glomeromycota
(%)
CT-B39.50 (6.36) d44.23 (11.99)10.23 (4.93) ab1.38 (0.84)0.37 (0.29)
CT-CC62.82 (4.91) bc21.88 (2.92)5.99 (1.47) bc3.77 (1.03)0.36 (0.15)
CT-WW48.06 (21.15) cd29.72 (30.62)13.90 (4.95) a2.89 (2.15)0.61 (0.54)
NT-B71.90 (1.42) ab11.86 (5.37)4.82 (2.74) bc2.42 (1.23)1.13 (0.59)
NT-CC84.08 (2.27) a7.13 (1.61)2.83 (0.94) c1.87 (0.57)0.66 (0.68)
NT-WW66.59 (2.40) b12.14 (0.99)6.70 (1.58) bc6.08 (3.00)1.36 (0.56)
p-value<0.001 ***0.05 *0.013 *0.0560.171
Note: mean value followed by standard deviation in parenthesis. Tukey’s HSD test at p = 0.05. (Significance level: * p < 0.05, *** p < 0.001) (CT-B: Conventional Tillage-Bare fallow; CT-CC: Conventional Tillage-Cover Crop; CT-WW: Conventional Tillage-Winter Weeds; NT-B: No-tillage-Bare fallow; NT-CC: No-tillage-Cover Crop; NT-WW: No-tillage-Winter Weeds).
Table 3. Effect of tillage and winter cover management systems on soil physiochemical properties.
Treatment
Systems
pHEC
(dS/cm)
Total C
(%)
P
(mg/kg)
K
(mg/kg)
Zn
(mg/kg)
Sand
(%)
Silt
(%)
Clay
(%)
Bulk Density
(g cm−3)
Agg. Size 100 Mesh (g/g)Agg. Size 100 Mesh (g/g)Agg. Size 100 Mesh (g/g)
CT-B6.3 (0.6) a0.3 (0.1)0.5 (0.3)21.0 (7.0)69.8 (22.2)1.3 (0.4)24 (7)59 (5)17 (3)1.26 (0.07) bc5.00 (1.23)1.40 (0.28)2.45 (0.53)
CT-CC6.0 (0.3) ab0.2 (0.1)0.5 (0.1)22.0 (2.9)62.3 (12.11.3 (0.2)16 (8)67 (4)18 (3)1.20 (0.03) c6.40 (1.72)1.15 (0.34)2.30 (0.62)
CT-WW6.2 (0.6) a0.3 (0.1)0.4 (0.0)19.5 (3.0)68.5 (8.4)1.2 (0.2)25 (10)58 (9)18 (2)1.30 (0.06) bc5.10 (0.26)1.15 (0.34)2.20 (0.33)
NT-B6.0 (0.3) ab0.3 (0.1)0.4 (0.0)23.5 (2.6)62.8 (14.8)1.4 (0.3)15 (5)67 (5)19 (1)1.43 (0.04) a5.30 (1.29)1.10 (0.26)2.30 (0.20)
NT-CC5.8 (0.4) b0.2 (0.1)0.6 (0.1)19.5 (3.1)57.8 (4.3)1.3 (0.2)23 (13)59 (11)19 (2)1.36 (0.07) ab4.90 (0.35)1.60 (0.37)2.70 (0.26)
NT-WW6.2 (0.3) ab0.3 (0.1)0.5 (0.1)23.0 (5.6)70.5 (26.4)1.2 (0.3)16 (4)67 (4)18 (2)1.46 (0.09) a5.45 (0.96)1.25 (0.34)2.50 (0.20)
p-value0.005 **0.4750.1670.4260.8210.7670.3550.2090.934<0.001 ***0.3190.3230.314
Note: mean value followed by standard deviation in parenthesis. Tukey’s HSD test at p = 0.05. (Significance level: ** p < 0.01, *** p < 0.001). (CT-B: Conventional Tillage-Bare fallow; CT-CC: Conventional Tillage-Cover Crop; CT-WW: Conventional Tillage-Winter Weeds; NT-B: No-tillage-Bare fallow; NT-CC: No-tillage-Cover Crop; NT-WW: No-tillage-Winter Weeds).
Table 4. Correlation analysis between soil characteristics and fungal communities using the Mantel test.
pHECCPKZnBulk DensityAggregate Stability
R0.336−0.1410.179−0.001−0.0530.0410.032−0.071
p value0.014 *0.3010.3330.9890.6670.6830.7190.633
Abbreviations: EC = Electrical Conductivity; C = total carbon; N = total nitrogen; P = Phosphorus; K = Potassium; Zn = Zinc. * p < 0.05.
Publisher’s Note: MDPI stays neutral with regard to jurisdictional claims in published maps and institutional affiliations.

