Article

Can Cooperative Supports and Adoption of Improved Technologies Help Increase Agricultural Income? Evidence from a Recent Study

1
College of Management, Sichuan Agricultural University, Chengdu 611100, China
2
College of Agriculture and Human Sciences, Prairie View A&M University, Prairie View, TX 77446, USA
3
Department of Agricultural Extension and Rural Society, King Saud University, Riyadh 11451, Saudi Arabia
4
College of Landscape Architecture, Sichuan Agricultural University, Chengdu 611130, China
5
Department of Agricultural Extension, PMAS-Arid Agriculture University, Rawalpindi 46000, Pakistan
*
Author to whom correspondence should be addressed.
Submission received: 30 January 2022 / Revised: 25 February 2022 / Accepted: 26 February 2022 / Published: 1 March 2022
(This article belongs to the Special Issue Agricultural Land Use, Economics and Climate Change)

Abstract

:
Global climate change may result in major environmental issues that have already affected and will continue to affect agricultural sector in the future. A continuing effort to utilize and adopt new agricultural technologies is necessary to mitigate climate change and increase agricultural income. Agricultural cooperatives are gradually being used in emerging countries to encourage improved technology and reduce food insecurity and poverty. This research analyses the influence of cooperative supports (CS) and technology adoption (TA) on agricultural income in Pakistan. It applied the propensity score matching (PSM) technique to evaluate the productivity on survey data from 498 wheat growers to conduct counterfactual analysis for farmers in Pakistan. In addition, a dual selection model (DSM) was applied to resolve the bias in sample selection caused by observed and unobserved aspects of survey data. The results showed that, contrasted with non-membership and non-adopters, growers who joined CS and TA could boost agricultural income by 2.78% and 2.35%, respectively. Stimulatingly, the influence of less-revenue farmers on agricultural income was more substantial than that of high-income farmers. Agricultural income of growers who attached cooperatives and adopted improved agricultural technology enhanced by 5.45% and 4.51%, respectively. These results, among others, emphasize the optimistic role of growing CS and TA in boosting wheat farmer’s income. The findings of the study showed strong relationships among education, age, skill, training, gender with CS and TA, and agricultural income. Overall, this study can be helpful in conducting similar studies in other emerging/developing countries for wheat or any other crop growers.

1. Introduction

Sustainable food production and food security are major issues of the 21st century under a changing climate because the agriculture sector is most vulnerable to climate change [1,2]. Climate change is already affecting agricultural production and food security and will continue to affect it in the future, especially in developing countries [3,4,5]. Climate change, the environment, food production, and food security [6] are strongly interlinked, which requires advanced technologies and approaches to minimize the impact of climate change and the environment on agriculture from a local to global scale. While farmers of developed countries have started to practice smart climate agriculture, precision agriculture, and smart farming [7], the farmers of developing countries are still moving along with traditional farming practices. It is essential to develop modern agricultural practices and technologies to mitigate the effect of climate change on agricultural production.
Moreover, it requires climate-smart agriculture (CSA) practices because the CSA can respond to climate change and enhance the livelihood of farmers [8]. On the other hand, the CSA require implementing smart technologies and tools. Moreover, traditional agricultural research and extension rely on replicated field experiments but lacks widespread adoption of technologies [9], which might help reduce the impact of climate change on agricultural production.
According to Sardar et al. [10] and Sardar et al. [11], the agricultural sector of developing countries is more vulnerable to climate change because of lower adoption. Therefore, enhancing extension services and access to climate information and climate-smart practices, which require adopting technologies, will help improve the agricultural sector [12]. Agricultural cooperative support is important for a sustainable agricultural system to boost farms, associated farmers, and overall rural societies [13]. For example, in recent years, China witnessed a boom in the formation of agricultural cooperatives. Both agricultural service cooperatives and agricultural production cooperatives exist in China [14]. Results showed that agricultural cooperatives play a major role in agricultural development in China; however, they need government support. The agricultural cooperative in Russia started a decade before 1929, and farmers and producers benefited from it on their farm services [15].
Several researchers have investigated the status and benefits of agricultural cooperatives in different countries globally, such as in Romania [16], Senegal [17], Iran [18], China [19]; Spain [20], Uganda [21], Uzbekistan [22], Greece [23], France [24], Ethiopia [25], Turkey [26], and others. The primary objective of each study in a different country was to explore the benefits of the agricultural cooperative to enhance agricultural production and food security. It was found that the agricultural cooperative helped its members in the production, processing, and marketing of agricultural products.
Various analyses have indicated that higher education, farmland size, access to credit, social capital, access to extension, and market constraints can affect participating in the agricultural cooperative. For example, Dung [27] evaluated the farmer’s participating behaviour in agricultural cooperatives in Vietnam. They found that farmers are more likely to participate in agricultural cooperatives when they have more favourable resources, higher education level, access to extension, etc. Ankrah Twumasi et al. [28] conducted a similar study in Ghana. They found that the household head’s decision to join agricultural cooperatives is affected by their access to credit, off-farm work, education level, and peer influence. Ma and Abdulai [29] assessed the influence of agricultural cooperative membership on farmer’s choices to implement integrated pest management technology in China. They found that the farmer’s decision on participating in an agricultural cooperative significantly depends on farmer and farm characteristics, such as education and farm size.
According to Manda et al. [30], empirical evidence suggests that cooperative membership is highly linked with the adoption of agricultural technologies in developing countries. A study conducted by Abebaw et al. [31] in Ethiopia suggests that agricultural cooperative service can play an essential role in accelerating the adoption of agricultural technologies by smallholders. Moreover, Zhang et al. [32] also found a positive effect of cooperative membership on technology adoption. Modern technologies play a significant role in enhancing agricultural production that, in turn, help reduce poverty and increase farmer’s income [33,34,35,36,37,38,39].
While these findings are crucial to understanding the relationship between agricultural cooperative service and adoption of agricultural technology, it is rather important to conduct similar studies in a different country because several critical factors impact the decision of farmers to adopt agricultural technology. The age of farmers, education level, gender, farm size, access to extension, government support, geographical location, climatic conditions, and agricultural practices are important parameters that vary spatially.
Increasing income, improving productivity, and reducing poverty are important issues for farmers’ economic welfare under a changing climate [36]. These issues are noteworthy, especially in emerging nations, including Pakistan. According to the labour force survey description (2017–2018) performed by the bureau statistics of Pakistan, 39% labour force of the country is involved in the agricultural sector (30.2% males and 67.2% females) [40]. In the past few decades, the government has reduced poverty and enhanced agriculture productivity. According to the multidimensional poverty index (MPI), about a quarter (~24%) population of the county lives below the national poverty line, and 39.0% is under poverty [41]. Although many factors may influence poverty reduction in Pakistan, researchers and policymakers believe that farmer’s cooperatives and agricultural extension services are essential organizations that can help reduce poverty in rural areas.
Moreover, the cooperative supports (CS) and technology adoption (TA) support 3 out of 17 Sustainable Development Goals (SDGs) proposed by the United Nations (UN) General Assembly in September 2015 adopted for 2030 Agenda for sustainable development. The three SDGs are (i) ending poverty, (ii) ending hunger, achieving food security, improving nutrition, and promoting sustainable agriculture, and (iii) ensuring sustainable consumption and production patterns. Indeed, the CS and TA could directly help increase farmer’s income and agricultural production and support the listed three SDGs in the long run.
Previous studies focused on investigating the influence of CS and TA on the prosperity of smallholders. They found that farmer’s cooperatives could help smallholders to increase their trading and transaction power [42,43], decrease business expenses and information asymmetry [44], and increase their TA rates [45]. Parenthetically, farmers could join agricultural cooperatives and adopt the latest technologies to boost their income and agricultural productivity [34,36,46], reduce their poverty [39,47], and adapt their agricultural system to climate change [3]. They also reported that improved farming technology could increase farmer’s income [48]. Some studies reported that modern technology primarily improves agricultural yield by boosting farming income, thus, directly or indirectly enhancing farmer’s income levels [35,49]. Previous studies also showed non-cooperative farmers could benefit directly or indirectly when the skilled and technology-adopting farmers share the advantage of being cooperative members with the non-cooperative farmers [50,51]. Agricultural TA can help decrease poverty by expanding non-agricultural services for low-income farmers and reducing the farmer’s expenditure levels [48,52].
This article aims to evaluate the influence of CS and TA to help increase the income of wheat growers. This research emphasizes the economic well-being of wheat growers through assessments of agricultural income. This study used counterfactual analysis to calculate the extent to which these decisions can increase agricultural benefits, mainly focusing on low-return growers. Notably, the mechanisms by which technology affects farmer’s economic welfare are diverse because of the availability of variety in agricultural technology. In developing countries, the rapid rise in the prices of agricultural products is becoming an important reason for the weakening of their global competitiveness in the agricultural sector [34,53]. Numerous researchers suggested that it is critical to resolve the high cost of agricultural production by adopting affordable agricultural technology, which helps mitigate climate change and protect the environment [1,54]. Further, modern technology helps growers decrease production costs significantly, improve farming production efficacy, and decrease labour force inputs effectively [55,56,57,58,59]. Hence, this study emphasized using improved agricultural TA (such as seed and fertilizers) that epitomize increased agricultural income.
The remainder of this article is organized as follows. Section 2 introduces the methodology: empirical procedures, research fields, data collection, variables considered, and analysis procedures. Section 3 details the empirical results of the research, and Section 4 presents conclusions and policy recommendations.

2. Research Methodology

Agricultural CS and TA can affect farm performance by influencing agricultural production, marketing, and incomes. Current empirical research confirmed that the first major pathway is that cooperative support influences agricultural yields and, in turn, directly increases farmer’s income [60,61]. This is because agricultural cooperatives improve farmer’s access to better technology, markets, and agricultural inputs. Past studies have presented that cooperative membership can improve farmer’s access to better agricultural inputs (e.g., fertilizers and pesticides), profitable markets to increase agricultural yields [31,62]. Higher agricultural yields can be achieved not only by increasing the level of better agricultural inputs but also by changing how different inputs are combined and used effectively [61,63].
This paper used the following strategies to study the influence of CS and TA on agricultural income:
(i)
Establish a unified analysis outline to examine the membership of growers in agricultural cooperatives (CS, hereafter described as cooperatives) and adoption of expense-reduction farming technologies (hereafter referred to as TA);
(ii)
Use analytical approaches (PSM and DSM) to correct the selection bias of farmer’s decision-making to attain consistent empirical findings;
(iii)
Study the influence of social capital on farmer’s decision-making.

2.1. Agriculture and Wheat Production in the Research Area

Agriculture is the second largest sector of Pakistan’s economy, and most of the population’s livelihood directly or indirectly depends on agriculture. In addition, in the past few decades, its contribution to gross domestic product (GDP) has gradually declined to 19.3% [64,65,66]. However, incorporating modern agricultural technology to increase agricultural productivity, this sector has great potential to increase its share of national GDP. Wheat is produced throughout Pakistan, including Punjab, Sindh, Balochistan, and Khyber Pakhtunkhwa (KPK) provinces. In this research, KPK province was selected as the study domain. The study domain KPK has favorable climatic conditions for wheat and can produce high-quality wheat [64,65,67,68]. Notably, wheat production mainly relies on rainwater in this study area, and only a small number of growers (about 40% of the study area) use irrigation. Although small numbers of growers plant cash crops, wheat is a dominant crop in the study region. This sector needs farmers’ cooperative support and agricultural technologies adoption, including improved agricultural techniques and practices to support wheat production and agricultural modernization. However, in this study area, the mechanization rate is still relatively low, and this fact poses a challenge to wheat production and agricultural development. Wheat production is affected by insects and pests globally, and Pakistan is no exception. Therefore, growers typically used to replace wheat seeds with fresh seeds after 3–4 years of high yield.

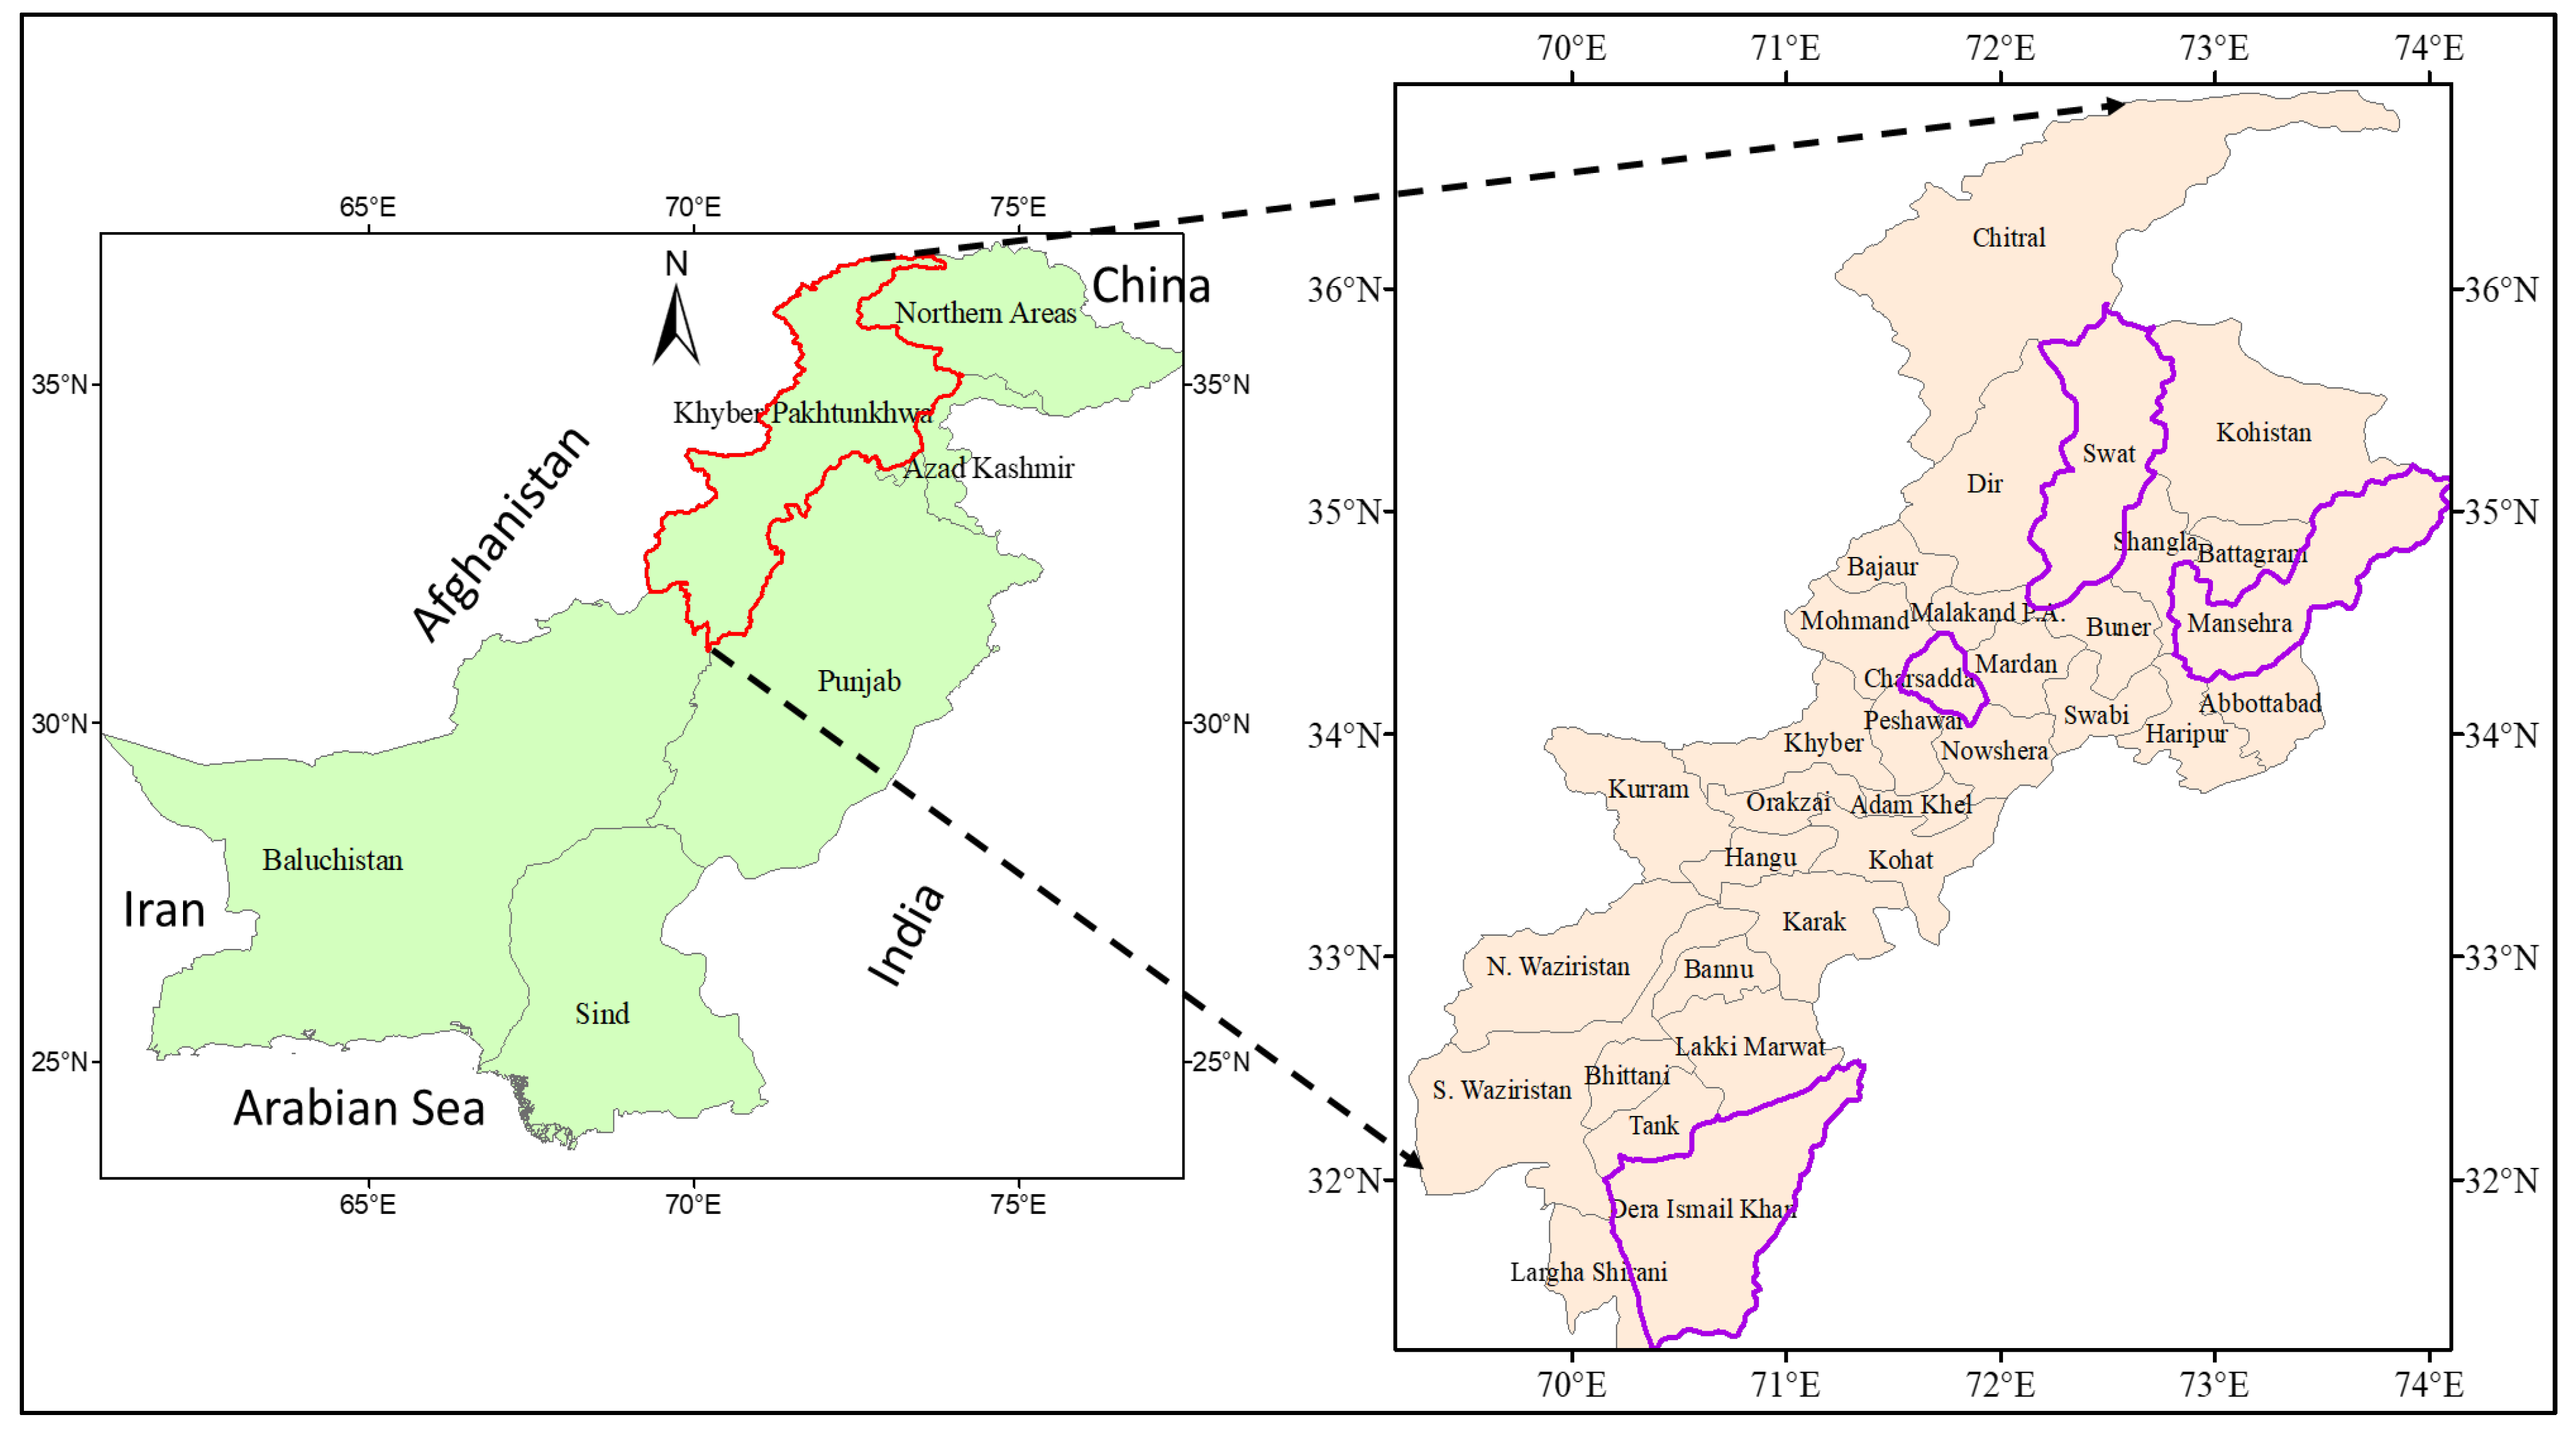
2.2. Study Area Description and Data Collection

The research data were collected in KPK Province, Pakistan, from January to March 2021. Five hundred fifty (550) questionnaires were distributed to the wheat-growers, and a total of 498 questionnaires were considered complete to collect the data needed for this study. Multistage random sampling techniques were used to collect the essential information from wheat growers (face-to-face). Based on the available information on agriculture production in the study area, first, data were collected from four districts (Dera Ismail Khan, Charsadda, Mansehra, and Swat) to help understand current CS and TA by wheat farmers in KPK province (Figure 1 and Table 1). Second, one tehsil was selected to fill out questionnaires, and third, one union council was targeted from each tehsil. Fourth, four villages were focused randomly on each selected union council, and finally, the essential data were collected from wheat growers in the selected villages. The questionnaires used in this study were divided into different sections. The first portion of the organized questionnaire contains the demographic and socio-economic characteristics of the respondents. The rest of the questionnaire aims to obtain information about the CS and TA by wheat growers. The questionnaire was initially written in English and later translated into Urdu (local language) for the ease of the interviewees.
Two decisions of growers from four sub-samples; growers who had CS and adopted agricultural technology, growers who had CS but had not adopted technology, growers who did not have CS but adopted technology, and growers who did neither. Descriptive statistics of the four sets are summarized in Table 2. The four grower groups are allowed to be classified, and the study data meets the requirements of this study. It is more suitable for cooperative research than most prior micro study data only for cooperatives. However, there is specified information regarding the four growers’ groups and their associated growers’ cooperatives, which provides inclusive info for examining the four conditions in which growers make two decisions.

2.3. Empirical Procedure

Based on Pakistan’s KPK province data, a dual selection model (DSM) with modified sample selection bias was utilized to examine the influence of CS and TA on farmer’s agricultural income levels. This study used the propensity score matching (PSM) technique to estimate the income differentials caused by farmer’s choices regarding CS and TA.
All probability statistics need conditional independence; that is, the value of the predictor variable is independently assigned to the dependent variable. For the following reasons, DSM is appropriate for the empirical assessment of this study. Firstly, DSM can appropriately decrease the endogenous selection bias produced via unobserved and observed factors [70]. When farmers make decisions about CS and TA from their heterogeneous selections without contemplating the various info they utilize to make the decision, bias occurs, leading to contradictory assessments [71]. Secondly, DSM can assess dual endogenous choice models simultaneously. These dual choices are associated because grower’s cooperatives are essential for improved agricultural technology expansion, for instance, providing essential advanced farming equipment services [72,73,74]. It is vital to utilize the DSM method to solve the endogenous deviation of the two selections simultaneously. The DSM technique has dual stages: (i) a Bivariate Probit method is utilized to examine the grower’s choices and compute the inverse mills ratio (IMR). (ii) Apply the ordinary least squares (OLS) evaluation technique to analyse the association between the result and descriptive variables series when the selective correction terms IMR are included in the calculation.
Let   y c   a n d   y n c indicate the expected benefits of cooperative support and non-support, correspondingly. If y c * = y c y n c > 0 , wheat growers will participate in farmer’s cooperatives. Let y t   a n d   y n t denote the projected advantages of improved TA and non-adoption, correspondingly. If y t * = y t y n t > 0 , wheat growers will adopt these improved technologies. The net income of wheat growers y c *   a n d   y t * are latent variables.
( Y c * = β c X c + ε c   ) , ( Y t * = β t X t + ε t )
where ε c   a n d   ε t are the random errors of the normal distribution. The mean is equivalent to 0, and the variance is equal to 1. When the two choices of wheat growers are influenced through unobservable factors, the random factors that influence these two choices are not independent, then COV ( ε c , ε t ) = ρ .
Since the net-income y c *   a n d   y t * are unobserved latent variables, the observed wheat grower’s choices are:
D c = { 1   i f   y c * > 0 0   e l s e   y c * 0   D t = { 1   i f   y t * > 0 0   e l s e   y t * 0
Among them, Dc is farmer’s choice on cooperatives membership, and Dt is farmers choice on TA. The two choices lead to four outcomes, and the growers in the full sample could be separated into four subsamples (Table 2) [75,76]. This matching likelihood P00, P01, P10, and P11 of the four subsamples could be articulated as:
P 00 = p r ( D c = 0 , D t = 0 ) = p r ( ε c β c X c , ε t β t X t ) = Φ ( β c X c , β t X t , p )
P 01 = p r ( D c = 0 , D t = 1 ) = p r ( ε c β c X c , ε t > β t X t ) = Φ ( β c X c , β t X t , p )
P 10 = p r ( D c = 1 , D t = 0 ) = p r ( ε c > β c X c , ε t β t X t ) = Φ ( β c X c , β t X t , p )
P 11 = p r ( D c = 1 , D t = 1 ) = p r ( ε c > β c X c , ε t > β t X t ) = Φ ( β c X c , β t X t , p )
where Φ represents the cumulative distribution function of the standard bivariate normal distribution, which is a parallel coefficient ± ρ . In the first stage of DSM’s bivariate probit method assessment, the following probability function could be acquired:
L = s P 1 Φ ( β c X c , β t X t , p ) s P 2 Φ ( β c X c , β t X t , p ) s P 3 Φ ( β c X c , β t X t , p ) s P 4 Φ ( β c X c , β t X t , p )
Increasing this probability function will produce consistent estimates of β c ^ , β t ^ and   ρ ^ . Among them, utilize the outcomes of the bivariate probit model assessment to estimate the IMR λ c ^   and   λ t ^ . The farming income equation for correcting the selection bias is:
Y = a Z + σ c λ ^ c + σ t λ ^ t + ξ
There are two λ ^ terms to fix for binary selection bias. The λ c ^ term modifies the selection bias caused by the participation of wheat farmer’s cooperatives and the λ t ^ term corrects the selection bias caused by the farmer’s adoption of improved agricultural technology.

3. Results and Discussion

3.1. Descriptive and Summary Statistics for Key Variables

Table 3 displays the description and summary statistics of the variables utilized in the research study. The decision variables (DV) utilized in the research are CS and TA. If the family belongs to an agricultural cooperative and adopts the improved technology, the value is 1, if there is no CS and the TA, the value is 0. It can be seen from Table 3 that about 68% of the wheat-growers in the sample belong to agricultural cooperatives. Wheat grower’s average age (A) is close to 48 years. The average distance (MD) between the farm and the market is 7 (km), and about 32% of the growers in the village live in the mountains (VT) area. The average annual agricultural income (AI) of farmers is close to 11% of total investment. Improving agricultural productivity and its income is one of the most important priorities for policymakers. In this regard, it is expected that farmer’s cooperatives play a significant role in attaining good development in this sector. Farmer’s cooperation announcement encourages the establishment and operation of farmer’s cooperatives. Cooperative participation in delivery provides members with different services. These services include disseminating improved agricultural inputs (e.g., fertilizers, improved seeds), providing loans, and marketing produced from the member’s farm.

3.2. The Impact of Wheat Grower’s Decision-Making on Income Growth

Table 4 presents the marginal influence of the determinants of the second decision of wheat growers and the first step regression results of the DSM full sample. The consequences display the factors that affect the secondary decision-making of farmers. As revealed in Table 4, there is a strong relationship between these dual choices. The coefficient ρ is 0.299, which is significant at the 1% level. The unobserved factors that affect the cooperative members especially increase the possibility of adopting improved technologies.
Moreover, Table 4 indicates the independent variables that have a statistically substantial influence on these two choices. In particular, the standard education level of growers shows that social trust substantially influences cooperative membership. It is because wheat growers with higher education are more likely to develop consensus and generate trust than growers with lower education. Cooperatives’ farming training enhances farmer’s understanding of adopting improved agricultural technologies. Additionally, participating in farming training signifies social membership as a substantial positive influence on cooperative membership since the training allows growers to know the advantages of farmer’s cooperatives [77,78,79]. Receiving information about agricultural equipment and production facilities as an additional sign of social contribution also positively influences the CS.
The estimated influences of different social factors on growers’ TA are also shown in Table 4. Social capital, comprising social networks, social trust, and social involvement, are important in influencing TA. Social networks evaluated by the scope of agricultural product sales have a substantial positive impact on TA, consistent with the existing information [80]. This is true because the larger the transactions range of agricultural products, the more intense the marketplace contest, which promotes growers to use cost-reducing/improved agricultural approaches to improve the competitiveness of their products. As determined by the education level, social trust has a substantial, positive influence on TA, which aligns with prior research [81,82]. It also found that highly educated growers can quickly learn more modern agricultural skills. Agricultural insurance is an efficient risk managing instrument that can assist growers in reducing threats when implementing improved technologies [83,84]. As quantified by grower’s farming abilities, social contribution has a substantial influence on TA. The family characteristics of farmers also influence new TA.

3.3. The Influence of Farmer’s Decision-Making on Agricultural Income

Table 5 reveals the outcomes of the second step DSM regression method: the impact of farmer’s decision-making on agricultural income by controlling other affecting factors. Table 5 shows that after controlling the selection bias caused through observed and unobserved factors, these two farmer’s choices have a substantial influence on their agricultural income, which aligns with the previous findings [35,46,85].
In addition, it is also determined by the considerable impact of controlling factors on farmer’s agricultural income. First, the input of agricultural materials has a substantial influence on farmer’s agricultural income. Agricultural workforce input, fixed assets, arable land area, and loans positively influence farmer’s agricultural income, although the influence is not statistically substantial. The household economic level has a substantial negative impact on farmer’s agricultural income. The probable cause is that with the development of the off-farm economy, non-agricultural income accounts for an increasing proportion of farmer’s total income, and growers with improved financial conditions are less reliant on agricultural income [44,52]. Village topography has a substantial negative influence on agricultural revenue. The probable cause is the problematic conveyance in mountain communities, raising transport expenses, and reducing farming productivity.

3.4. Influence of Incomes on Farmer’s Decision-Making

Table 6 describes the average treatment effect for treated (ATT) estimation results obtained by three various matching methods: nearest-neighbour matching (NNM), kernel-based matching method (KBM), and radius matching method (RM). Moreover, we directed a sensitivity test on the PSM assessment to check the results’ robustness and described the crucial hidden bias presented in the last column of Table 6.
Table 6 shows that the three corresponding approaches have achieved reliable findings, indicating that the farming income of wheat growers who participate in cooperatives and adopt improved technologies has enhanced significantly. Specifically, when using KBM, NNM, and RM, the agricultural income of cooperative contributors improved with approximately 2.72%, 2.73%, and 2.87%, which contrasted with non-participants, respectively. The farming income of the three supporting methods increased by an average of 2.78%. Contrasting with non-adopters, the adopter’s income was improved by 2.11%, 2.78%, and 2.18%, respectively, with a standard increase of 2.35%. Furthermore, it was found that CS can substantially boost income and is insensitive to hidden deviations or unobserved factors. For example, if the likelihood variance between two growers participating in the cooperative using the same covariate is 35%, the assessed ATT of the growers joining the cooperative is not improbable. The minimum and maximum critical values of Γ are 1.35–1.4 and 1.45–1.5, respectively. TA can substantially enhance the incomes of the entire sample and is insensitive to hidden deviations or unobserved factors. Suppose two farmers with the same covariate have a 27% difference in the likelihood of using agricultural technology. In that case, it is implausible to estimate the ATT of farmers using agricultural technology. The minimum and maximum critical values of Γ are 1.25–1.3 and 1.35–1.4, respectively. These values are relatively high because we controlled various covariates that affect the dual selections.
To assess the outcomes’ consistency of the PSM technique mentioned above, we conducted a balanced assessment to calculate the conditional independence hypothesis and an assessment to check the common assistance conditions.

3.5. The Influence of Low-Income Farmer’s Decision-Making on Poverty Reduction

An empirical examination of less-income growers was conducted to scrutinize the influence of farmer’s decision-making on poverty reduction by CS and TA. The study also examines the heterogeneity of less-revenue farmer’s sample consequences. To identify the low-income rural households in existing research, first, we analysed the per capita net income of the complete sample in 2021. Next, we categorized families with an annual income of less than (USD 1000.73) (resident income) as low-income households.
For less-income farmers, we also applied the DSM method to check the influence of their two choices on their farming income, but it reduced the selection bias. However, agricultural cooperatives could play a substantial role in increasing the farming income of low-income farmers. Table 7 shows the marginal effect of DSM’s first step regression findings on low-income farmers. These two choices of low-income farmers are highly linked with the coefficient ρ (0.412), which is considerable at the significance level of 1%. This is greater than the complete sample (0.299), showing that the influence of CS and TA on the agricultural income and welfare of low-income farmers is more important than the full sample. Unobserved factors affecting the membership of farmer cooperatives have also increased the adoption of improved agricultural technologies.
Compared with the test findings of the complete sample, most of the independent variables have a similar impact on the second decision of low-income farmers, but the degree of influence is different. On the other hand, social capital impacts the two choices of low-income farmers compared with the full sample. For example, social trust exemplified by government assistance and social membership characterized by farming training and farming info facilities has a significant optimistic impact on the participation of low-income farmer’s cooperatives. The social network signified via the cooperative’s degree, the social trust characterized by the government assistance, and the level of schooling have a substantial encouraging impact on the TA of low-income farmers. The matching coefficient is greater than the coefficient in the complete sample. In contrast, compared with the full sample, family attributes and regional attributes have less influence on the decision-making of low-income families.

3.6. The Effect of Low-Income Farmer’s Decision-Making on Their Agricultural Incomes

The findings in Table 8 show the dual step regression of the DSM method for low-income farmers. The two decisions of low-income farmers have a significant optimistic influence on their farming income at the significance level of 1%, which aligns with the previous studies [86].
Other factors also substantially impact the agricultural income of low-income farmers. For example, material inputs can substantially boost their incomes. Due to the limited resource endowments of low-income farmers, the positive impact of material inputs on their farming income is higher than the complete sample. Having a male head of the family also substantially increased their agricultural income.

3.7. Poverty Reduction Impact of Low-Income Farmer’s Decision-Making

The PSM was utilized to measure the influence of dual choices made by low-income farmers on their income. Parallel to the complete sample analysis, first, we estimated the PS by the logit method and then calculated the ATT by the PSM method. Table 9 shows the ATT assessment findings of low-income farmers gained through the three matching approaches of RM, KBM, and NNM. The findings are consistent, signifying that the decision of low-income farmers to participate in the cooperative system and TA have a substantial positive influence on their farming income, which is reliable with the results of the whole sample. However, the last column of Table 9 shows the critical level of hidden bias for robustness checks. Evaluated by RM, KBM, and RM, the agricultural income of low-income farmers who are cooperative members is about 5.08%, 5.55%, and 5.76% greater than that of non-members, respectively. On average, agricultural income was increased by 5.45%, greater than the full sample (2.78%). TA’s results are similar, showing that farmers with low income who joined the cooperative have achieved a higher income. At the same time, the agricultural incomes of low-income farmers who adopted improved technology through the three matching methods were 4.36%, 4.48%, and 4.70% higher than that of low-income non-adopters, respectively. The agricultural income increased by 4.51% on average, greater than the complete sample of 2.35%.
In this situation, the improved TA supports poor growers and contributes to reducing their poverty. Moreover, the finding is not sensitive to hidden deviations or un-observation aspects. Suppose the variance in odds between two farmers participating in the cooperative utilizing the same covariate is 55%. In that case, the assessed ATT of the farmers joining the cooperative is implausible. The minimum and maximum critical values of Γ are 1.57–1.7 and 1.8–1.88, respectively. The results of technical assistance for low-income farmers are not sensitive to hidden biases or unobserved factors. If the probability disparity between two farmers utilizing the agricultural technology covariate is 30%, the ATT assessed via the adopter is inaccurate. The minimum and maximum critical values of Γ are 1.5–1.37 and 1.37–1.6, respectively. The value is comparatively high because we controlled numerous covariates affecting farmer’s CS and TA choices. The KBM-based balance test shows that the stability requirement is completely met. The PSM distribution for less-income farmers shows that the common sustenance assessment is satisfied by comparing the similarity between the treatment and control groups.

4. Conclusions Policy Recommendations and Limitations

Several reports showed the impact of CS and TA on agricultural income has not been thoroughly studied in most emerging countries, such as Pakistan. Additionally, according to the author’s best information, the studies on the impact of CS and TA on agricultural income do not exist for Pakistan, and those present for other emerging nations are mostly qualitative rather than quantitative. The present study used PSM and DSM methods to examine the data of wheat growers from Pakistan’s KPK province to understand the influence of farmer’s CS and TA decisions on their farming benefits. The PSM model was also utilized to reduce farmer’s selection bias caused by observation factors and the variance of agricultural benefits under various choices calculated through counterfactual analysis. Balance testing and sensitivity analysis were used to evaluate model performance.
First, CS can significantly enhance growers’ agricultural benefits by controlling the ad-hoc selection of farmers. In the low-income sample, the positive influence of cooperative members on incomes is sturdier than the incomplete sample, which means that participation in cooperatives has the potential reducing poverty. Second, TA can also significantly increase farmer’s agricultural benefits by controlling farmer’s ad-hoc selection bias. In addition, there is a substantial association among farmer’s choices about CS and TA. In the low-income sample, TA had a sturdier influence on income than the full sample, indicating that TA can help reduce poverty and increase agricultural income. Third, factors such as farmer’s social capital are also significantly related to farmer’s CS and TA choices. CS is substantially correlated with social participation and trust for the whole sample. For the low-income growers, social participation and social trust have significantly improved the membership of cooperatives, and other control features have various influences on the cooperatives’ membership. TA has a significant positive association with social participation, trust, and social network for the growers in the whole sample. Social trust, social participation, and the social network had significantly increased the TA rate for the fewer income groups.
The analysis showed strong relationships among education, age, skill, training, gender with CS and TA, and agricultural benefits. While these findings are crucial to understanding the relationship between agricultural cooperative service and adoption of agricultural technology, it is rather important to conduct similar studies in a different country because several critical factors impact the decision of farmers to adopt agricultural technology.
This article proposes some policy-related recommendations. For example, the government and non-government organizations should take actions to regulate relevant legislation to support the farmer’s cooperatives development, particularly in low-income areas; promote cost-decreasing emerging agricultural technologies, increasing the amount and quantity of subsidies for the purchase of advanced and improved agricultural technologies; and support cooperative propaganda to growers, regulate the cooperatives’ process, improve the cooperative service capability, and solve the problems encountered by wheat growers in the process of the farming operation and production. As discussed in this article, several governmental and non-governmental organizations can support farmers/growers for cooperative support and adopting technologies to achieve agricultural-related SDGs.
This study has some limitations, and future researchers could address these limitations. This study did not consider detailed agronomic practices implemented by farmers, which could help understand the role of agronomic practices in the agricultural sector, which was beyond the scope of this study. Additionally, the current research did not measure the influence of implemented agricultural practices on the environment. Due to funding and the COVID-19 pandemic constraints, this study only focused on four districts in Pakistan’s KPK province. Future researchers can consider large sample size, possibly an entire country. In addition, future researchers could consider how farmer’s CS and membership affect other parts of the agricultural sector (such as agricultural progress, production efficiency, productivity, market information, etc.). Finally, this research only recognized agricultural income, and future researchers could further explore other essential parts of agricultural development and poverty reduction in rural areas.

Author Contributions

N.K., R.L.R., H.S.K., M.I., B.N.S. and S.Z. developed and outlined this concept, including the method and approach to be used; N.K. and R.L.R. developed and outlined the manuscript; N.K., R.L.R., H.S.K. and S.Z. contributed to the methodology and revision of this manuscript; N.K. and R.L.R. wrote the article. All authors have read and agreed to the published version of the manuscript.

Funding

The authors extend their appreciation to the researchers supporting the project of (No: RSP−2021/403) King Saud University, Riyadh, Saudi Arabia.

Institutional Review Board Statement

Not applicable.

Informed Consent Statement

Not applicable.

Data Availability Statement

The data that support our research findings are available from the corresponding author on request.

Conflicts of Interest

The authors declare that they have no conflict of interest.

References

  1. Liu, D.; Li, Y.; Wang, P.; Zhong, H.; Wang, P.J. Sustainable Agriculture Development in Northwest China Under the Impacts of Global Climate Change. Front. Nutr. 2021, 8, 706552. [Google Scholar] [CrossRef] [PubMed]
  2. Singh, R.; Singh, G.J. Environment. Traditional agriculture: A climate-smart approach for sustainable food production. Energy Ecol. Environ. 2017, 2, 296–316. [Google Scholar] [CrossRef]
  3. Lybbert, T.J.; Sumner, D.A. Agricultural technologies for climate change in developing countries: Policy options for innovation and technology diffusion. Food Policy 2012, 37, 114–123. [Google Scholar] [CrossRef]
  4. Khan, N.; Ray, R.L.; Kassem, H.S.; Hussain, S.; Zhang, S.; Khayyam, M.; Ihtisham, M.; Asongu, S.A. Potential Role of Technology Innovation in Transformation of Sustainable Food Systems: A Review. Agriculture 2021, 11, 984. [Google Scholar] [CrossRef]
  5. Ochieng, J.; Kirimi, L.; Makau, J. Adapting to climate variability and change in rural Kenya: F armer perceptions, strategies and climate trends. In Natural Resources Forum; Blackwell Publishing: Hoboken, NJ, USA, 2017; Volume 4, pp. 195–208. [Google Scholar] [CrossRef]
  6. Acevedo, M.F. Interdisciplinary progress in food production, food security and environment research. Environ. Conserv. 2011, 38, 151–171. [Google Scholar] [CrossRef] [Green Version]
  7. Finger, R.; Swinton, S.M.; El Benni, N.; Walter, A.J. Precision farming at the nexus of agricultural production and the environment. Annu. Rev. Resour. Econ. 2019, 11, 313–335. [Google Scholar] [CrossRef] [Green Version]
  8. Senyolo, M.P.; Long, T.B.; Blok, V.; Omta, O.J. How the characteristics of innovations impact their adoption: An exploration of climate-smart agricultural innovations in South Africa. J. Clean. Prod. 2018, 172, 3825–3840. [Google Scholar] [CrossRef]
  9. Andrade, J.F.; Edreira, J.I.R.; Farrow, A.; van Loon, M.P.; Craufurd, P.Q.; Rurinda, J.; Zingore, S.; Chamberlin, J.; Claessens, L.; Adewopo, J.J. A spatial framework for ex-ante impact assessment of agricultural technologies. Glob. Food Secur. 2019, 20, 72–81. [Google Scholar] [CrossRef]
  10. Sardar, A.; Kiani, A.K.; Kuslu, Y.J.E. Does adoption of climate-smart agriculture (CSA) practices improve farmers’ crop income? Assessing the determinants and its impacts in Punjab province, Pakistan. Environ. Dev. Sustain. 2021, 23, 10119–10140. [Google Scholar] [CrossRef]
  11. Sarkar, D.; Kar, S.K.; Chattopadhyay, A.; Rakshit, A.; Tripathi, V.K.; Dubey, P.K.; Abhilash, P.C. Low input sustainable agriculture: A viable climate-smart option for boosting food production in a warming world. Ecol. Indic. 2020, 115, 106412. [Google Scholar] [CrossRef]
  12. Issahaku, G.; Abdulai, A.J. Adoption of climate-smart practices and its impact on farm performance and risk exposure among smallholder farmers in Ghana. Aust. J. Agric. Resour. Econ. 2020, 64, 396–420. [Google Scholar] [CrossRef] [Green Version]
  13. Ribašauskienė, E.; Šumylė, D.; Volkov, A.; Baležentis, T.; Streimikiene, D.; Morkunas, M.J.S. Evaluating public policy support for agricultural cooperatives. Sustainability 2019, 11, 3769. [Google Scholar] [CrossRef] [Green Version]
  14. Zheng, B.; Geng, G.; Ciais, P.; Davis, S.J.; Martin, R.V.; Meng, J.; Wu, N.; Chevallier, F.; Broquet, G.; Boersma, F.; et al. Satellite-based estimates of decline and rebound in China’s CO2 emissions during COVID-19 pandemic. Sci. Adv. 2020, 6, eabd4998. [Google Scholar] [CrossRef] [PubMed]
  15. Yanbykh, R.; Saraikin, V.; Lerman, Z.J. Cooperative tradition in Russia: A revival of agricultural service cooperatives? Post-Communist Econ. 2019, 31, 750–771. [Google Scholar] [CrossRef]
  16. Bercu, F.; Botanoiu, D.; Tudor, V.; Alecu, E.J. Analysis of the modern agricultural cooperatives activity in Romania. Rom. Agric. Res. 2014, 31, 2014–2350. Available online: http://www.incda-fundulea.ro/rar/nr31/rar31.44.pdf (accessed on 20 February 2022).
  17. Reed, G.; Hickey, G.M. Contrasting innovation networks in smallholder agricultural producer cooperatives: Insights from the Niayes Region of Senegal. J. Co-Oper. Organ. Manag. 2016, 4, 97–107. [Google Scholar] [CrossRef]
  18. Karami, E.; Rezaei-Moghaddam, K.J. Modeling determinants of agricultural production cooperatives’ performance in Iran. Agric. Econ. 2005, 33, 305–314. [Google Scholar] [CrossRef]
  19. Liu, T.; Wu, G.J. Does agricultural cooperative membership help reduce the overuse of chemical fertilizers and pesticides? Evidence from rural China. Environ. Sci. Pollut. Res. 2022, 29, 7972–7983. [Google Scholar] [CrossRef]
  20. Lucas-Martínez, G.; Martín-Ugedo, J.F.; Minguez-Vera, A.J. Members’ perceptions of governance in agricultural cooperatives: Evidence from Spain. Outlook Agric. 2020, 49, 145–152. [Google Scholar] [CrossRef]
  21. Wedig, K.; Wiegratz, J.J. Neoliberalism and the revival of agricultural cooperatives: The case of the coffee sector in Uganda. J. Agrar. Change 2018, 18, 348–369. [Google Scholar] [CrossRef]
  22. Niyazmetov, D.; Soliev, I.; Theesfeld, I.J. Ordered to volunteer? Institutional compatibility assessment of establishing agricultural cooperatives in Uzbekistan. Land Use Policy 2021, 108, 105538. [Google Scholar] [CrossRef]
  23. Iliopoulos, C.; Valentinov, V.J. Opportunism in agricultural cooperatives in Greece. Outlook Agric. 2012, 41, 15–19. [Google Scholar] [CrossRef] [Green Version]
  24. Amichi, H.; Henninger, M.-C.; Peltier, C.J. Comment mobiliser les jeunes adhérents dans la gouvernance des coopératives agricoles?. Mise en pratique d’une démarche d’accompagnement au sein d’une coopérative du Sud-Ouest français. Econ. Geogr. Politics Law Sociol. 2021, 12, 1–26. [Google Scholar] [CrossRef]
  25. Abate, G.T. Drivers of agricultural cooperative formation and farmers’ membership and patronage decisions in Ethiopia. J. Co-Oper. Organ. Manag. 2018, 6, 53–63. [Google Scholar] [CrossRef]
  26. Karahocagil, P.; Ozudogru, H.J. Agricultural development cooperatives in Turkey the example Sanliurfa province. J. Anim. Vet. Adv. 2011, 10, 372–377. [Google Scholar]
  27. Dung, L.T. A Multinomial Logit Model Analysis of Farmers’ Participation in Agricultural Cooperatives: Evidence from Vietnam. Appl. Econ. J. 2020, 27, 1–22. [Google Scholar]
  28. Ankrah Twumasi, M.; Jiang, Y.; Addai, B.; Ding, Z.; Chandio, A.A.; Fosu, P.; Asante, D.; Siaw, A.; Danquah, F.O.; Korankye, B.A. The Impact of Cooperative Membership on Fish Farm Households’ Income: The Case of Ghana. Sustainability 2021, 13, 1059. [Google Scholar] [CrossRef]
  29. Ma, W.; Abdulai, A.J. IPM adoption, cooperative membership and farm economic performance: Insight from apple farmers in China. China Agric. Econ. Rev. 2018, 11, 218–236. [Google Scholar] [CrossRef]
  30. Manda, J.; Khonje, M.G.; Alene, A.D.; Tufa, A.H.; Abdoulaye, T.; Mutenje, M.; Setimela, P.; Manyong, V.J.T.F.; Change, S. Does cooperative membership increase and accelerate agricultural technology adoption? Empirical evidence from Zambia. Technol. Forecast. Soc. Change 2020, 158, 120160. [Google Scholar] [CrossRef]
  31. Abebaw, D.; Haile, M.G. The impact of cooperatives on agricultural technology adoption: Empirical evidence from Ethiopia. Food Policy 2013, 38, 82–91. [Google Scholar] [CrossRef]
  32. Zhang, S.; Sun, Z.; Ma, W.; Valentinov, V.J. The effect of cooperative membership on agricultural technology adoption in Sichuan, China. China Econ. Rev. 2020, 62, 101334. [Google Scholar] [CrossRef]
  33. Vandeplas, A.; Minten, B.; Swinnen, J. Multinationals vs. cooperatives: The income and efficiency effects of supply chain governance in India. J. Agric. Econ. 2013, 64, 217–244. [Google Scholar] [CrossRef]
  34. Ma, W.; Abdulai, A. Does cooperative membership improve household welfare? Evidence from apple farmers in China. Food Policy 2016, 58, 94–102. [Google Scholar] [CrossRef]
  35. Nakano, Y.; Tanaka, Y.; Otsuka, K. Impact of training on the intensification of rice farming: Evidence from rainfed areas in Tanzania. Agric. Econ. 2018, 49, 193–202. [Google Scholar] [CrossRef]
  36. Li, H.; Liu, Y.; Zhao, X.; Zhang, L.; Yuan, K. Estimating effects of cooperative membership on farmers’ safe production behaviors: Evidence from the rice sector in China. Env. Sci. Pollut. Res. 2021, 20, 25400–25418. [Google Scholar] [CrossRef]
  37. Khan, N.; Ray, R.L.; Sargani, G.R.; Ihtisham, M.; Khayyam, M.; Ismail, S. Current Progress and Future Prospects of Agriculture Technology: Gateway to Sustainable Agriculture. Sustainability 2021, 13, 4883. [Google Scholar] [CrossRef]
  38. Kassem, H.S.; Alotaibi, B.A.; Ghoneim, Y.A.; Diab, A.M. Mobile-based advisory services for sustainable agriculture: Assessing farmers’ information behavior. Inf. Dev. 2020, 37, 483–485. [Google Scholar] [CrossRef]
  39. Neves, D.C.R.M.; Carlos, O.F.; Felipe, D.F.S. Does cooperative membership increase rural income? Evidence from Brazilian agricultural sector. Inter. Assoc. Agric. Eco. 2021, 7, 1–31. [Google Scholar]
  40. WHO Organization. WHO Country Cooperation Strategy at a Glance: Pakistan. World Health Organization, 2018. License: CC BY-NC-SA3.0IGO. Available online: https://apps.who.int/iris/handle/10665/136607 (accessed on 20 February 2022).
  41. Munir, M.U.; Ahmad, A.; Hopmans, J.W.; Belgacem, A.O.; Baig, M.B. Water Scarcity Threats to National Food Security of Pakistan—Issues, Implications, and Way Forward. In Emerging Challenges to Food Production and Security in Asia, Middle East, and Africa; Springer Nature: Cham, Switzerland, 2021; pp. 241–266. [Google Scholar] [CrossRef]
  42. Cakir, M.; Balagtas, J.V. Estimating market power of US dairy cooperatives in the fluid milk market. Am. J. Agric. Econ. 2012, 94, 647–658. [Google Scholar] [CrossRef]
  43. Li, X.; Guo, H.; Jin, S.; Ma, W.; Zeng, Y. Do farmers gain internet dividends from E-commerce adoption? Evidence from China. Food Policy 2021, 101, 102024. [Google Scholar] [CrossRef]
  44. Liu, Z.; Yang, D.; Wen, T. Agricultural production mode transformation and production efficiency: A labor division and cooperation lens. China Agric. Econ. Rev. 2019, 11, 160–179. [Google Scholar] [CrossRef]
  45. Yang, D.; Liu, Z. Does farmer economic organization and agricultural specialization improve rural income? Evidence from China. Econ. Model. 2012, 29, 990–993. [Google Scholar] [CrossRef]
  46. Khan, N.; Ray, R.L.; Kassem, H.S.; Ihtisham, M.; Abdullah; Asongu, S.A.; Ansah, S.; Shemei, Z. Toward Cleaner Production: Can Mobile Phone Technology Help Reduce Inorganic Fertilizer Application? Evidence Using a National Level Dataset. Land 2021, 10, 1023. [Google Scholar] [CrossRef]
  47. Bernard, T.; Spielman, D.J. Reaching the rural poor through rural producer organizations? A study of agricultural marketing cooperatives in Ethiopia. Food Policy 2009, 34, 60–69. [Google Scholar] [CrossRef]
  48. Becerril, J.; Abdulai, A. The impact of improved maize varieties on poverty in Mexico: A propensity score-matching approach. World Dev. 2010, 38, 1024–1035. [Google Scholar] [CrossRef]
  49. Khanna, M. Sequential adoption of site-specific technologies and its implications for nitrogen productivity: A double selectivity model. Am. J. Agric. Econ. 2001, 83, 35–51. [Google Scholar] [CrossRef]
  50. Ejemeyovwi, J.O.; Osabuohien, E.S.; Johnson, O.D.; Bowale, E.I. Internet usage, innovation and human development nexus in Africa: The case of ECOWAS. J. Econ. Struct. 2019, 8, 15. [Google Scholar] [CrossRef] [Green Version]
  51. Karakara, A.A.-W.; Osabuohien, E. ICT adoption, competition and innovation of informal firms in West Africa: A comparative study of Ghana and Nigeria. J. Enterprising Communities People Places Glob. Econ. 2020, 14, 397–414. [Google Scholar] [CrossRef]
  52. De Janvry, A.; Sadoulet, E. Income strategies among rural households in Mexico: The role of off-farm activities. World Dev. 2001, 29, 467–480. [Google Scholar] [CrossRef]
  53. Asongu, S.A.; Efobi, U.R.; Tanankem, B.V.; Osabuohien, E.S. Globalisation and female economic participation in sub-Saharan Africa. Gend. Issues 2020, 37, 61–89. [Google Scholar] [CrossRef] [Green Version]
  54. Zheng, Y.; Dallimer, M.J. What motivates rural households to adapt to climate change? Clim. Dev. 2016, 8, 110–121. [Google Scholar] [CrossRef]
  55. Hayami, Y.; Ruttan, V.W. Agricultural Development: An International Perspective; The Johns Hopkins Press: Baltimore, MD, USA; London, UK, 1971; Available online: https://agris.fao.org/agris-search/search.do?recordID=XF2016045783 (accessed on 16 December 2021).
  56. Khan, N.; Siddiqui, B.N.; Khan, N.; Khan, F.; Ullah, N.; Ihtisham, M.; Ullah, R.; Ismail, S.; Muhammad, S. Analyzing mobile phone usage in agricultural modernization and rural development. Int. J. Agric. Ext. 2020, 8, 139–147. [Google Scholar] [CrossRef]
  57. Tinzaara, W.; Oyesigye, E.; Bocquet, C.; Arkin, J.; Johnson, V. Mobile phone technology for increasing banana productivity among smallholder farmers in Uganda. J. Agric. Ext. Rural Dev. 2021, 13, 1–13. [Google Scholar]
  58. Abebe, A.; Mammo Cherinet, Y. Factors affecting the use of information and communication technologies for cereal marketing in Ethiopia. J. Agric. Food Inf. 2019, 20, 59–70. [Google Scholar] [CrossRef]
  59. Kassem, H.S.; Shabana, R.M.; Ghoneim, Y.A.; Alotaibi, B.M. Farmers’ perception of the quality of mobile-based extension services in Egypt: A comparison between public and private provision. Inf. Dev. 2020, 36, 161–180. [Google Scholar] [CrossRef]
  60. ZHENG, Y.-Y.; ZHU, T.-H.; Wei, J.J. Does Internet use promote the adoption of agricultural technology? Evidence from 1 449 farm households in 14 Chinese provinces. J. Integr. Agric. 2022, 21, 282–292. [Google Scholar] [CrossRef]
  61. Ma, W.; Renwick, A.; Yuan, P.; Ratna, N.J. Agricultural cooperative membership and technical efficiency of apple farmers in China: An analysis accounting for selectivity bias. Food Policy 2018, 81, 122–132. [Google Scholar] [CrossRef]
  62. Verhofstadt, E.; Maertens, M.J. Smallholder cooperatives and agricultural performance in Rwanda: Do organizational differences matter? Agric. Econ. 2014, 45, 39–52. [Google Scholar] [CrossRef]
  63. González-Flores, M.; Bravo-Ureta, B.E.; Solís, D.; Winters, P.J. The impact of high value markets on smallholder productivity in the Ecuadorean Sierra: A Stochastic Production Frontier approach correcting for selectivity bias. Food Policy 2014, 44, 237–247. [Google Scholar] [CrossRef]
  64. Ihtisham, M.; Liu, S.; Shahid, M.O.; Khan, N.; Lv, B.; Sarraf, M.; Ali, S.; Chen, L.; Liu, Y.; Chen, Q. The Optimized N, P, and K Fertilization for Bermudagrass Integrated Turf Performance during the Establishment and Its Importance for the Sustainable Management of Urban Green Spaces. Sustainability 2020, 12, 10294. [Google Scholar] [CrossRef]
  65. Aslam, M. Agricultural productivity current scenario, constraints and future prospects in Pakistan. Sarhad J. Agric. 2016, 32, 289–303. [Google Scholar] [CrossRef]
  66. Muhammad, S.; Siddiqui, B.N.; Khan, F.U.; Khan, N. Self-perceived Constraints of Extension Field Staff Affecting their Working Efficiency in Khyber Pakhtunkhwa, Pakistan. Sarhad J. Agric. 2021, 37, 64–70. [Google Scholar] [CrossRef]
  67. Ali, S.; Ying, L.; Nazir, A.; Ishaq, M.; Shah, T.; Ye, X.; Ilyas, A.; Tariq, A. Rural farmers perception and coping strategies towards climate change and their determinants: Evidence from Khyber Pakhtunkhwa province, Pakistan. J. Clean. Prod. 2021, 291, 125250. [Google Scholar] [CrossRef]
  68. Khan, T.; Nouri, H.; Booij, M.J.; Hoekstra, A.Y.; Khan, H.; Ullah, I. Water Footprint, Blue Water Scarcity, and Economic Water Productivity of Irrigated Crops in Peshawar Basin, Pakistan. Water 2021, 13, 1249. [Google Scholar] [CrossRef]
  69. Khan, N.; Ray, R.L.; Zhang, S.; Osabuohien, E.; Ihtisham, M.J. Influence of mobile phone and internet technology on income of rural farmers: Evidence from Khyber Pakhtunkhwa Province, Pakistan. Technol. Soc. 2022, 68, 101866. [Google Scholar] [CrossRef]
  70. Tunali, I. A general structure for models of double-selection and an application to a joint migration/earnings process with remigration. Res. Labor Econ. 1986, 8, 235–282. [Google Scholar]
  71. Heckman, J.J.; Vytlacil, E.J. Econometric evaluation of social programs, part I: Causal models, structural models and econometric policy evaluation. Handb. Econom. 2007, 6, 4779–4874. [Google Scholar]
  72. Wossen, T.; Abdoulaye, T.; Alene, A.; Haile, M.G.; Feleke, S.; Olanrewaju, A.; Manyong, V. Impacts of extension access and cooperative membership on technology adoption and household welfare. J. Rural. Stud. 2017, 54, 223–233. [Google Scholar] [CrossRef]
  73. Ma, W.; Abdulai, A.; Goetz, R. Agricultural cooperatives and investment in organic soil amendments and chemical fertilizer in China. Am. J. Agric. Econ. 2018, 100, 502–520. [Google Scholar] [CrossRef]
  74. Twumasi, M.A.; Jiang, Y.; Asante, D.; Addai, B.; Akuamoah-Boateng, S.; Fosu, P. Internet use and farm households food and nutrition security nexus: The case of rural Ghana. Technol. Soc. 2021, 65, 101592. [Google Scholar] [CrossRef]
  75. Ihtisham, M.; Fahad, S.; Luo, T.; Larkin, R.M.; Yin, S.; Chen, L. Optimization of nitrogen, phosphorus, and potassium fertilization rates for overseeded perennial ryegrass turf on dormant bermudagrass in a transitional climate. Front. Plant Sci. 2018, 9, 487. [Google Scholar] [CrossRef] [Green Version]
  76. Khanna, M.; Epouhe, O.F.; Hornbaker, R. Site-specific crop management: Adoption patterns and incentives. Appl. Econ. Perspect. Policy 1999, 2, 455–472. [Google Scholar] [CrossRef]
  77. Fulton, J.R.; Adamowicz, W.L. Factors that influence the commitment of members to their cooperative organization. J. Agric. Coop. 1993, 8, 39–53. [Google Scholar]
  78. Ji, C.; Jin, S.; Wang, H.; Ye, C. Estimating effects of cooperative membership on farmers’ safe production behaviors: Evidence from pig sector in China. Food Policy 2019, 83, 231–245. [Google Scholar] [CrossRef]
  79. Ma, W.; Abdulai, A. The economic impacts of agricultural cooperatives on smallholder farmers in rural China. Agribusiness 2017, 33, 537–551. [Google Scholar] [CrossRef]
  80. Maertens, A.; Barrett, C.B. Measuring social networks’ effects on agricultural technology adoption. Am. J. Agric. Econ. 2013, 95, 353–359. [Google Scholar] [CrossRef]
  81. Freudenreich, H.; Musshoff, O. Insurance for technology adoption: An experimental evaluation of schemes and subsidies with maize farmers in Mexico. J. Agric. Econ. 2018, 69, 96–120. [Google Scholar] [CrossRef]
  82. Hoang, H.G.; Drysdale, D. Factors affecting smallholder farmers’ adoption of mobile phones for livestock and poultry marketing in Vietnam: Implications for extension strategies. Rural Ext. Innov. Syst. J. 2021, 17, 21–30. [Google Scholar]
  83. Zhang, Y.-Y.; Ju, G.-W.; Zhan, J.-T. Farmers using insurance and cooperatives to manage agricultural risks: A case study of the swine industry in China. J. Integr. Agric. 2019, 18, 2910–2918. [Google Scholar] [CrossRef]
  84. Ni, Z.; Chen, J.; Ding, J.-Y. Pig farmers’ willingness to recover their production under COVID-19 pandemic shock in China–Empirical evidence from a farm survey. J. Integr. Agric. 2020, 19, 2891–2902. [Google Scholar]
  85. Subramanian, A.; Qaim, M. The impact of Bt cotton on poor households in rural India. J. Dev. Stud. 2010, 46, 295–311. [Google Scholar] [CrossRef]
  86. Mojo, D.; Fischer, C.; Degefa, T. The determinants and economic impacts of membership in coffee farmer cooperatives: Recent evidence from rural Ethiopia. J. Rural Stud. 2017, 50, 84–94. [Google Scholar] [CrossRef]
Figure 1. Map of the study area [69].
Land 11 00361 g001
Table 1. Sample distribution.
Name of
Province
Name of
Districts
No. of TehsilsNo. of Union CouncilNo. of
Village
No. of
Samples
Khyber
Pakhtunkhwa
Dera Ismail Khan114125
Charsadda114124
Mansehra114124
Swat114125
Total44416498
Table 2. Samples distribution in four groups.
Cooperative
Support
Agricultural Technologies Adoption
Not AdoptedAdopted
Not supported13946
Supported195118
Table 3. Variable description and summary statistics.
Category of
Variables
Variables NameDescriptionMean (S.D)
Dependent
Variables
Agricultural
Incomes (AI)
Natural log of farmer’s annual agricultural
income in 2021 (PKR)
10.99 (1.19)
Decision
Variables (DV)
Cooperatives supports (CS)1 = cooperative supports, 0= otherwise0.68 (0.32)
Technology Adoption (TA) 11 = improved technologies adopters, 0= otherwise0.28 (0.13)
Social
Network (SN)
Party Membership (PM)1 = farmers are a political party member, 0 otherwise0.19 (0.39)
Sales Range (SR)Scope of agricultural products sales: 5 = resident of province, 3 = resident of city, 2 = hometown; 1 = resident of village4.88 (2.15)
Cooperation
Degree (CD)
The cooperation level among wheat growers: 4 = high, often support each other; 3 = higher, occasionally support each other; 2 = low, support each other occasionally; Other; 1 = very low, basically not cooperated2.85 (2.14)
Social
Trust (ST)
Government
Support (GS)
The government support level for growers’ cooperatives: 4 = very high, 3 = high, 2 = fair, 1 = low 3.29 (1.25)
Village Education (VE)The proportion of the population with high school education or above in the whole village (%)24.0 (15.76)
Agricultural
Insurance (AI)
1 = If wheat growers bought agricultural insurance, 0 = otherwise0.41 (0.49)
Social
Participation
(SP)
Agricultural
Training (AT)
1 = If the wheat grower has received agricultural training, 0 = otherwise0.74 (0.44)
Agricultural Information Service (AIS)1 = If wheat grower gained agricultural intelligence service, 0 = otherwise0.81 (0.40)
Agricultural Skill (AS)1 = If wheat grower has farming skills, 0 = otherwise0.54 (0.50)
Agricultural
Input (AI)
Agricultural Labor Force (ALF)Number of household members who participated in farming 2.62 (1.02)
Labor Share (LS)Labor force as a percentage of household members (%)0.61 (0.20)
Farmland Area (FA)Farmland area managed by growers (ha)2.35 (0.79)
Material Input (MI) 2The natural logarithm of the material input cost (PKR), counting the acquisition of agricultural production materials.9.62 (1.48)
Agricultural Fixed Assets (AFA)The natural log of the present cost of agricultural technology apparatus (PKR)4.78 (4.13)
Agricultural Loan (AL)The grower natural logarithm agricultural loan (PKR) in 20213.35 (4.78)
Farmer
Characteristics
(FC)
Gender (G)1 = If male, 0 = otherwise0.83 (0.39)
Age (A)Respondents’ age (years)48.29 (12.78)
Education (E)Respondents’ education level: 5 = College and above, 4 = High school, 3 = Secondary, 2 = Elementary, 1 = Non3.03 (0.90)
Migrant Workers (MW)Number of family non-agricultural migrant labor0.49 (0.70)
Off-Farm Income (OFI)Percentage of off-farm income in total family income (%)0.21 (0.25)
Economic Status (ES)The financial position of growers: 5 = very rich, 4 = comparatively rich, 3 = average, 2 = comparatively poor, 1 = very poor3.93 (0.80)
Location
Characteristics (LC)
Market Distance (MD)Distance between farm and market (km)6.65 (6.05)
Village Terrain (VT)1 = if growers of the village live in the mountain region, 0 = otherwise0.32 (0.13)
Note: 1 TA (improved seed and fertilizers); 2 Material inputs contain costs for agricultural production materials such as seeds (seeds and poultry), insecticides (veterinary drugs), fertilizers, and mulching films; agricultural fixed assets describe the inputs of agricultural equipment held through households.
Table 4. The marginal impact of the first-step regression outcomes of the full-sample DSM.
Category of
Variables
Variables
Name
Cooperative SupportsTechnology Adoption
dy/dx (S.E)dy/dx (S.E)
SNPM0.038 (0.051)0.036 (0.039)
SR0.019 (0.015)0.033 *** (0.013)
CD−0.007 (0.021)0.024 (0.018)
STGS0.023 (0.016)0.017 (0.013)
VE0.004 *** (0.001)0.005 *** (0.001)
AI−0.020 (0.041)0.073 ** (0.034)
SPAT0.228 *** (0.048)0.024 (0.039)
AIS0.228 *** (0.052)−0.031 (0.041)
AS0.071 * (0.042)0.065 * (0.034)
AILS0.087 (0.125)0.120 (0.085)
FA−0.022 (0.027)0.031 (0.024)
MI0.479 (0.121) ***0.027 (0.062)
AFA0.011 (0.009)0.011 (0.005)
AL0.002 (0.006)0.001 (0.004)
FCG0.103 * (0.058)0.033 (0.063)
A−0.006 ** (0.002)0.001 (0.003)
E−0.018 (0.026)–0.008 (0.024)
MW−0.007 (0.028)0.020 (0.031)
OFI−0.437 *** (0.087)−0.303 *** (0.088)
LCMD−0.008 ** (0.003)−0.001 (0.003)
VT0.148 *** (0.055)0.012 (0.045)
N498
Log-likelihood−744.072
p0.299 ***
Note: *, **, and *** indicate significance levels at 10%, 5%, and 1%, respectively.
Table 5. The second step-regression outcomes of the full-sample DSM.
Category of
Variables
Variables
Name
Agricultural Income
Coefficients (S.E)
DVCS0.387 * (0.217)
TA1.080 *** (0.171)
AIALF0.021 (0.039)
FA0.038 (0.052)
MI0.568 *** (0.030)
AFA0.012 (0.008)
AL0.004 (0.008)
FCG0.105 (0.123)
A0.003 (0.005)
E0.013 (0.049)
MW−0.054 (0.067)
ES−0.080 * (0.047)
LCMD0.008 (0.007)
VT−0.145 * (0.087)
CONST4.810 *** (0.477)
Note: * and *** demonstrate significance levels at 10% and 1%, correspondingly.
Table 6. The ATT and sensitivity analysis outcome of the whole sample.
Category of
Variables
Rural Farmer’s
Decisions
Matching AlgorithmsTreatedControlsATTBootstrap
S. E
Range of
Change (%)
Critical Level of
Hidden Bias (Γ)
DVCSNNM
(n = 4)
11.123910.82870.2863 *0.1702.73[1.35–1.4]
KBM (bandwidth = 0.06)11.113910.81990.2939 *0.1552.72[1.35–1.4]
RM11.113910.80420.3096 **0.1522.87[1.45–1.5]
TANNM
(n = 4)
11.183710.88200.3017 *0.1712.78[1.35–1.4]
KBM (bandwidth = 0.06)11.183210.95150.2316 *0.1392.11[1.25–1.3]
RM11.138210.94490.2382 *0.1432.18[1.25–1.3]
Note: *, and ** show significance levels at 10%, 5%, and 1%, respectively.
Table 7. The marginal influence of DSM on low-income farmer’s first-step regression findings.
Category of
Variables
Variables
Name
Cooperative
Supports
Technology
Adoption
dy/dx (S.E)dy/dx (S.E)
SNPM0.021 (0.083)–0.098 (0.092)
SR0.019 (0.024)0.021 (0.022)
CD−0.010 (0.031)0.086 *** (0.031)
STGS0.046 * (0.025)0.044 * (0.023)
VE0.003 (0.002)0.006 *** (0.002)
AI−0.004 (0.070)0.107 * (0.059)
SPAT0.137 ** (0.067)0.024 (0.070)
AIS0.207 *** (0.063)–0.095 (0.063)
AS−0.083 (0.062)0.022 (0.055)
AILS0.231 (0.159)0.072 (0.151)
FA0.005 (0.044)0.071 * (0.042)
FCG0.135 * (0.078)–0.006 (0.075)
A−0.005 (0.004)–0.003 (0.004)
E−0.043 (0.036)0.028 (0.036)
MW−0.005 (0.046)0.007 (0.045)
OFI−0.528 *** (0.126)–0.322 ** (0.136)
LCMD−0.009 (0.007)0.004 (0.006)
VT0.179 * (0.092)–0.028 (0.080)
N182
Log pseudo-likelihood−321.070
p0.414 ***
Note: *, **, and *** show significance levels at 10%, 5%, and 1%, correspondingly.
Table 8. DSM’s second step regression outcomes and low-revenue growers.
Category of
Variables
Variables
Name
Agricultural Income
Coefficients (S.E)
DVCS0.707 *** (0.232)
TA0.777 *** (0.257)
AIALF−0.006 (0.049).
FA0.114 (0.085)
MI0.664 *** (0.040)
AFA0.013 (0.012)
AL0.016 (0.010)
FCG0.270 * (0.153)
A0.007 (0.007)
E−0.017 (0.073)
MW−0.001 (0.089)
ES−0.064 (0.060)
LCMD0.012 (0.013)
VT−0.075 (0.136)
CONST2.998 *** (0.674)
Note: * and *** specify significance levels at 10% and 1%, correspondingly.
Table 9. ATT and sensitivity assessment findings of low-income samples.
Category of VariablesRural Farmer’s
Decisions
Matching AlgorithmsTreatedControlsATTBootstrap
S. E
Range of
Change
(%)
Critical Level of
Hidden Bias (Γ)
DVCMNNM (n = 4)11.850010.27000.5901 *0.3315.761.8–1.88
KBM (bandwidth = 0.06)11.850010.29070.5693 *0.3205.551.7–1.84
RM10.860010.33570.5243 *0.3075.081.57–1.7
TANNM (n = 4)11.075710.57840.4973 *0.2824.701.36–1.5
KBM (bandwidth = 0.06)10.976010.50520.4708 *0.2844.481.5–1.37
RM10.976010.51740.4586 *0.2684.361.37–1.6
Note: * shows the significance levels at 10%.
Publisher’s Note: MDPI stays neutral with regard to jurisdictional claims in published maps and institutional affiliations.

