Article

Identifying Degraded and Sensitive to Desertification Agricultural Soils in Thessaly, Greece, under Simulated Future Climate Scenarios

by
Orestis Kairis
1,*,
Andreas Karamanos
2,
Dimitrios Voloudakis
3,
John Kapsomenakis
3,
Chrysoula Aratzioglou
1,
Christos Zerefos
3,4,5 and
Constantinos Kosmas
1
1
Laboratory of Soil Science and Agricultural Chemistry, Agricultural University of Athens, 75 Iera Odos Street, GR-11855 Athens, Greece
2
Faculty of Crop Science, Agricultural University of Athens, 75 Iera Odos Street, GR-11855 Athens, Greece
3
Research Center for Atmospheric Physics and Climatology, Academy of Athens, GR-10680 Athens, Greece
4
Biomedical Research Foundation of the Academy of Athens, GR-11527 Athens, Greece
5
Navarino Environmental Observatory (N.E.O.), GR-24001 Messinia, Greece
*
Author to whom correspondence should be addressed.
Submission received: 28 January 2022 / Revised: 3 March 2022 / Accepted: 4 March 2022 / Published: 8 March 2022

Abstract

:
The impact of simulated future climate change on land degradation was assessed in three representative study sites of Thessaly, Greece, one of the country’s most important agronomic zones. Two possible scenarios were used for estimation of future climatic conditions, which were based on greenhouse gas emissions (RCP4.5 and RCP8.5). Three time periods were selected: the reference past period 1981–2000 for comparison, and the future periods 2041–2060 and 2081–2100. Based on soil characteristics, past and future climate conditions, type of land uses, and land management prevailing in the study area, the Environmentally Sensitive to desertification Areas (ESAs) were assessed for each period using the MEDALUS-ESAI index. Soil losses derived by water and tillage erosion were also assessed for the future periods using existing empirical equations. Furthermore, primary soil salinization risk was assessed using an algorithm of individual indicators related to the natural environment or socio-economic characteristics. The obtained data by both climatic scenarios predicted increases in mean maximum and mean minimum air temperature. Concerning annual precipitation, reductions are generally expected for the three study sites. Desertification risk in the future is expected to increase in comparison to the reference period. Soil losses are estimated to be more important in sloping areas, due especially to tillage erosion in at least one study site. Primary salinization risk is expected to be higher in one study site and in soils under poorly drainage conditions.

1. Introduction

Soil, as a thermodynamically open system [1], receives inputs from the environment and at the same time exerts a strong influence on it. Such a system undergoes constant changes, at various rates, the size of which depends on the intensity of the inputs it receives and its outputs to the environment [2]. In various ecosystems, the processes evolving in soils can be categorized into those generating entropy, consequently degrading soil quality (e.g., decomposition of organic matter, erosion, leaching of nutrients, etc.) and those that reduce entropy (formation of soil structure, aggregation of soil particles, thrombosis of clay particles, etc.). A fundamental criterion of soil sustainability is the principle of minimum entropy production [3,4], according to which the approach of an equilibrium state of an irreversible process (soil formation and its evolution through soil profile development) is characterized by a minimum value of the entropy production rate. Therefore, agronomically, all the necessary measures must be established and applied so that the changes in soil system to be slow and the rates of soil formation and those of changes in its properties and its losses, as far as possible, to be balanced [2]. In this way, the soil system will be constantly approaching a state of equilibrium, which will ensure the sustainability of its ability to produce biomass and perform its functions as an integral part of the ecosystem. Under a regime of extreme external inputs, whether natural or man-induced, the desired approach to the equilibrium state is overturned and the existing changes become more intense, resulting in soil properties, functions, and general quality being degraded.
Land desertification is the result of a series of important land degradation processes in the semi-arid and arid regions of the planet, where water is the main limiting factor of land uses in various ecosystems [5,6]. Direct natural soil degradation processes that have been identified as mainly responsible for desertification in the Mediterranean are soil erosion (by water and wind) and soil salinization while, at the same time, several other soil threats have been reported that may also contribute to the phenomenon [5]. Desertification occurs when soil degradation reaches a particularly critical stage, during which the soil can no longer provide the necessary living space, water, and nutrients to plants and other life forms that are fundamental to human life and the sustainability of the environment in general [2]. According to the United Nations Convention to Combat Desertification [7], the phenomenon of desertification is defined as the “degradation of land in arid, semi-arid and dry sub-humid areas, resulting from various factors, including climatic variations and human activities”. In contrast to soil formation and evolution, desertification is not limited to irreversible forms [6] and is largely a reversible process [8,9].
The most worldwide and even quite recently applied or modified procedure for assessing land desertification risk is the methodology of Environmentally Sensitive Areas [10,11,12,13,14,15,16,17,18,19,20,21,22,23,24,25,26,27,28] that was first introduced in the framework of the EU-funded project MEDALUS III [5]. According to this methodology, the different areas of the Mediterranean environment were categorized based on their vulnerability to desertification. Environmentally Sensitive Areas (ESAs) around the Mediterranean Basin present different sensitivities to desertification according to the limiting factors they are facing. The methodology through four qualities (soil, climate, vegetation, and management), assessed by a total of 15 indicators, incorporates in a holistic manner the most common environmental limiting factors of the Mediterranean regions that, in their extreme expression, can lead to land desertification. As demonstrated by its widespread acceptance, modifications, and applications, the core of the methodology strongly represents factors that can lead to desertification, extending its implementation also in areas outside the Mediterranean environment.
Soil erosion is strongly related to land abandonment or to the reallocation of rainfed cereals in Mediterranean conditions, due to soil depth degradation [29] and productivity decline [30,31], resulting in it often being a precursor to desertification. Under the same conditions, the average annual estimation of soil losses due to tillage are considerably much higher, at the order of magnitude level, than those caused by water erosion [30]. Concerning the degradation process of salinization, naturally induced saline soils in Greece are mainly found in plain areas located near the coastline, formed on alluvial deposits and having a shallow ground water table. Based on a recent soil survey report for agricultural soils, soils under high or moderate potential salinization risk cover approximately 5.7% of these soils [32].
Due to the causal relationship between desertification and climatic variations, it is self-evident that the risk of land desertification in future climate scenarios can be reliably projected through the Representative Concentration Pathways (RCPs) [33]. The pathways describe different climate futures, all of which are considered possible depending on the volume of greenhouse gases (GHG) emitted in the years to come. RCPs are consistent with certain socio-economic assumptions but are being substituted with the shared socio-economic pathways that are anticipated to provide flexible descriptions of possible futures within each RCP. It is true that in recent years RCPs are often used to assess the process of desertification or the trends of its main components [34,35,36]. In the context of the present work, the soil degradation processes of soil erosion (including water and tillage erosion), primary salinization, and desertification risk of typical agricultural areas of the Thessaly plain (Greece), mainly under cereal and cotton cultivation, were assessed by applying existing empirical equations or algorithms of indicators and the methodology of ESAs under the regime of various RCPs.

2. Materials and Methods

2.1. Study Area

The study area is located in the central part of Greece in Thessaly plain. Thessaly, the greatest agricultural area of Greece, produces 14.2% of the country’s crop production, covering a total cultivated area of 416,000 ha. This area is occupied by 83.3% of arable crops, dominated by cereals and cotton [37]. Based on our experience in the study area, and the recent soil survey of the region [32], the main soil degradation processes are soil erosion, soil salinization, loss in organic matter content, and soil compaction of the subsurface soil layer. Three representative study sites have been selected in that area, namely (a) Trikala, (b) Zappeion, and (c) Sotirio. Each of the three study sites was a square with a side of 11 km, around each corresponding provincial town’s center, covering an area of 12,100 ha (Figure 1). The study was focused on areas covered with arable crops and, therefore, did not include mountainous grazing areas.
The climate of the study area is characterized as semi-arid, with an annual rainfall ranging from 415 to 707 mm yr−1 (Greek National Meteorological Service). The study site of Trikala is almost flat with deep well-drained soils, fine to moderately fine textured, formed on alluvial deposits, and classified as Fluvisols or Luvisols. The study site of Zappeion is a sloping land with deep to moderately deep well-drained soils, fine to moderately fine textured, formed on marl deposits, and classified as Cambisols or Vertisols. The study site of Sotirio is almost flat to moderately sloping with deep to moderately deep, well- to very poorly-drained soils, fine to moderately fine textured, formed on alluvial or marl deposits, and classified as Fluvisols or Cambisols [32]. The maps presented in this work were compiled using the ArcGIS v.10.4 software (Environmental Systems Research Institute-ESRI, Redlands, CA, USA).

2.2. Climate Simulation

Estimates of future climatic conditions were based on scenarios of the possible evolution of greenhouse gas concentrations. In the context of the fifth report of the Intergovernmental Commission on Climate Change of the United Nations [38], four possible scenarios (RCPs) have been developed for the evolution of greenhouse gas concentrations based on different possible evolutions regarding world population, economic activity, lifestyle, energy consumption, land use patterns, technology, and climate policy. In the present study, future climate estimates were based on two of the following scenarios: RCP4.5 (intermediate scenario) and RCP8.5 (drastic growth scenario of greenhouse gas emissions). The main characteristics of these scenarios are the following:

2.2.1. Scenario RCP4.5

Scenario RCP4.5 was developed by the GCAM team at the Pacific Northwest National Laboratory’s Joint Global Change Research Institute (JGCRI) in the United States. This is a stabilization scenario in which the energy balance of the atmosphere stabilizes after 2100, without exceeding the long-term goal [39]. This scenario takes into account the expectation that reforestation programs will be implemented and that changes will be made to the arable land. In addition, methane emissions are expected to be stable, while CO2 emissions are allowed to increase slowly until 2041 and then start decreasing. RCP4.5 represents a general reduction in energy consumption and fossil fuel use, while assuming an increase in renewable energy sources and nuclear energy use [40].

2.2.2. Scenario RCP8.5

Scenario RCP8.5 was developed using the MESSAGE model and the Integrated Assessment Framework of the International Institute for Applied Systems Analysis (IIASA) in Austria. This scenario is characterized by increasing greenhouse gas emissions, leading to high levels of greenhouse gas concentrations [41]. It represents a future situation in which greenhouse gas reduction policies will not be implemented and methane and nitrous oxide emissions will increase rapidly by the end of the century. Land use will increase due to the growing population as well as the use of fossil fuels for energy production and transportation [42].
For each scenario, the results of high spatial resolution simulations (of the order of 11 × 11 km) of the EURO-CORDEX program (https://euro-cordex.net/ (accessed on 2 April 2021)) were used in the present study, which cover, in a daily time analysis, a continuous time period from 1970 to 2100. The simulations used were performed with the regional climate model RCA4 [43]. By using initial and boundary conditions from the global climate model MPI-ESM-LR [44], the daily values of the following climatic parameters were extracted: temperature (mean maximum, minimum), precipitation, relative humidity, solar radiation, and wind speed for the reference period 1981–2000 as well as for two future periods: 2041–2060 (near future) and 2081–2100 (distant future).

2.3. Land Desertification Assessment

The Environmentally Sensitive Areas (ESAs) to desertification were identified for each study period using the methodology developed in the EU-funded research project MEDALUS III (Mediterranean Desertification and Land Use) [5]. According to this methodology, four classes of land sensitivity to desertification were defined (written in the order of increasing sensitivity on desertification): “non-affected” (N), “potentially affected” (P), “fragile” (including the subtypes F1, F2, F3), and “critical” (including the subtypes C1, C2, C3).
The ESAs methodology is based on a comprehensive analysis of 15 variables and a two-phase computational approach. All the variables are grouped according to four ‘qualities’: climate, soil, vegetation, and management. The latter quality is intended as ‘degree of human induced stress’ [5]. In the first step, values of the corresponding variables were appended to each elementary map unit area, classified according to a variable/score classification system, and a generalized evaluation was carried out to produce the four quality indicators (soil quality, SQI; vegetation quality, VQI; climate quality, CQI; and management quality, MQI). Each of the four quality indicators was estimated as the geometric mean of the respective scores of its pertinent variables. The elementary map unit area in the present work corresponded to the Soil Mapping Unit (SMU) area, according to the Greek soil mapping system [45]. In the second step, the environmental sensitivity of each SMU was derived by computing the geometric mean of the four quality indicators.
By using this methodology, the effect of simulated future climate scenarios on desertification was examined, and therefore all other qualities, except climate quality, were considered unchanged over time and the same as those prevailing in the present situation. Specifically, as representative of the present state of soils, the soil map of Thessaly, part of the current soil map of Greece [32], was used. Although there was a lack of officially available soil data of the three study sites for the reference period, the issue was addressed as follows. Considering that the soil data required by the method, which were cartographically recorded according to the current Greek soil mapping system [45], refer to soil properties that do not change easily over time [46], the state of soils in the reference period was assumed to be the same as that of the present situation. SQI was calculated based on the soil properties mapped in the study sites, and soil properties that finally synthesized SQI were parameterized according to the methodology suggestions [5] (Table 1).
The climate quality was assessed using monthly mean precipitation, aridity index, and slope aspect. The corresponding climatic data have been received from the Academy of Athens, both for the reference period 1981–2000 and for the future time periods (RCP4.5, RCP8.5). The aridity index was assessed as the ratio of annual mean precipitation over mean annual potential evapotranspiration (ETo) [25,47]. Annual potential evapotranspiration was calculated by the procedure described by Allen et al. [48], according to the FAO Penman–Monteith method [49]. Due to the almost-level to gently-undulating soil slopes of the study sites, a weighted value of 1 was attributed to slope aspect according to Prăvălie et al. [21] classification. Parameters and data used for producing CQI are presented in Table 2.
Vegetation quality was assessed based on the main annual cropping system of cereals and cotton prevailing in the study site regions, as justified by producers’ single aid applications for the year 2018 derived from geodata of the Greek Payment Authority of Common Agricultural Policy that were used in the context of a recent national project [50] (Table 3).
The weakness of an adequate integration of the crucial to desertification socio-economic characteristics in the MQI factor has been highlighted by some authors [51,52]. Indeed, the larger the scale of observation, the more difficult it becomes to reliably assess desertification risk via ESAs methodology while evaluating, at the same time, the appropriate socio-economic parameters [15,23], mainly due to lack of statistical data. In the context of the above-mentioned restrictions and based on the current cultivation practices of most of the agricultural fields of each study site, which were identified during on-site visits in the past, the following values of the MQI parameters were assigned (Table 4).

2.4. Tillage and Water Soil Erosion Assessment

Tillage erosion is caused by the mechanical treatment of the soil with cultivation tools, considered as important or even more important than water erosion for the sloping land of the study area [30,53]. Soil displacement (Qs, kg m−1) during tillage erosion is considered as a soil diffusion process, linearly related to plowing depth (D, m), soil bulk density (BD, kg m−3), slope of the soil surface (G, %), and the diffusion coefficient (B), according to Equation (1) [54]:
Q s = D × B D × G × B  
In the present study, it was considered that the agricultural machine plows parallel to the slope, with a plowing depth of 0.20–0.25 m. The mean value of soil bulk density was considered to be 1200 kg m−3, which is an average value for the Greek agricultural soils [32]. Based on topographic maps, the slope of the soil surface was estimated as the average slope of the SMU. Coefficient B value was calculated from the slope of the linear regression curve between the soil displacement and the slope of the soil surface for a plowing depth of 0.20–0.25 m, receiving the value 0.54 [53].
Based on a 30 m detailed Digital Elevation Model (DEM), derived from NASA’s Shuttle Radar Topography Mission (SRTM) satellite data (available at: https://www2.jpl.nasa.gov/srtm/ (accessed on 7 April 2021)), the area of each SMU was divided into grids of 20 × 20 m, and the shape of each square was estimated in terms of curvature based on the relief of the surface. For each square, the difference between the loss of soil material in the lower square and the addition of soil material from the upper square was calculated based on the above equation. In grids with a convex or a straight surface, the result after plowing was usually the loss of soil material, while in grids with a concave surface the final result was the addition of soil material. The decrease or increase of soil depth (h) at a location was calculated from Equation (2) [30]:
h = W S × B D  
where W is the weight of the soil in kg and S is the area calculated in m2. Finally, for practical reasons, the average soil loss in each SMU per time period was estimated.
The assessment of soil water erosion was made by applying an empirical equation obtained from soil erosion experiments in areas cultivated with cereals using the Equation (3) [55]:
S o i l   l o s s   g m 2 y r 1 = 12.7 + 0.046 R + 0.000083 R 2  
where R is the annual precipitation in mm. Based on the above equation and using the annual precipitation of each study period, the total soil loss in cm was calculated separately for each study area.

2.5. Soil Salinization Risk Assessment

In the present study, only the primary salinization has been assessed and exclusively for the study site of Sotirio, where the conditions of soil degradation due to primary salinization are mainly met because soil drainage is insufficient. Individual indicators related to the natural environment or socio-economic characteristics are used to assess the salinization risk using the SR index. Specifically, the following algorithm was used (Equation (4) [56,57]:
S R = 0.224 + 0.225 E T o + 0.346 W Q + 1.497 G W E + 0.413 D R 0.295 F F + 0.152 F O + 0.297 D F S + 0.836 I P A L 0.573 P D
where ETo = potential annual evapotranspiration (mm of water), WQ = quality of irrigation water (μS), GWE = degree of groundwater utilization, DR = soil drainage, FF = flood frequency (time), FO = land ownership status, DFS = distance from shoreline (km), IPAL = percentage of irrigated agricultural land, and PD = population density (people/km2).
The following values of variables were used to apply the above algorithm. Potential evapotranspiration (ETo) was calculated by the procedure described by Allen et al. [48] and defined as the mean of each study period in millimeters. Based on water analytical data of the local municipality (available online: https://deyakileler.gr/per-balon-po-otita/elegxos-poiotita-nerou/apotelesmata-poiotikoy-elegxou (accessed on 30 April 2021)), water quality (WQ) was estimated in terms of electrical conductivity values, taken as 400–800 μS/cm for the period 1981–2000. Water quality is expected deteriorate due to predicted climate change; therefore, electrical conductivity was considered as greater than 1500 μS/cm for the periods 2041–2060 and 2081–2100. Groundwater exploitation (GWE) was characterized as minor for the period 1981–2000 [58], and as moderate over-exploitation for the two future periods. Soil drainage (DR) was estimated from the soil map of the area [32], and it was considered the same for all study periods. Flood frequency (FF) was estimated to be rare in the area with an incidence of 1 per 10 years for all periods [58]. Ownership status (FO) was considered as the producer’s individual property for all periods [50]. Distance from shoreline (DFS) was measured from the topographic map, derived from the DEM. The percentage of irrigated agricultural land (IPAL) was higher than 50% for the period 1981–2000 [50] and 25–50% for the future periods due to expected partially shifting to winter crops based on the Greek National Action Plan for combatting desertification [59]. Based on the Greek population census of 2001 (available online: https://www.statistics.gr/el/statistics/-/publication/SAM04/2001 (accessed on 30 April 2021)), population density (PD) in the wider area was recorded at 50–100 people per square kilometer and was considered the same for the period 1981–2000 and stable in the future.

3. Results

3.1. Simulated Meteorological Data

3.1.1. Air Temperature

Table 5 shows the mean maximum and minimum air temperature of the study sites for the twenty-year periods 2041–2060 and 2081–2100, simulated by the RCP4.5 and RCP8.5 scenarios. The simulated data were compared with those of the historical reference period 1981–2000, for the meteorological stations of Larisa (Zapeio and Sotirio sites) and Trikala (Trikala site). The simulated data by the scenario RCP4.5 showed an increase in the mean maximum air temperature by 1.7, 2.4 and 3.4 °C for the Sotirio, Zappeion, and Trikala study sites, respectively, referring to the twenty years period of 2041–2060. Similarly, increases in mean maximum air temperature of 2.0, 2.6, and 3.6 °C were predicted for the Sotirio, Zappeion, and Trikala study sites, respectively, for the time period of 2081–2100. Furthermore, the scenario RCP8.5 predicted an increase in the maximum air temperature by 2.4, 3.1, and 4.0 °C for the Sotirio, Zappeion, and Trikala study sites, respectively, for the period 2041–2060. In addition, an increase of 5.0, 5.8, and 6.8 °C in the maximum air temperature was predicted for the Sotirio, Zappeion, and Trikala study sites as far as the time period of 2081–2100 is concerned.
The simulated mean minimum air temperature by the scenario RCP4.5 for the time period 2041–2060 predicts an increase by 1.1 and 1.7 °C for the Sotirio and Zappeion study sites, respectively, and a decrease by 0.3 °C for the Trikala site, while for the time period 2081–2100 an increase is predicted of 1.3, 1.9, and 0.0 °C for the same sites, respectively. The scenario RCP8.5 predicts an increase in the minimum air temperature by 1.8, 2.3, and 0.4 °C for the Sotirio, Zappeion, and Trikala study sites, respectively, for the twenty year period of 2041–2060. Similarly, an increase is predicted of 4.3, 4.9, and 3.0 °C, respectively for the same sites, for the time period 2081–2100.

3.1.2. Annual Precipitation

The used scenario RCP4.5 predicts a small reduction in precipitation by 19.0 mm (4.6%) in Sotirio and a large reduction in the Trikala study site by 358.3 mm (50.6%) for the period 2041–2060, compared with the reference time period 1981–2000. On the contrary, in the Zappeion study site, it is expected to increase by 27.7 mm (6.6%) (Table 6). Furthermore, the same scenario predicts, for the time period of 2081–2100, a decrease in Sotirio by 21.2 mm (5.1%) and in the Trikala study site by 352.3 mm (49.8%), while an increase of 57.3 mm (13.8%) is expected for the Zappeion site. Concerning the RCP8.5 scenario, reductions were foreseen in all three study sites for both future time periods. In particular, for the period 2041–2060, reductions of 72.0 mm (17.3%), 19.8 mm (4.8%), and 383.4 mm (54.2%) were predicted for the Sotirio, Zappeion, and Trikala study sites, respectively. The corresponding reductions for the three study sites for the period 2081–2100 were 120.6 mm (29.0%), 79.8 mm (19.2%), and 459.0 mm (64.9%), respectively.

3.2. Assessing Desertification Risk

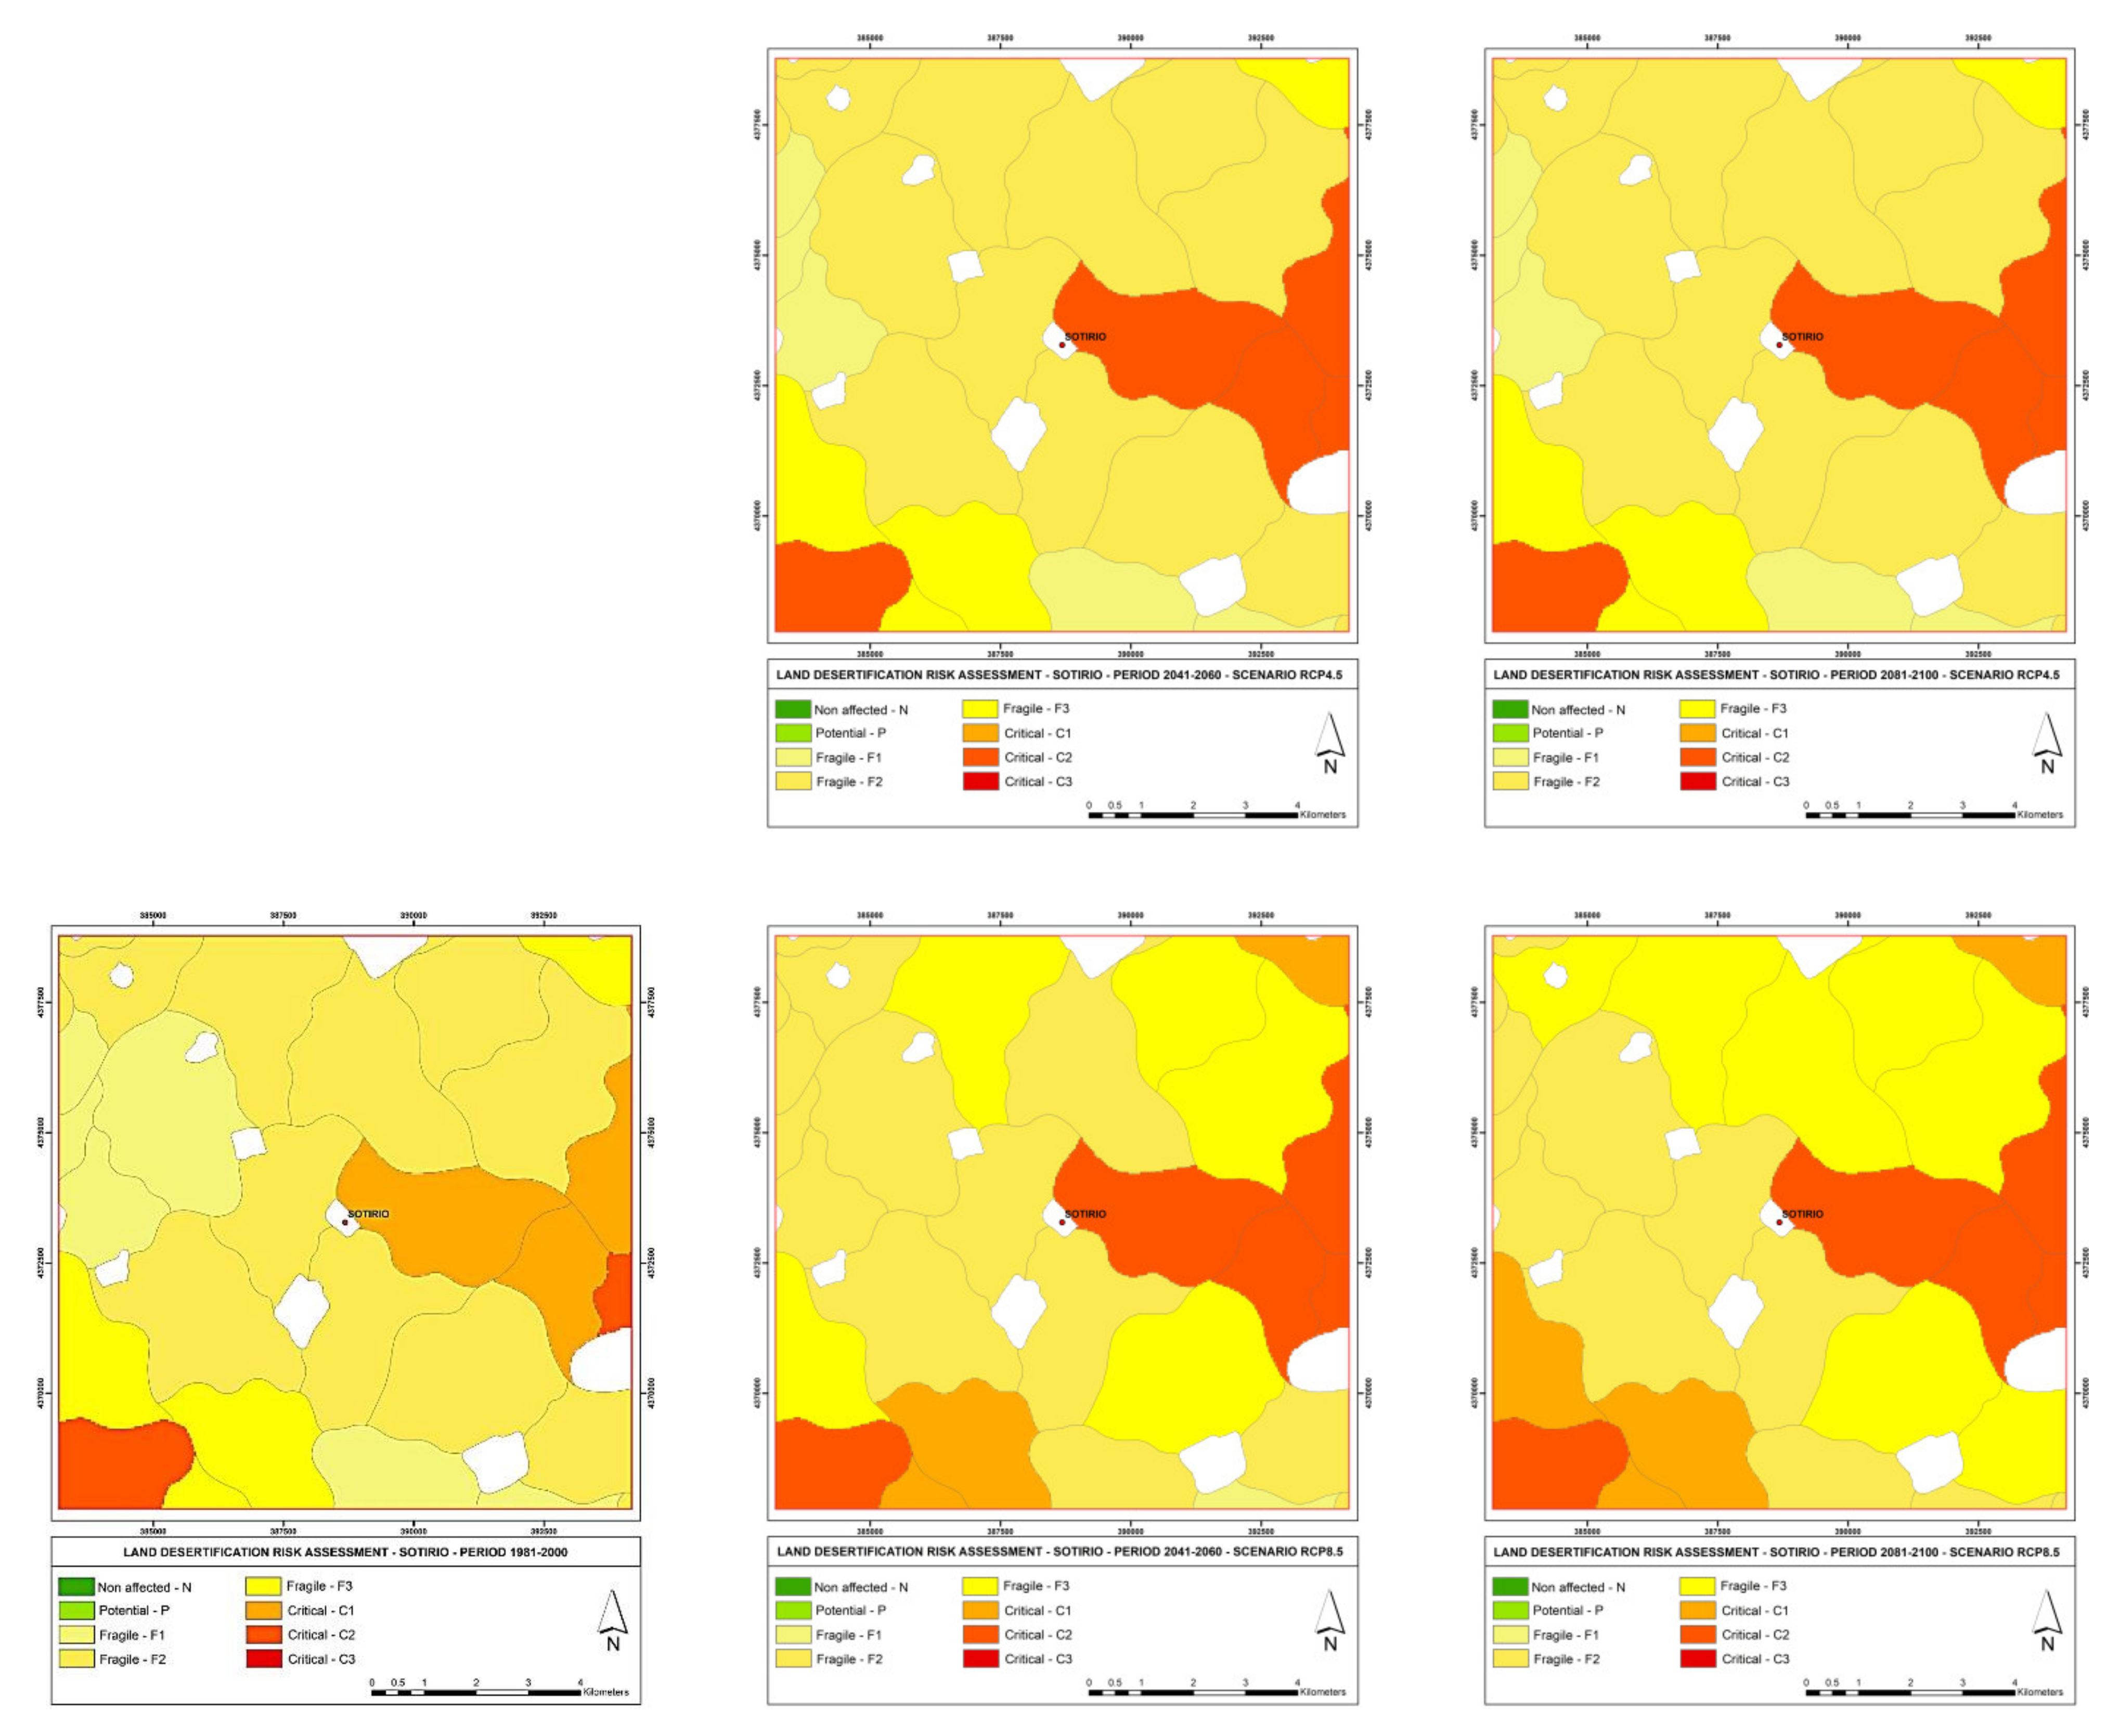
3.2.1. Sotirio Study Site

In the historical reference period, the majority of the SMUs of the Sotirio study site were characterized as “fragile” (subclasses F1–F3) in a percentage of 84%, while the rest of the area (16%) was defined as “critical” to desertification (subclasses C1–C2) (Figure 2). Based on the climate change prediction by the RCP4.5 scenario for the time period 2041–2060, the SMUs that were defined as “critical” subclass C1 in the reference period are expected to be degraded to “critical” subclass C2, while a small part of them is expected to change from “fragile” subclass F1 to “fragile” subclass F2. Overall, the percentage of soils in the “critical” C2 class is expected to increase to 16% of the study area (compared to 4% in the reference period), and those SMUs characterized as “fragile” subclass F2 are foreseen to increase to 64% from 57% in the reference period. No change in desertification risk is expected for the period 2081–2100 compared to the period 2041–2060.
Concerning the scenario RCP8.5 for the periods 2041–2060 and 2081–2100, in comparison with the reference period, a degradation on desertification is expected in both time periods. Specifically, SMUs that were characterized as: (a) “critical” subclass C1 in the reference period are expected to shift to “critical” subclass C2, (b) “fragile” subclass F2 in the reference period are expected to shift to “fragile” subclass F3, and (c) “fragile” subclass F3 in the reference period are expected to shift to “critical” subclass C1 in the time period 2041–2060 (Figure 2). Overall, the percentage of soils in the “critical” subclass C2 is expected to increase from 4% in the reference period to 16% of the study area in the period 2041–2060, while the subclass “fragile” subclass F3 will increase from 11% to 29%. In addition, SMUs characterized as “fragile” subclass F1 in the reference period are expected to decrease from 16% of the study area to 1% in the time period 2041–2060 and the subclass “fragile” F2 is expected to decrease from 57% to 47%.
The comparison of desertification risk between periods 2041–2060 and 2081–2100 shows that no change in the “critical” C2 class is expected. In addition, an increase is expected in both “critical” C1 from 7% of the examined area to 11% and “fragile” F3 from 29% to 39% in the latest time period. In contrast, a decrease is expected in the “fragile” F2 from 47% to 34%.

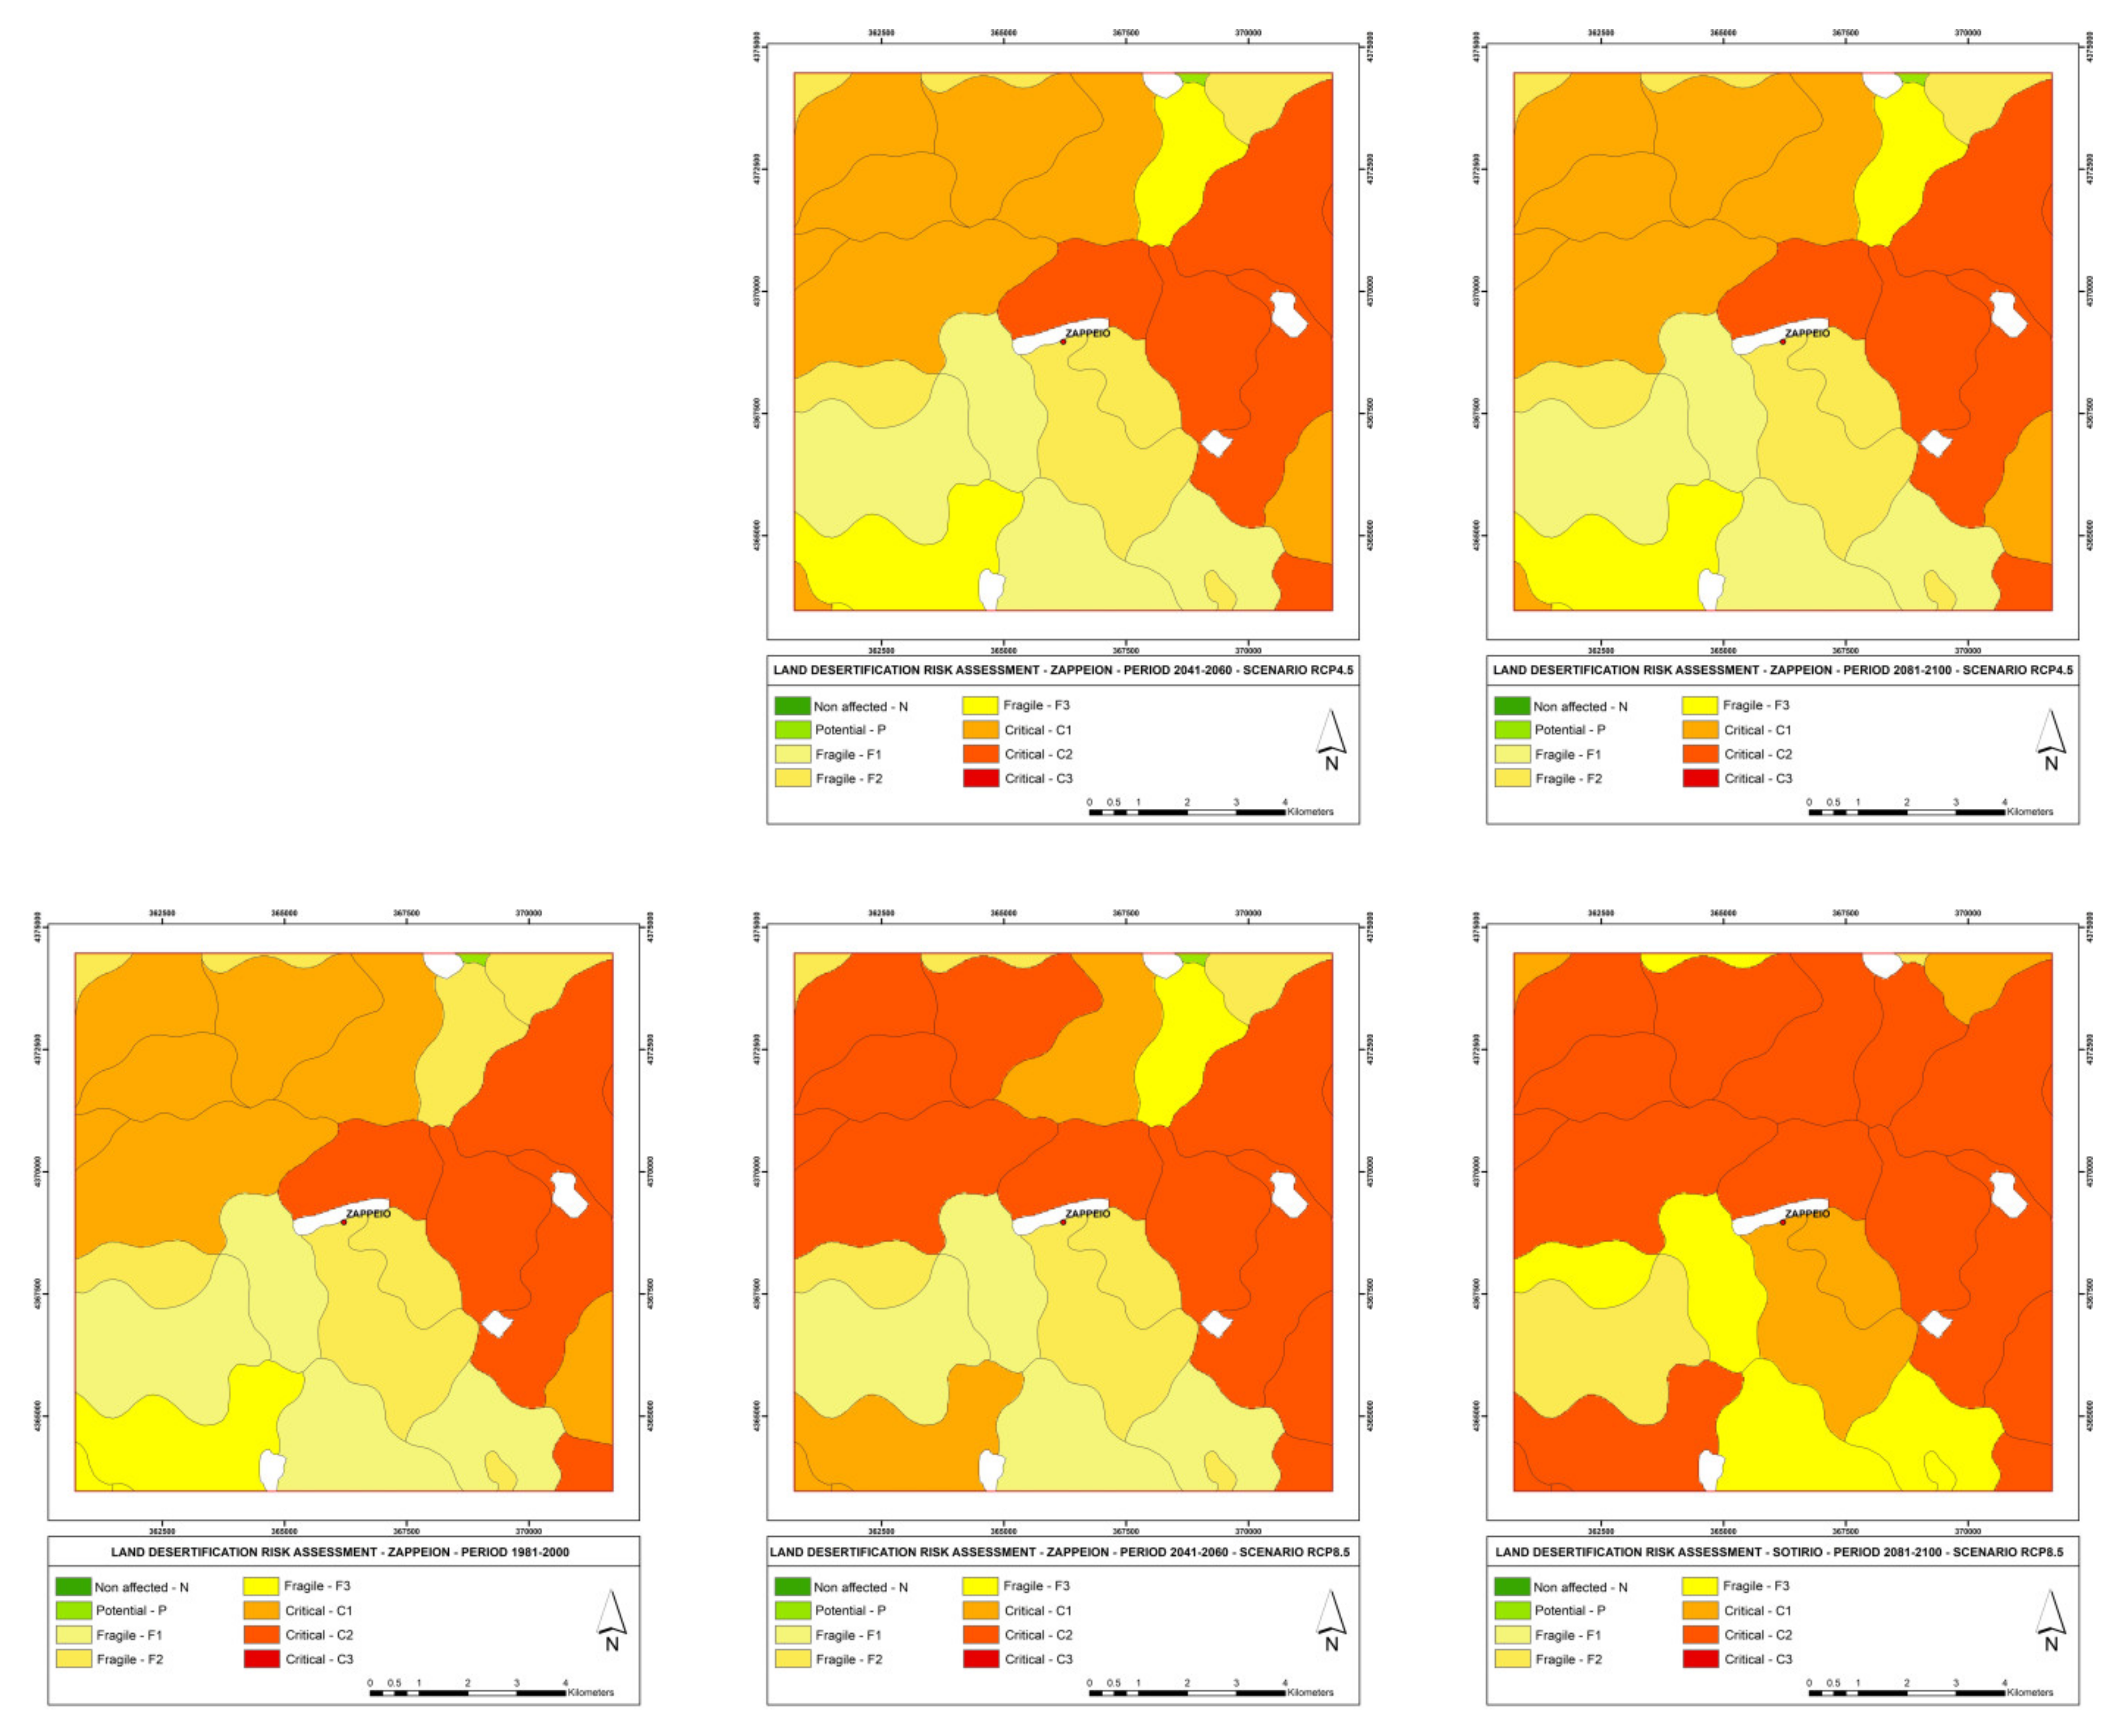
3.2.2. Zappeion Study Site

Regarding the reference period 1981–2000, there are several SMUs defined as “critical” in subclasses C1 and C2, covering an area of 31% and 24%, respectively, of the Zappeion study site (Figure 3). Based on the predicted meteorological data by the scenario RCP4.5 for the period 2041–2060 and compared to the reference period, the obtained results predict degradation of only one “fragile” SMU from subclass F2 to F3. This simulation data predicts an increase in the percentage of subclass F3 from 7% of the study site in the reference period to 10% with a corresponding decrease in subclass F2 from 17% to 14%. For the period 2081–2100, no change in the vulnerability of SMUs is predicted compared to the time period of 2041–2060.
By considering the scenario RCP8.5 and comparing the time period 2041–2060 with the reference period, it can be inferred that there will be a further degradation in a large number of SMUs. Several SMUs classified as “critical” belonging to subclass C1 are downgraded to subclass C2 and one “fragile” SMU belonging to subclass F2 is downgraded to “fragile” subclass F3. The condition is expected to worsen significantly in the following study period of 2081–2100 compared to the reference period. The percentage of the “critical” subclass C2 is expected to be doubled from an area of 24% of the study site to 49%. Furthermore, in the time period 2081–2100, as compared to the period 2041–2060, three “fragile” SMUs are expected to be downgraded from subclass F2 to F3, and two additional SMUs are expected to be degraded from “critical” subclass C1 to subclass C2.

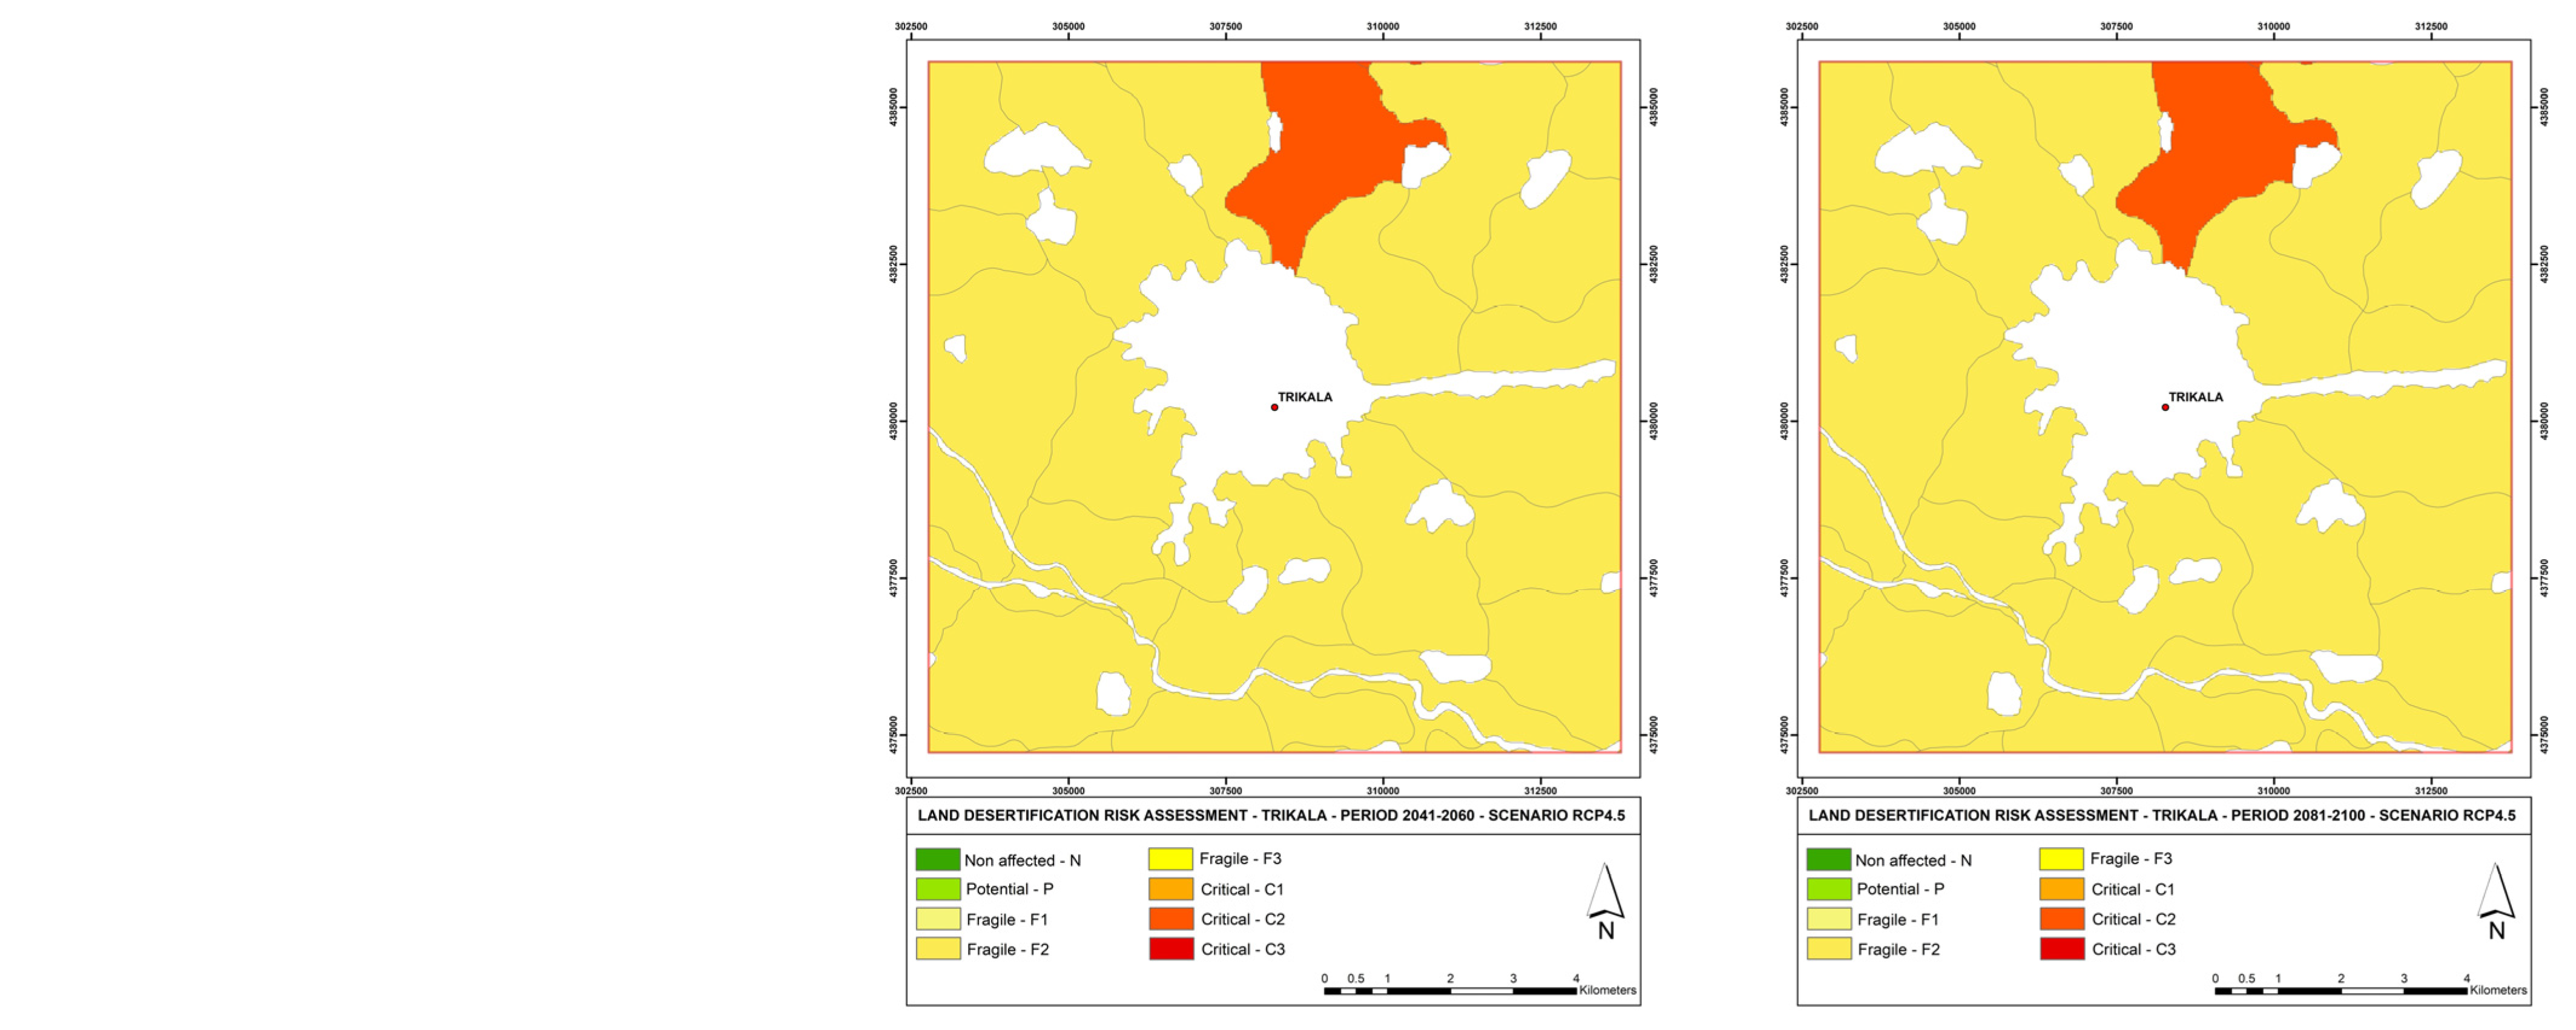
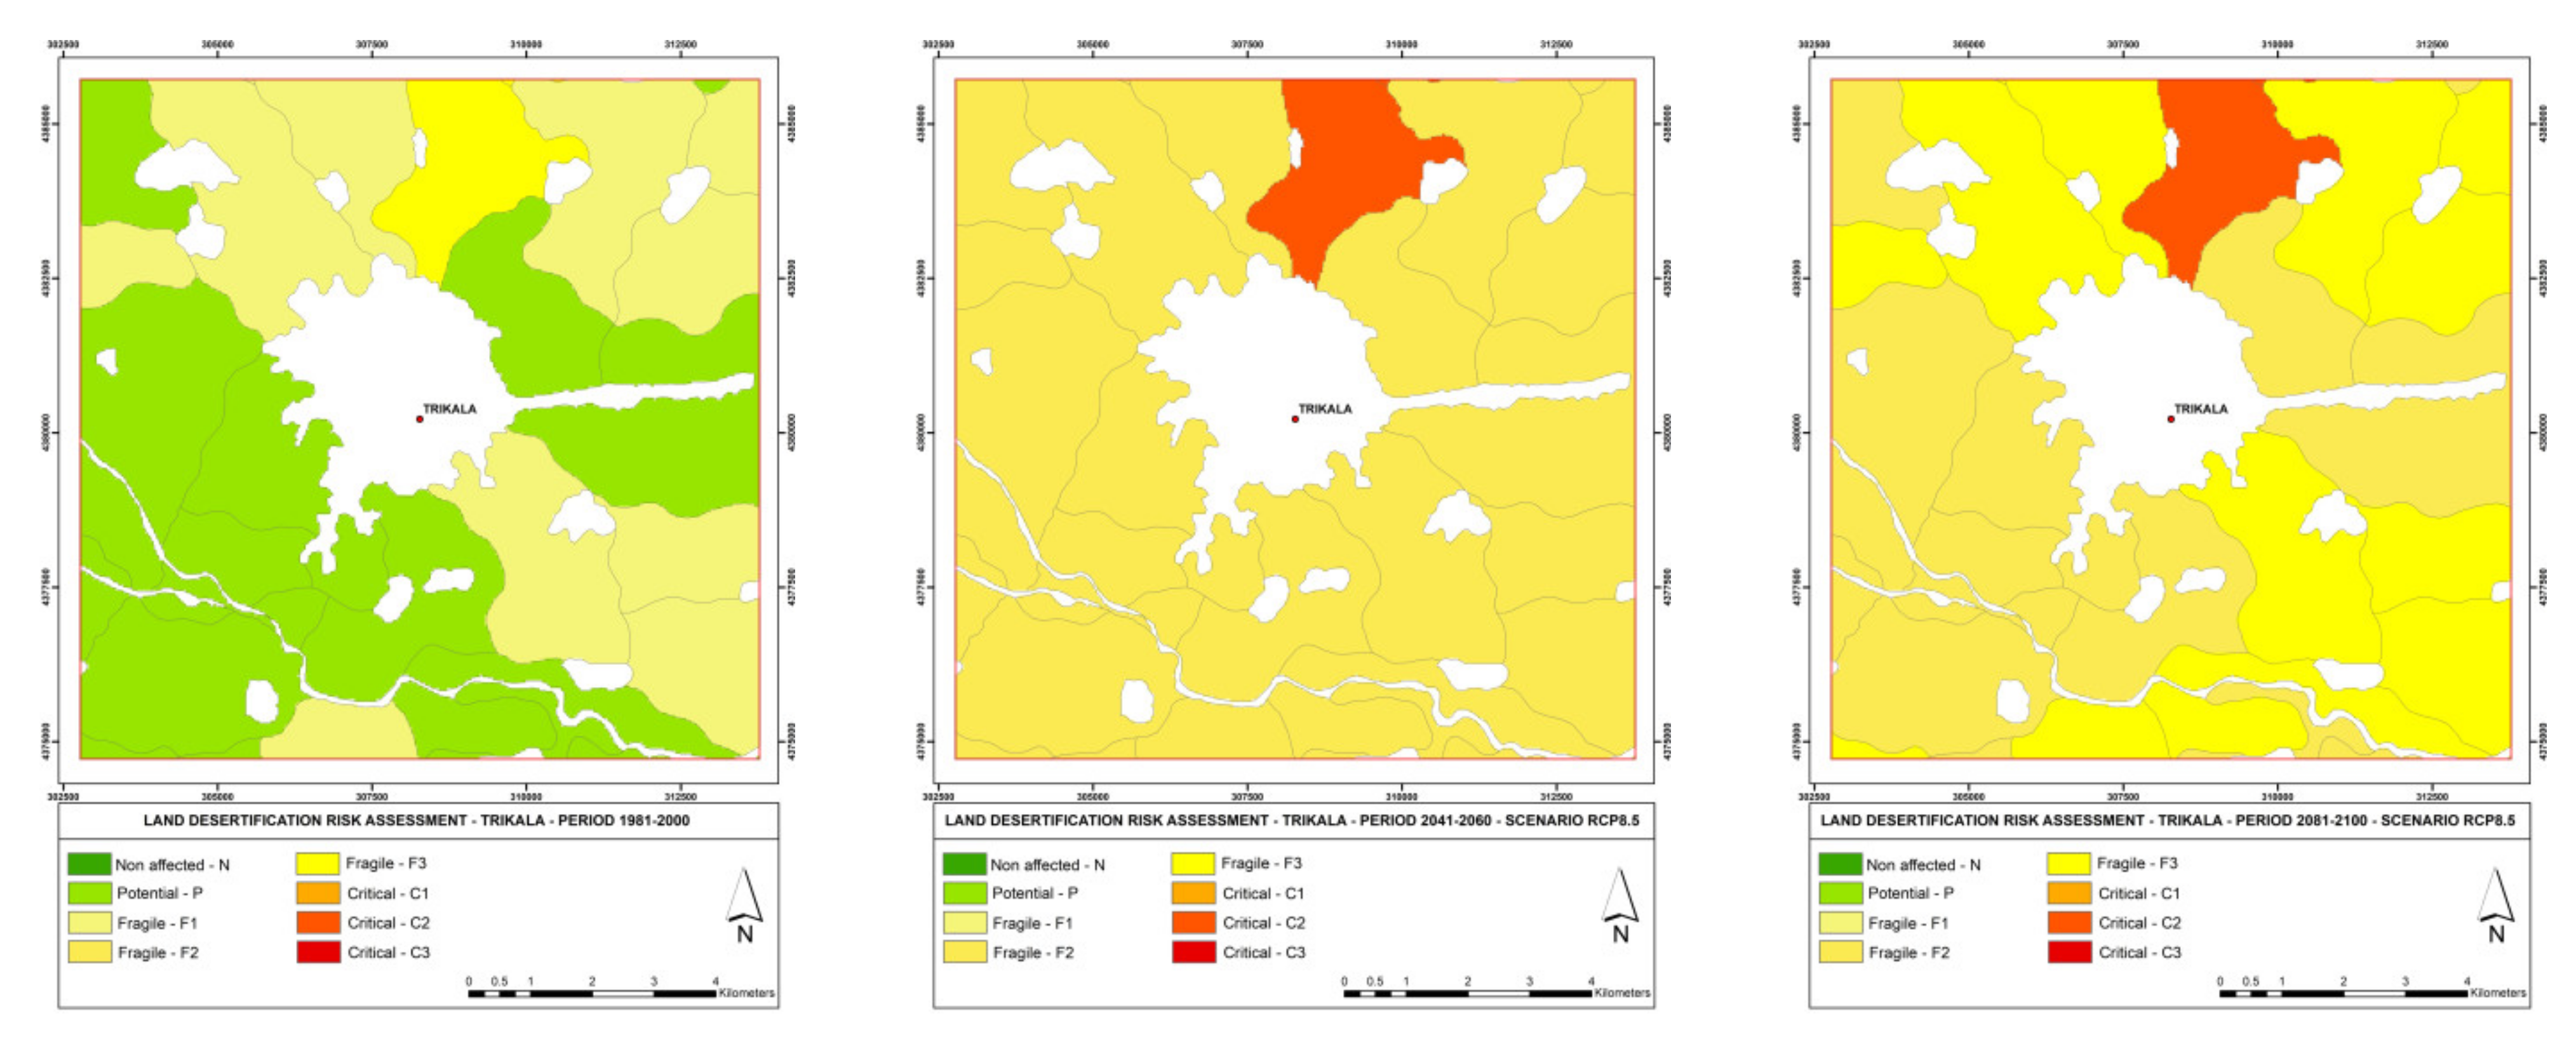
3.2.3. Study Site of Trikala

Data for the reference period show a percentage of soils greater than 50% belonging to the class “potentially affected” and a major part of the remaining study area to the class “fragile”, subclass F1. By using the meteorological data of simulation scenario RCP4.5 for the period 2041–2060 and compared to the reference period, a significant degradation in desertification is expected. SMUs characterized as being of “potential affected” and “fragile” subclass F1 in the reference period are expected to shift to “fragile” subclass F2 in the period 2041–2060, while the prediction for the only SMU that was characterized as “fragile” subclass F3 is changed to subclass C2 (Figure 4). The relative distribution is 5% for subclass C2 and 95% for subclass F2. The assessed desertification risk is expected to remain unchanged for the period 2081–2100.
Concerning the scenario RCP8.5, the predicted desertification risk for the time period 2041–2060, as compared to the reference period, is identical with the predictions of RCP4.5 for both periods, described above. In the time period 2081–2100, the degradation of thirteen SMUs is foreseen by shifting from “fragile” subclass F2 to subclass F3. These data formulate the distribution percentages, compared to the period 2041–2060, as follows: 5% for subclass C2, 46% from 0% for subclass F3, and 49% from 95% for subclass F2.

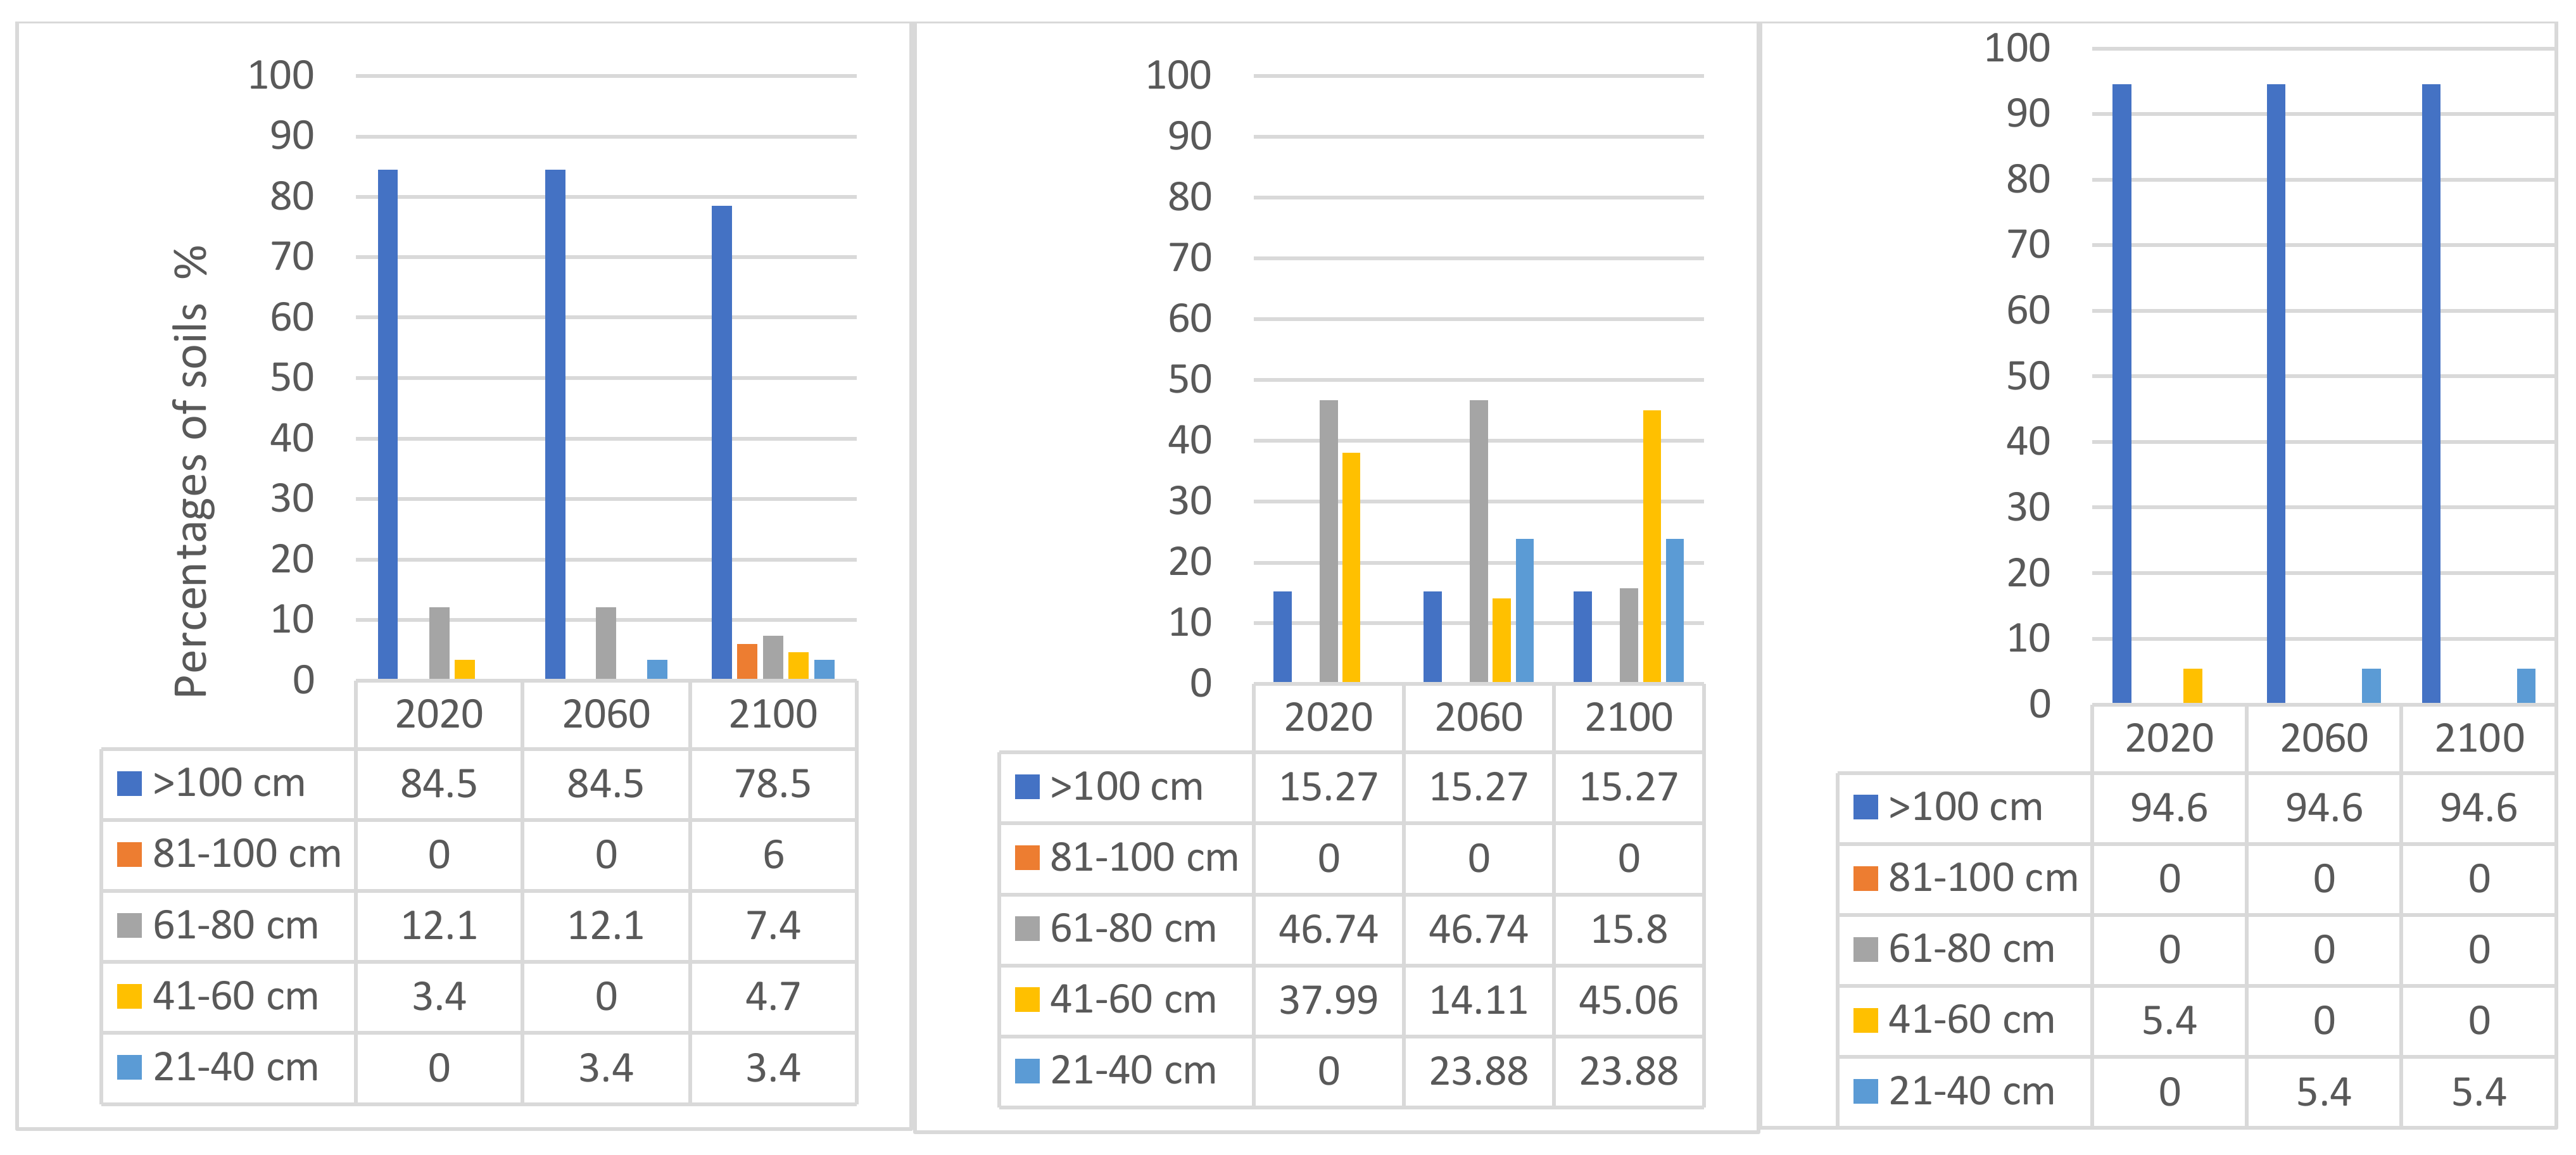
3.3. Assessment of Changes in Soil Depth

Tillage and water erosion on sloping surfaces result in soil movement from uphill, reducing the depth of the solum at the highest points and causing soil accumulation downhill. Figure 5 shows the comparative proportions of the areas of the SMUs according to the soil depths, divided into five classes: very deep (depth >100 cm), deep (depth 81–100 cm), moderate deep (depth 61–80 cm), shallow (depth 41–60 cm), and very shallow (depth 21–40 cm). The data from Figure 5 refer to three time milestones: 2020 (present), 2060, and 2100. The comparisons between the three time milestones assess the expected changes in soil depths as a result of the combined actions of tillage and water erosion. It should be noted that no differences are foreseen between the RCP4.5 and RCP8.5 emission scenarios for 2060 and 2100.
Based on the present soil data, there are remarkable differences between the three study sites, as a result of their different relief. Thus, in the Zappeion study site, which is characterized by a large proportion of sloping areas, soils with depth deeper than 100 cm cover an area of less than 20%, while soils characterized as moderate deep and shallow occupy 38% and 47% of the area, respectively. In contrast, in the Trikala study site, where the area is almost flat, soils are characterized as very deep in a percentage over 90%. In the Sotirio study site, where there is a small percentage of sloping areas, soils characterized as very deep cover 84.5%, while soils classified as moderate deep and shallow occupy 12.1% and 3.4% of the area, respectively (Figure 5).
No changes are foreseen in soils characterized as very deep for all study sites between the two milestones of 2020 and 2060. This is attributed to the limited or nil erosion predicted for these soils because they are almost flat. Furthermore, a decrease in the areas with soils characterized as moderate deep and shallow is predicted due to water and tillage erosion, while an increase in areas with very shallow soils is foreseen for all study sites (Figure 5).
As far as the next two examined milestones of 2060 and 2100 are concerned, the percentages of soils characterized as very deep will remain unchanged for the Trikala and Zappeion study sites, while a decrease of 6% is assessed for this soil class in the Sotirio study site, with the corresponding soils moving to the lower soil depth class of 81–100 cm. In both study sites of Zappeion and Sotirio, soils presented a tendency of moving to a lower soil depth class due to soil erosion.

3.4. Soil Salinization Risk Assessment

Among the three study sites, only the soils of Sotirio may be considered as subjected to risk of primary salinization due to poor drainage soil conditions. As Figure 6 shows, the existing SMUs are affected by a low or moderate salinity risk during the reference period. Conversely, the same SMUs are expected to fall into high and very high risk of salinization for both periods 2041–2060 and 2081–2100. However, SMUs that are not at risk during the reporting period are not expected to be adversely affected by the end of the century, because drainage conditions are not expected to change. It should be noted that there was no difference in the estimates for the periods 2041–2060 and 2081–2100 between the scenarios RCP4.5 and RCP8.5.
SMUs that are not at risk of salinization in the reference period (1981–2000) occupy 40.6% of the study area and remain in the same category until 2081–2100. The SMUs that, in 1981–2000, were at low risk of salinization constituted 13.2% of the total area. The salinization risk of these soils is downgraded by two classes in the period 2041–2060, categorized in the high class of evaluation (Figure 6). The SMUs that were at moderate salinization risk in the period 1981–2000 constituted 46.2% of the total area and are expected to be downgraded by two classes of very high-risk of salinization in the time period 2041–2060.

4. Discussion

Land degradation is a major contributor to climate change, and climate change is foreseen as a leading driver of land degradation. Thessaly, one of the major agricultural areas of Greece, is mainly characterized as being vulnerable to soil erosion in the sloping areas and to soil salinization in the plain areas with poorly drained soils [32,60]. Furthermore, under the prevailing semi-arid climate conditions, soil status, and the present land management characteristics, desertification becomes a major issue for the area. In addition, any climate distortion to drier and warmer conditions will lead to higher vulnerability to desertification because the majority of the land is characterized as sensitive to desertification.
The applied scenarios of climate change predicted a decrease in precipitation in some areas, which is expected to reach up to 64.9% by the end of this century. In addition, mean maximum temperature is expected to increase up to 3.4 °C according to the climatic scenario RCP4.5 and up to 4.0 °C according to the scenario RCP8.5 for the time period of 2041–2060. Under such climatic conditions, desertification risk is expected to increase, especially in the sloping areas, such as Zappeion, which is characterized by relatively moderate to shallow soils subjected to water and tillage erosion. To our knowledge, this is the first study that combines ESAs methodology with RCPs scenarios in predicting future desertification risk trends. The predicted data showed that the percentage of the “critical” subclass C2 is expected to be doubled from an area of 24% in the reference period of 1981–2000 to 49% in the future time period of 2081–2100. In the plain areas with deep soils, the predicted climate change is expected to have a low effect on sensitivity to desertification. Some changes are expected within each class of desertification, especially by shifting from subclasses of lower sensitivity to subclasses of higher sensitivity to desertification. Generally, these results are in accordance with the findings of Tatsumi et al. [61] and Balkovič et al. [62] for Eastern Europe, regarding the predicted reductions in wheat yields for the future periods of 2090–2099 and 2041–2060, respectively. Additionally, a recent study [63] characterized Thessaly as a “climate-loser” region as far as cotton future (2021–2050) yields are concerned, in the case of irrigation water supply not continuing to be available due to the expected reduction in precipitation.
Based on the proposed empirical equation for assessing soil erosion by surface water runoff in annual crops, the predicted decrease in annual precipitation is expected to mitigate soil losses, therefore causing lower reduction in soil depth in the future time periods, compared to present climatic conditions. However, this lies under the uncertainty of extreme precipitation events that can occur in the context of the expected climate distortion/change inducing high erosion rates, which cannot be foreseen by the applied climate scenarios. Water erosion is quite important for the study area, because Thessaly was ranked in the 9th position of the 14 water districts of Greece based on the soil erosion rates by water in 2016 [64]. However, measurements on tillage erosion in the area have shown that loss of soil by cultivation instruments is much more important [30]. Published experimental data from Larisa, the capital of the Thessaly region, have shown that ploughing in cotton fields significantly increased soil loss [65]. Measurements in a certain site (Nikea, Thessaly) have shown that, after the introduction of the tractor for cultivating the land from 1960 until 2000, a soil loss of 30 cm was mainly caused due to tillage erosion [30]. In all cases, any decrease in soil depth, resulting as the cumulative effect of water and tillage erosion, is expected to worsen the desertification risk of the area in the future.
Although soil erosion is a major degradation process in slopping areas, leading to desertification, soil salinization constitutes a significant degradation process of desertification in plain areas, especially in soils under poorly drained conditions. A classification that evaluated electrical conductivity among other parameters, categorized groundwater in a significant part the area as of moderate quality [66], while Papaioannou et al. [67] considered salination as a potential problem of the region. The condition of primary soil salinization is expected to significantly worsen in the study time periods 2041–2060 and 2081–2100, compared to the reference period. The predicted reduction in annual precipitation and increase in potential evapotranspiration is expected to favor primary soil salinization by reduced downward leaching of salts in the wet period and increased upward water movement from groundwater and deposition of salts on the surface soil layer during the dry period of the year. Based only on the hydromorphic characteristics of the soil (permanent water table at a depth of less than 150 cm from the soil surface), soils with unfavorable drainage conditions, exposed to a high risk of salinization in Thessaly, cover a total area of 31,386.7 ha (or 7.8% of the soils) [32]. These soils are located mainly in the eastern part of Thessaly in the lake Karla area, as well as in the area between Trikala and Larissa, in a zone mainly along the Pinios river and in scattered smaller places in this region.

5. Conclusions

The European Union recognizes the important role of protecting land and soil towards strengthening the resilience of European agriculture to climate change [68]. Land degradation and desertification is a major issue for the Mediterranean region. Based on the Greek National Action Plan on desertification [59], approximately 34% of Greek territory, and especially the eastern part of the country, in which Thessaly is included, is characterized as subjected to high desertification risk. Among the most important factors affecting land degradation and desertification is climate. The applied characteristic RCPs predicted increased drought due to decreased precipitation and high evapotranspiration, as well as increased minimum and maximum air temperatures. Under these climatic conditions, the vulnerability of the land to degradation and desertification is expected to increase. The simulated data on desertification predicted that a significant part of the marginal slopping lands, defined as “fragile” under the present environmental conditions and land management practices, will shift to “critical” areas to desertification in the near future. In addition, the degradation processes of soil erosion and soil salinization will be exaggerated by the worsening climatic conditions, promoting desertification. Tillage erosion, a very important degradation process for sloping areas, is rather non-affected by climate change. However, if land use remains unchanged in the future, desertification will be aggravated in the study area due to applied tillage operations. Furthermore, by considering that irrigation water quality is expected to deteriorate due to the predicted climate distortion, the risk of primary salinization will become higher, enhancing the problem of desertification.
The used methodologies on soil erosion, including water and tillage erosion, soil salinization risk, and land desertification can be widely applied in soils. The equation on water erosion has been derived based on water erosion experimental data collected in study sites cultivated with annual crops and located along the EU Mediterranean region (MEDALUS EU research projects) [55]. The equations on tillage erosion that have been tested and validated in various European study sites (EU Teron research project), afterwards were used in several publications [30,53,54]. In addition, the algorithm on assessing salinization risk can be widely used on salt-affected soils because it has been derived using data from various study sites located in Europe, Africa, and China (EU DESIRE research project) [56,57]. Finally, the ESA methodology has been successfully used worldwide in several publications incorporating, in some cases, suggested modifications [10,13,18,21,24,25].

Author Contributions

Conceptualization, O.K., A.K., C.Z., and C.K.; methodology, O.K., C.K.; software, O.K., C.A. and D.V.; field supervision, C.K. and O.K. data analysis, O.K., D.V., J.K. and C.A.; writing—original draft preparation, O.K., A.K., and C.K.; writing—review and editing, O.K., C.K. All authors have read and agreed to the published version of the manuscript.

Funding

This research received no external funding.

Institutional Review Board Statement

Not applicable.

Informed Consent Statement

Not applicable.

Data Availability Statement

Data are available upon request.

Conflicts of Interest

The authors declare no conflict of interest.

References

  1. Johnson, D.L.; Watson-Stegner, D. Evolution model of pedogenesis. Soil Sci. 1987, 143, 349–366. [Google Scholar] [CrossRef]
  2. Yassoglou, N. Natural resources and desertification. In Desertification, Scientific Works of Greek Authors; Varelidis, O., Yassoglou, N., Liveris, S., Eds.; Ministry of Rural Development and Food, General Directorate of Development and Protection of Forests and Natural Environment: Athens, Greece, 2004; pp. 55–68. [Google Scholar]
  3. Klein, M.J.; Meijer, P.H.E. Principle of minimum entropy production. Phys. Rev. 1954, 96, 250–255. [Google Scholar] [CrossRef]
  4. Addiscott, T.M. Entropy and sustainability. Eur. J. Soil Sci. 1995, 46, 161–168. [Google Scholar] [CrossRef]
  5. Kosmas, C.; Ferrara, A.; Briasouli, H.; Imeson, A. Methodology for mapping Environmentally Sensitive Areas (ESAs) to Desertification. In The Medalus Project Mediterranean Desertification and Land Use. Manual on Key Indicators of Desertification and Mapping Environmentally Sensitive Areas to Desertification; Kosmas, C., Kirkby, M., Geeson, N., Eds.; European Commission: Brussels, Belgium, 1999; pp. 31–47. ISBN 92-828-6349-2. [Google Scholar]
  6. Mirzabaev, A.; Wu, J.; Evans, J.; García-Oliva, F.; Hussein, I.A.G.; Iqbal, M.H.; Kimutai, J.; Knowles, T.; Meza, F.; Nedjraoui, D.; et al. Desertification. In Climate Change and Land: An IPCC Special Report on Climate Change, Desertification, Land Degradation, Sustainable Land Management, Food Security, and Greenhouse Gas Fluxes in Terrestrial Ecosystems; Shukla, P.R., Skea, J., Buendia, E.C., Masson-Delmotte, V., Pörtner, H.-O., Roberts, D.C., Zhai, P., Slade, R., Connors, S., van Diemen, R., et al., Eds.; IPCC: Geneva, Switzerland, 2019; in press. [Google Scholar]
  7. United Nations Convention to Combat Desertification-U.N.C.C.D. United Nations, General Assembly, Elaboration of an International Convention to Combat Desertification in Countries Experiencing Serious Drought and/or Desertification Particularly in Africa, Paris, 14 October 1994. Available online: https://treaties.un.org/Pages/ViewDetails.aspx?src=IND&mtdsg_no=XXVII-10&chapter=27&clang=_en (accessed on 6 May 2021).
  8. Spooner, E.; Mann, H.S. Desertification and Development Dryland Ecology in Social Perspective; Academic Press: Cambridge, MA, USA, 1982; p. 407. [Google Scholar]
  9. World Resource Institute. The World Resources 1988–1989; Basic Books Inc.: New York, NY, USA, 1989; p. 372. [Google Scholar]
  10. Basso, F.; Bove, E.; Dumontet, S.; Ferrara, A.; Pisante, M.; Quaranta, G.; Taberner, M. Evaluating Environmental Sensitivity at the Basin Scale through the Use of Geographic Information Systems and Remotely Sensed Data: An Example Covering the Agribasin (Southern Italy). Catena 2000, 40, 19–35. [Google Scholar] [CrossRef]
  11. Kosmas, C.; Tsara, M.; Moustakas, N.; Karavitis, C. Identification of indicators for desertification. Ann. Arid. Zone 2003, 42, 393–416. [Google Scholar]
  12. Kosmas, C.; Tsara, M.; Moustakas, N.; Kosma, D.; Yassoglou, N. Environmentally sensitive areas and indicators of desertification. In Desertification in the Mediterranean Region. A Security Issue; Kepner, W.G., Rubio, J.L., Mouat, D.A., Pedrazzini, F., Eds.; NATO Security Through Science Series; Springer: Dordrecht, The Netherlands, 2006; Volume 3. [Google Scholar] [CrossRef]
  13. Sepehr, A.; Hassanli, A.M.; Ekhtesasi, M.R.; Jamali, J.B. Quantitative assessment of desertification in south of Iran using MEDALUS method. Environ. Monit. Assess. 2007, 134, 243–254. [Google Scholar] [CrossRef] [PubMed]
  14. Contador, J.F.; Schnabel, S.; Gutiérrez, A.; Pulido-Fernández, M. Mapping sensitivity to land degradation in Extremadura, SW Spain. Land Degrad. Dev. 2009, 20, 129–144. [Google Scholar] [CrossRef]
  15. Salvati, L.; Bajocco, S. Land sensitivity to desertification across Italy: Past, present, and future. Appl. Geogr. 2011, 31, 223–231. [Google Scholar] [CrossRef]
  16. Tavares, J.; Baptista, I.; Ferreira, A.J.D.; Amiotte-Suchet, P.; Coelho, C.; Gomes, S.; Amoros, R.; Reis, E.; Mendes, A.; Costa, L.; et al. Assessment and mapping the sensitive areas to desertification in an insular Sahelian mountain region Case study of the Ribeira Seca Watershed, Santiago Island, Cabo Verde. Catena 2015, 128, 214–223. [Google Scholar] [CrossRef]
  17. Vieira, R.M.S.P.; Tomasella, J.; Alvalá, R.C.S.; Sestini, M.F.; Affonso, A.G.; Rodriguez, D.A.; Barbosa, A.A.; Cunha, A.P.M.A.; Valles, G.F.; Crepani, E.; et al. Identifying areas susceptible to desertification in the Brazilian northeast. Solid Earth 2015, 6, 347–360. [Google Scholar] [CrossRef] [Green Version]
  18. Kadović, R.; Bohajar, Y.A.M.; Perović, V.; Simić, S.B.; Todosijević, M.; Tošić, S.; Anđelić, M.; Mlađan, D.; Dovezenski, U. Land sensitivity analysis of degradation using MEDALUS model: Case study of Deliblato Sands, Serbia. Arch. Environ. Prot. 2016, 42, 114–124. [Google Scholar] [CrossRef]
  19. Leman, N.; Ramli, M.F.; Khirotdin, R.P.K. GIS-based integrated evaluation of environmentally sensitive areas (ESAs) for land use planning in Langkawi, Malaysia. Ecol. Indic. 2016, 61 Pt 2, 293–308. [Google Scholar] [CrossRef]
  20. Taghipour-Javi, S.; Fazeli, A.; Kazemi, B. A case study of desertification hazard mapping using the MEDALUS (ESAs) methodology in southwest Iran. J. Nat. Resour. Dev. 2016, 6, 1–8. [Google Scholar] [CrossRef]
  21. Prăvălie, R.; Săvulescu, I.; Patriche, C.; Dumitra¸scu, M.; Bandoc, G. Spatial assessment of land degradation sensitive areas in southwestern Romania using modified MEDALUS method. Catena 2017, 153, 114–130. [Google Scholar] [CrossRef]
  22. Lahlaoi, H.; Rhinane, H.; Hilali, A.; Lahssini, S.; Moukrim, S. Desertification assessment using MEDALUS model in watershed Oued El Maleh, Morocco. Geosciences 2017, 7, 50. [Google Scholar] [CrossRef] [Green Version]
  23. Karamesouti, M.; Panagos, P.; Kosmas, C. Model-based spatio-temporal analysis of land desertification risk in Greece. Catena 2018, 167, 266–275. [Google Scholar] [CrossRef]
  24. Lee, E.J.; Piao, D.; Song, C.; Kim, J.; Lim, C.-H.; Kim, E.; Moon, J.; Kafatos, M.; Lamchin, M.; Jeon, S.W.; et al. Assessing environmentally sensitive land to desertification using MEDALUS method in Mongolia. For. Sci. Technol. 2019, 15, 210–220. [Google Scholar] [CrossRef] [Green Version]
  25. Ferrara, A.; Kosmas, C.; Salvati, L.; Padula, A.; Mancino, G.; Nolè, A. Updating the MEDALUS-ESA framework for worldwide land degradation and desertification assessment. Land Degrad. Dev. 2020, 31, 1593–1607. [Google Scholar] [CrossRef]
  26. Plaiklang, S.; Sutthivanich, I.; Sritarapipat, T.; Panurak, K.; Ogawa, S.; Charungthanakij, S.; Maneewan, U.; Thongrueang, N. Desertification assessment using MEDALUS model in upper Lamchiengkrai watershed, Thailand. ISPRS Int. Arch. Photogramm. Remote Sens. Spat. Inf. Sci. 2020, XLIII-B3-2020, 1257–1262. [Google Scholar] [CrossRef]
  27. Uzuner, Ç.; Dengiz, O. Desertification risk assessment in Turkey based on environmentally sensitive areas. Ecol. Indic. 2020, 114, 106295. [Google Scholar] [CrossRef]
  28. Afzali, S.F.; Khanamani, A.; Maskooni, E.K.; Berndtsson, R. Quantitative Assessment of Environmental Sensitivity to Desertification Using the Modified MEDALUS Model in a Semiarid Area. Sustainability 2021, 13, 7817. [Google Scholar] [CrossRef]
  29. Bakker, M.; Govers, G.; Kosmas, C.; Vanacker, V.; Oost, K.; Rounsevell, M. Soil erosion as a driver of land-use change. Agric. Ecosyst. Environ. 2005, 105, 467–481. [Google Scholar] [CrossRef]
  30. Tsara, M.; Gerontidis, S.; Marathianou, M.; Kosmas, C. The long-term effect of tillage on soil displacement of hilly areas used for growing wheat in Greece. Soil Use Manag. 2001, 17, 113–120. [Google Scholar] [CrossRef]
  31. Kosmas, C.; Gerontidis, S.; Marathianou, M.; Detsis, V.; Zafiriou, T.; Muysen, W.; Govers, G.; Quine, T.; Vanoost, K. The effects of tillage displaced soil on soil properties and wheat biomass. Soil Tillage Res. 2001, 58, 31–44. [Google Scholar] [CrossRef]
  32. Greek Payment and Control Agency for Guidance and Guarantee Community Aid—OPEKEPE (in Greek). Development of a Unified System for Geospatial Soil Data and the Delineation of the Rural Areas of the Country. Ministry of Rural Development and Food. 2014. Available online: https://iris.gov.gr/SoilServices/js/pdf/SOIL%20MAP%20OF%20GREECE%20e-SOILBOOK.pdf (accessed on 14 May 2020).
  33. Moss, R.; Edmonds, J.; Hibbard, K.; Manning, M.; Rose, S.; Vuuren, D.; Carter, T.; Emori, S.; Kainuma, M.; Kram, T.; et al. The Next Generation of Scenarios for Climate Change Research and Assessment. Nature 2010, 463, 747–756. [Google Scholar] [CrossRef] [PubMed]
  34. Carrão, H.; Naumann, G.; Barbosa, P. Global projections of drought hazard in a warming climate: A prime for disaster risk management. Clim. Dyn. 2017, 50, 2137–2155. [Google Scholar] [CrossRef] [Green Version]
  35. Huang, J.; Zhang, G.; Zhang, Y.; Guan, X.; Wei, Y.; Guo, R. Global desertification vulnerability to climate change and human activities. Land Degrad. Dev. 2020, 31, 1380–1391. [Google Scholar] [CrossRef]
  36. Ma, X.; Zhu, J.; Yan, W.; Zhao, C. Projections of desertification trends in Central Asia under global warming scenarios. Sci. Total Environ. 2021, 781, 146777. [Google Scholar] [CrossRef]
  37. Hellenic Statistical Authority—ELSTAT; Agricultural Statistics: Athens, Greece, 2018. (In Greek)
  38. Intergovernmental Commission on Climate Change of the United Nations (I.P.C.C.). Fifth Assessment Report. 2014. Available online: https://www.ipcc.ch/assessment-report/ar5/ (accessed on 12 May 2021).
  39. Clarke, L.E.; Edmonds, J.A.; Jacoby, H.D.; Pitcher, H.; Reilly, J.M.; Richels, R. Scenarios of greenhouse gas emissions and atmospheric concentrations. In Sub-Report 2.1 A of Synthesis and Assessment Product 2.1. Climate Change Science Program and the Subcommittee on Global Change Research; U.S. Climate Change Science Program: Washington, DC, USA, 2007. [Google Scholar]
  40. Thomson, A.M.; Calvin, K.V.; Smith, S.J.; Kyle, G.P.; Volke, A.; Patel, P.; Delgado-Arias, S.; Bond-Lamberty, B.; Wise, M.A.; Clarke, L.E. RCP4.5: A pathway for stabilization of radiative forcing by 2100. Clim. Change 2011, 109, 77–94. [Google Scholar] [CrossRef] [Green Version]
  41. Riahi, K.; Grübler, A.; Nakicenovic, N. Scenarios of long-term socio-economic and environmental development under climate stabilization. Technol. Forecast. Soc. Change 2007, 74, 887–935. [Google Scholar] [CrossRef]
  42. Riahi, K.; Krey, V.; Rao, S.; Chirkov, V.; Fischer, G.; Kolp, P.; Kindermann, G.; Nakicenovic, N.; Rafai, P. RCP-8.5: Exploring the consequence of high emission trajectories. Clim. Change 2011, 109, 33–57. [Google Scholar] [CrossRef] [Green Version]
  43. Samuelsson, P.; Jones, C.G.; Willén, U.; Ullerstig, A.; Gollvik, S.; Hansson, U.; Jansson, C.; Kjellström, E.; Nikulin, G.; Wyser, K. The Rossby Centre Regional Climate Model RCA3: Model description and performance. Tellus Ser. 2011, 63, 4–23. [Google Scholar] [CrossRef] [Green Version]
  44. Giorgetta, M.; Jungclaus, J.; Reick, C.; Legutke, S.; Bader, J.; Böttinger, M.; Brovkin, V.; Crueger, T.; Esch, M.; Fieg, K.; et al. Climate and carbon cycle changes from 1850 to 2100 in MPI-ESM simulations for the Coupled Model Intercomparison Project Phase 5. J. Adv. Modeling Earth Syst. 2013, 5, 572–597. [Google Scholar] [CrossRef]
  45. Kairis, O.; Dimitriou, V.; Aratzioglou, C.; Gasparatos, D.; Yassoglou, N.; Kosmas, C.; Moustakas, N. A Comparative Analysis of a Detailed and Semi-Detailed Soil Mapping for Sustainable Land Management Using Conventional and Currently Applied Methodologies in Greece. Land 2020, 9, 154. [Google Scholar] [CrossRef]
  46. Doran, J.W.; Parkin, T.B. Defining and assessing soil quality. In Defining Soil Quality for a Sustainable Environment; Doran, J., Coleman, D., Bezdicek, D., Stewart, B., Eds.; SSSA: Madison, WI, USA, 1994; Volume 35, pp. 3–21. [Google Scholar]
  47. Barrow, C.J. World Atlas of Desertification. In United Nations Environment Programme; Middleton, N., Thomas, D.S.G., Eds.; United Nations Environment Programme: London, UK, 1992. [Google Scholar]
  48. Allen, R.G.; Pereira, L.S.; Raes, D.; Smith, M. Crop evapotranspiration: Guidelines for computing crop water requirements. Irr. Drain 1998, 56, D05109. [Google Scholar]
  49. Food and Agriculture Organization of the United Nations—FAO. ETo Calculator (v. 3.2). 2012. Available online: http://www.fao.org/land-water/databases-and-software/eto-calculator/en/ (accessed on 9 September 2021).
  50. Kosmas, C.; Kairis, O.; Aratzioglou, C.; Gkougkougianni, M. Study on the Evaluation of the Contribution of the “Rural Development Program 2014–2020” to the Prevention and Improvement of Soil Management. Greek Ministry of Rural Development and Food. Special Management Unit of the “Rural Development Program 2014–2020”. 2019, p. 102. Available online: https://drive.google.com/file/d/1cYK6BPPYMaFJVqtRbGFXY61ARXM__GEz/view (accessed on 9 June 2021).
  51. Rubio, J.L.; Bochet, E. Desertification indicators as diagnosis criteria for desertification risk assessment in Europe. J. Arid. Env. 1998, 39, 113–120. [Google Scholar] [CrossRef]
  52. Salvati, L.; Zitti, M.; Ceccarelli, T. Integrating economic and ecological indicators in the assessment of desertification risk: Suggestions from a case study. Appl. Environ. Ecol. Res. 2008, 6, 129–138. [Google Scholar] [CrossRef]
  53. Gerontidis, S.; Kosmas, C.; Detsis, V.; Marathianou, M.; Zafiriou, T.; Tsara, M. The effect of moldboard plough on tillage erosion along a hillslope. J. Soil Water Conserv. 2001, 56, 147–152. [Google Scholar]
  54. Govers, G.; Vandaele, K.; Desmet, P.; Poesen, J.; Bunte, K. The role of tillage in soil redistribution on hillslopes. Eur. J. Soil Sci. 1994, 45, 469–478. [Google Scholar] [CrossRef]
  55. Kosmas, C.; Danalatos, N.; Cammeraat, L.H.; Chabart, M.; Diamantopoulos, J.; Farand, R.; Gutierrez, L.; Jacob, A.; Marques, H.; Martinez-Fernandez, J.; et al. The effect of land use on runoff and soil erosion rates under Mediterranean conditions. Catena 1997, 29, 45–59. [Google Scholar] [CrossRef]
  56. Kosmas, C.; Kairis, O.; Karavitis, C.; Ritsema, C.; Salvati, L.; Acikalin, S.; Alcalá, M.; Alfama, P.; Atlhopheng, J.; Barrera, J.; et al. Evaluation and Selection of Indicators for Land Degradation and Desertification Monitoring: Methodological Approach. Environ. Manag. 2014, 54, 951–970. [Google Scholar] [CrossRef] [PubMed] [Green Version]
  57. Kairis, O.; Kosmas, C.; Karavitis, C.; Ritsema, C.; Salvati, L.; Acikalin, S.; Alcalá, M.; Alfama, P.; Atlhopheng, J.; Barrera, J.; et al. Evaluation and Selection of Indicators for Land Degradation and Desertification Monitoring: Types of Degradation, Causes, and Implications for Management. Environ. Manag. 2014, 54, 971–982. [Google Scholar] [CrossRef] [PubMed]
  58. Alamanos, A.; Pliakou, T.; Tritopoulou, E.; Kountouri, F.; Papadaki, L. Management of Water Resources: Introduction and Condition of Water Sector of Thessaly. Program on: Water for Tomorrow of Athens Brewery. 2021, p. 87. Available online: https://nerogiatoavrio.gr/wp-content/uploads/2021/03/Aνάλυση-Υφιστάμενης-Κατάστασης.pdf (accessed on 16 June 2021). (In Greek).
  59. Greek National Committee for Combating Desertification, 2000. Greek Action Plan to Combat Desertification, Ministry of Agriculture, Athens. 2001, p. 142. Available online: https://www.itia.ntua.gr/el/getfile/162/1/documents/2000aperimosi.pdf (accessed on 23 June 2021).
  60. Gasparatos, D.; Kairis, O. Detailed Soil Survey Field and Laboratory Data as a Critical Tool for Optimizing the Arable Cropping Capability Evaluation of a Representative Episaturated Soil Pedon in Greece. Land 2022, 11, 182. [Google Scholar] [CrossRef]
  61. Tatsumi, K.; Yamashiki, Y.; Valmir da Silva, R.; Takara, K.; Matsuoka, Y.; Takahashi, K.; Maruyama, K.; Kawahara, N. Estimation of potential changes in cereals production under climate change scenarios. Hydrol. Process. 2011, 25, 715–2725. [Google Scholar] [CrossRef]
  62. Balkovič, J.; van der Velde, M.; Skalský, R.; Xiong, W.; Folberth, C.; Khabarov, N.; Smirnov, A.; Mueller, D.N.; Obersteiner, M. Global wheat production potentials and management flexibility under the representative concentration pathways Global Planet. Change 2014, 122, 107–121. [Google Scholar]
  63. Georgopoulou, E.; Mirasgedis, S.; Sarafidis, Y.; Vitaliotou, M.; Lalas, P.D.; Theloudis, I.; Giannoulaki, D.K.; Dimopoulos, D.; Zavras, V. Climate change impacts and adaptation options for the Greek agriculture in 2021–2050: A monetary assessment. Clim. Risk Manag. 2017, 16, 164–182. [Google Scholar] [CrossRef]
  64. Kourgialas, N. A critical review of water resources in Greece: The key role of agricultural adaptation to climate-water effects. Sci. Total Environ. 2021, 775, 145857. [Google Scholar] [CrossRef]
  65. Terzoudi, B.C.; Mitsios, J.; Pateras, D.; Gemtos, T. Interrill Soil Erosion as Affected by Tillage Methods under Cotton in Greece. CIGR 2006, VIII. Available online: https://www.academia.edu/22903698/Interrill_Soil_Erosion_as_Affected_by_Tillage_Methods_under_Cotton_in_Greece (accessed on 14 May 2021).
  66. Dimopoulos, M.; Chalkiadaki, M.; Dassenakis, M.; Scoullos, M. Quality of groundwater in western Thessaly the problem of nitrate pollution. Global Nest 2003, 5, 185–191. [Google Scholar]
  67. Papaioannou, A.; Plageras, P.; Dovriki, E.; Minas, A.; Krikelis, V.; Nastos, T.P.; Kakavas, K.; Paliatsos, G.A. Groundwater quality and location of productive activities in the region of Thessaly (Greece). Desalination 2007, 213, 209–217. [Google Scholar] [CrossRef]
  68. European Commission-EC. A Farm to Fork Strategy for a Fair, Healthy and Environmentally-Friendly Food System. COM (2020) 381 Final, Brussels. Available online: https://eur-lex.europa.eu/legal-content/EN/TXT/?uri=CELEX%3A52020DC0381 (accessed on 9 July 2021).
Figure 1. Location of the three study sites in Thessaly.
Land 11 00395 g001
Figure 2. Desertification risk maps of Sotirio study site for the periods 1981–2000 (reference, lower left), 2041–2060 (middle), and 2081–2100 (right) for the scenarios RCP4.5 (above) and RCP8.5 (below).
Land 11 00395 g002
Figure 3. Desertification risk maps of Zappeion study site for the periods 1981–2000 (reference, lower left), 2041–2060 (Middle), and 2081–2100 (right) for the scenarios RCP4.5 (above) and RCP8.5 (below).
Land 11 00395 g003
Figure 4. Desertification risk maps of Trikala study site for the periods 1981–2000 (reference, lower left), 2041–2060 (middle), and 2081–2100 (right) for the scenarios RCP4.5 (above) and RCP8.5 (below).
Land 11 00395 g004aLand 11 00395 g004b
Figure 5. Comparative distribution of areas with soils under different soil depth classes predicted for the milestones of 2020, 2060, and 2100 for the study sites (Sotirio left, Zappeion middle, and Trikala right).
Land 11 00395 g005
Figure 6. Spatial distribution of salinization risk of the study site of Sotirio for the three study periods (reference, left; 2041–2060, middle; 2081–2100, right). The results for 2041–2060 and 2041–2100 do not differ in both scenarios.
Land 11 00395 g006
Table 1. The SQI parameters and their corresponding weighted values across the study sites.
Land QualityUsed ParametersDescriptionWeighted ValuesCurrent Greek Soil Mapping System’s Symbols [45]Study Sites
Soil Quality Index—SQISoil texture of the top soil layerL, SCL, SL, LS, CL13Trikala
SC, SiL, SiCL1.2-Non existent in the study sites
Si, C, SiC1.65Zappeion, Sotirio
S24Zappeion, Sotirio
Parent materialShale, schist, basic, ultra basic, conglomerates, unconsolidated1C, A, P, TZappeion, Sotirio, Trikala
Limestone, marble, granite, Rhyolite, ignibrite, gneiss, siltstone, sandstone1.7-Non existent in the study sites
Marl *, pyroclastics2MZappeion, Trikala
Soil depth>75 cm14, 5, 6Zappeion, Sotirio, Trikala
30–75 cm23Zappeion, Trikala
15–30 cm--Non existent in the study sites
<15 cm4 Non existent in the study sites
Slope (%)<61A, BZappeion, Sotirio, Trikala
6–181.2-Non existent in the study sites
18–351.5-Non existent in the study sites
>352-Non existent in the study sites
Rock fragments cover>6013Zappeion, Sotirio
20–601.32Zappeion, Sotirio
<2021Zappeion, Sotirio, Trikala
Drainage conditionsWell drained1A, B, CZappeion, Sotirio, trikala
Imperfectly drained1.2DSotirio, Trikala
Poorly drained2D/F, E/F, ESotirio, Trikala
* For perennial vegetation, marl is transferred to class 1.
Table 2. The CQI parameters and their corresponding weighted values across the study sites.
Land QualityUsed ParametersDescriptionWeighted ValuesData SourcePeriod/RCP/Study Site
Climate Quality Index—CQIAnnual precipitation>650 mm1Academy of Athens1981–2000/Trikala
280–650 mm21981–2000/Zappeion, 2041–2060/4.5/Zappeion, 2081–2100/4.5/Zappeion, 2041–2060/8.5/Zappeion, 2081–2100/8.5/Zappeion, 1981–2000/Sotirio, 2041–2060/4.5/Sotirio, 2081–2100/4.5/Sotirio, 2041–2060/8.5/Sotirio, 2081–2100/8.5/Sotirio, 2041–2060/4.5/Trikala, 2081–2100/4.5/Trikala, 2041–2060/8.5/Trikala
<280 mm42081–2100/8.5/Trikala
Aridity index>11CalculatedNon existent in the study sites
0.75 < 11.051981–2000/Trikala
0.65 < 0.751.15Non existent in the study sites
0.50 < 0.651.251981–2000/Zappeion, 1981–2000/Sotirio
0.35 < 0.501.35Non existent in the study sites
0.20 < 0.351.452041–2060/4.5/Zappeion, 2081–2100/4.5/Zappeion, 2041–2060/8.5/Zappeion, 2041–2060/4.5/Sotirio, 2081–2100/4.5/Sotirio, 2041–2060/8.5/Sotirio, 2041–2060/4.5/Trikala, 2081–2100/4.5/Trikala
0.10 < 0.201.552081–2100/8.5/Zappeion, 2081–2100/8.5/Sotirio, 2041–2060/8.5/Trikala, 2081–2100/8.5/Trikala
0.03 < 0.101.75Non existent in the study sites
<0.032Non existent in the study sites
AspectN, NE, NW, flat1EstimatedZappeion, Sotirio, Trikala
S, SE, SW, E2
Table 3. The VQI parameters and their corresponding weighted values across the study sites.
Land QualityUsed ParametersDescriptionWeighted ValuesStudy Sites
Vegetation Quality Index—VQIFire riskBare land, perennial agricultural crops, annual agricultural crops (maize, tobacco, sunflower)1Not the main cultivations in the study sites
Annual agricultural crops (cereals, grasslands),
deciduous oak, (mixed), mixed Mediterranean, macchia/evergreen forests
1.3Zappeion, Sotirio, Trikala
Mediterranean macchia1.6Not the main vegetation in the study sites
Pine forests2Not the main vegetation in the study sites
Erosion protection Mixed Mediterranean macchia-evergreen forests (with Q. ilex) 1Not the main vegetation in the study sites
Mediterranean macchia, pine forests1.2Not the main vegetation in the study sites
Deciduous forests (oak mixed), permanent grassland1.4Not the main vegetation in the study sites
Evergreen perennial agricultural crops (olives)1.6Not the main cultivations in the study sites
Deciduous perennial agricultural crops (almonds, orchards)1.8Not the main cultivations in the study sites
Annual agricultural crops (cereals), annual grasslands2Zappeion, Sotirio, Trikala
Drought resistanceMixed Mediterranean macchia/evergreen forests,
Mediterranean macchia
1Not the main vegetation in the study sites Mediterranean macchia
Conifers, deciduous, olives1.2Not the main vegetation and cultivation in the study sites
Perennial agricultural trees (vines, almonds, ochrand)1.4Not the main cultivations in the study sites
Perennial grasslands1.7Not the main vegetation in the study sites
Annual agricultural crops, annual grasslands2Zappeion, Sotirio, Trikala
Plant cover>40%1Not the main plant cover percentage in the study sites
10–40%1.8Zappeion, Sotirio, Trikala
<10%2Not the main plant cover percentage in the study sites
Table 4. The MQI parameters and their corresponding weighted values across the study sites.
Land QualityUsed ParametersDescriptionWeighted ValuesStudy Sites
Management Quality Index—MQILand use intensity (only for cropland)Low land use intensity1Not the major trend existent in the study sites
Medium land use intensity1.5Zappeion, Sotirio, Trikala (shallow plowing, application of fertilizers in a moderate intensity, contour cultivation in some areas)
High land use intensity2Not the major trend existent in the study sites
Policy enforcementComplete: >75% of the area under protection1Not the major trend existent in the study sites
Partial: 25–75% of the area under protection1.5Zappeion, Sotirio, Trikala (partially adequate measures for soil protection)
Incomplete: <25% of the area under protection2Not the major trend existent in the study sites
Table 5. Mean maximum and minimum air temperature for the reference period and predicted by scenarios RCP4.5 and RCP8.5 for the periods 2041–2060 and 2081–2100 for the study sites.
Time PeriodMean Maximum Temperature (°C)Mean Minimum Temperature (°C)
SotirioZappeionTrikalaSotirioZappeionTrikala
1981–200020.620.620.620.620.320.39.49.49.49.411.911.9
RCP4.5RCP8.5RCP4.5RCP8.5RCP4.5RCP8.5RCP4.5RCP8.5RCP4.5RCP8.5RCP4.5RCP8.5
2041–206022.323.023.023.723.724.310.511.211.111.711.612.2
2081–210022.625.623.226.423.927.110.813.811.314.311.914.9
Table 6. Mean annual precipitation for the reference period and predicted by scenarios RCP4.5 and RCP8.5 for the periods 2041–2060 and 2081–2100 for the study sites.
Time PeriodMean Annual Precipitation (mm)
SotirioZappeionTrikala
1981–2000415.9415.9415.9415.9707.8707.8
RCP4.5RCP8.5RCP4.5RCP8.5RCP4.5RCP8.5
2041–2060396.9343.9443.6396.1349.5324.4
2081–2100394.7295.3473.4336.1355.6248.8
Publisher’s Note: MDPI stays neutral with regard to jurisdictional claims in published maps and institutional affiliations.

