Case Report

How Does Maize-Cowpea Intercropping Maximize Land Use and Economic Return? A Field Trial in Bangladesh

1
Department of Agronomy, Patuakhali Science and Technology University, Patuakhali 8602, Bangladesh
2
Department of Land Management, Faculty of Agriculture, Universiti Putra Malaysia, Serdang 43400, Selangor, Malaysia
3
Pulses Research Centre, Bangladesh Agricultural Research Institute, Gazipur 1701, Bangladesh
4
Department of Agriculture and Fisheries, Leslie Research Facility, 13 Holberton Street, Toowoomba, QLD 4350, Australia
5
Agrosystems Research, Wageningen University & Research, P.O. Box 16, 6700 AA Wageningen, The Netherlands
*
Authors to whom correspondence should be addressed.
Submission received: 28 February 2022 / Revised: 1 April 2022 / Accepted: 12 April 2022 / Published: 15 April 2022

Abstract

:
Cultivating multiple crops together can provide numerous benefits, including improved soil health and crop yield. The objective of our study was to determine the optimum planting techniques in intercropping systems, and to maximize their benefits by mitigating competition for resources such as land, space, light interception, and nutrition. The performance of successively planted maize (Zea mays L.) grown with cowpea (Vigna unguiculata L.) was evaluated with a field trial in Bangladesh. The treatments in our study were: (a) sole maize, (b) sole cowpea, (c) crops sown simultaneously, and (d) crops sown with different time lags (1, 2, and 3 weeks) between the maize-sowing and cowpea-sowing dates. Data on the crops’ physiological parameters were recorded. These included light interception, leaf area index (LAI), Soil Plant Analysis Development (SPAD), harvest index, and yield. Simultaneously, canopy coverage was measured using camera-based photo analysis. In addition, an economic analysis of intercropping maize with soybean or cowpea was conducted using gross margin analysis and benefit-cost ratio. In our results, the below-canopy photosynthetically active radiation (PAR) was significantly higher in intercropping treatments when maize was sown three weeks after cowpea. In contrast, the LAI value of the maize and cowpea was significantly greater when sown on the same day than in other intercropping treatments. As a result, the maize yield reduced when intercropped with cowpea. This reduction maximized when both species were sown simultaneously due to higher competition for resources, including nutrients and light. Intercropping was more beneficial in terms of land equivalent ratio than both sole cropping of maize and cowpea, especially when maize was planted three weeks later. However, this benefit was not retained when calculated as maize equivalent yield since the contribution of cowpea was small in the overall maize yield, suggesting the importance of the relative economic value of the component species. Among all treatments, the lowest maize equivalent yield (6.03 ± 0.14 t ha−1) was obtained from sole cowpea, and the largest land equivalent ratio (1.67 ± 0.05) was obtained from intercropping with maize sown three weeks after cowpea. This treatment provided a net income of USD 786.32 ± 25.08 ha−1. This study has shown that together, maize–cowpea intercropping with a temporal niche difference of three weeks may be a better option for sustainable crop production in Bangladesh, maximizing land use. However, it may not provide a significantly greater maize equivalent yield and economic return.

1. Introduction

Attaining food and nutritional security for millions of people worldwide is one of the most stressful challenges, particularly for densely populated countries, such as Bangladesh [1,2]. Climate change often creates additional threats to agricultural production. Since it is one of the most vulnerable countries to flood, drought, and sea-level rise [3]. Crop diversification can improve soil fertility and water-use efficiency, and maintain natural enemies of insect pests, while a monoculture system with a single species (rice as in case of Bangladesh) often accelerates nutrient mining from a particular soil layer and hosts pathogenic microorganisms. Moreover, a diversified cropping system is not only a resilient and sustainable crop production technique [4,5] but it also provides large varieties of food with different nutritional qualities [6,7,8]. Intercropping is a well-known practice of diversified cropping systems and therefore, it could provide similar benefits. For instance, it can efficiently use growth resources, including nutrients, light, and water, thus maintaining soil health [9]. Moreover, the chances of getting yield from at least one of the component crops, even under adverse climatic conditions (e.g., cyclones), is higher than monocropping. Therefore, it has been reported that intercropping could provide a stable yield from the component species [9,10]. However, competition between component crops for resources can significantly reduce yield. Thus, it is an important determinant for selecting component crops in intercropping systems since species diversity can reduce resource competition [11]. For instance, intercropping is more productive and economical when both crops differ in genetic makeup, photosynthetic pathways, growth habit, growth duration, and demand for different growth resources [12,13]. Therefore, intercropping can only provide a yield advantage over sole cropping if the component crops use natural resources in complementary ways [14,15,16].
Cereal–legume intercropping is an important agronomic practice in which the system’s efficiency is superior to the individually grown component species [17,18,19]. For instance, maize (Zea mays)–legume intercropping has multiple benefits over sole cropping and intercropping practices than other species [20,21,22]. These benefits may have been achieved through symbiotic associations and complementarity interactions between species in harvesting limited resources [10,14,20]. When maize is planted as a wide-spaced crop, it encourages weed infestation and intensifies crop–weed competition [21,22]; meanwhile, there remain unexplored opportunities of getting a harvest from the free space. Growing a component crop in between lines of maize can substantially reduce weed growth. The benefits can be even greater when a legume is selected as a component crop since it can supplement some of its fixed nitrogen to other component crops [19,23]. Moreover, maize and legumes may uptake nutrient elements and water from different layers since their root architecture and penetration depth are different (relatively shallow vs. deep in maize and legume, respectively). Thus, there is less competition between species [23,24,25].
Maize can be potential cereals for multiple reasons since it provides several outputs, including food and fodder. The demand of maize in Bangladesh is increasing since it is used in animal feed as well as in different food items. In 2018, the demand was 4.48 million tons while the production was 3.28 million tons from ~400-thousand-hectare lands [26].
Considering the diversity of each species, there can be positive interactions when maize and legumes are grown together. For instance, Dong et al. [27] reported a relative advantage of maize–legume intercropping over sole cropping and intercropping of maize with other species due to interspecific facilitation by processes of N2 fixation, N transfer, and increased resource availability. However, there can still be significant competition for resources when component species are grown simultaneously [28]. There are several potential means to reduce competition, including (a) reducing the plant population density (widely sown maize and legume plants), (b) creating a difference in resource demand (sowing maize and legume at different times), and (c) managing the optimum growing conditions through agronomic practices (e.g., canopy pruning of dominant species) [29].
A temporal variation in cultivating component species, commonly known as “temporal niche difference (TND)”, may provide a greater relative yield than simultaneous cultivation since there is a scope for the complimentary use of resources in time [16,28,29]. A recent meta-analysis using maize–soybean intercropping systems showed that TND was more advantageous than simultaneous intercropping. There was a positive relationship between TND and intercropping performance (e.g., land equivalent ratio) [16]. Maize, considered as an exhaustive crop that requires a relatively high input, may induce significant pressure on legumes if planted simultaneously. On the contrary, planting maize after a legume (e.g., cowpea, Vigna unguiculata L.) may allow the legume to obtain complementarity utilization of space and the biological nitrogen fixation from legume plants [11]. However, it should be highlighted that lately, sown maize (i.e., sown at the start of the summer season) may sacrifice its yield due to unfavorable conditions, such as relatively higher temperatures.
Until now, few studies have been conducted to examine the relative yield advantage of intercropping when maize and cowpea are sown at different times. Therefore, it is important to investigate whether TND provides a net advantage over sole cropping and simultaneous intercropping through the late planting of maize in maize–cowpea intercropping. Here, the authors examined the performance of maize and cowpea grown in row-intercropping with maize that was sown at different sowing dates. The authors hypothesize that intercropping under TND results in higher resource use efficiency of the component crops (maize and cowpea) and raises the overall economic return than simultaneous intercropping and sole cropping.

2. Materials and Methods

2.1. Study Site

Our experiment was conducted from December 2018 to May 2019 at the Research Field of Patuakhali Science and Technology University in Dumki, Bangladesh (22°27′51.93″ N, and 90°23′14.09″ E). The experimental field belongs to the agro-ecological zone of AEZ–13 [30]. This region occupies an extensive area of tidal floodplain land. The area lies at 0.9 to 2.1 m above the mean sea level [31]. The experimental field is on medium-high land with a soil texture type of silty clay loam. The main mean soil properties (0–15 cm) of this experimental field are: pH = 8.4 ± 0.3 (water, 1:10, m/v), organic matter content = 1.82 ± 0.61%, total N = 0.14 ± 0.07%, exchangeable K (meq per 100 g) = 0.30 ± 0.09, and available P (Olsen-P): 3.3 ± 0.4 mg kg−1 soil. Annual precipitation is 2200 mm. The maximum and minimum temperature ranges were 24.5–29.6 °C and 13.9–21.5 °C, respectively, during the cropping period. Relative humidity ranged from 61.0 to 70.6%. The monthly average weather data is presented in the supporting information (Table S1).

2.2. Experimental Design

The experiment consisted of the following six treatments: T1, sole maize with 60 cm × 20 cm spacing; T2, sole cowpea with 30 cm × 10 cm spacing; T3, maize–cowpea intercropping with simultaneous sowing; T4, maize–cowpea intercropping with maize sown 1 week (wk) after cowpea; T5, maize–cowpea intercropping with maize sown 2 wks after cowpea; T6, maize–cowpea intercropping with maize sown 3 wks after cowpea. The spacing for intercropping was similar to sole maize (i.e., 60 cm × 20 cm). The treatments were assigned following a randomized complete block design (RCBD) with three replications. Altogether, there were 18 plots in this experiment, and each replication is considered as a block (Figure S1). Each block was divided into six-unit plots of 3 m × 2 m in which treatments were applied at random. Both blocks and plots were located 1 m apart. The photograph of the field trial and the scheme of the plot design are shown in the Supplementary Materials (Figures S1 and S2). The authors used a hybrid variety of maize (Don-111), whereas indigenous cowpea seed was collected from the Patuakhali Science and Technology University Farm. Fertilization was conducted according to recommended protocols established by the Bangladesh Agricultural Research Council (BARC, 2015). The maize-grown fields (either sole or intercropped with cowpea) received 120, 60, and 40 kg ha−1 of N, P2O5, and K2O as urea, triple superphosphate (TSP), and muriate of potash (MoP), respectively. The urea was applied in three equal splits at 25 and 60 days after sowing (DAS) during land preparation. Sole cowpea received 20, 40, and 20 kg ha−1 of N, P2O5, and K2O as urea, TSP, and MP, respectively. Soil moisture was maintained at 70% field capacity with several irrigations, and plant protection measures were enforced when necessary.

2.3. Data Collection

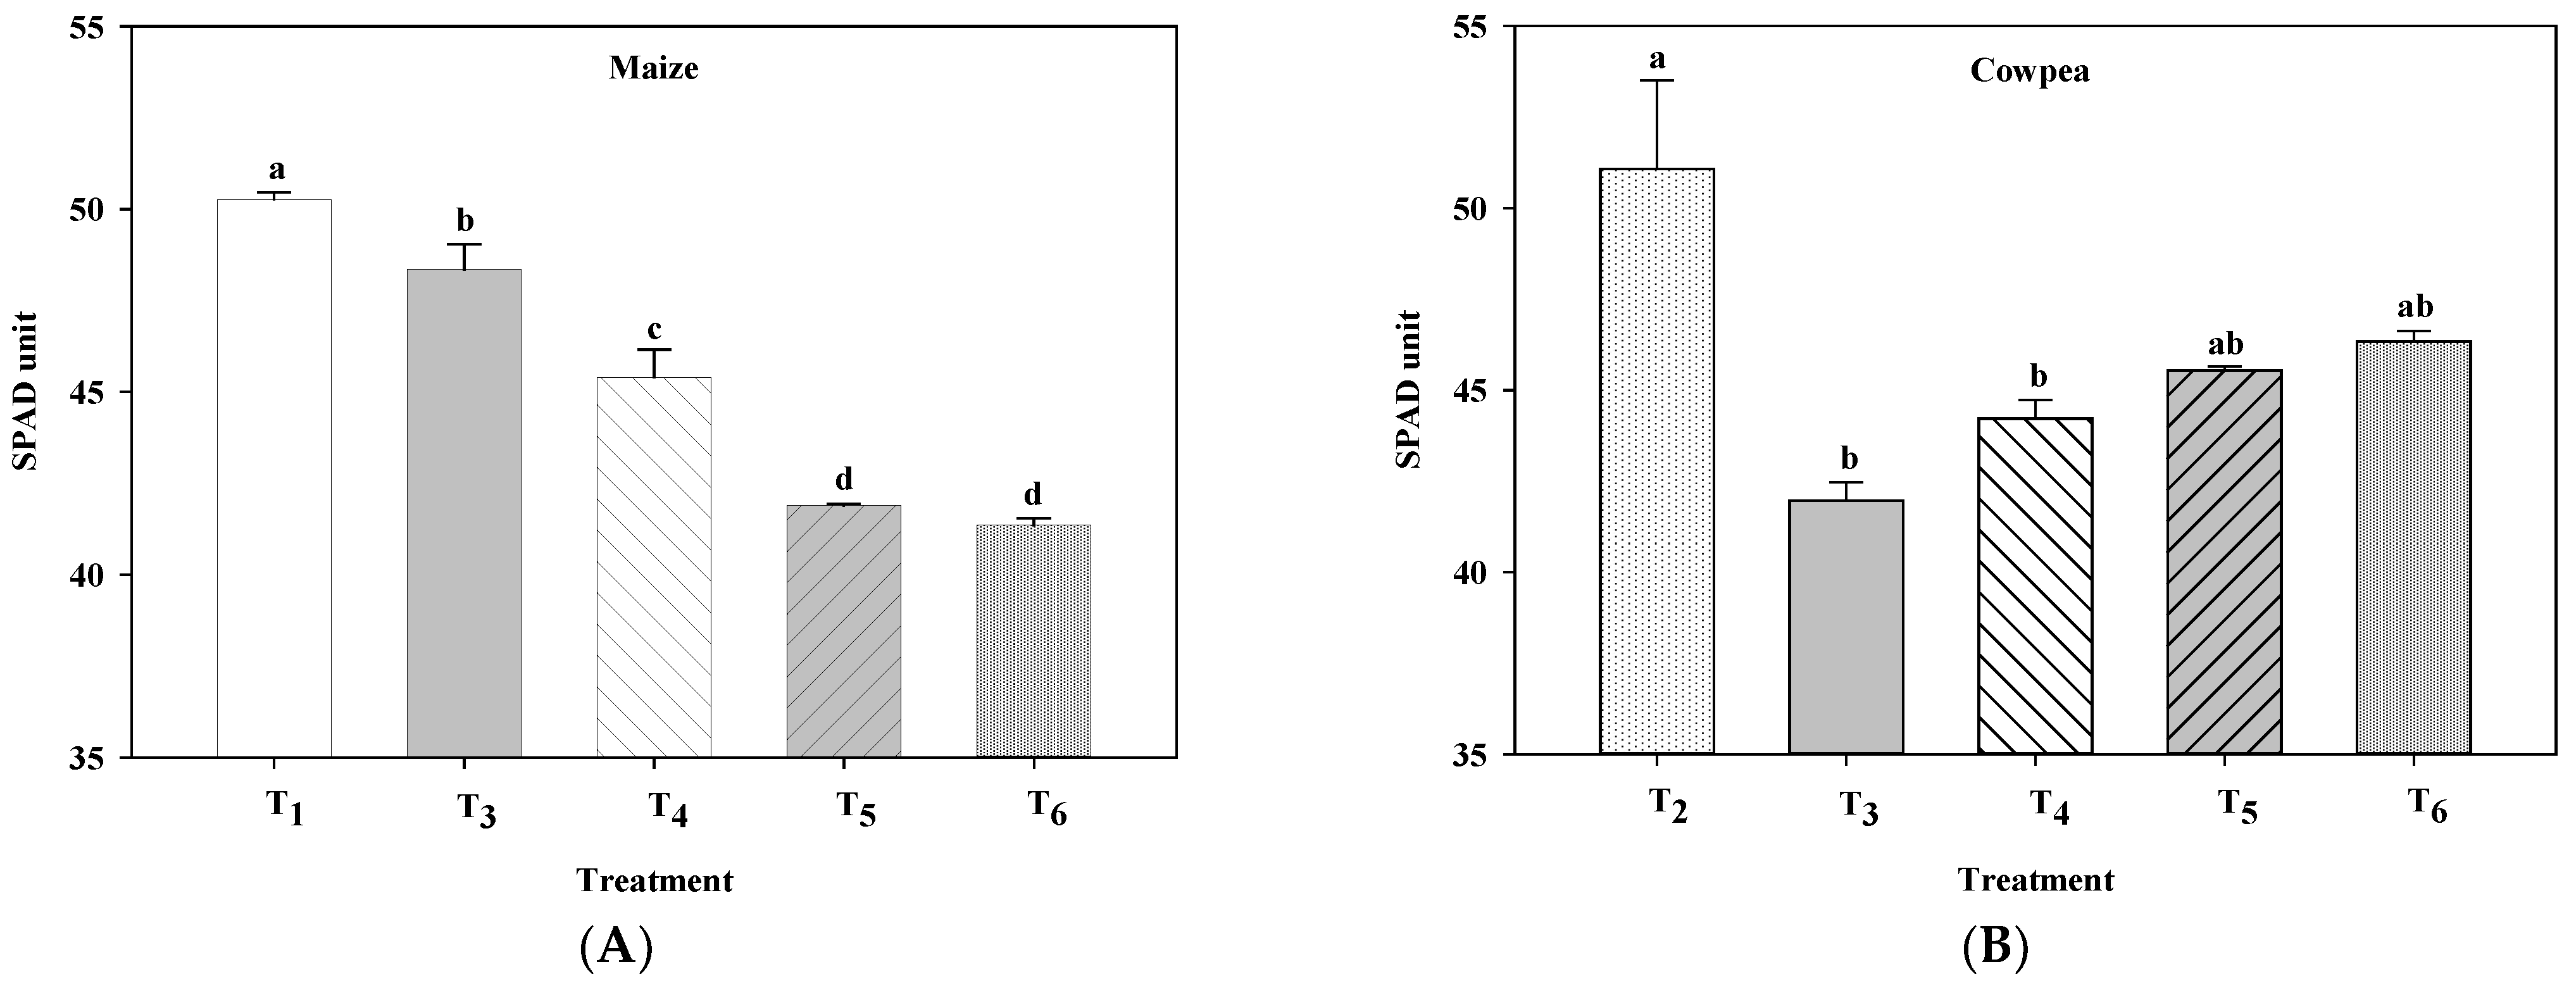
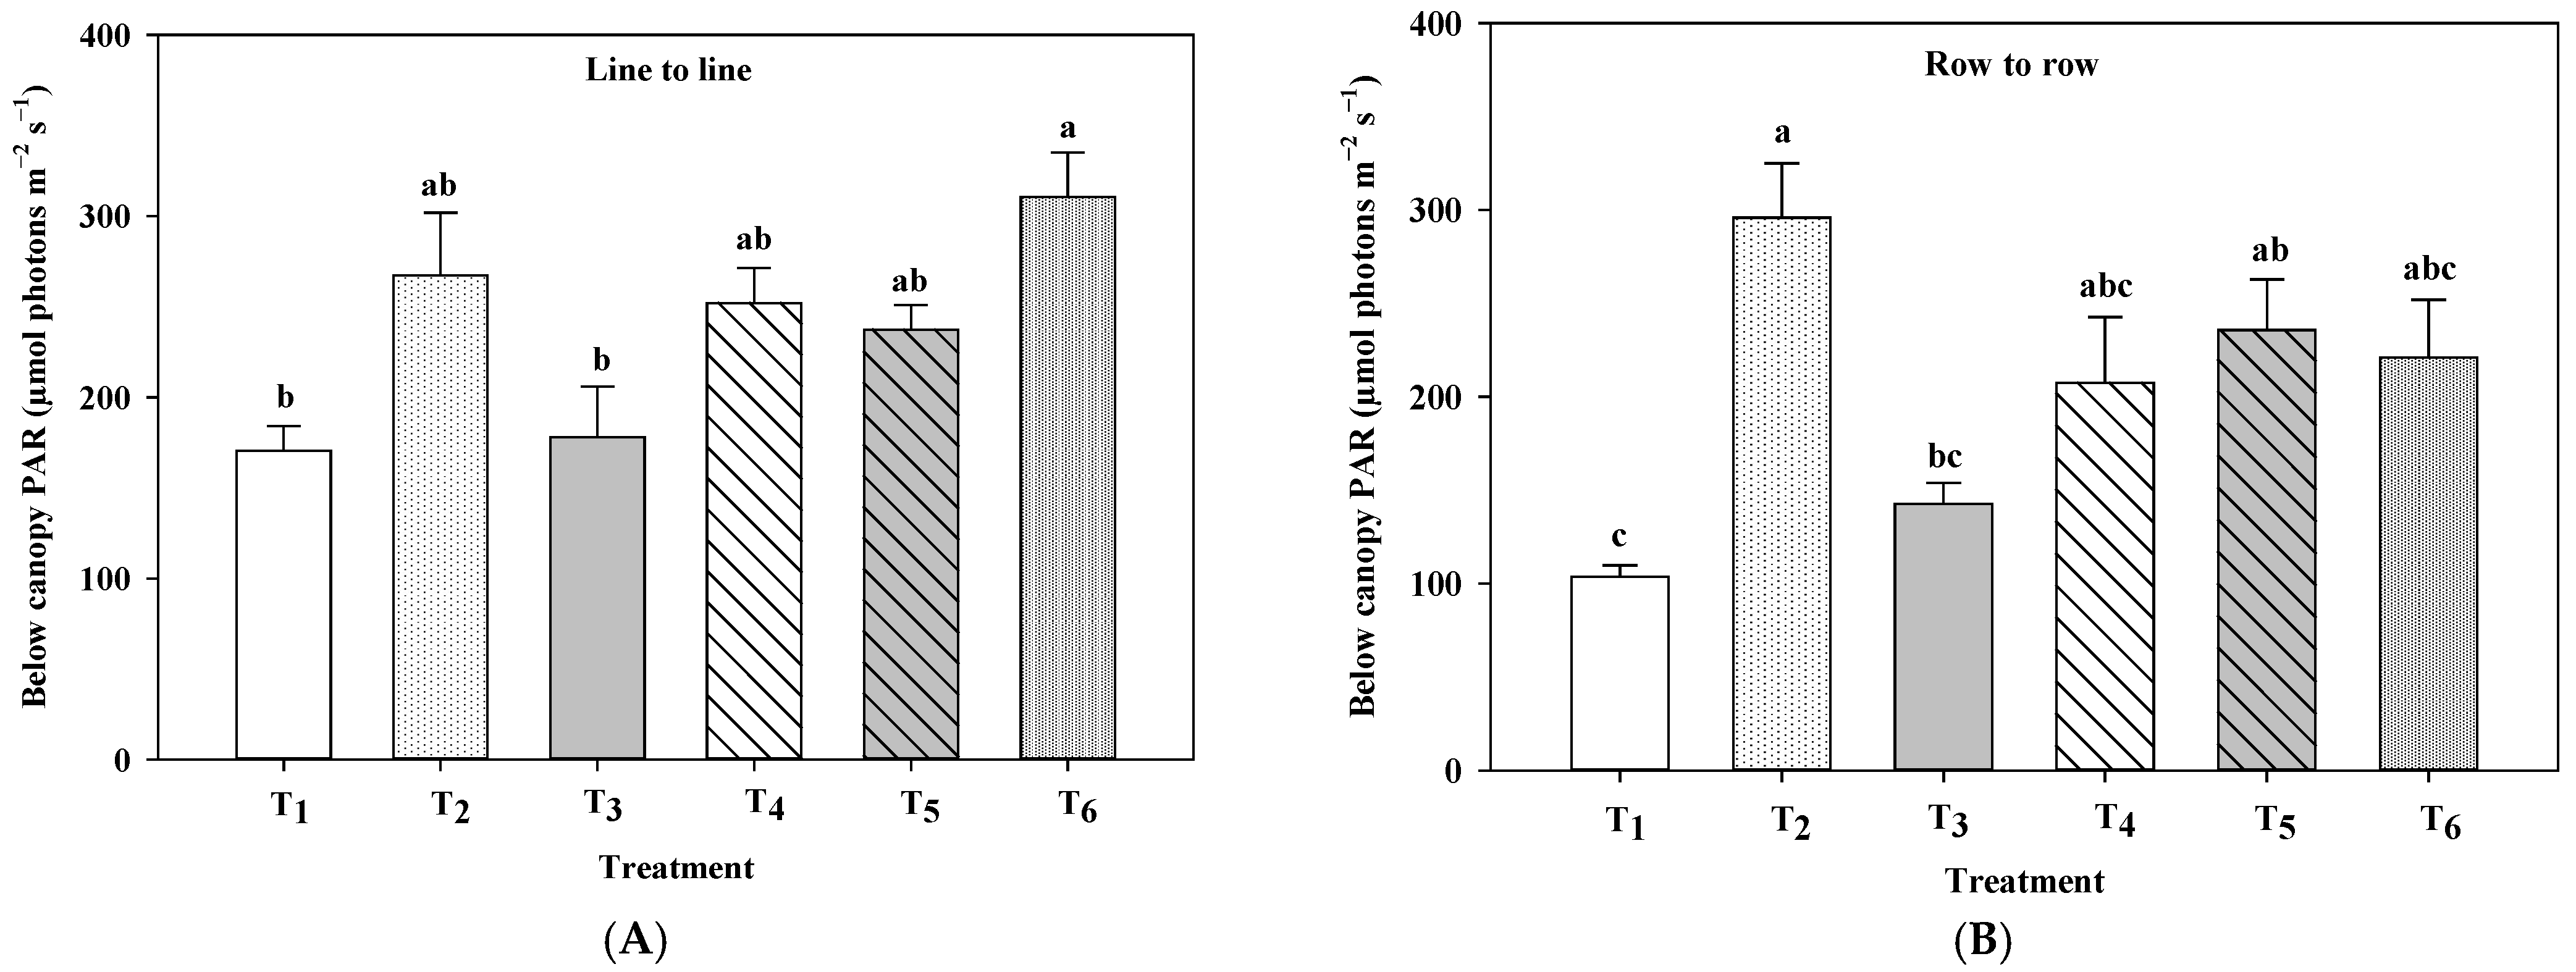
2.3.1. Light Interception and SPAD (Soil and Plant Analysis Development) Value

The light interception was measured just before the maize flowered (75 DAS) using a ceptometer (AccuPAR, model-LP-80, Decagon Devices, Inc., Pullman, WA, USA). Specifically, above- and below-canopy PAR (photosynthetically active radiation), and leaf area index (LAI) were measured by taking four readings for each measurement. These four readings were taken from four locations on a plot. These measurements were taken in the middle of the rows and lines of crops, as there can be possible variations in PAR values as the distance between lines (60 cm for maize) and rows (20 cm for maize) changes. The chlorophyll content of leaves was measured using a SPAD meter (SPAD-502 plus, Konica Minolta, Tokyo, Japan). The SPAD readings were taken from five randomly selected leaves of maize and cowpea plants in every plot. These readings were taken from leaf blades, and the average SPAD reading was recorded from each plot.

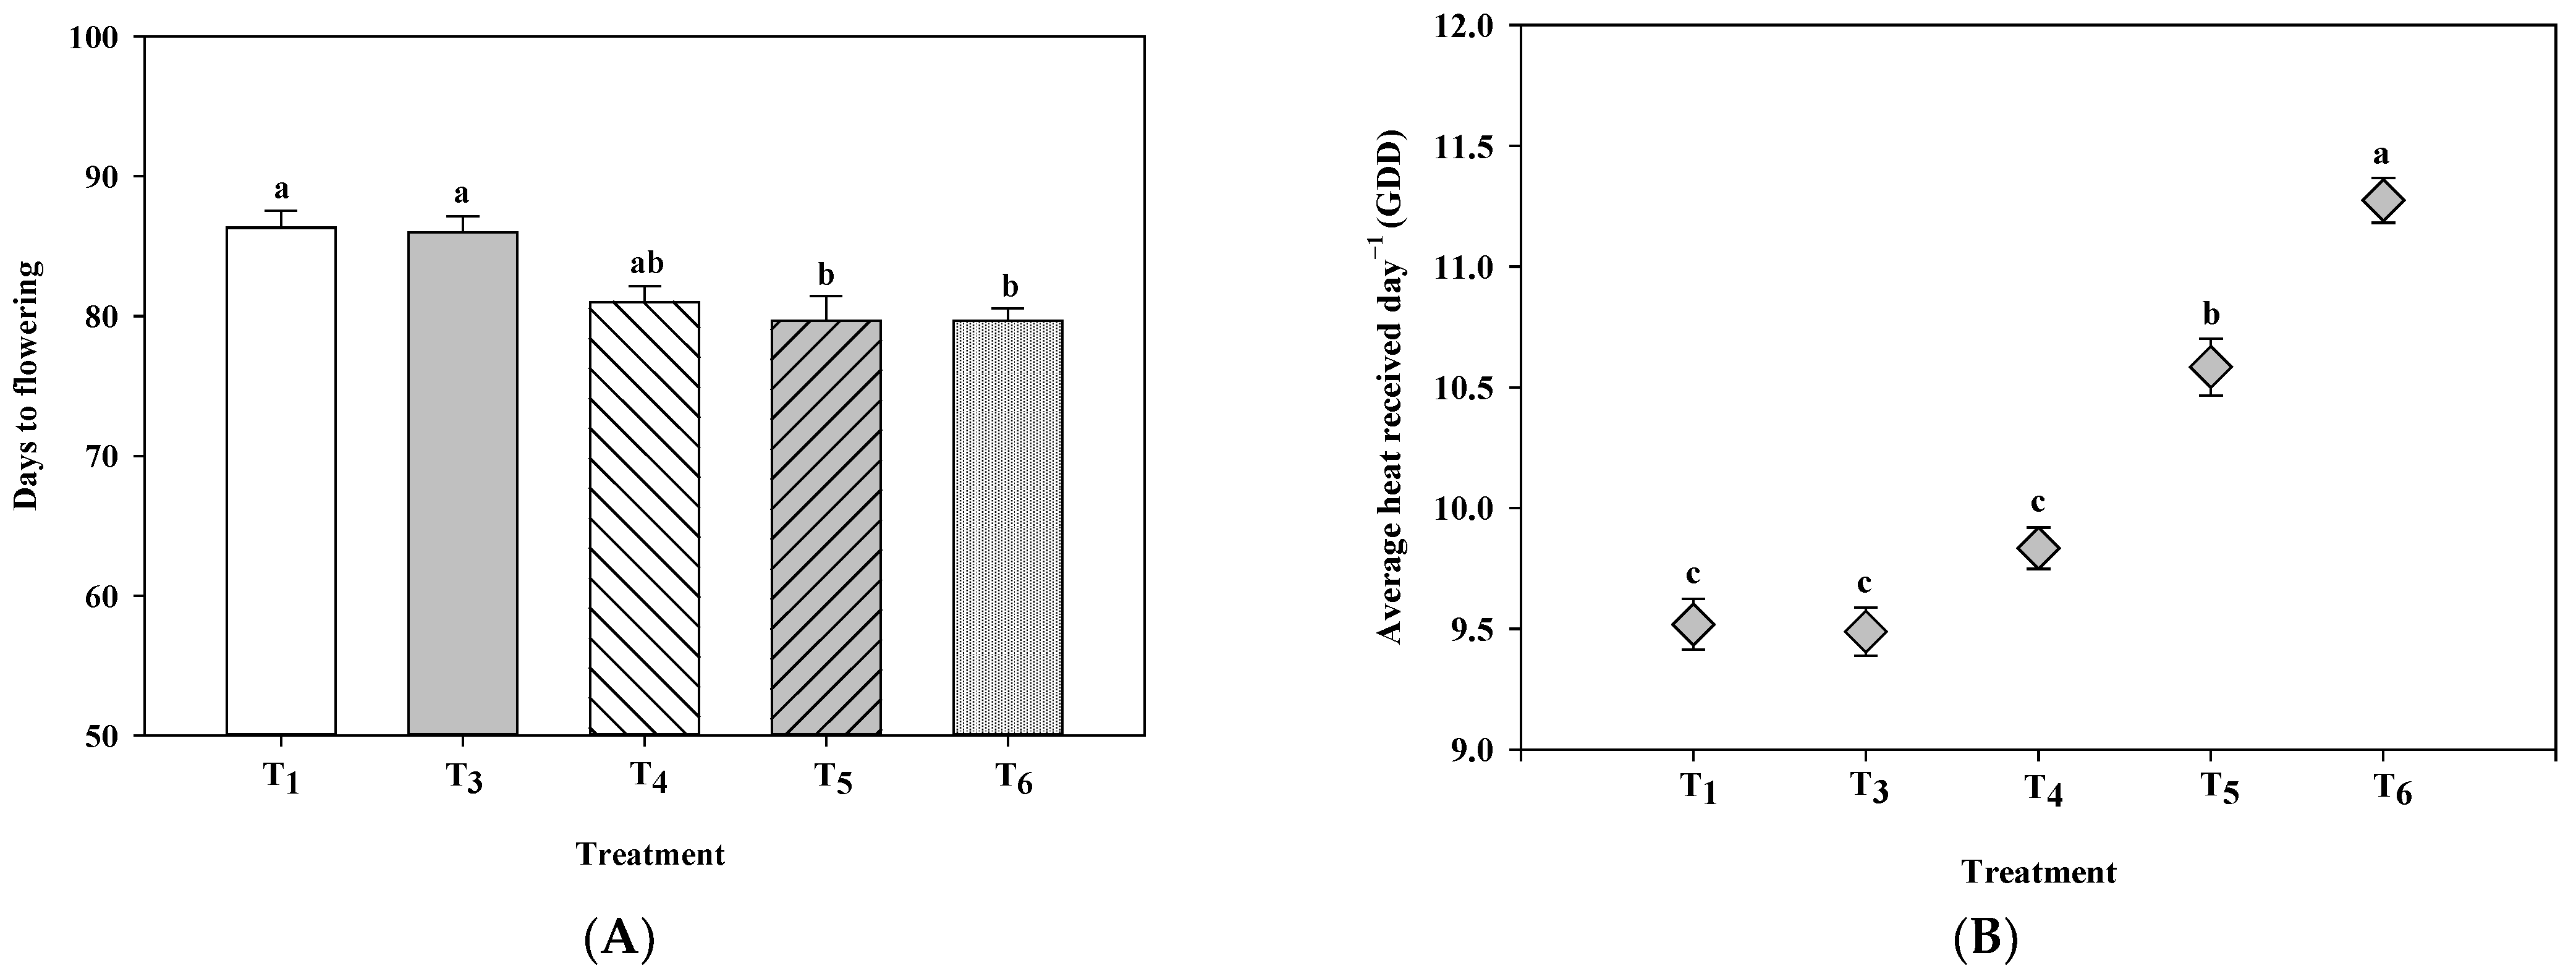
2.3.2. Determining Thermal Requirements for Flowering

The flowering dates were recorded, and daily maximum and minimum temperatures were collected from a local weather station. The thermal unit was calculated using growing degree days (GDD) using a base temperature of 10 °C [32].
GDD   = i j ( T   max + T   min 2 ) T   base
where
    • i = Sowing date
    • j = Flowering date
    • T max = Maximum day temperature (°C)
    • T min = Minimum day temperature (°C)
    • T base = Base temperature (°C), which is considered as 10
The rate of development was calculated using the following formula:
Average   heat   unit   received   per   day   = GDD Days   to   flowering

2.3.3. Determining Canopy Coverage and Architecture

Canopy coverage and architecture were determined by capturing and analyzing photographs based on the work of Sakamoto et al. [33]. The digital photograph was captured at a fixed height of 1.75 m using a Nikon D3300 camera during the flowering stage (i.e., at 85 DAS). The area shown in the picture was adjusted to the size of 1 m2 (1 m × 1 m) within each treatment block. The ISO, aperture (F-stop), and shutter speed data were recorded. The digital number of image pixels for the red, green, and blue image layers (RGB) was obtained using software called GIMP. Then, the digital number was averaged to convert to the calibrated digital number (cDNA). The camera-derived vegetation indices (VIs), i.e., visible atmospherically resistant index (VARI) and two-green-red-blue (2 g-r-b) were calculated using the following formula by Sakamoto et al. [33]. The equations for digital camera-based VIs are as follows:
VARI (camera) = cDNgreen − cDNred/cDNgreen + cDNred
2 g-red-b (camera) = 2 × cDNgreen − cDNred − cDNblue
where
cDNgreen = Daytime green pixel
cDNred = Daytime red pixel
cDNblue = Daytime blue pixel

2.3.4. Yield and Yield Contributing Parameters

At harvesting time, one square meter area was harvested from the middle of each plot to determine biomass production and seed/grain yield. Grains/seeds and maize stovers were cleaned and dried at 60 °C in an oven for approximately 72 h until they reached constant weight. The grain yield of maize and cowpea was recorded and converted to yield per hectare. The harvest index was calculated by the ratio between grain yield and total yield (biomass and grain). Yield-contributing characteristics were determined by obtaining data from five randomly selected maize and cowpea plants from each plot. The plant height, number of plants, number of cobs, number of grains per cob, lengths and diameters of cobs, weights of cobs, and total biomass were recorded for the maize crop. Yield components, such as 1000-grain weight, were also measured. After harvesting cowpea, yield attributes, such as the number of branches and pods per plant, the number of seeds per pod, 1000-seed weight, total biomass, as well as seed yield were measured after drying. The drying was performed at 60 °C in an oven for approximately 72 h until they reached constant weight.

2.3.5. Analysis of Intercropping Systems

The relative yield of intercropping was calculated using the following equation:
Relative   yield = Yield   of   component   crop Yield   of   sole   crop
The individual crop yield was converted into equivalent yield by equating the prices of the individual crops [34]. Market prices are presented in Table 1. Maize equivalent yield is calculated as:
Maize   equivalent   yield = Ym + Yi × Pi Pm
where
    • Ym = Yield of maize (kg ha−1)
    • Yi = Yield of intercrop (kg ha−1)
    • Pi = Price of intercrop (Tk. ha−1)
    • Pm = Price of maize (Tk. ha−1)
Harwood [35] defined land equivalent ratio (LER) as the area needed under sole cropping to generate as much produce as 1 ha of intercropping or mixed cropping at the same management level expressed as a ratio. Willey [36] calculated the following formula for LER:
LER = Yml Ym + Ylm Yl
where
    • Yml = yield of maize when intercropped with cowpea
    • Ym = yield of sole maize
    • Ylm = yield of cowpea when intercropped with maize
    • Yl = yield of sole cowpea
Costs and returns were analyzed for the economic assessment of the cropping systems. The gross return was calculated by yield and local market price. The local currency was converted to the United States Dollar with a fixed rate of USD 1 = BDT 85. The benefit-cost ratios (BCR) of different treatments were calculated as follows:
BCR = Gross   return   ( tk ha ) Variable   cost   of   cultivation   ( tk ha )
The variable cost refers to expenses during the production’s field activity and varies depending on the treatments. All cost information is listed in Table 1.

2.3.6. Statistical Analysis

The results were analyzed following a mixed model analysis using treatments as fixed factors and blocks (i.e., replication) as random factor using JPM with analysis of JMP 8 (SAS, USA) software. Tukey’s honesty significant test (HSD) was used as a post-hoc test to determine pairwise differences between treatments at a significance level of p ≤ 0.05. Graphs were prepared using the SigmaPlot V14.0 (Systat Software Inc., London, UK). Detailed information about the statistical result is shown in the Supplementary Materials in this study.

3. Results

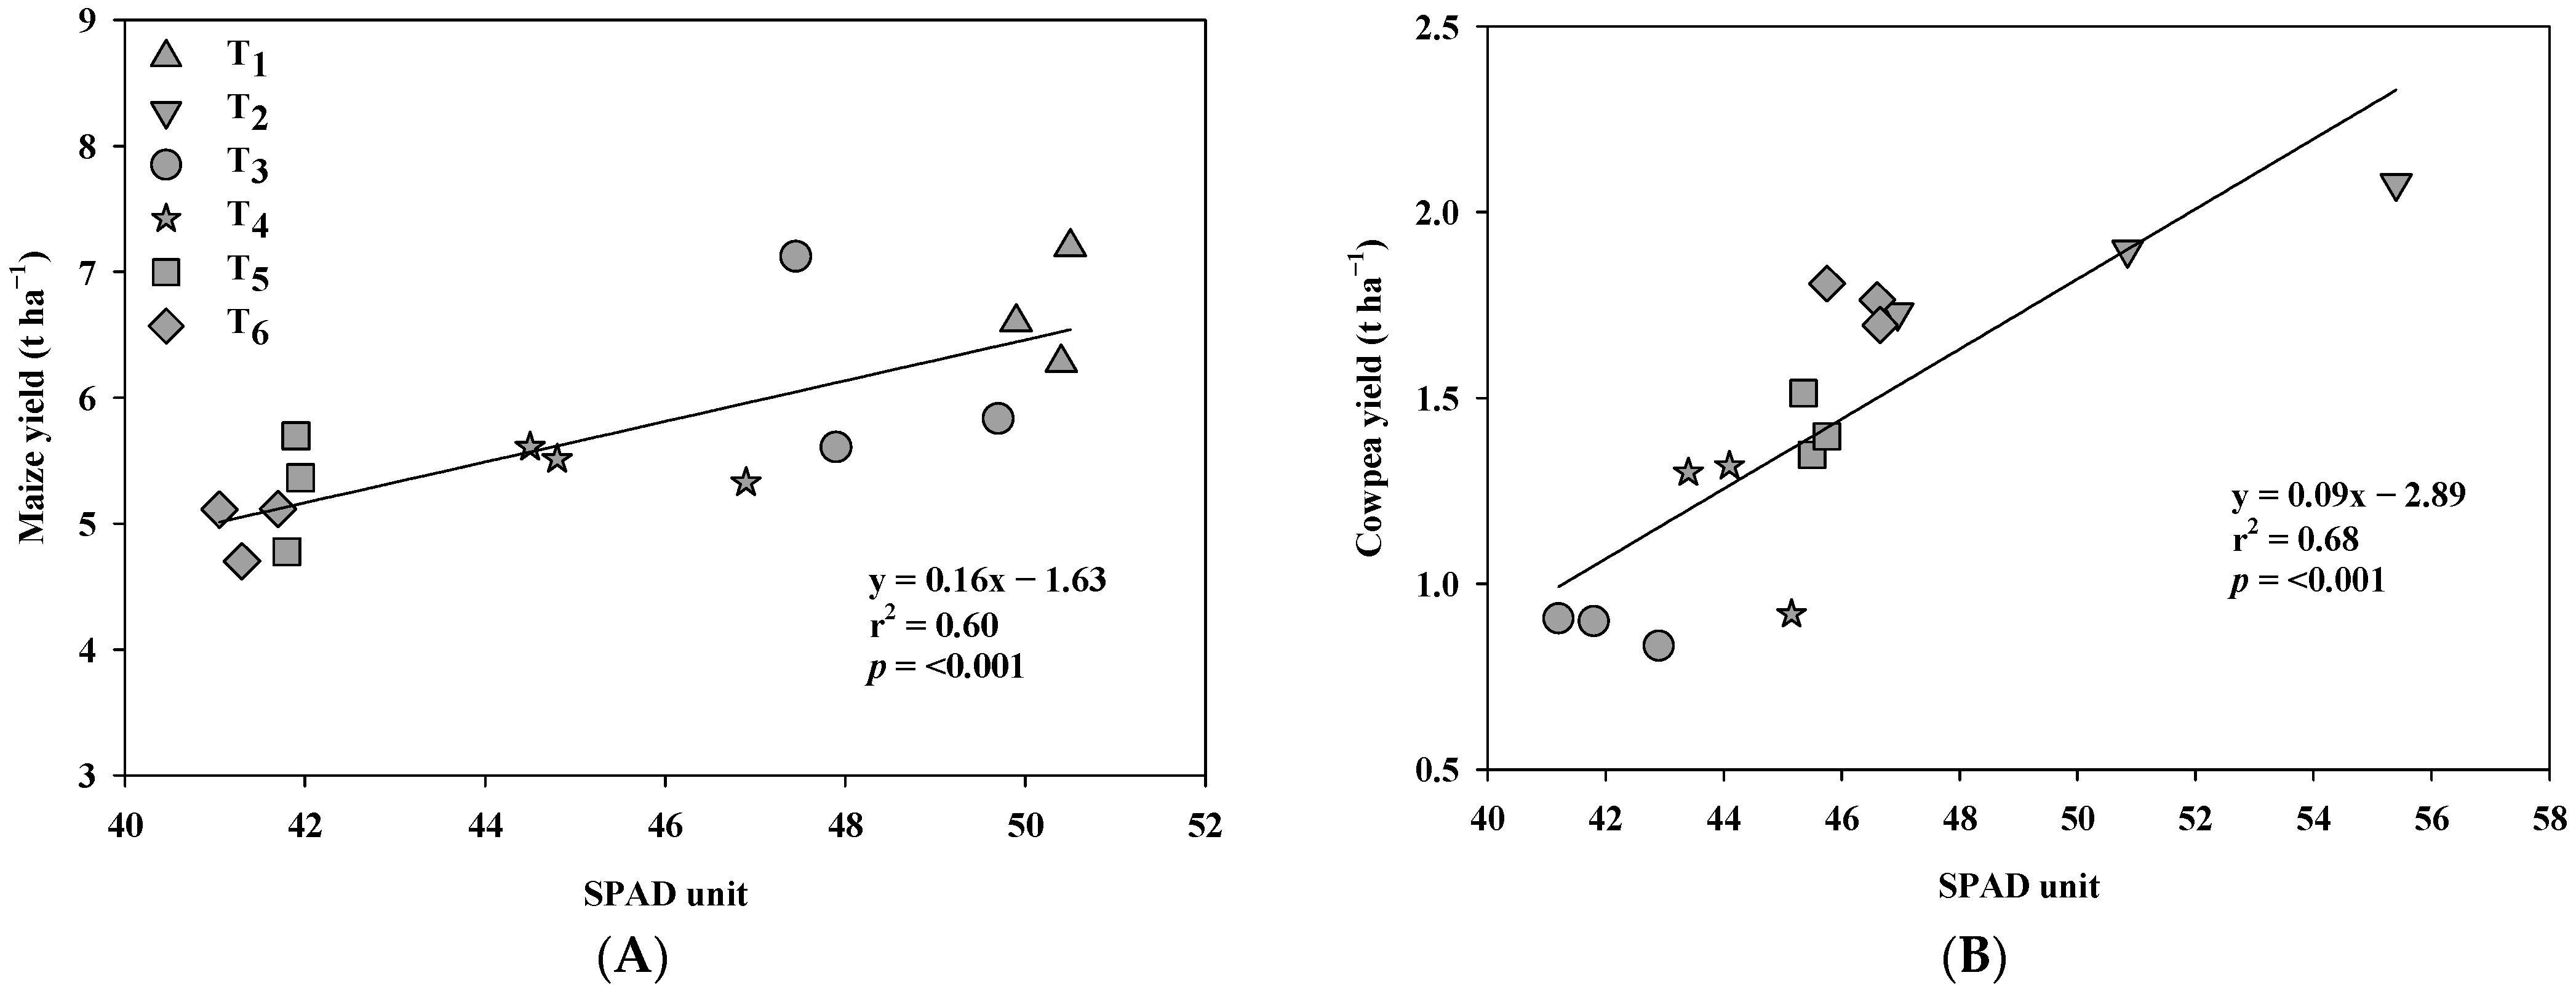
3.1. Effects of Intercropping Systems on Maize Growth

There were no significant effects of intercropping on maize growth in relation to variation in maize height or the number of cobs per plant among the treatments (F ratio = 0.55, p > 0.05, Table 2 and Table S9). Cob length and diameter differed significantly in maize sown under sole compared to intercropped plants. (F ratio = 36.17 and 12.64 for cob length and diameter respectively, p < 0.01, Table 2 and Table S5). T1 had the longest cob (21.3 ± 0.50 cm) and the highest cob diameter (14.76 ± 0.23 cm), whereas the shortest cob (17.8 ± 0.03 cm) and diameter (13.03 ± 0.08 cm) were in T6. The number of grains per cob differed significantly among the treatments (F ratio = 5.93, p < 0.01, Table 2). T1 (sole maize) produced the highest number of grains per cob (598 ± 9) and was statistically similar to T3 (553 ± 10). On the other hand, all the intercropping treatments, i.e., T3 to T6, produced a relatively lower number of grains per cob. A similar trend was also observed in the stover yield, which had the highest statistical values in T1 followed by T3, whereas T6 showed the lowest values (Table 2). No significant difference was observed in the 1000-grain weight and harvest index of maize (F ratio = 4.86 and 1.2, respectively, and p > 0.05). The successive sowing of maize under intercropping resulted in a significantly lower yield than sole cropping (6.69 ± 0.26 t ha−1) with the lowest value (4.97 ± 0.03 t ha−1) in T6 (Table 5). The cumulative time requirement (day) for flowering was significantly lower in T5 and T6 than in other treatments (Figure 1A). At the same time, the average heat units received per day during the vegetative phase of maize was significantly greater in T6 than in T1 and T3 (F ratio = 8.2 and 68.79, respectively, p < 0.01, Figure 1B).
In the SPAD, measurements of maize varied significantly for different treatments (F ratio = 133.05, p < 0.01, Figure 2A). The highest SPAD value was in sole maize (T1) and it reduced significantly when grown with cowpea. Among the intercropping treatments, SPAD values were lower when maize was sown after cowpea (T4 to T6) than the simultaneous maize–cowpea intercropping (T3). There was also a significant positive relationship between SPAD value and grain yield of maize in Figure 3A (r2 = 0.60, p < 0.01).

3.2. Effects of Intercropping Systems on Cowpea Growth

The effects of different treatments on cowpea growth are shown in Table 3. There were significant differences between treatments in the number of pods per plant, pod weight, seeds per plant, 1000-seeds weight, stover, and seed yield (p < 0.05, Tables S6 and S10). The performance of cowpea in terms of seed and stover yield was significantly greater under sole cropping than intercropping while among the intercropping treatments, T6 performed better than T3. However, the performance of T6 was similar to T2 regarding the number of pods per plant and number of seeds per plant (p < 0.05, Table 3).
No significant difference in plant height, number of branches, number of seeds per pod, nor pod length were found among the treatments (p > 0.05, Table 3). The HI was significantly lower in T3 than all other treatments. Regarding the SPAD measurements of cowpea (Figure 2B), there were significant differences between treatments (F ratio = 7.14, p < 0.01, Table S6). Compared to sole cropping (T2), SPAD values were lower in T3 and T4 treatment, while these values were similar in T5 and T6 (Figure 2B). Moreover, a positive relationship between SPAD value and cowpea seed yield (r2 = 0.68, p < 0.01) is shown in Figure 3B. The values were higher in the sole cowpea treatment (T2) than intercropping treatments.

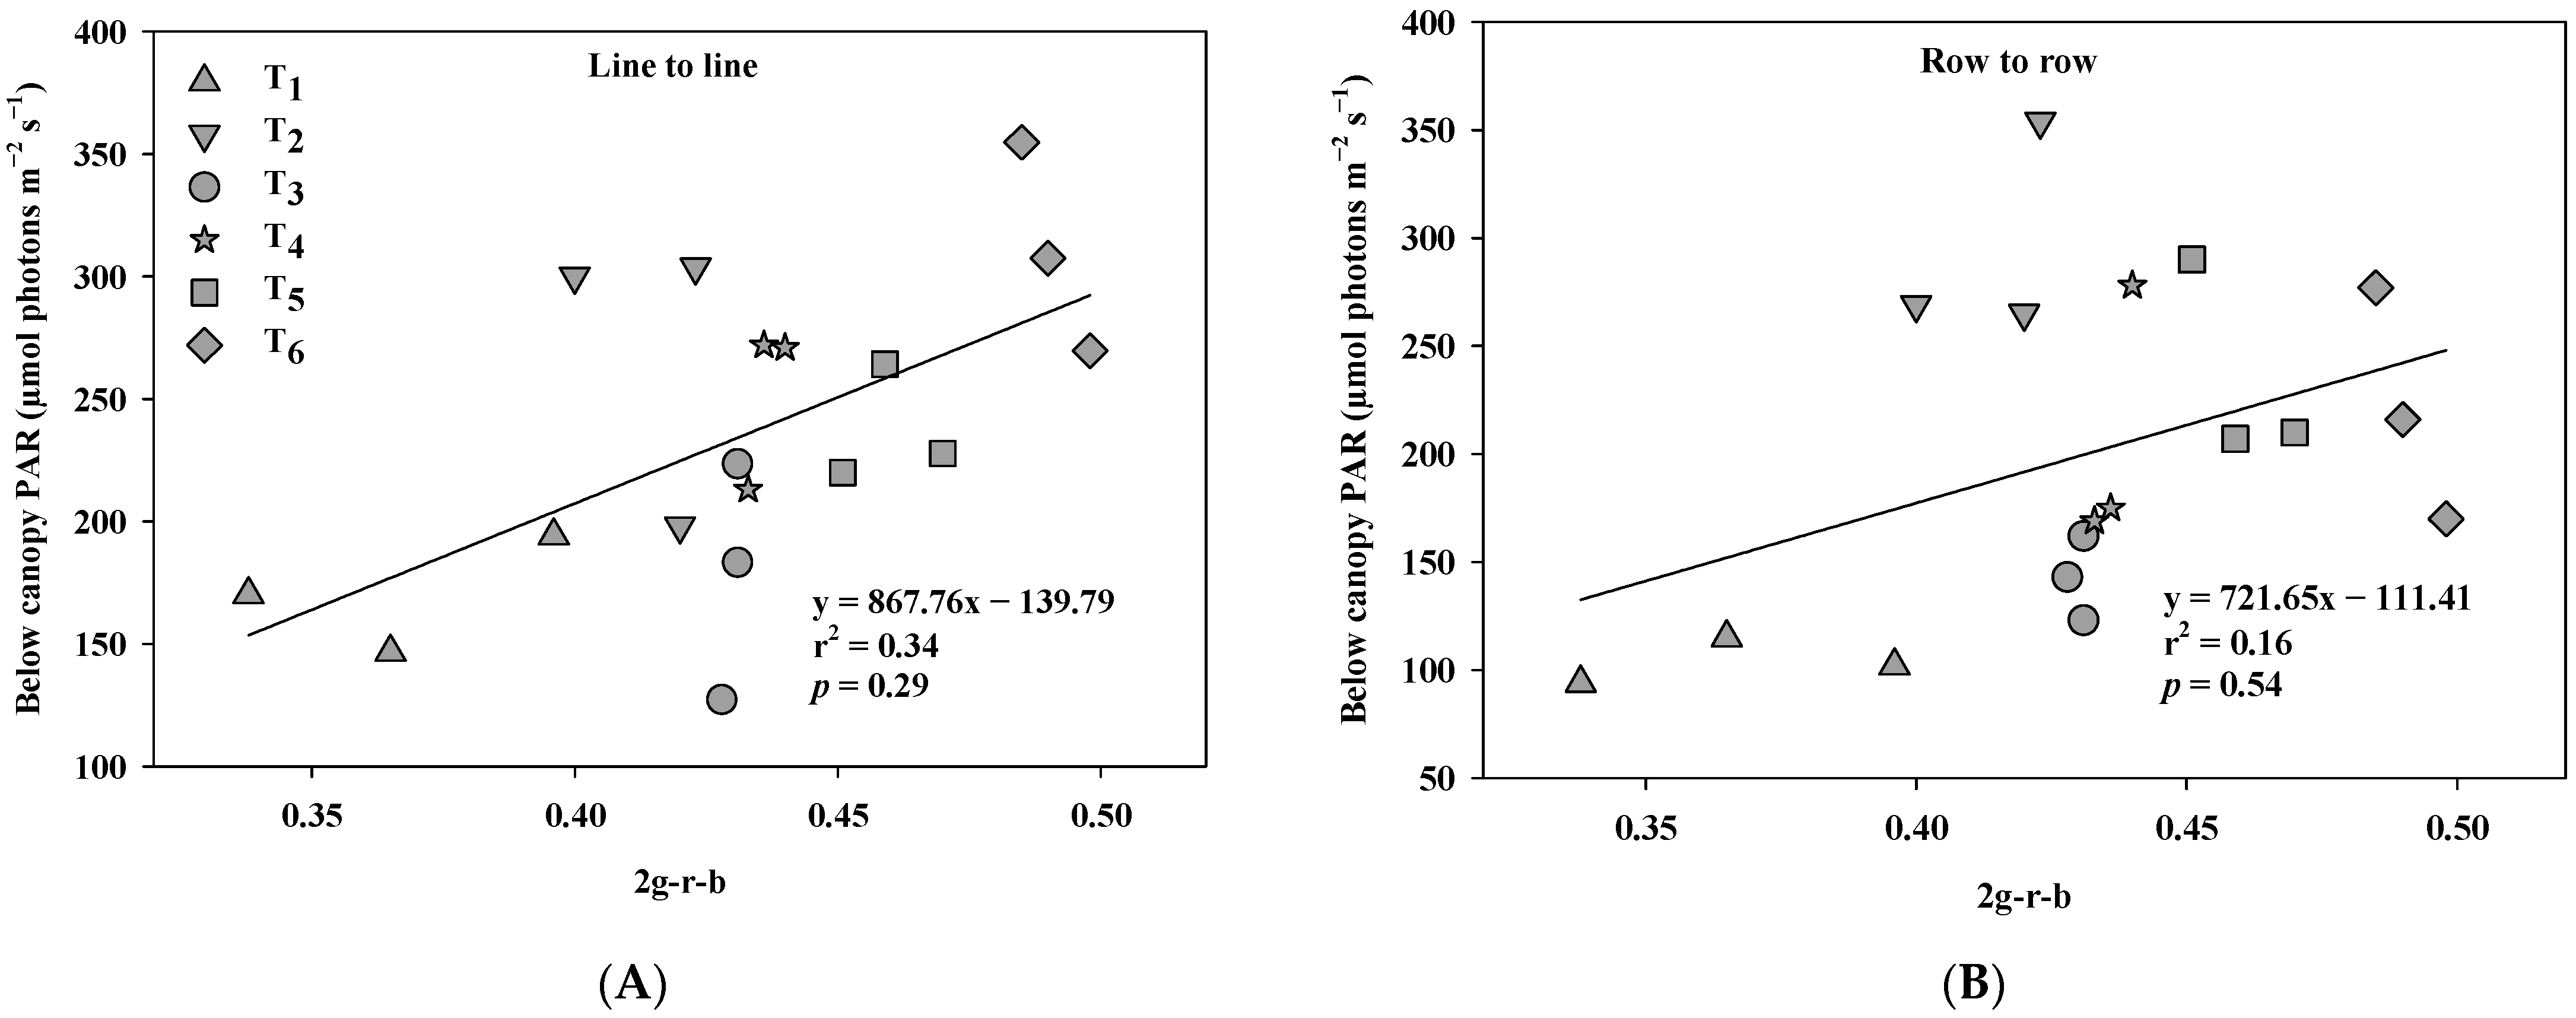
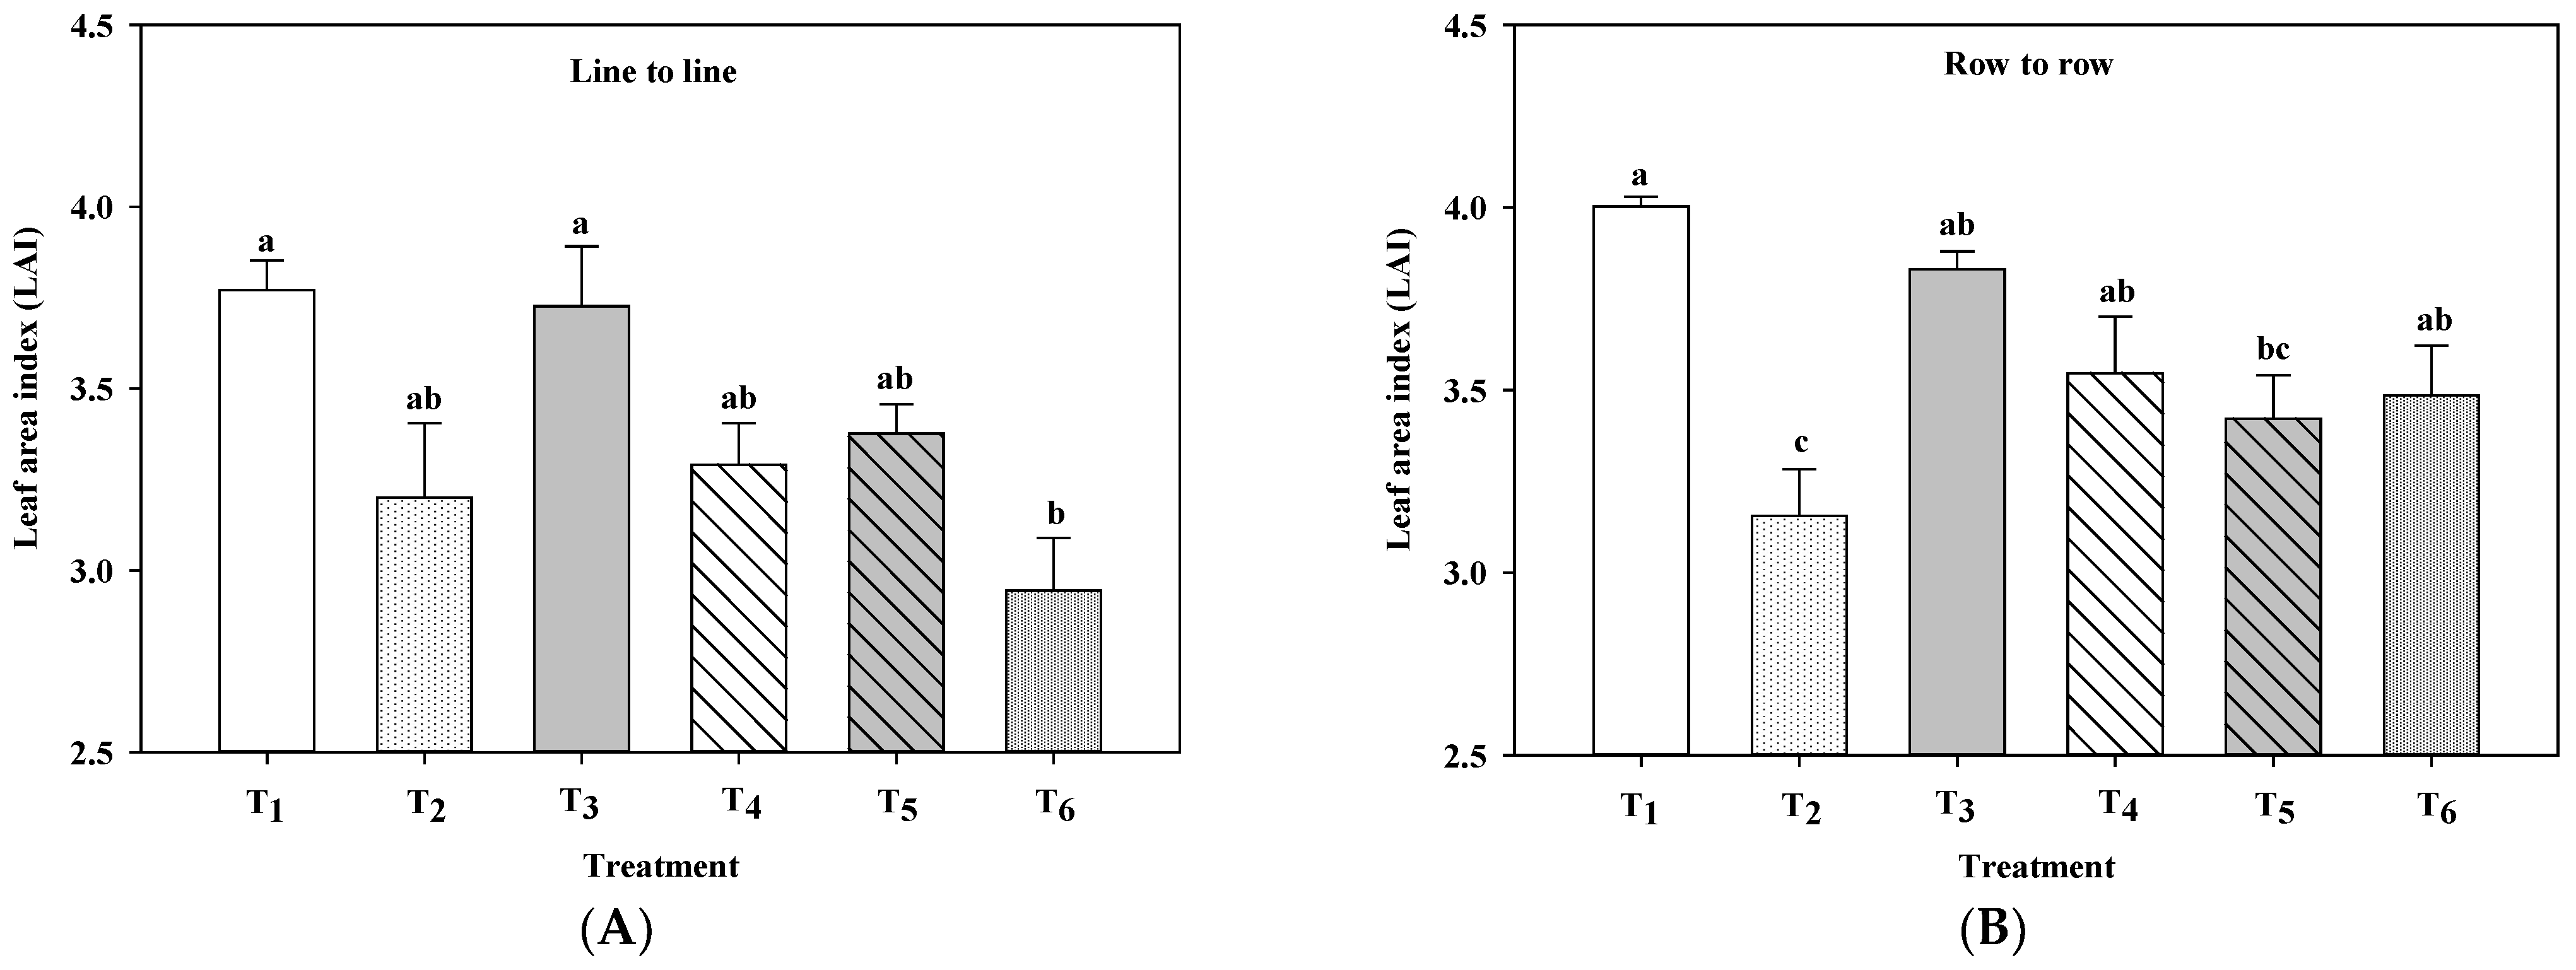
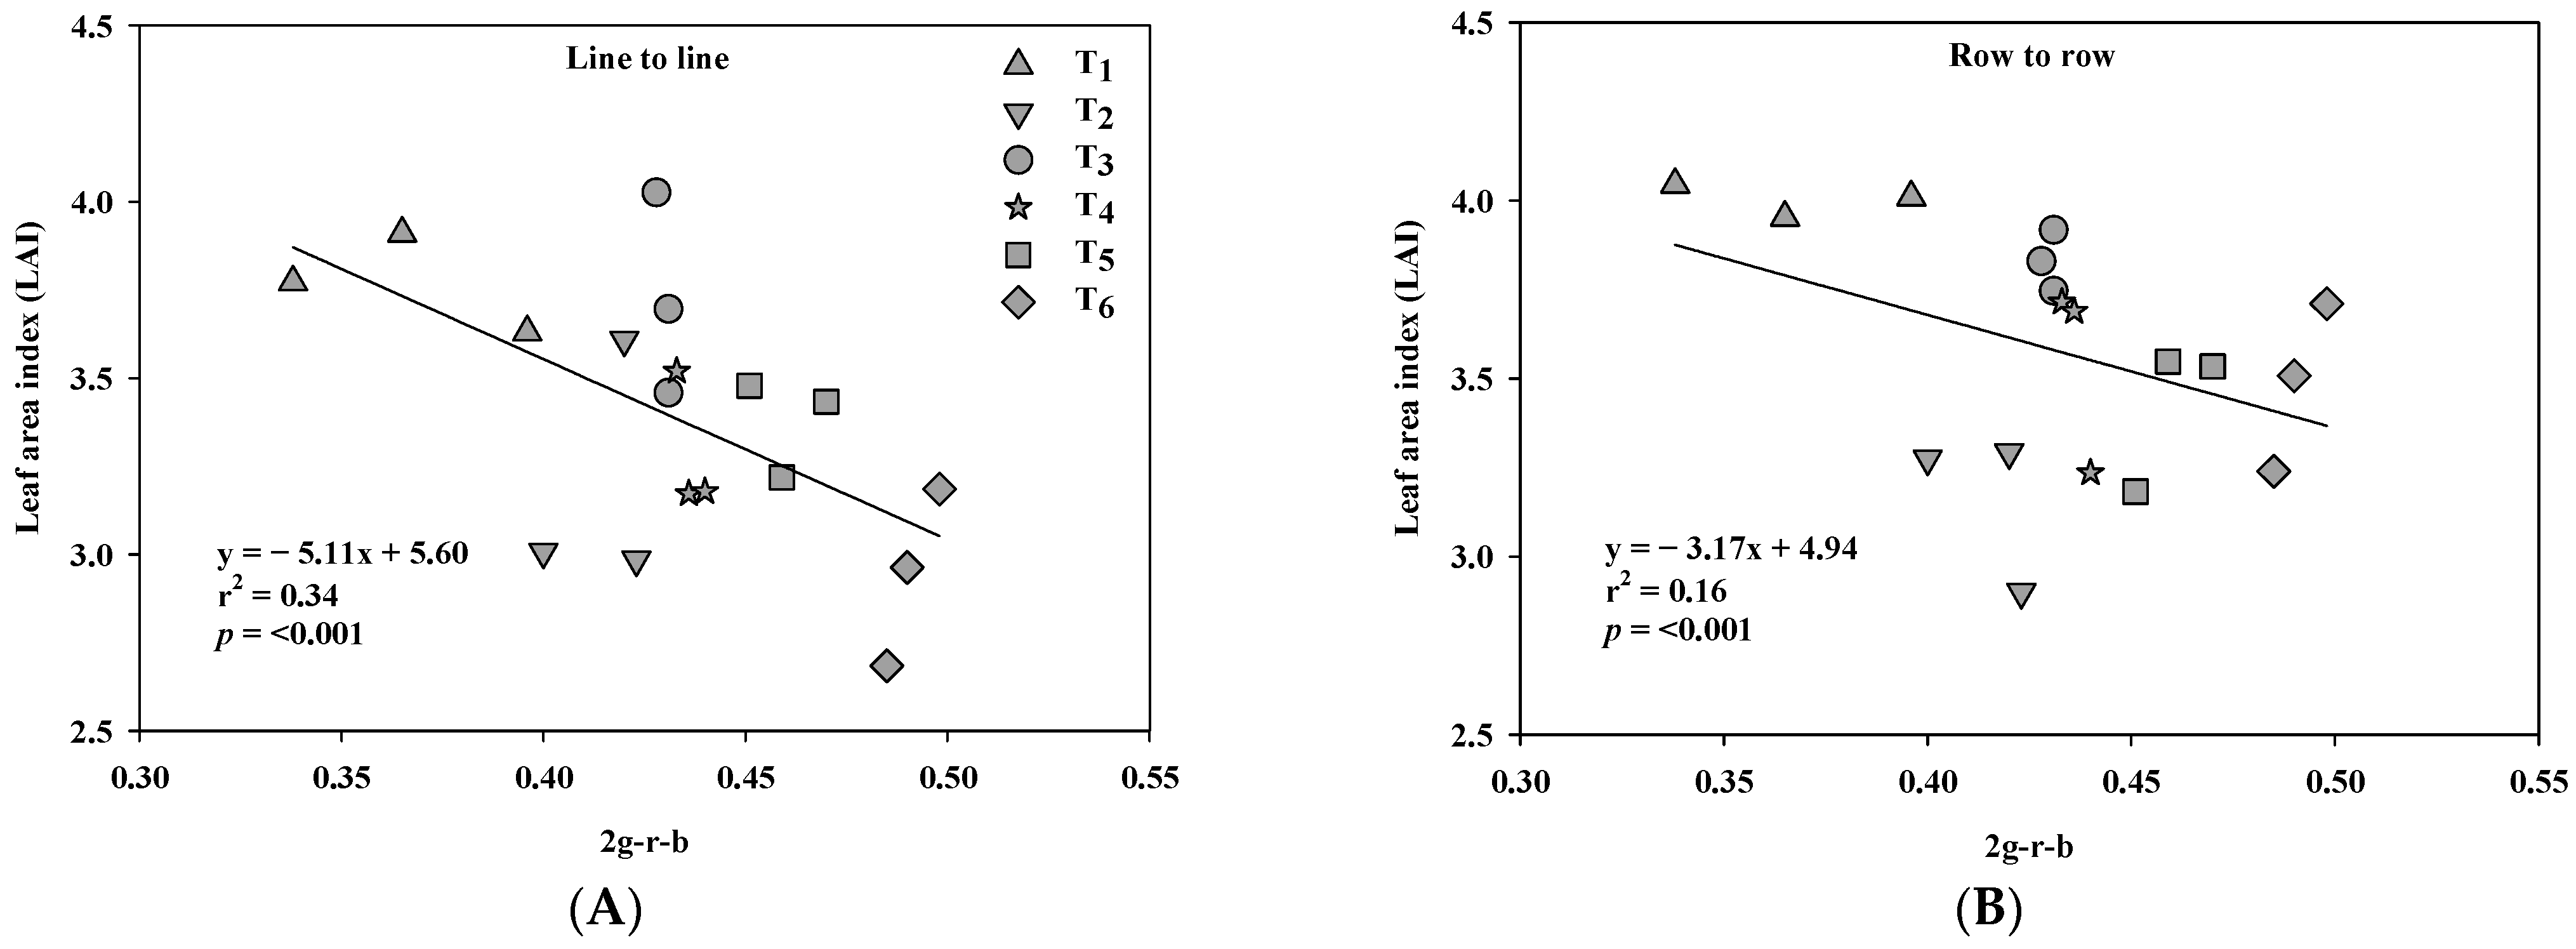
3.3. Intercropping Effects on the Above-Ground Competition

The camara-based vegetative indices, an index for canopy architecture, was measured as 2g-red-b and VARI. There is no significant variation among treatments (F ratio = 0.66, p > 0.05, Table 4). Similarly, for VARI, there is no significant variation among treatments (F ratio = 1.45, p > 0.05).
The below-canopy PAR values measured in between lines and rows showed significant variation among the treatments (F ratio = 4.66 and 6.76, p < 0.05, Figure 4A,B, Table S7). The PAR values were relatively lower at T1 and T3 than other treatments. There were positive relationships between below-canopy PAR and 2g-red-b (r2 = 0.34 and r2 = 0.16, line to line and row to row, respectively). However, these relationships were not statistically significant (Figure 5).
Contrary to PAR, the LAI measured between lines and rows varies depending on treatment (Figure 6). The LAI, measured in between lines, was relatively lower in T3 than other treatments (F ratio = 4.66, p < 0.01, Table S7). However, the LAI, measured in between rows, was significantly lower in sole cowpea than all other treatments (F ratio = 6.76, p < 0.01, Table S7). There were significant negative relationships (r2 = 0.34 and 0.16, respectively for line to line and row to row) between LAI and 2g-red-b (Figure 7).

3.4. Performance of Intercropping

Compared to sole cropping of cowpea, all the intercropped treatments and sole maize cultivation showed a better performance in terms of maize equivalent yield (Table 5 and Table S11). The highest maize equivalent yield was recorded in T3 (6.72 ± 0.46 t ha−1), and the lowest maize equivalent ratio was found in T1 (1.14 ± 0.06 t ha−1). However, the performance of maize under sole and intercropping were similar in terms of maize equivalent yield. The LER was significantly greater in the intercropping system than in both sole cropping practices (F ratio = 35.26, p < 0.01, Table 5). Moreover, among intercropping practices, it was significantly greater in T6, LER (1.67 ± 0.05) than other treatments (e.g., LER (1.39 ± 0.09) at T3).

3.5. Economic Profitability

The economic performances, calculated as total gross and net return and BCR, varied significantly (F ratio = 44.33, 23.04, and 14.34, respectively and p < 0.01, Table 6). Specifically, the total gross return was significantly greater in intercropping practices (e.g., USD 1394.82 ± 25.08 ha−1 in treatment T6), than sole cowpea (USD 559.62 ± 29.57 ha−1). Similar to gross return, there was a relatively greaterer net return (e.g., USD 786.32 ± 25.08 ha−1 in T6) than T2 (USD 173.97 ± 29.57 ha−1). As a result, the BCR was greater in intercropping treatments (e.g., 2.29 ± 0.04 in T6) than T2 (1.45 ± 0.08). However, the performance of sole maize was similar to intercropping in terms of total gross and net returns and thus benefit cost ratios.

4. Discussion

4.1. Maize Productivity

Crop performance can be affected when grown under different levels of competition [28]. In our experiment, maize produced significantly greater biomass and grain yield in sole cropping than intercropped with cowpea. The largest reduction in maize yield (25.7%) was observed in maize–cowpea intercropping, where maize was sown 3 wks after cowpea. This reduction in yield could be associated with competition between species for resources. When crops are sown consecutively, the first crop generally receives a competitive advantage over the other [37,38,39]. We observed a similar phenomenon in our study. Maize likely had less access to some of the resources (e.g., nutrient and water) when it was sown after cowpea [37]. For instance, the SPAD value, an indicator for plant nitrogen content, was significantly lower in T6 t than the other treatments, while a significant positive relationship was obtained between SPAD value and grain yield of maize (Figure 3). In contrast, the competition for light resources might not have played a significant role in reducing the yield of maize when sown after cowpea as the below-canopy PAR was higher in T6 compared to T1 (sole cropping) and T3 (simultaneous sowing). The late-sown maize completed its vegetative period faster than sole and simultaneous intercropping due to experiencing a relatively higher average temperature during the vegetative period. This suggests that this treatment had less opportunity to accumulate sufficient assimilate to partition into grain (Figure 4). These results suggest that maize yield was sacrificed due to late planting, which may be related to competition for soil nutrients and changes in climate conditions.

4.2. Cowpea Productivity

Cowpea, being a legume, is less competitive than maize since maize is generally taller with a fast-growing or more extensive root system [40,41]. Therefore, it is likely that intercropping of these species may reduce the yielding ability of cowpea to a greater extent than maize. In our study, cowpea yielded the maximum when cultivated as a sole crop, whereas the lowest yield was observed when maize and cowpea were sown simultaneously (Table 6). Among the intercropped treatments, its seed yield increased with the increasing time-lapse of maize sowing. The maximum seed yield was achieved from T6 (i.e., sowing maize after three wks), a yield comparable to the sole cropping (Table 6). However, the biological yield of T2 (sole cowpea) was significantly greater than T6. Compared to sole cropping, the reduction in yield in intercropping practices can be attributed to the competition for different resources (light, nutrient, and possibly water). However, these competitions for resources were lessened when maize was sown after cowpea, especially in T6. Because cowpea was grown alone in the first three weeks, leading to an increase in its competitive ability, the difference in sowing time changed the resource demand. The study’s results support these attributions. For instance, the chlorophyll content measured in cowpea leaves was significantly lower in cowpea grown simultaneously with maize, whereas these values increased when maize was sown after cowpea. Moreover, the share of cowpea biomass to the combined biological yield increased from 12% in the simultaneous sowing of both species to 22% in the T6 (Table 6). Altogether, our results confirm previous findings where TND were examined as a mean of increasing intercropping productivity [27].
Fertilizer application at different rates can affect crop yield. The amount of N application in our study was different for sole (20 kg ha−1) and intercropping since, in intercropping (120 kg ha−1), both maize and cowpea share the applied N. Although the amount of N input was different between T2 and T6, no significant difference was observed in seed plant−1 (Table 3) and seed yield (Table 5) of cowpea. This result suggests that maize possibly absorbed most of the applied N, since it cannot fix N, while it has larger root volume, providing an advantage to acquire N [42,43]. In fact, legumes preferably fix more N when grown with other species [44]. However, N fixation may reduce yield since it is an energy-driven process.

4.3. Intercropping Performance

Intercropping using TND can significantly reduce competition between species since the resource demand of one space does not completely overlap with their component species. This allows for diversity in resource uses both in time and space [16,38,42]. However, there are trade-offs between complementarity and competition interactions among different species shaping the outcome of any intercropping practices. In our study, the yield performance of maize was reduced by 7.5% and 25%, respectively, in T3 (simultaneous) and T6 (TND for 3 wks) when compared to sole cropping (Figure S4). The possible reasons are a reduction in resource availability and changes in climatic conditions (discussed in the previous section). As expected, the seed yield of cowpea was higher in the T6 and relatively lower in T3 due to getting an advantage of resources use (light, water, and nutrient) (Figure S5). The combined outcome of the intercropping systems is usually evaluated with LER and equivalent yield performance (here, maize equivalent yield). The cumulative relative performance (i.e., LER) was significantly higher in T6 than T3, suggesting that there is an overall benefit of intercropping with a 3-wk sowing delay rather than simultaneous intercropping. However, the maize equivalent yield of each intercropping system was similar, and not different from sole maize. Moreover, the maize and cowpea combined biomass production was slightly greater in T3 than T6. The economic returns of all intercropped treatments were also similar to sole maize. All these results suggest that intercropping practices were not beneficial over sole cropping of maize, while intercropping with TND was also not advantageous. However, maize cowpea intercropping was more beneficial than sole cowpea in all aspects (LER, maize equivalent yield, and economic benefits), suggesting species specific advantages of intercropping. These discrepancies also underscore the relative economic value of a crop. Since the price of cowpea is relatively low, the yield advantages achieved through cowpea did not have enough weightage to have a significant effect among different intercropping treatments.
Interactions of component species in terms of resources and their feedback determine the overall performance of intercropping. In our case, there were competitions for resources under intercropping practices that caused a reduction in yield, contrary than their sole cropping counterparts. For instance, N concentration in leaves of both species, determined using a SPAD meter, was lower under intercropping than sole cropping. In addition, there was a significant positive relationship between SPAD value and yield for maize and cowpea. These results indicate that competition for N determines the yield of component crops. Among the intercropping practices, an increase in sowing time difference increases the SPAD value of cowpea while it was reduced in maize. Although biological nitrogen fixation (BNF, measured as the number of nodules) (Figure S3) and N concentration (as SPAD value) was higher in T6 than T3 in cowpea, this greater N supply did not change the overall performance of both species. In contrast to our findings, previous studies reported that increased BNF could increase the yields in maize–legume intercropping systems [10,43]. Although it is expected that N acquisition from different soil layers and N transfer from legume to non-legume component species could contribute to greater N acquisition than sole cropping, N supply through these processes might be minimal in our case [23,25,43,44]. Although not measured in this study, intercropping could have increased the nutrient stock in the soil by reducing nutrient loss and thus, could improve their uptake (e.g., P and K) due to the complementarity interactions between species [45,46,47,48]. Apart from complementary nutrients, TND (sequential planting) also improved plant moisture acquisition since established cowpea experienced less sensitivity to moisture stress [49,50].

5. Conclusions

We assessed the performance of maize–cowpea intercropping when maize was sown after the planting of cowpea. In our experiment, both maize and cowpea production were reduced under intercropping than in sole cropping. When the performance of intercropping was assessed in terms of LER and maize equivalent yield, intercropping was advantageous in terms of land utilization but not in terms of maize equivalent yield. Moreover, the performance of maize regarding the maize equivalent yield was similar under sole and intercropping. However, the relative advantage of intercropping, in terms of LER, and net returns was greater than sole cowpea. These discrepancies in performances suggest that a relatively low monetary contribution of the component crop may not provide a greater economic benefit, although there is a clear advantage of land utilization. Considering all these together, it can be concluded that maize–cowpea intercropping with maize sown 3 wks after cowpea was advantageous in terms of land utilization for farmers in Bangladesh. Future studies are needed to explore and assess this approach covering efficiency use of water and nutrients in different seasons and contrasting environments over several years.

Supplementary Materials

The following supporting information can be downloaded at: https://0-www-mdpi-com.brum.beds.ac.uk/article/10.3390/land11040581/s1, Figure S1: Schematic diagram of experimental design; Figure S2: A photograph of field trial; Table S1: Monthly average air temperature, humidity and total rainfall, cloud and sunshine of the experimental site during the period from December 2018 to May 2019; Table S2: Sowing dates and duration between maize and cowpea; Table S3: General morphological indicators and the growth habit of cowpea; Table S4: Age of cowpea and maize in measurement of LAI, light interception, Canopy coverage and architecture; Table S5: ANOVA of yield and yield contributing characters of maize; Table S6: ANOVA of yield and yield contributing characters of cowpea; Table S7: ANOVA of Intercropping effects on the above-ground competition; Table S8: ANOVA of intercropping systems on the economic analysis; Table S9: REML variance component estimates of maize; Table S10: REML variance component estimates of cowpea; Table S11: REML variance component estimates of intercropping analysis; Table S12: REML variance component estimates of above-ground competition; Figure S3: Nodules plant-1 of cowpea grown under different intercropping practices. The treatments are: T2—sole cowpea, T3—maize + cowpea intercropping, simultaneous sowing, T4—maize + cowpea intercropping, maize sown after 1 wk, T5—maize + cowpea intercropping, maize sown after 2 wk, and T6—maize + cowpea intercropping, maize sown after 3 wk. Different letters above the bars indicate statistically significant differences at Tukey’s HSD (a = 5%). Error bars represent the standard error of means, N = 3; Figure S4. Changes in the performance maize due to its cultivation under difference practices; Figure S5. Changes in cowpea yield as influenced by different cultivation practices; Figure S6. Yield advantage and economic benefits of intercropping.

Author Contributions

Conceptualization: S.M., S.K. and S.A.; methodology, S.M. and M.K.U.; software: S.M.; validation: S.M., S.K., M.H.M., M.A.M. and S.A.; formal analysis, A.A.S., S.M. and K.J.; investigation: S.M., S.K. and S.A.; resources: S.M.; data curation, A.A.S. and S.M.; writing—original draft preparation: A.A.S. and S.M.; writing—review and editing: K.J.; visualization: A.A.S., S.M. and K.J.; supervision: S.M. and K.J.; project administration: S.M.; funding acquisition: S.M. and K.J. All authors have read and agreed to the published version of the manuscript.

Funding

This research was conducted with funding from the Research and Training Centre, Patuakhali Science and Technology University. A financial support for article publication charge and Keiji Jindo’s contribution has been done by Agrosytem Research group of Wageningen University & Research.

Institutional Review Board Statement

Not applicable.

Informed Consent Statement

Not applicable.

Data Availability Statement

Data will be provided on request.

Acknowledgments

Keiji Jindo wishes to acknowledge financial support for working time allocation for this article with project number (3710473400). And also he thanks Agrosystems Research Groups for the article process change. Moreover, we are grateful to Jeff Werth, Senior Research Scientist at Queensland Department of Agriculture and Fisheries (DAF) for his generous contribution to our work, particularly in improving the language.

Conflicts of Interest

The authors declare no conflict of interest.

References

  1. Global Food Security Index (GFSI). Available online: https://impact.economist.com/sustainability/project/food-security-index/ (accessed on 28 February 2022).
  2. Mainuddin, M.; Kirby, M. National food security in Bangladesh to 2050. Food Secur. 2015, 7, 633–646. [Google Scholar] [CrossRef]
  3. Kukal, M.S.; Irmak, S. Climate-driven crop yield and yield variability and climate change impacts on the U.S. great plains agricultural production. Sci. Rep. 2018, 8, 3450. [Google Scholar] [CrossRef] [PubMed] [Green Version]
  4. Mango, N.; Makate, C.; Mapemba, L.; Sopo, M. The role of crop diversification in improving household food security in central Malawi. Agric. Food Secur. 2018, 7, 7. [Google Scholar] [CrossRef]
  5. Smith, A.; Snapp, S.; Dimes, J.; Gwenambira, C.; Chikowo, R. Doubled-up legume rotations improve soil fertility and maintain productivity under variable conditions in maize-based cropping systems in Malawi. Agric. Syst. 2016, 145, 139–149. [Google Scholar] [CrossRef]
  6. Cheng, A.; Mayes, S.; Dalle, G.; Demissew, S.; Massawe, F. Diversifying crops for food and nutrition security—a case of teff. Biol. Rev. 2017, 92, 188–198. [Google Scholar] [CrossRef]
  7. Renard, D.; Tilman, D. National food production stabilized by crop diversity. Nature 2019, 571, 257–260. [Google Scholar] [CrossRef]
  8. Steward, P.R.; Thierfelder, C.; Dougill, A.J.; Ligowe, I. Conservation agriculture enhances resistance of maize to climate stress in a Malawian medium-term trial. Agric. Ecosyst. Environ. 2019, 277, 95–104. [Google Scholar] [CrossRef]
  9. Martin-Guay, M.-O.; Paquette, A.; Dupras, J.; Rivest, D. The new green revolution: Sustainable intensification of agriculture by intercropping. Sci. Total Environ. 2018, 615, 767–772. [Google Scholar] [CrossRef]
  10. Rahman, N.; Larbi, A.; Kotu, B.; Asante, M.O.; Akakpo, D.B.; Mellon-Bedi, S.; Hoeschle-Zeledon, I. Maize–legume strip cropping effect on productivity, income, and income risk of farmers in northern Ghana. Agron. J. 2021, 113, 1574–1585. [Google Scholar] [CrossRef]
  11. Brooker, R.W.; Karley, A.J.; Newton, A.C.; Pakeman, R.J.; Schöb, C. Facilitation and sustainable agriculture: A mechanistic approach to reconciling crop production and conservation. Funct. Ecol. 2016, 30, 98–107. [Google Scholar] [CrossRef] [Green Version]
  12. Himmelstein, J.; Ares, A.; Gallagher, D.; Myers, J. A meta-analysis of intercropping in Africa: Impacts on crop yield, farmer income, and integrated pest management effects. Int. J. Agric. Sustain. 2017, 15, 1–10. [Google Scholar] [CrossRef]
  13. Tilman, D. Benefits of intensive agricultural intercropping. Nat. Plants 2020, 6, 604–605. [Google Scholar] [CrossRef] [PubMed]
  14. Brooker, R.W.; Bennett, A.E.; Cong, W.; Daniell, T.J.; George, T.S.; Hallett, P.D.; Hawes, C.; Iannetta, P.P.M.; Jones, H.G.; Karley, A.J.; et al. Improving intercropping: A synthesis of research in agronomy, plant physiology and ecology. New Phytol. 2015, 206, 107–117. [Google Scholar] [CrossRef] [PubMed]
  15. Worku, W.; Temeche, D.; Gossa, R.; Abate, B. Agronomic management options to enhance adoption of maize–common bean–common bean sequential intercropping in southern Ethiopia. J. Crop Sci. Biotechnol. 2021, 24, 307–318. [Google Scholar] [CrossRef]
  16. Xu, Z.; Li, C.; Zhang, C.; Yu, Y.; van der Werf, W.; Zhang, F. Intercropping maize and soybean increases efficiency of land and fertilizer nitrogen use; A meta-analysis. Field Crop. Res. 2020, 246, 107661. [Google Scholar] [CrossRef]
  17. Javanmard, A.; Nasab, A.D.M.; Javanshir, A.; Moghaddam, M.; Janmohammadi, H. Forage yield and quality in intercropping of maize with different legumes as double-cropped. J. Food Agric. Environ. 2009, 7, 163–166. [Google Scholar]
  18. Zhang, D.; Sun, Z.; Feng, L.; Bai, W.; Yang, N.; Zhang, Z.; Du, G.; Feng, C.; Cai, Q.; Wang, Q.; et al. Maize plant density affects yield, growth and source-sink relationship of crops in maize/peanut intercropping. Field Crop. Res. 2020, 257, 107926. [Google Scholar] [CrossRef]
  19. Zhang, R.; Meng, L.; Li, Y.; Wang, X.; Ogundeji, A.O.; Li, X.; Sang, P.; Mu, Y.; Wu, H.; Li, S. Yield and nutrient uptake dissected through complementarity and selection effects in the maize/soybean intercropping. Food Energy Secur. 2021, 10, 379–393. [Google Scholar] [CrossRef]
  20. Renwick, L.L.R.; Kimaro, A.A.; Hafner, J.M.; Rosenstock, T.S.; Gaudin, A.C.M. Maize-pigeonpea intercropping outperforms monocultures under drought. Front. Sustain. Food Syst. 2020, 4, 253. [Google Scholar] [CrossRef]
  21. Kumar, S. Production potential, soil moisture and temperature as influenced by maize- legume intercropping. Int. J. Sci. Nat. 2012, 3, 41–46. [Google Scholar]
  22. La Guardia Nave, R.; Corbin, M. Forage warm-season legumes and grasses intercropped with corn as an alternative for corn silage production. Agronomy 2018, 8, 199. [Google Scholar] [CrossRef] [Green Version]
  23. Rodriguez, C.; Carlsson, G.; Englund, J.-E.; Flöhr, A.; Pelzer, E.; Jeuffroy, M.-H.; Makowski, D.; Jensen, E.S. Grain legume-cereal intercropping enhances the use of soil-derived and biologically fixed nitrogen in temperate agroecosystems. A meta-analysis. Eur. J. Agron. 2020, 118, 126077. [Google Scholar] [CrossRef]
  24. Hugar, H.Y.; Palled, Y.B. Effect of intercropped vegetables on maize and associated weeds in maize-vegetable intercropping systems. Karnataka J. Agric. Sci. 2008, 21, 159–161. [Google Scholar]
  25. Jensen, E.S.; Carlsson, G.; Hauggaard-Nielsen, H. Intercropping of grain legumes and cereals improves the use of soil N resources and reduces the requirement for synthetic fertilizer N: A global-scale analysis. Agron. Sustain. Dev. 2020, 40, 5. [Google Scholar] [CrossRef] [Green Version]
  26. Jiang, L.; Wu, S.; Liu, Y.; Yang, C. Grain security assessment in Bangladesh based on supply-demand balance analysis. PLoS ONE 2021, 16, e0252187. [Google Scholar] [CrossRef]
  27. Dong, N.; Tang, M.; Zhang, W.; Bao, X.; Wang, Y.; Christie, P. Temporal differentiation of crop growth as one of the drivers of intercropping yield advantage. Sci. Rep. 2018, 8, 3110. [Google Scholar] [CrossRef] [Green Version]
  28. Li, L.; Tilman, D.; Lambers, H.; Zhang, F. Plant diversity and overyielding: Insights from belowground facilitation of intercropping in agriculture. New Phytol. 2014, 203, 63–69. [Google Scholar] [CrossRef]
  29. Yu, Y.; Stomph, T.J.; Makowski, D.; van der Werf, W. Temporal niche differentiation increases the land equivalent ratio of annual intercrops: A meta-analysis. Field Crop. Res. 2015, 184, 133–144. [Google Scholar] [CrossRef]
  30. Land Resource Appraisal of Bangladesh for Agricultural Development. Report 2: Agroecological Regions of Bangladesh. Available online: https://agris.fao.org/agris-search/search.do?recordID=XF2016071882 (accessed on 28 February 2022).
  31. Iftekhar, M.S.; Islam, M.R. Managing mangroves in Bangladesh: A strategy analysis. J. Coast. Conserv. 2004, 10, 139–146. [Google Scholar] [CrossRef]
  32. Mcmaster, G. Growing degree-days: One equation, two interpretations. Agric. For. Meteorol. 1997, 87, 291–300. [Google Scholar] [CrossRef] [Green Version]
  33. Sakamoto, T.; Gitelson, A.A.; Nguy-Robertson, A.L.; Arkebauer, T.J.; Wardlow, B.D.; Suyker, A.E.; Verma, S.B.; Shibayama, M. An alternative method using digital cameras for continuous monitoring of crop status. Agric. For. Meteorol. 2012, 154–155, 113. [Google Scholar] [CrossRef] [Green Version]
  34. Anjeneyulu, V.R.; Singh, S.P.; Pal, M. Effect of competition free period and technique and pattern of pearmillet planting on growth and yield of mungbean and total productivity in solid pearlmillet and pearlmillet and pearlmillet/mungbean intercropping system. Indian J. Agron. 1982, 27, 219–226. [Google Scholar]
  35. Harwood, R.R. Small farm development: Understanding and improving farming systems in the humid tropics. Exp. Agric. 1979, 17, 220. [Google Scholar] [CrossRef]
  36. Willey, R.W. Intercropping its importance and research needs. Part I: Competition and yield advantages. Field Crop. Abstr. 1979, 32, 1–10. [Google Scholar]
  37. Liu, X.; Rahman, T.; Song, C.; Su, B.; Yang, F.; Yong, T.; Wu, Y.; Zhang, C.; Yang, W. Changes in light environment, morphology, growth and yield of soybean in maize-soybean intercropping systems. Field Crop. Res. 2017, 200, 38–46. [Google Scholar] [CrossRef]
  38. Ren, Y.; Liu, J.; Wang, Z.; Zhang, S. Planting density and sowing proportions of maize-soybean intercrops affected competitive interactions and water-use efficiencies on the Loess Plateau, China. Eur. J. Agron. 2016, 72, 70–79. [Google Scholar] [CrossRef]
  39. Zhu, J.; Vos, J.; Van Der Werf, W.; Van Der Putten, P.E.L.; Evers, J.B. Early competition shapes maize whole-plant development in mixed stands. J. Exp. Bot. 2014, 65, 641–653. [Google Scholar] [CrossRef] [Green Version]
  40. Carr, P.M.; Martin, G.B.; Caton, J.S.; Poland, W.W. Forage and nitrogen yield of barley—pea and oat—pea intercrops. Agron. J. 1998, 90, 79–84. [Google Scholar] [CrossRef]
  41. Carruthers, K.; Prithiviraj, B.; Fe, Q.; Cloutier, D.; Martin, R.; Smith, D. Intercropping corn with soybean, lupin and forages: Yield component responses. Eur. J. Agron. 2000, 12, 103–115. [Google Scholar] [CrossRef]
  42. Li, C.; Hoffland, E.; Kuyper, T.W.; Yu, Y.; Zhang, C.; Li, H.; Zhang, F.; van der Werf, W. Syndromes of production in intercropping impact yield gains. Nat. Plants 2020, 6, 653–660. [Google Scholar] [CrossRef]
  43. Namatsheve, T.; Cardinael, R.; Corbeels, M.; Chikowo, R. Productivity and biological N2-fixation in cereal-cowpea intercropping systems in sub-Saharan Africa. A review. Agron. Sustain. Dev. 2020, 40, 30. [Google Scholar] [CrossRef]
  44. Namatsheve, T.; Chikowo, R.; Corbeels, M.; Mouquet-Rivier, C.; Icard-Vernière, C.; Cardinael, R. Maize-cowpea intercropping as an ecological intensification option for low input systems in sub-humid Zimbabwe: Productivity, biological N2-fixation and grain mineral content. Field Crop. Res. 2021, 263, 108052. [Google Scholar] [CrossRef]
  45. Long, G.; Li, L.; Wang, D.; Zhao, P.; Tang, L.; Zhou, Y.; Yin, X. Nitrogen levels regulate intercropping-related mitigation of potential nitrate leaching. Agric. Ecosyst. Environ. 2021, 319, 107540. [Google Scholar] [CrossRef]
  46. Wang, D.; Yi, W.; Zhou, Y.; He, S.; Tang, L.; Yin, X.; Zhao, P.; Long, G. Intercropping and N application enhance soil dissolved organic carbon concentration with complicated chemical composition. Soil Tillage Res. 2021, 210, 104979. [Google Scholar] [CrossRef]
  47. Jiao, N.; Wang, F.; Ma, C.; Zhang, F.; Jensen, E.S. Interspecific interactions of iron and nitrogen use in peanut (Arachis hypogaea L.)-maize (Zea mays L.) intercropping on a calcareous soil. Eur. J. Agron. 2021, 128, 126303. [Google Scholar] [CrossRef]
  48. Xue, Y.; Xia, H.; Christie, P.; Zhang, Z.; Li, L.; Tang, C. Crop acquisition of phosphorus, iron and zinc from soil in cereal/legume intercropping systems: A critical review. Ann. Bot. 2016, 117, 363–377. [Google Scholar] [CrossRef]
  49. Kimaro, A.A.; Timmer, V.R.; Chamshama, S.A.O.; Ngaga, Y.N.; Kimaro, D.A. Competition between maize and pigeonpea in semi-arid Tanzania: Effect on yields and nutrition of crops. Agric. Ecosyst. Environ. 2009, 134, 115–125. [Google Scholar] [CrossRef]
  50. Mbanyele, V.; Mtambanengwe, F.; Nezomba, H.; Groot, J.C.J.; Mapfumo, P. Comparative short-term performance of soil water management options for increased productivity of maize-cowpea intercropping in semi-arid Zimbabwe. J. Agric. Food Res. 2021, 5, 100189. [Google Scholar] [CrossRef]
Figure 1. Days to flowering (panel (A)) and average thermal units (growing degree days) per day received during vegetative stage of maize (panel (B)) grown under the different sole and intercropping treatments. The treatments are: T1—sole maize; T3—maize + cowpea intercropping, simultaneous sowing; T4—maize + cowpea intercropping, maize sown after 1 wk; T5—maize + cowpea intercropping, maize sown after 2 wks; and T6—maize + cowpea intercropping, maize sown after 3 wks. Different letters above the bars indicate statistically significant differences at Tukey’s HSD (a = 5%). Error bars represent the standard error of means, N = 3.
Land 11 00581 g001
Figure 2. Chlorophyll content measured as soil and plant analysis development (SPAD) values in maize (panel (A)) and cowpea (panel (B)) leaves. For treatment abbreviations, see Figure 1. Different letters above the bars indicate statistically significant differences at Tukey’s HSD (a = 5%). Error bars represent the standard error of means, N = 3.
Land 11 00581 g002
Figure 3. Relationship between soil and plant analysis development (SPAD) value and seed yield of maize (panel (A)) and cowpea (panel (B)).
Land 11 00581 g003
Figure 4. Photosynthetically active radiation (PAR) under the canopy of different sole and intercropping treatments. For treatment abbreviations, see Figure 1. PAR was measured between lines (panel (A)) and between rows (panel (B)) since canopy coverage was different due to spacing (e.g., the line to line = 60 cm and plant to plant = 20 cm for maize) of the crops. Different letters above the bars indicate statistically significant differences at Tukey’s HSD (a = 5%). The error bars represent the standard error of means, N = 3.
Land 11 00581 g004
Figure 5. Relationship between below-canopy PAR and 2 g-r-b, line to line (panel (A)) and row to row (panel (B)). The PAR was measured between lines (panel A) and between rows (panel (B)) since canopy coverage was different due to spacing (line to line = 60 cm and plant to plant = 20 cm for maize).
Land 11 00581 g005
Figure 6. Leaf area index (LAI) of different sole and intercropping treatments. For treatment abbreviations, see Figure 1. The PAR was measured between lines (panel (A)) and between rows (panel (B)) since canopy coverage was different due to spacing (line to line = 60 cm and plant to plant = 20 cm for maize) of the crops. Different letters above the bars indicate statistically significant differences at Tukey’s HSD (a = 5%). The error bars represent the standard error of means, N = 3.
Land 11 00581 g006
Figure 7. Relationship between 2 g-r-b and LAI, measured between the lines (panel (A)) and between rows (panel (B)). The PAR was measured by taking reading in between lines (panel (A)) and in between rows (panel (B)) since canopy coverage was different due to spacing (line to line = 60 cm and plant to plant = 20 cm for maize) of the crops.
Land 11 00581 g007
Table 1. Cost of production for different operations and product prices. The price was taken from the local market at Patuakhali on 15 November 2019.
ItemsCost of Production (USD ha−1)
MaizeCowpeaIntercropping
Human Labor141.18129.41176.47
Mechanical Cost105.8847.06105.88
Seed (Purchased)35.295.8841.18
Urea19.763.2919.76
TSP (Triple Superphosphate)14.129.4114.12
MOP (Muriate of Potash)10.355.1810.35
Insecticide12.9411.7614.12
Irrigation58.8223.5358.82
Machine Cost16.4714.1221.18
Land-Use Cost117.65117.65117.65
Interest on Operational Cost26.6218.3628.98
Total variable cost of cultivation559.09385.66608.51
Table 2. Yield and yield contributing characters of maize grown under different treatments (means ± SE, N = 3).
Treatment Plant Height (cm)Number of Cobs Plant−1Cob CharactersNumber of Grains Cob−1 1000-Grain Weight (g)Stover Yield (t ha−1)
Length (cm)Circumference (cm)
T1237 ± 0.61.06 ± 0.0621.3 ± 0.50 a14.76 ± 0.23 a598 ± 9 a239 ± 3.48.61 ± 0.15 a
T3235 ± 0.71.06 ± 0.0618.9 ± 0.14 b14.03 ± 0.12 ab553 ± 10 ab238 ± 0.28.03 ± 0.09 b
T4235 ± 0.5118.4 ± 0.06 bc13.60 ± 0.20 b533 ± 9 ab234 ± 0.67.76 ± 0.01 bc
T5236 ± 0.6118.1 ± 0.05 bc13.46 ± 0.40 bc518 ± 26 b232 ± 0.47.60 ± 0.04 c
T6236 ± 0.9117.8 ± 0.03 c13.03 ± 0.08 c491 ± 11 b232 ± 0.27.18 ± 0.19 d
F ratio0.690.6636.1712.645.934.8642.90
p value 0.610.63<0.01<0.01<0.010.06<0.01
T1—sole maize; T3—maize + cowpea intercropping, simultaneous sowing; T4—maize + cowpea intercropping, maize sown after 1 wk; T5—maize + cowpea intercropping, maize sown after 2 wk; and T6—maize + cowpea intercropping, maize sown after 3 wk.
Table 3. Yield and yield-contributing characters of cowpea grown under different intercropping practices (means ± SE, N = 3).
TreatmentPlant Height (cm)Branch Plant−1Pod Plant−1Seed
Pod−1
Average Pod Length (cm)Pod Weight per Meter Square Plot
(g)
Seed Plant−1Stover
Yield
(t ha−1)
1000-Grain Weight (g)
T2136 ± 156.93 ± 0.4014.4 ± 0.11 a15.26 ± 0.5917.84 ± 0.91290 ± 5 a220 ± 9 a2.39 ± 0.03 a127 ± 1.44 a
T3177 ± 316.93 ± 1.179.2 ± 0.46 c12.93 ± 0.2916.64 ± 0.16211 ± 3 d119 ± 3 c1.24 ± 0.06 c107 ± 0.86 b
T4185 ± 86.73 ± 0.6710.2 ± 0.61 c14.13 ± 0.7816.71 ± 0.29222 ± 2 cd145 ± 16 bc1.43 ± 0.02 bc117 ± 0.38 c
T5156 ± 377.33 ± 0.9911.83 ± 0.40 b14.73 ± 0.2916.74 ± 0.29237 ± 2 bc174 ± 6 b1.53 ± 0.03 b117 ± 0.44 c
T6162 ± 109.13 ± 0.6913.9 ± 0.20 a15.00 ± 0.1116.98 ± 0.14250 ± 2 b209 ± 5 a1.66 ± 0.07 b121 ± 0.51 b
F ratio0.791.4396.893.421.0969.1747.71123.8190.34
p value0.560.31<0.010.060.42<0.01<0.01<0.01<0.01
T2—sole cowpea; T3—maize + cowpea intercropping; simultaneous sowing; T4—maize + cowpea intercropping, maize sown after 1 wk; T5—maize + cowpea intercropping, maize sown after 2 wks; and T6—maize + cowpea intercropping, maize sown after 3 wks.
Table 4. Canopy coverage and architecture analysis using camara-based vegetative indices (2g-red-b and VARI) for different treatments (Mean ± SE).
Treatment2 g-red-bVARI
T10.416 ± 0.0390.230 ± 0.0243
T20.463 ± 0.0170.311 ± 0.0269
T30.426 ± 0.0040.207 ± 0.0396
T40.437 ± 0.0250.224 ± 0.0314
T50.446 ± 0.0280.268 ± 0.0204
T60.408 ± 0.0210.269 ± 0.0855
F ratio0.661.45
p value0.650.28
T1—sole maize; T2—sole cowpea; T3—maize + cowpea intercropping—simultaneous sowing; T4—maize + cowpea intercropping, maize sown after 1 wk; T5—maize + cowpea intercropping, maize sown after 2 wks; and T6—maize + cowpea intercropping, maize sown after 3 wks.
Table 5. Yield performance of maize-cowpea grown (means ± SE, N = 3) under different practices.
TreatmentSeed Yield (t ha−1)Biological Yield (t ha−1)Harvest IndexMaize Equivalent Yield
(t ha−1)
LER
MaizeCowpeaMaizeCowpeaMaizeCowpea
T16.69 ± 0.26 a---15.30 ± 0.41 a---0.43 ± 0.01---6.69 ± 0.27 a1 c
T2---1.9 ± 0.10 a---4.29 ± 0.13 a---0.44 ± 0.77 ab1.14 ± 0.06 b1 c
T36.18 ± 0.47 ab0.87 ± 0.02 c14.21 ± 0.56 ab2.11 ± 0.08 d0.43 ± 0.020.41 ± 0.27 b6.72 ± 0.46 a1.39 ± 0.09 b
T45.48 ± 0.08 ab1.17 ± 0.13 b13.24 ± 0.09 bc2.60 ± 0.15 c0.41 ± 0.000.45 ± 0.86 ab6.19 ± 0.06 a1.43 ± 0.06 b
T55.27 ± 0.26 b1.41 ± 0.04 b12.87 ± 0.30 bc2.94 ± 0.07 bc0.40 ± 0.010.48 ± 0.62 ab6.13 ± 0.27 a1.54 ± 0.04 ab
T64.97 ± 0.13 b1. 75 ± 0.03 a12.15 ± 0.32 c3.41 ± 0.54 b0.40 ± 0.010.52 ± 0.31 a6.03 ± 0.14 a1.67 ± 0.05 a
F ratio5.5153.8714.29172.271.265.3865.0735.26
p value <0.01<0.01<0.01<0.010.350.02<0.01<0.01
T1—sole maize; T2—sole cowpea; T3—maize + cowpea intercropping, simultaneous sowing, T4–maize + cowpea intercropping, maize sown after 1 wk; T5—maize + cowpea intercropping, maize sown after 2 wks; and T6–maize + cowpea intercropping, maize sown after 3 wks.
Table 6. Economic returns from maize-cowpea intercropping systems.
TreatmentGross Return (USD ha−1)Total Variable Cost (USD ha−1)Net Return (USD ha−1)BCR
MaizeCowpeaTotal
T11180.94 ± 47.50 a---1180.94 ± 47.50 a559.09621.84 ± 47.50 a2.11 ± 0.08 a
T2---559.62 ± 29.57 a559.62 ± 29.57 b385.66173.97 ± 29.57 b1.45 ± 0.08 b
T31092.17 ± 83.35 ab258.58 ± 6.85 c1350.75 ± 76.69 a608.51742.24 ± 76.69 a2.22 ± 0.13 a
T4967.58 ± 14.57 ab346.46 ± 38.27 b1314.05 ± 29.17 a608.51705.54 ± 29.17 a2.16 ± 0.05 a
T5931.63 ± 47.46 b417.34 ± 14.50 b1348.97 ± 47.69 a608.51740.47 ± 47.69 a2.22 ± 0.08 a
T6878.16 ± 24.22 b516.66 ± 9.53 a1394.82 ± 25.08 a608.51786.32 ± 25.08 a2.29 ± 0.04 a
F ratio80.58150.0844.33 23.0414.34
p value <0.01<0.01<0.01 <0.01<0.01
T1—sole maize; T2—sole cowpea; T3—maize + cowpea intercropping, simultaneous sowing; T4—maize + cowpea intercropping, maize sown after 1 wk; T5—maize + cowpea intercropping, maize sown after 2 wks; and T6- maize + cowpea intercropping, maize sown after 3 wks.
Publisher’s Note: MDPI stays neutral with regard to jurisdictional claims in published maps and institutional affiliations.

