Article

Geomatic Techniques Applied to the Dynamic Study (2001–2019) of the Rock Glacier in the Veleta Cirque (Sierra Nevada, Spain)

by
José Juan de Sanjosé Blasco
1,*,
Alan D. Atkinson
1,
Manuel Sánchez-Fernández
1,
Antonio Gómez-Ortiz
2,
Montserrat Salvà-Catarineu
2 and
Ferran Salvador-Franch
2
1
Department of Graphic Expression, INTERRA Research Institute for Sustainable Territorial Development, NEXUS Research Group: Engineering, Territory and Heritage, Universidad de Extremadura, Avenida de la Universidad s/n, 10003 Caceres, Spain
2
Department of Geography, Faculty of Geography and History, Universitat de Barcelona, Carrer de Montalegre 6, 08001 Barcelona, Spain
*
Author to whom correspondence should be addressed.
Submission received: 25 March 2022 / Revised: 13 April 2022 / Accepted: 20 April 2022 / Published: 21 April 2022
(This article belongs to the Special Issue GIS and Glaciers Landscape: Past and Present)

Abstract

:
During the Little Ice Age (LIA), Corral del Veleta (Sierra Nevada) housed a small glacier of which relict glacial ice and permafrost still remain under packets of ice blocks. Currently, it is considered the southernmost rock glacier in Europe. The analysis and results of monitoring carried out on this rock glacier reveal it to be in an accelerated process of immobilization and that the relict glacial ice blocks and permafrost on which it lies are in a continual process of degradation. The rock glacier was monitored from 2001 to 2019 using diverse geomatic techniques, to which geophysical and thermal techniques were added. The results obtained during the observation period shed light on the dynamic of the rock glacier (morpho-topographic movements and deformations) as well as the physical state of the underlying frozen bodies (volumetric reduction and spatial distribution). The changes observed are related to variations in the dominant high-mountain climate of Sierra Nevada, particularly since the end of the 20th century, the general tendencies of which are increasing temperatures, decreasing annual snowfall, and a shorter duration of snow on the ground.

1. Introduction

During the Quaternary, the summits of the world and the Mediterranean’s main mountain ranges housed glacial systems. In response to the reigning climatic conditions during the Little Ice Age (LIA) in the mountains where glaciers still remained, their fronts advanced [1,2], while in other mountain ranges that did not have a glaciated area the periglacial domain at their peaks led to the development of glaciers [3]. In the case of the Iberian Peninsula (Figure 1), with the exception of the Pyrenees, which underwent a glacial advance in its central part [4], it was only in the Cantabrian Range (Picos de Europa) and Sierra Nevada (Penibaetic System) that these glaciers could develop [3,5]. The retreat of the glacial fronts in glaciated mountains is now all too evident [6,7,8], as is the shrinkage or outright disappearance of the glaciers generated during the LIA [9,10,11]. The causes of this must be sought largely in the climatic conditions of the present, which for several decades now have seen reductions in snowfall globally, and glaciers have become rock glaciers through debris falling from the walls surrounding them.
Rock glaciers flow downwards at annual velocities that vary from values in centimetres to metres (in the most extreme cases) [12,13] and carve out arches and furrows whose surfaces express the flow and deformation of the frozen body. This dynamic flow has been interpreted as creep and gelifluction, which generates the ridges and grooves associated with the emergence, thinning, and compression or stretching of the frozen body. Rock glaciers are also related to thermal processes such as differential thermal diffusion, frozen heave with segregation ice processes, or thermokarst, in accordance with the internal classification processes generated by the upwelling of fines at the front [13,14,15,16]. Many questions remain on the rheology and dynamics of rock glaciers due to the complexity of the processes involved but without any agreement on which processes (creep deformation or thermodynamic changes) are dominant in each case [13,17,18]. This means that more detailed field knowledge of rock glaciers is needed in order to improve the environmental and paleoenvironmental interpretation of periglacial sites in temperate mountains given the absence of other well-preserved glacial or periglacial forms in marginal environments or in the transition between periglacial and nival domains. In high-mountain marginal periglacial environments, and in particular in the mountains of the Iberian Peninsula, rock glaciers are a useful environmental and dynamic indicator and also the most characteristic active periglacial landforms [19,20,21,22,23].
The analysis of the dynamic and superficial behaviour of rock glaciers requires the use of traditional geomatic techniques (geodesy-topography and aerial-terrestrial photogrammetry) as well as other more modern methods, such as Global Navegation Satellite Systems (GNSS), Terrestrial Laser Scanning (TLS), and Unmanned Aerial Vehicles (UAV) [24,25,26].
Geomorphological research of the Veleta rock glacier began in the mid-1990s [3], and from 2001 information the collection of information by geomatic measurements on its morphodynamic and the physical state of the relict ice and permafrost on the rock glacier commenced. The aim of this article was to determine the process of degradation of the underlying ice bodies on which the rock glacier rests by analyzing data using the different geomatic techniques applied between 2001 and 2019. In order to do so, the following were considered:
  • Analysis of the dynamic of the Veleta rock glacier using geomatic techniques: Classical topography (total station); Global Navigation Satellite System (GNSS); “Reflectorless” total station; Photogrammetry analytical and digital; Unmanned Aerial Vehicle (UAV); and Terrestrial Laser Scanning (TLS).
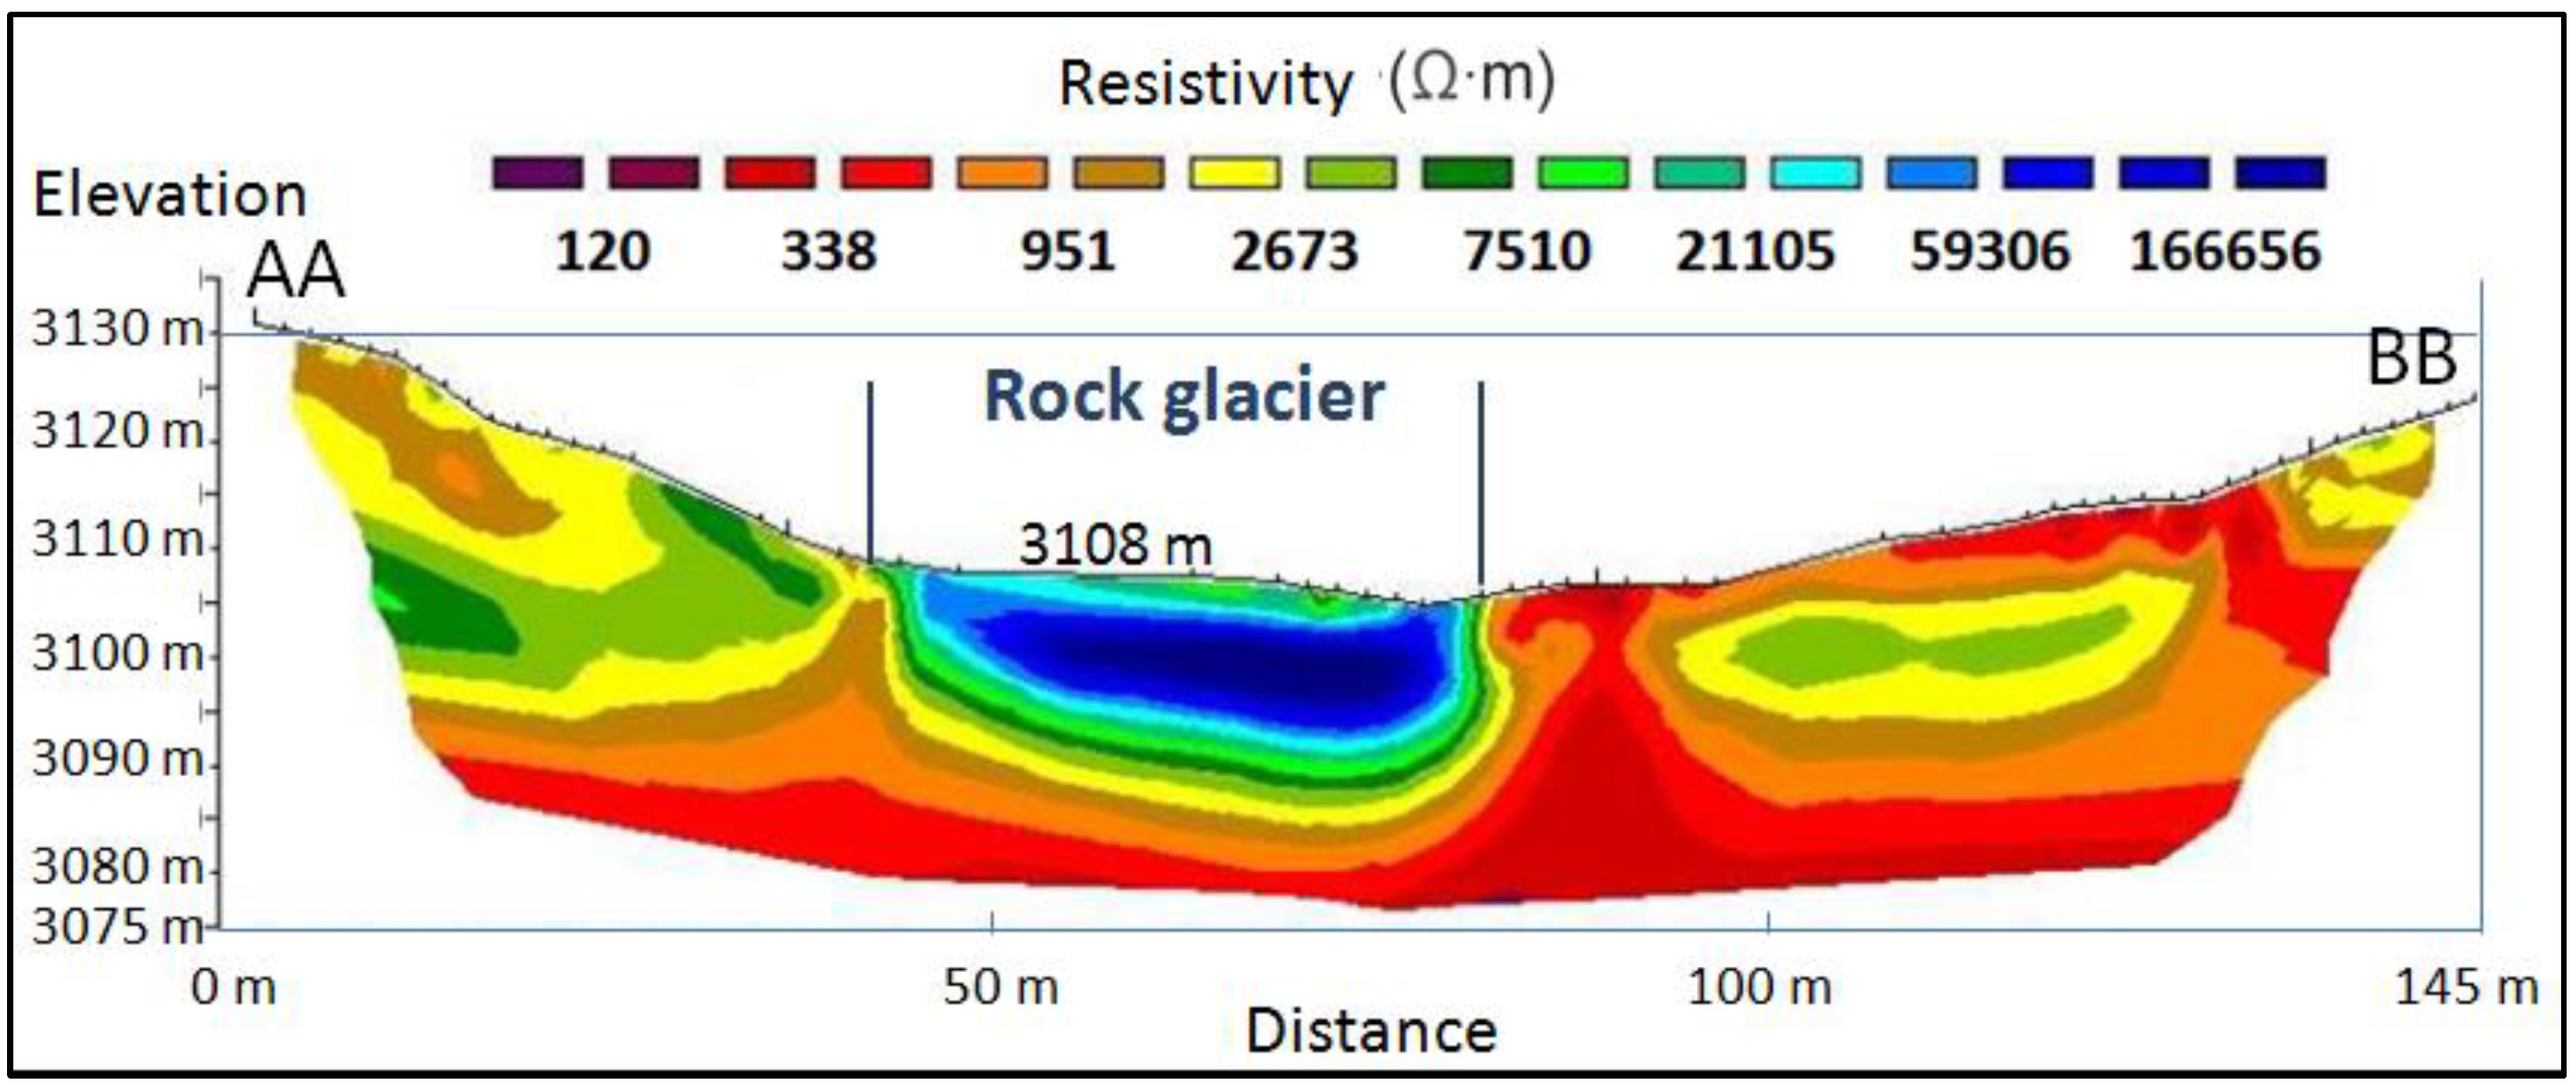
  • The physical state of the frozen bodies on which the rock glacier lies, which were determined using the geophysical prospections of 2009.
  • The thermal regime of the active layer of the rock glacier was determined using the information provided by 5 thermic sensors installed in series at different depths: −0.05 m, −0.20 m, −0.50 m, −1.00 m, and −1.50 m.

2. The Study Area

Sierra Nevada forms part of the Betic Ranges and is a robust massif in the southeast of the Iberian Peninsula (Sierra Nevada, 37°03′ N; 3°21′ W; 3100 m) close to the Mediterranean Sea (Figure 1). Sierra Nevada is aligned in a west-east direction over more than 90 km and includes the highest altitudes of the Iberian Peninsula (Mulhacén, 3482 m; Veleta, 3398 m; and Alcazaba, 3366 m). Its basic structure is a succession of mountain chains of alpine origin over paleozoic crystalline rocks and triasic materials. Evolved forms predominate in its relief, especially summits and the adjacent southern slope. Also noteworthy is the generalized compartmentalisation by the organization of the fluvial network running into a tributary of the Mediterranean and Atlantic. Glacial imprints predominate in Sierra Nevada over 2500 m, while the periglacial morphodynamic does so at low altitudes [27,28,29,30].
The vegetation cover at Sierra Nevada stands out for its richness in species and endemisms. This is due to the geographical position of the mountain, its altitude, and how the vegetation adapts to extreme climatic conditions. At high altitudes (over 2900 m), environmental conditions are characteristic of a periglacial zone: prolonged summer aridity, annual rainfall of 710 mm at altitudes of 2500 m, and an average annual temperature of close to 0 °C at an altitude of 3400 m [31].
The first studies of the Quaternary glaciarism of Sierra Nevada began in the middle of the 19th century and have continued ever since [32]. As were other mountain nuclei of the Iberian Peninsula (Pyrenees and Picos de Europa), it was affected by the Little Ice Age (from the XVth century to the end of the XIXth), which would confirm that such a climatic pulsation with such slight repercussion on the modelling of the mountain similarly affected the extreme southwest of Europe. These were always small glaciers enclosed within the heart of old cirques. The glaciated areas are mainly included the gorges of the northern façade of the Sierra and, to a lesser extent, probably the south façade too [28].
Corral del Veleta forms part of the head of the Guarnón cliff. It is situated in the northern face of Sierra Nevada at the foot of the Picacho del Veleta (3392 m) between the Cerro de los Machos (3374 m) and the crest of Los Lastrones. As a whole, it forms an oval-shaped basin open to the northeast styled in banks of feldspathic mica schists of differing nature and resistence [27,33]. Its base, which is inclined towards the west, coincides with a structural shelf full of clasts which enters into contact with the vertical wall of the Picacho del Veleta in a southern direction, and towards the north with a thick morainic front and side range that isolates it from the valley. The Corral del Veleta has a length (W-E) of over 600 m and a width (S-N) that varies between 175 m and 250 m. Its altitudinal difference is 300 m, with its lowest altitude at 3050 m (Figure 2a).
The orientation and altitude of the Corral del Veleta enabled the formation of the glacier during the LIA and its duration until very recent times. At the end of the 19th century, the basin was still full of ice and snow masses and partially so until well after the middle of the 20th [34,35]. There is no longer any visible trace of the glacier, although ice patches or snowdrifts remain from the late snowmelt at its base and small permanent ice plates trapped within its walls.
The presence of these frozen bodies, together with the previously described glacial ice and permafrost buried under detritic material from the deglaciation process, explains what the glacier must have undergone and how, once enclosed in its basin, it was characterized by a successive evolution from white glacier to black glacier, and from this to fossil glacial ice and permafrost [27,28]. The surface of the base of the Veleta cirque is now characterized by an amalgam of periglacial modelling resting on the relict ice of the historical LIA glacier (Figure 2c). Among this modelling, the aforementioned incipient rock glacier, the subject of this study, stands out.
Fossil ices and permafrost housed under a detritic cover in the heart of the Corral del Veleta from −1.20 m were detected in 1998 through geophysical techniques and the extraction of witnesses [27]. It was thus demonstrated that Corral del Veleta is the southernmost rock glacier in Europe with a latitude of 37°03′ N, the following ones being located at a latitude of 42° N (Pyrenees) and 45° N (Alps) [36]. Since 2001, its physical condition has been analysed, as well as the processes of the geomorphological repercussions within the detritic cover at the base of the cirque (Figure 2b) [27]. The analyses that are being carried out involve the morphodynamic monitoring of the rock glacier, in whose interior still remain pockets of relict glacial ice and levels of permafrost. To date (March 2022) the characteristics of the rock glacier of Corral del Veleta are:
  • Mean altitude of the detritic body: 3105 m.
  • Orientation: W (forming an L-shape).
  • Longitude: 129 m.
  • Mean width: 37 m.
  • Mean thickness: 8 m.
  • Surface area: 3815 m2.
  • Clast material: heterometric blocks of mica schists with abundant coarse and internal fines.
  • Clast dimensions: from blocks of thick calibre (several m3) with abundant material of decimetric and centimetric size.

3. Methodology

There can be no doubt that geomatic techniques are those the most commonly used in monitoring displacements and deformations in geomorphological structures (glaciers, rock glaciers, dunes, sliding slopes, etc.). Depending on the means available, the simplest instruments can be used, such as inclinometers and tape measures, to state-of-the-art total stations, GNSS, photogrammetric cameras, TLS, or UAV. With the use of modern geomatic techniques the numerical value of surface movements and volume loss of underlying frozen bodies in the Corral del Veleta rock glacier were determined over a continuous 18-year period of observations (2001–2019).

3.1. Total Station

High performance instruments must be used for precise measurements (augmentation of the eyeglass, sensitivity of levels, angular appreciation, and error in distance). For the dynamic calculation of the Corral del Veleta rock glacier, precise points were marked on large blocks of rock on the rock glacier and steel rods (1.80 m in length) were also placed between the rocks [37]. To measure these points, a total station was used with an angular appreciation of 5 and measurement errors over distance of ±2 mm ±2 ppm. The accumulated error in the measurement of the reflectors placed over the points to measure (rock and steel rod) is ±2 cm [38].
To make the measurements, two stable topographic stations were placed in the lateral moraine of the rock glacier (Figure 2b); one of these was used to place the instrument (total station) and the other station acted as an element for orientation. All the annual topographic measurements were taken from the same station towards the 25 points located on the rock glacier. The stability of this point was guaranteed by angular measurements at five distant check points.

3.2. Global Navigation Satellite Systems—GNSS

The GNSS performs the geolocalization of points on terrain from one or several constellations of artificial satellites. The system now most commonly used is the GPS (Global Positioning System) from the U.S.A. Nevertheless, its use in combination with other satellite constellations such as GLONASS (Global’naya Navigatsionnaya Sputnikovaya System), BDS (Beidou Navigation Satellite System), or GALILEO (Europe’s Global Navigation Satellite System) leads to noteworthy improvements in both the availability and robustness of the data obtained [39].
To further raise precision, at least two pieces of equipment were used simultaneously by placing one piece of equipment (reference) in an area free of obstacles in order to be able to observe the greatest number of satellites at the same time and was on a single fixed point of known coordinates; another piece of equipment (rover) was placed on the points on the glacier whose coordinates we wished to obtain. Observations could be made in real time (RTK), in postprocess, or by means of a combination of the two (field data collection in RTK and reprocessing the same a posteriori). This type of correction gives precisions estimated at ±3 cm in the calculation of coordinates (X,Y,Z) in real time [40,41,42].
The ideal conditions for the use of GNSS indicate that observations should be made on terrain free of obstructions of the signal and of flat surfaces that might cause a multipath effect of over 15° of elevation on the horizon of the site. Nevertheless, Corral del Veleta is surrounded to the south by the wall of the Pico Veleta, to the east by the Cerro de los Machos, and to the north by the moraine of the rock glacier (Figure 2a). Moreover, in some years there are snow and ice remains on the slopes. This is quite a common problem in glaciers and rock glaciers, since they are generally found in valley bottoms and are surrounded by high mountains [43]. GNSS was used for the measurement of the outline of the glacier and five profiles (four transversal to the direction of the glacier and one longitudinal or frontal).

3.3. Reflectorless Total Station

Certain points situated in the rocks on the front of the rock glacier were measured using a total station, which measured the distance without the need to place a reflector on the point to be measured. Data could be collected from the front of the glacier using TLS, but this was not useful in this case since it is an instrument that measures a great quantity of points and cannot be defined with precision on the same individual element for the annual observation.
The aim of this measurement was to determine the dynamic behaviour of the front, and in order to do so the same points must be observed over the period in which the front is measured (2005–2019). In the first measurement in 2005, data (X,Y,Z) were recorded at 54 points, but in the last record (August 2019), of the 54 original points only 22 points were measured. The reason for this is that over the years many of these points disappeared as they became covered by the displacement of other blocks of rock material or rolled over, which rendered their measurement from the topographic base impossible. The measurement site at which the total station is established is permanent and stable. It is located in the frontal part of the rock glacier.
The instruments used were able to identify and monitor the movements of points observed at the same time, as they take a general photograph of the point observed (Figure 3a) and another in great detail (Figure 3b–d). Therefore, this photography serves as a guide when locating these points in the measurements made in later years. The uncertainty of the measurement made by this total station and developing the radiation technique is ±1 cm, which includes the error generated in stationing the instruments (±7 mm) and that of the instrument itself in measuring the distance without a prism, which is ±3 mm.

3.4. Photogrammetry

In Sierra Nevada, the largest cartographic scale available from an official supplier was 1:10,000. This scale was too small for the detailed study required, and so in 2003 a cartography was drawn up on a 1:1500 scale with cartographic uncertainty of ±30 cm. Terrestrial photogrammetry was used for the study of the rock glacier due to the savings made in avoiding the use of a photogrammetric flight. The analogical photographs taken had a convergent and inclined configuration and were taken from the Pico Veleta at an almost-vertical point on the rock glacier (Figure 2b) [44,45].
Following the generation of the cartography of 2003, another was made in 2009 using digital methods. It was thus possible to compare the analytical cartography (human operator) with that obtained by the new techniques of automatic digital restitution. This comparison gave rise to the design of a specific piece of software called “Restitutor” [46,47], which permits 3D reconstructions in great detail to be made automatically from a set of images captured.

3.5. Unmanned Aerial Flights—UAV

UAV systems permit different payloads to be transported, among which the most common are RGB photographic cameras. In this way, images with a geometric range of altitudes between 20 m and 120 m (the legal limits in Spain) can be obtained from a UAV. For the use of convergent photogrammetric methods these are simple aircraft equipped with an economical RGB camera, with which three-dimensional models can be obtained from dense point clouds [48,49,50].
Through the use of a UAV over the Corral del Veleta rock glacier, the aim was to obtain a detailed cartography on a 1:200 scale. To do so, an advanced DJI Phantom 4 multicopter aircraft was used equipped with a 20 Mpix RGB camera with a sensor size of 2.54 cm × 2.54 cm, a fixed focus of 8.8 mm, and also a GNSS system of decimetric precision. The UAV photographic camera was calibrated before the flight, which was programmed for a constant altitude of 70 m measured from the point of take-off. The longitudinal and transversal overlaps were of 80%, in which the overlap of the images is calculated automatically for the altitude of the flight established according to the parameters of the camera. Another two parameters were used: the flight “in grid”, in which flights are the result of intersecting two flight programmes perpendicularly in the same designated region; and the gradient of the camera to the vertical, which in these flights was 10°. Ground control and check points were obtained with GNSS (RTK). As a result, 3D models were generated from over 10 million points, the uncertainty of which was ±4 cm.

3.6. Terrestrial Laser Scanner—TLS

In the last decade, geomatic techniques have been developed that do not require any physical contact with the measured object. These include terrestrial photogrammetry, TLS, and UAV [51,52]. TLS produces a point cloud (X,Y,Z) made up of millions of points measured on the surface of an object with a precision of a few millimetres, photographic information of its texture and with the possibility of 3D modelling, all in a short time after data acquisition. This technique has been used in high-mountain geomorphological studies and is of great use in the study of glaciers, in which field conditions are complex and narrow, and sites very difficult to access [53,54,55].
As with photography, TLSs are “line of sight” instruments, i.e., they collect what they see from a single point. Multiple takes must therefore be made from different stations to guarantee full coverage of a structure [56]. In the collection of information, there are uncertainties of less than ±2 mm in each scan, and the fusion of all the scans including support from the GNSS does not surpass ±3 cm of uncertainty.
TLS was introduced as a method for monitoring the dynamic of the Corral del Veleta rock glacier in the 2012 survey. To carry out such a dense measurement, the TLS used was a Faro Focus X330, which measures distances in a range of 0.6 m to 330 m with nominal precision of ±2 mm at a distance of 50 m under normal conditions of light and reflectivity. The vertical field of vision (FOV) has an amplitude of 300° and the horizontal FOV a range of 360°.
The high mountain site places constraints on TLS working conditions. In order to make as many scans as possible in the shortest possible time with optimal resolution, the points to scan were planned in order to maximize the information collected while trying to minimize occlusions. To date, four annual scanning operations have been carried out on the Corral del Veleta rock glacier (2012, 2014, 2016, and 2019) with a mean of fourteen placements per year, in which over 500 million points with 3D information were obtained in each survey.

4. Results

4.1. General Dynamic of The Rock Glacier

Different publications have shown the behaviour and values of horizontal (distance) and vertical (sinking) displacements of the Corral del Veleta rock glacier, obtained using the total station throughout the period of measurement [27,41,46,57].
In order to do so, annual checks of the 25 steel rods in the rock glacier were made during the observation period (the last week in August) (Figure 4). Information is not available for the years in which the rock glacier remained covered by seasonal snow in August (2010, 2011, 2013, and 2018), nor in 2015 or 2017 (Table 1).
For three years (2006, 2007, and 2008), a further observation was made at the end of July in addition to the periodic measurements at the end of August. The importance of this measurement lies in the fact that the summer value does not include the influence of winter, since it covers the summer period from the end of July until the end of August. For the winter period, the opposite is true, since a dynamic value can be obtained from the end of August to the end of July the following year. This enables the determination with greater precision of the dynamic behaviour during the months when the rock glacier is covered with snow (normally from the middle of October to the middle of June) and the months that it is free of snow (normally from July to September) (Table 2). Only in August do the sun’s rays shine directly on the surface of the rock glacier, since the walls surrounding it leave it in shade throughout the rest of the year.

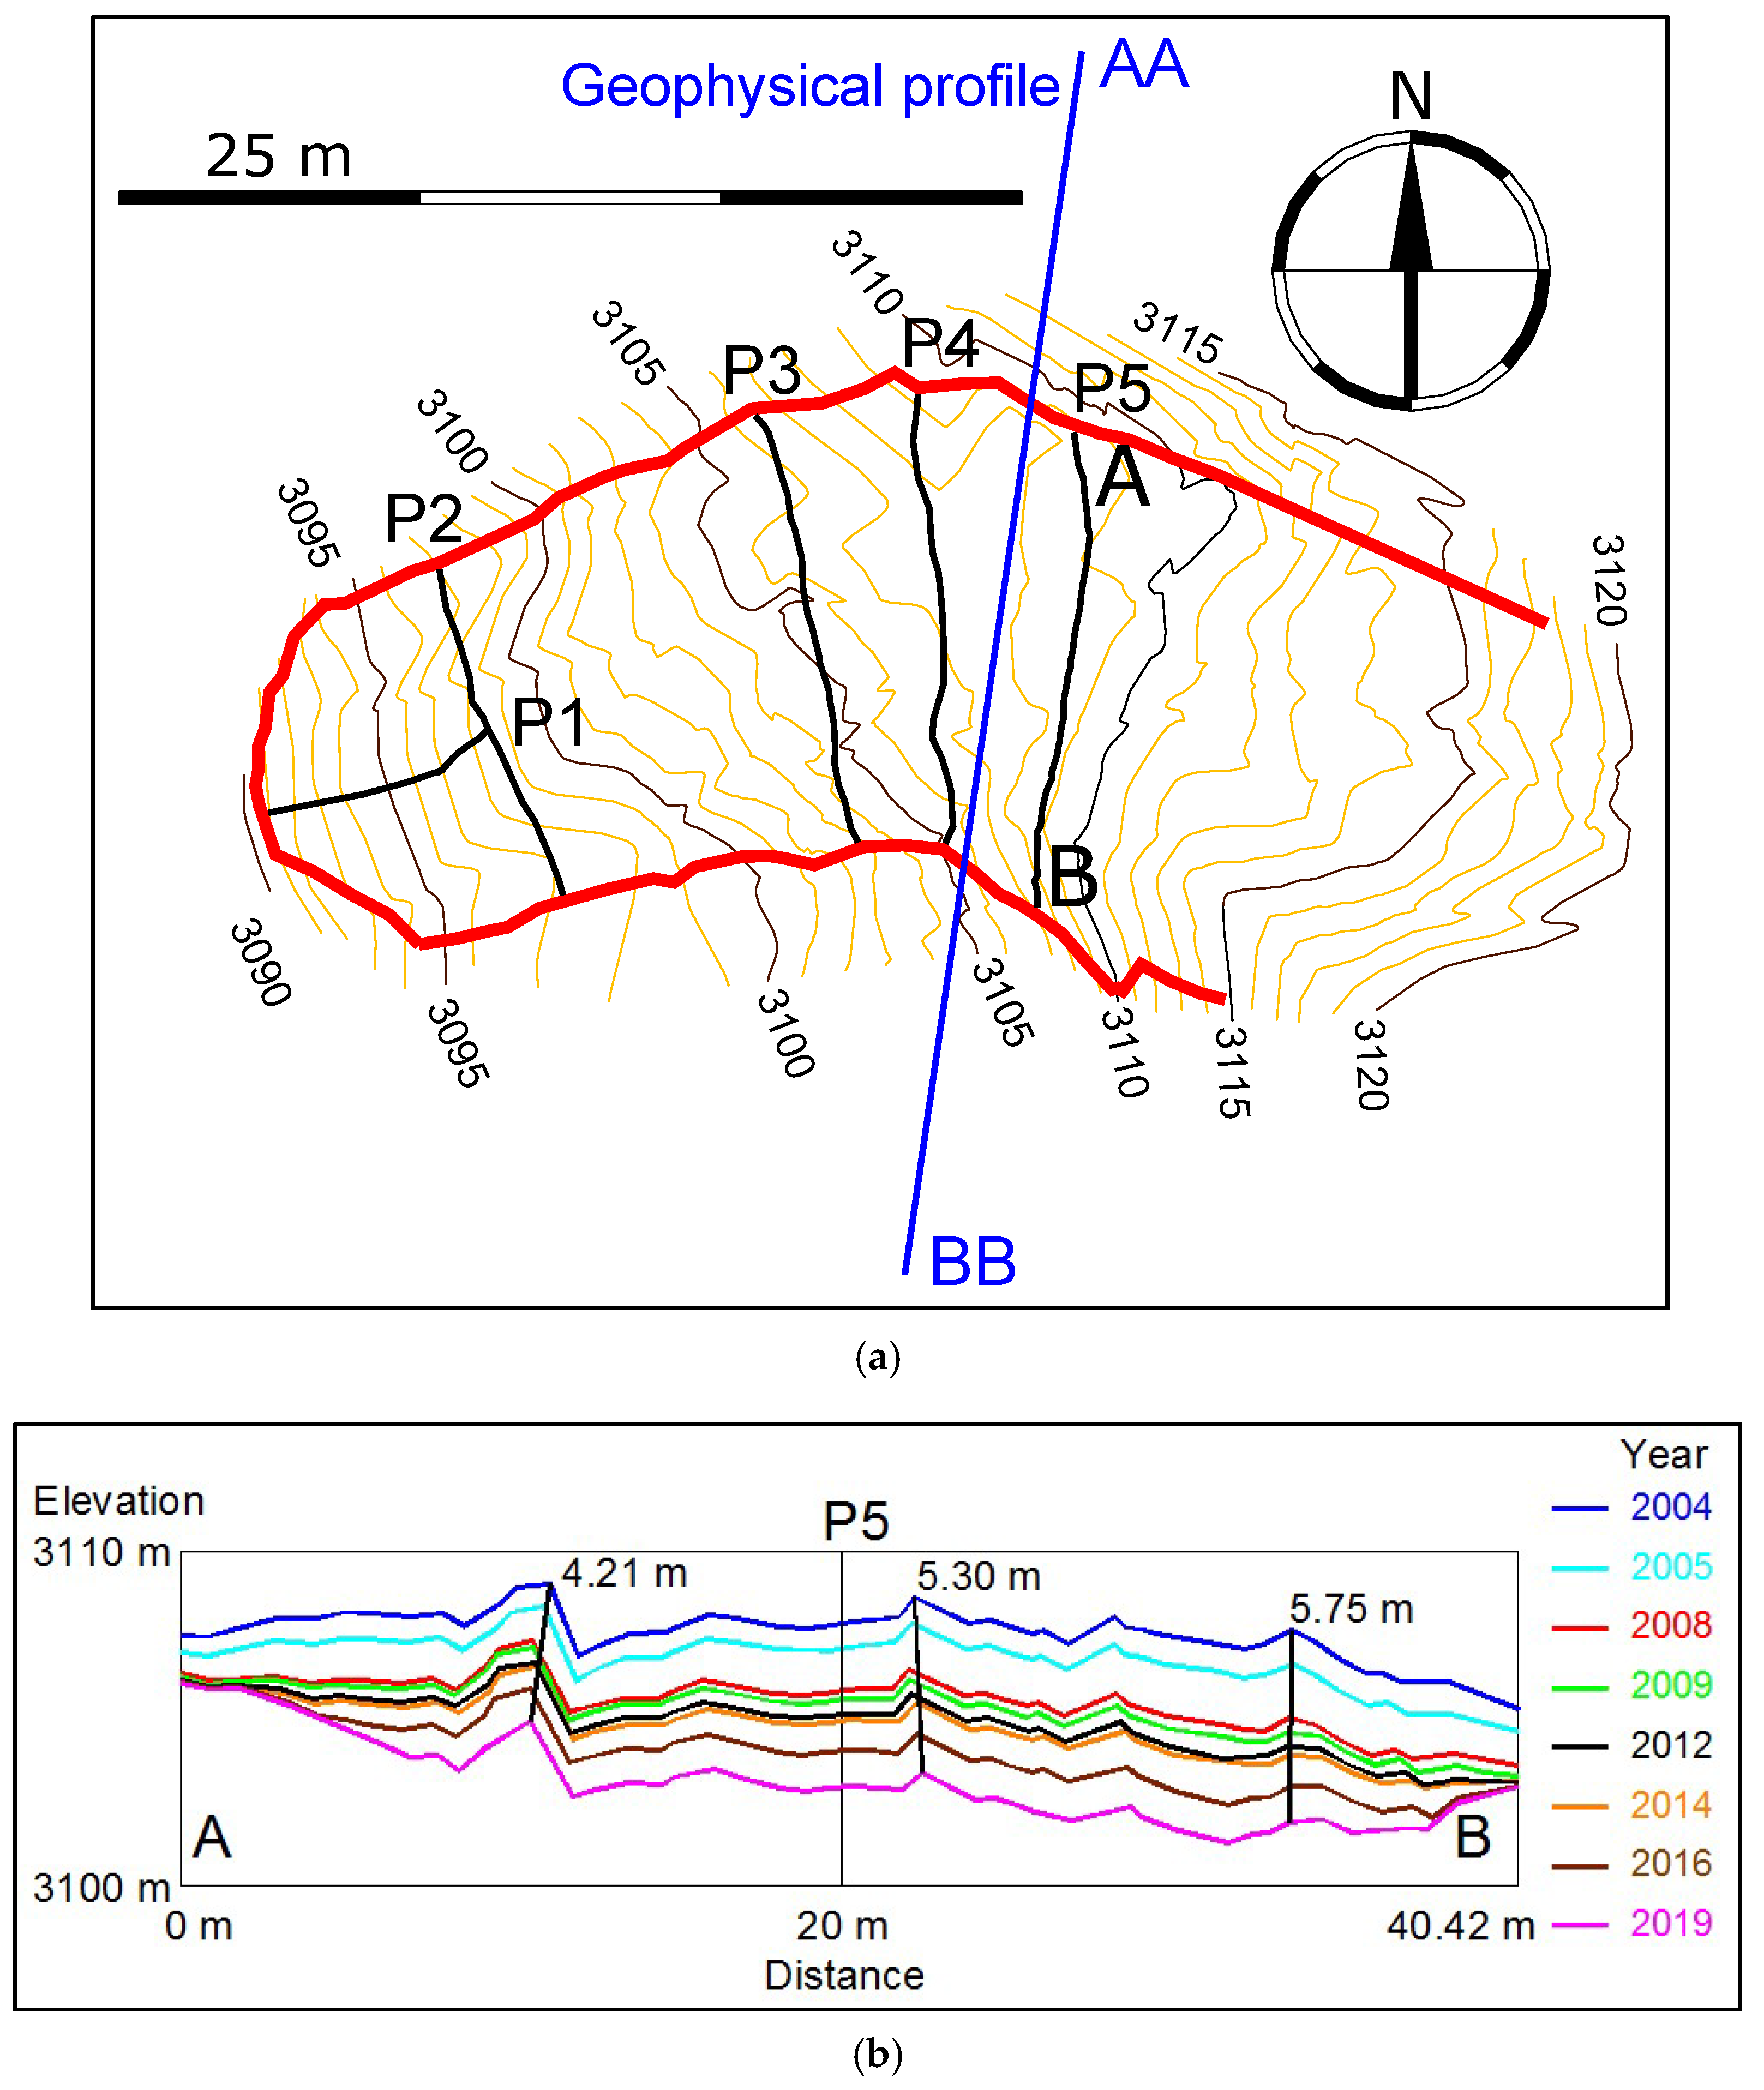
4.2. Evolution of the Perimeter and Subsidence

Observation of the evolution of the rock glacier surface was made using GNSS equipment on 68 points marked on the rocks along its perimeter. Similarly, sinking of the rock glacier was determined by using GNSS to observe 88 marked points on the rocks, for which one frontal and four transversal profiles were configured (Figure 5a). In addition to being observed by GNSS, some of these points were also checked using the total station, which revealed a degree of uncertainty between the two measurements of ±3 cm [56].
The beginning and end points of the profiles coincided with the points measured on the profiles of the rock glacier and, while no significant planimetric changes were found in the periodic observations (2004–2019), altimetric changes had taken place (Figure 5b). Variations in subsidence of the profiles of the rock glacier coincide with the values detected using the total station in its general dynamic (Figure 4) (Table 1).
The analysis of the profiles reveals that the same volume loss does not occur in the centre of the glacier as in the areas close to the outline (Figure 5b). The topographic profiles in the frontal part of the rock glacier (profiles: P1 and P2) indicate that from 2004 to 2019 (a 15 year period) the mean loss of the underlying frozen mass was over 5.3 m (Figure 5b). Some points in the central and back areas of the rock glacier underwent greater subsidence (sinking by 7.8 m). The general evolution of the profiles indicates that the mean loss of elevation of the rock glacier was approximately 5.27 m which, extrapolated to the volume of permafrost loss in 2001–2019, was 20,105 m3.
In 2009, a geophysical study was made between the topographic profiles P4 and P5 to observe the thickness of the underlying ice and permafrost (Figure 5a). The technique used was electrical prospection using ABEM SAS 4000 equipment with a mean spacing between electrodes of 2.5 m [29]. The penetration of up to 40 m of the geophysical profile facilitated an estimation of the thickness of the frozen mass at around 10 m in 2009 (Figure 6). Depth with respect to the surface at which the ceiling of the relict ice glaciers and surrounding permafrost were detected was at −1.20 m at an altitude of 3108 m [30,32].

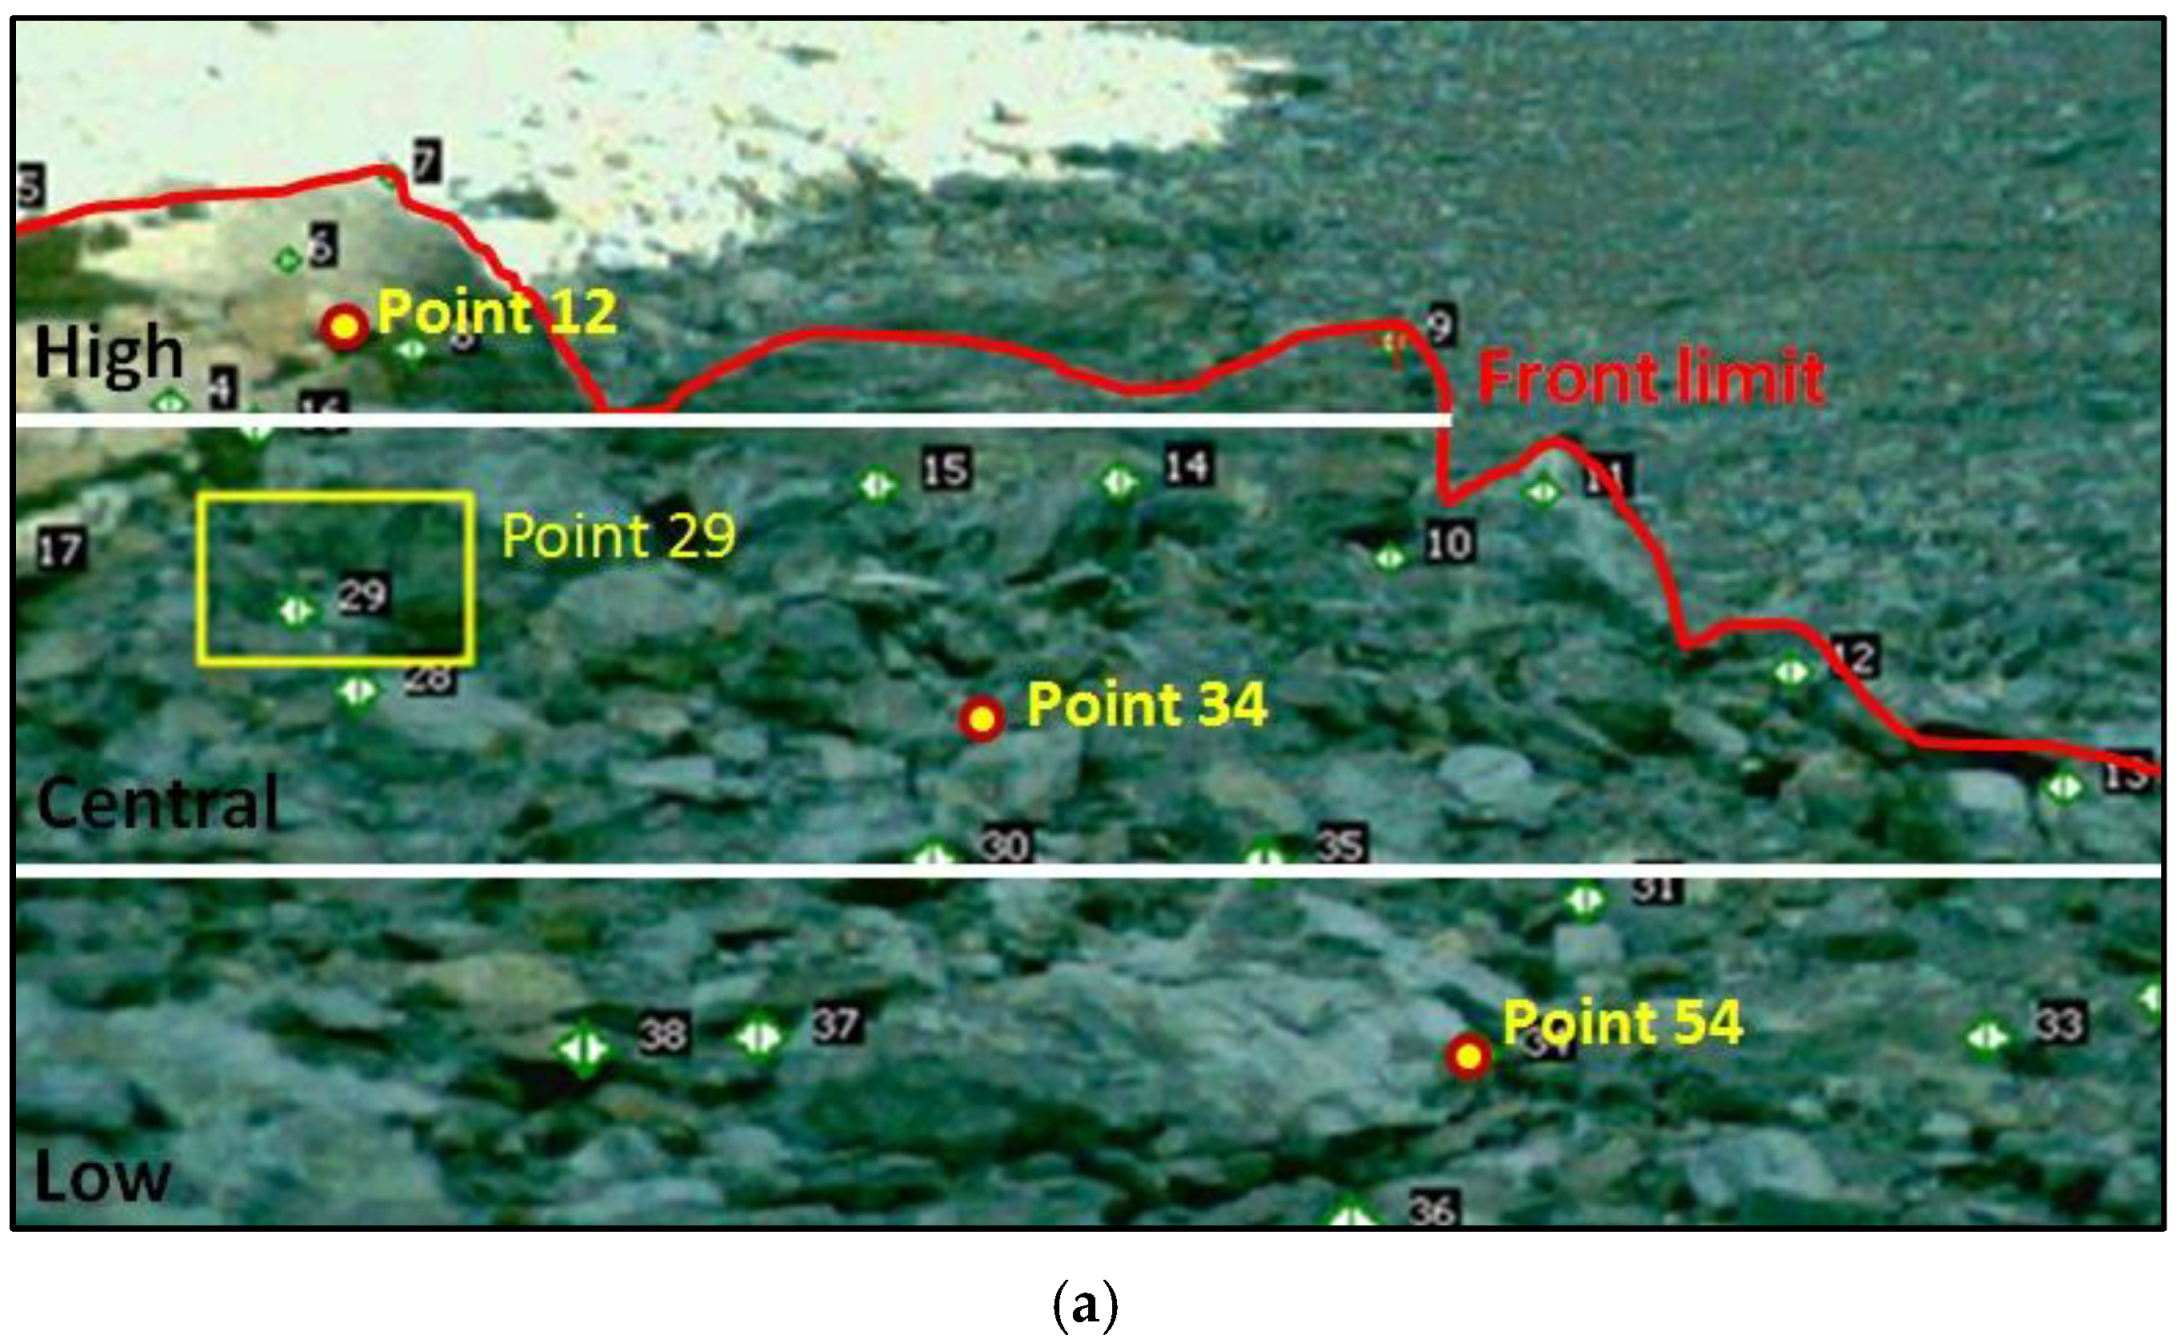
4.3. Behaviour of the Front

For this study, 22 points that lasted throughout the entire period analyzed (2005–2019) were measured in the blocks of rock in the upper, central, and lower parts of the front (Figure 3). Observations were made annually with the exception of the years in which the rock glacier was covered by seasonal snow (2010, 2011, 2013, and 2018) and the years in which measurements were not made (2015 and 2017) [58].
The frontal dynamic of the rock glacier was not homogeneous, as can be seen in Figure 7, in which there is an element or point representing the entire sample or set of points indicated by area (high: point #12, central: point #34, and low: point #54). In 2005–2006, the points in the upper and central parts (#12 and #34) had very similar dynamics (horizontal displacement and subsidence), as a result of the instability of the blocks and contingent upon the abrupt slope of the front.
However, a moment (2008) came at which the points in the central area showed a lesser slope and tended towards behaviour similar to that of the points in the lower area (#54) in 2005–2006. Initially, the points of the lower part (2005) had a vertical displacement value similar to those of the horizontal, but from 2006 horizontal displacement became greater than vertical, the latter ceasing from 2012. What had happened to point #54 in the past is now happening to point #34, since this point has the same configuration in 2016–2019 as point #54 did in 2006–2007 (Figure 7).

4.4. General Cartography

In 2003, a detailed cartography was made of the rock glacier at the same time as other alpine rock glaciers, Murtèl, Muragl, and Suvretta, were also being mapped [15,59,60,61,62]. The technique used for this task was analytical photogrammetry, for which the restitutor Leica SD2000 was used [41]. Nevertheless, due to the difficulties presented by the rocky area, the human restitution or curving procedure tends to be performed in too smooth a way, when the real orography of the rock glacier is more abrupt.
Once the limitations of conventional analytical photogrammetry had been analyzed, the programme design itself was considered. It was several years before the computer programme “Restitutor” was developed, a programme which aims to generate entirely automatic three-dimensional models from images acquired without too many restrictions on data collection. To do so, convergent photogrammetry was used to take photographs from Pico Veleta [46,47]. Through the set of images, forming SIFT pairs and using correlation techniques, a dense map of depth is obtained [63] and translated into a 3D model from a vast quantity of 3D points: around one million points in each dense map of depth (Figure 5a).
In 2019, a UAV was carried out over the Corral del Veleta rock glacier, via which a high-resolution orthophotograph was obtained with a pixel size of 3 cm and a resolution of 1150 points/m2. The flight was processed using the software Agisfot Metashape. The GCPs were the same as those used in the photogrammetric data collection from Pico Veleta. The 3D model generated had an RMS of ±2.5 cm at GCPs. In spite of using a grid drawn up for the flights, small gaps remained (occultations) due to the morphology of the rock glacier, in which there are rocks of large size that hide information of other rocks. This may be solved by increasing the percentage of overlap between the photographs, but this considerably increases the flight time and the number of batteries required.

4.5. Determination of Volume

To determine the volume of the rock glacier, TLS observations were made in 2012, 2014, 2016, and 2019. The volumetric calculations obtained for 2012–2014 gave a loss of −625.95 m3; −1403.18 m3 for 2014–2016, and −2418.76 m3 for 2016–2019. The overall value for the seven years (2012–2019) was −4447.89 m3 (Figure 8) (Table 3).
These values are in accordance with the subsidence data from the steel rods in Table 1, in which greater displacements are observed in 2014–2016 and 2016–2019 than in 2012–2014. The reason for these lower values for 2012–2014 is that in 2013 the rock glacier was covered by snow and a period of just one year had to be considered, whereas 2014–2016 and 2016–2019 are periods of two “snow-free” years.
The interpretation of Figure 8a is that the dynamic of the period 2012–2014 is generally homogeneous throughout the rock glacier with values of subsidence between −3 cm and −50 cm (soft orange colour). Additionally, Figure 8b,c for 2014–2016 and 2016–2019, indicate that for the rock glacier as a whole subsidence is greater than −50 cm (dark orange and red colour); therefore, in these periods there was a great loss of volume, which is in accordance with the data in Table 1 and Figure 5. Lastly, Figure 8d indicates the loss of volume for the 7 year period (2012–2019).
The uncertainty of the coordinates obtained using TLS is ±3 cm, which is the error in the measurement itself using TLS and is backed up by the GNSS data. The yellow colour on the graphs indicates that there is no variation between measurements in the rock glacier and therefore this data is within the ±3 cm of uncertainty.

5. Discussion

In the analysis of the general behaviour of the rock glacier, it was detected that depending on area (frontal, central, or back) the displacements of the steel rods behaved differently. Some steel rods representative of each area were selected (front: point #2, central: point #9, and back: point #22) (Figure 4). There is a slightly greater dynamic in the frontal area than in the centre, but where greater movement takes place is in the back part of the rock glacier. The fundamental reason for this is the topographic slope on which each of the sections is inscribed, since there is a direct relationship between slope and displacement, i.e., the greater the topographic slope, the greater the dynamic.
The general interpretation that can be made regarding the glacial dynamic is that it is of little value while the seasonal snow cover remains on the rock glacier uninterruptedly, as was the case in 2009–2010, 2010–2011, 2012–2013, and 2017–2018, judging by the values accumulated (Table 1). This is attributed to the rigid behaviour of the entire clast body (active layer) in response to the low temperatures of the whole glacier under the prolonged snow cover. In 2015, no measurements were made and so the dynamic between 2014 and 2016 (a period of two years) is much higher than that obtained in a normal annual period. The same happened in 2016–2019. In the summer of 2017, no measurements were made in spite of the glacier being free of snow, and in the summer of 2018, there was a seasonal snow cover. As a result, its behaviour is similar to that of the two-year periods in spite of being a period of three years.
In addition to the annual measurements in August, measurements were made in July of 2006, 2007, and 2008, the results of which are shown in Table 2. These are interpreted as a scarcity of dynamism between the end of August and the end of July of the following year (11 months that include the prenival, nival, and postnival period) (Figure 9), against the extraordinary dynamism from the end of July to the end of August of the same year (1 month centred on mid-summer), which makes up 50% of the total annual vertical displacement. This uneven behaviour reveals the relationship established between the presence/absence of the snow cover and the instability of the clast body. Behaviour is compact and rigid during the cold snowy season and less so during the season of the snowmelt and/or absence of snow. This is because movements only take place in summer (mainly in August), as long as the thermal wave of external radiation is strong enough to melt the snow on the ground and penetrate throughout the active layer to reach the ceiling of the underlying frozen mass (Figure 6), which degrades from −1.2 m depth [27]. Therefore, while the glacier is buried under the seasonal snow, its dynamic is null as revealed in the periods of over a year, during which the seasonal snow lasts throughout the summer. For example, in 2009–2012 its dynamic was similar to that of single-year periods, since the glacier was covered by snow in 2010 and 2011. Apparently, this does not fit the results in Table 2, but this is because the observation is made at the end of August and the time when the measurements are made does not coincide with the moment when the first snowfall takes place (mid-October), covering the glacier and preventing its temperature from rising to 0 °C. Similarly, the summer observation at the end of July does not coincide with the moment when the winter snow disappears, which is at the beginning of June) (Figure 9). If this coincidence in the topographic and climatic measurements were possible, the observed behaviour of the rock glacier would be that of a rigid, frozen, and immobile block.
It must also be mentioned that from the first observation in 2001 a series of autonomous thermal sensors was installed (TinyTalk, UTL-1, and HOBO-Pendant) [29,30] at different depths: −0.05 m, −0.20 m, −0.50 m, −1.00 m, and −1.50 m, and temperature was recorded automatically at regular hourly intervals throughout the year. The results obtained from different monitoring surveys covering the 2001–2019 period provide clues of great geomorphological interest (Figure 9a) [27,31,32,41,64,65,66]. The information from the thermal records backs up those obtained using the periglacial dynamic (Table 1). The thermal data collected for the whole sedimentary body of the rock glacier points to the periods 2001–2002, 2003–2004, 2009–2011, and 2013–2014 as being the least warm of the period analyzed (2001–2019), and therefore those of least periglacial dynamic, whereas the warmest periods were 2004–2005, 2014–2015, and 2017–2019, making these the periods in which the greatest dynamic was detected (Table 1). This data record has determined the thermal rhythm of the ground at the heart of the rock glacier, where it follows a pattern of behaviour characterized by four repetitive episodes through the topographic year (from the start of September to the end of August of the following year) [30,31,65] (Figure 9b):
  • A long cold episode with negative temperatures and the ground permanently frozen beginning in mid-October and lasting until mid-June.
  • A short episode with positive but very moderate temperatures and unfrozen ground, which is estimated to last for around 40 days, coinciding with the second half of summer (mainly August).
  • Two very short episodes that act as a transitional period between the two previously described, during which ground temperatures change from positive to negative around the middle of October and vice versa around the middle of June.
This thermal influence is not so significant in the dynamic of glaciers at other European latitudes, where they behave very stably over the years [67]. The general dynamic of the Corral del Veleta rock glacier was compared with that of other glaciers in the Pyrenees (Posets) [22,68,69] and the Alps (Doesen) [67]. These latter rock glaciers were chosen as being representative of their geographical area and having very similar behaviours to those of other rock glaciers studied in the same areas, e.g., the Argualas and Maladeta rock glaciers in the Pyrenees [21] and Hinteres Langtankar, Weissenkar, and Goessnitzkess in the Alps (Austria) [70,71].
If we analyze the mean dynamic behaviour of each of the rock glaciers between 2001 and 2009 (Figure 10), the relationship revealed between horizontal displacement and subsidence in the Doesen rock glacier is 1 to 0.36 (its horizontal dynamic is approximately three times greater than the vertical dynamic). This relationship in the case of the Posets rock glacier in the Pyrenees is approximately 1 to 0.59 (its horizontal dynamic is almost double that that of its subsidence). In the Corral del Veleta rock glacier, this relationship between horizontal displacement and subsidence is 1 to 2.40; therefore, it has a relationship almost inverse to that of the Doesen rock glacier. The presence of negative altimetric movement (sinking), so pronounced in the case of Corral del Veleta, is associated with ongoing degradation of the frozen mass (relict glacial ice and permafrost) upon which the body of the rock glacier lies [27]. In addition, horizontal displacement is shown to be lesser and sinks more the further south the geographical position of the rock glacier (Figure 10).
Up to this point, it has been the dynamic “advancing” behaviour of the rock glacier that has been analyzed, but its retreat must also be considered. This matter appears to be contradictory, but glacial retreat is measured in terms of the loss of surface, which can be determined by measuring the glacial perimeter, using GNSS where there is no appreciable change. This retreat can also be determined through the evolution of points on the front of the rock glacier (Figure 7). Points that initially had behaviour similar to any other point on the rock glacier may lose their dynamism after some years and therefore no longer form an active part of it. Therefore, the frontal retreat taking place in the rock glacier is checked.
The geophysical survey in 2009 indicated a frozen mass thickness of around 10 m (Figure 6), but since then the total station and GNSS have established a mean loss in thickness throughout the rock glacier of 2.3 m. At the end of August 2019, therefore, the Corral del Veleta rock glacier should have a thickness of 7.7 m. With this thickness and mean losses in the future similar to the annual mean since 2014 of −0.45 m, in 17 years (2036) the rock glacier would become inactive. However, if global climate change predictions prove to be correct, the time it takes to reach this state may be shorter and the inactive state could come sooner.
In addition to the behaviour of some elements or the volumetry of the rock glacier of Corral del Veleta, other experiments have also been carried out, such as the five profiles of the terrain using GNSS, and these same profiles using “Restitutor” photogrammetry, TLS, and UAV. This study is useful for checking the precision of the digital elevation models (DEM), and a comparison was made of the five profiles (Figure 5a). Specifically, the MDEs of the photogrammetry were tested using the Restitutor programme, TLS, and UAV for the measurements from 2019 under the consideration that the data collected in the field with GNSS have acceptable precision (±3 cm). Figure 11 shows these comparisons with profile 2, in which the errors are of ±30 cm using the photogrammetric technique, and so the precision of the model is more than acceptable for the purposes of drawing up a photogrammetric cartography on a 1:1500 scale. Although the maximum uncertainty of the data collected by TLS is ±3 cm and by UAV is ±4 cm, it should be pointed out that there are areas from which information is not collected, owing to their being occluded among the rocks, with the logical result being that they fail to be measured. There are differences of ±15 cm between the real model taken in the field with GNSS and that obtained using TLS or a UAV.
Since carrying out the analytical restitutions in 2003 and later the automatic digital restitutions using “Restitutor” in 2008, through to the present use of MDEs obtained by UAV, the precisions of the MDEs have improved considerably and their production costs have fallen greatly.

6. Conclusions

Several geomatic techniques (topography, photogrammetry, GNSS, TLS, and UAV) were applied on the Corral del Veleta rock glacier to determine its dynamic and evolution. The present study describes the methodological use and adaptation of these techniques to the geomorphological and orographic challenge to provide an accurate description of the rock glacier. This paper may be of use to other geomorphological researchers as a reference regarding the use and methodological adaptation of geomatic techniques to similar situations (e.g., glaciers, volcanoes, dunes, beaches, ravines, etc.). Now that this research is complete, we are in a position to state that there is no single perfect applied geomatic technique for each situation, but rather the techniques that resolve the circumstances of each case that arises may be diverse and complementary.
In our case, the use of the different geomatic techniques described has facilitated relevant and decisive data on the morphodynamic evolution of the Corral del Veleta rock glacier between 2001 and 2019. The methods applied have enabled an assessment of the rate of degradation of the relict glacial ice and permafrost on which it lies with great precision (±1 cm, ±2 cm…), at the same time providing data relevant to improving our understanding of the physical temporal behaviour of the active layer.
Dynamic monitoring throughout the study period has clearly revealed that relict glacial masses and permafrost trapped at depth are now subject to a continual process of degradation. The consequence of this degradation is observed in the repeated and visible subsidence on the surface of the blocks that comprise the rock glacier. The interpretation of these observations is that this degredation is the result of the succession of cascading physical processes initiated by the external radiation that incides on the ground, particularly since the rock glacier became free of snowcover and as the melt waters flow over the active layer. The degradation of these frozen masses takes place over a few weeks in summer (in August) and is further accelerated by the fact that the snow has tended to remain on the summits of Sierra Nevada for a shorter time. Similarly, there is a predominance of degradation in vertical movements, which leads to collapse and comes in response to the gradual melting of the underlying frozen bodies.
The monitoring carried out on the same dates every year at the end of August reveals this to be a rock glacier in an accelerated process of destabilization, and that this is due to the fact that the frozen bodies that lie within are progressively degrading and having a sharp effect on its dynamism. There is a predominance of vertical movements over others, mainly horizontal dynamics. This leads us to put forward the hypothesis that if the current climatic conditions persist, within 17 years (2036) the Corral del Veleta active rock glacier may become completely inactive due to the disappearance of the frozen bodies on which it lies.

Author Contributions

Conceptualization, J.J.d.S.B. and A.G.-O.; methodology, J.J.d.S.B., A.D.A. and M.S.-F.; formal analysis, J.J.d.S.B.; and A.G.-O.; investigation, J.J.d.S.B., A.D.A., M.S.-F., A.G.-O., M.S.-C. and F.S.-F.; resources, J.J.d.S.B. and A.D.A.; data curation, J.J.d.S.B., A.D.A. and M.S.-F.; writing—original draft preparation, J.J.d.S.B. and A.G.-O.; writing—review and editing, J.J.d.S.B., A.D.A., M.S.-F., A.G.-O., M.S.-C. and F.S.-F.; visualization, J.J.d.S.B., A.D.A. and M.S.-F.; supervision, J.J.d.S.B. and A.G.-O.; project administration, J.J.d.S.B. and A.G.-O.; funding acquisition, J.J.d.S.B. and A.G.-O. All authors have read and agreed to the published version of the manuscript.

Funding

Consejería de Economía, Ciencia y Agenda Digital de la Junta de Extremadura and European Regional Development Fund of the European Union through the reference grant GR21156.

Acknowledgments

This publication has been made possible thanks to funding granted by the Consejería de Economía, Ciencia y Agenda Digital de la Junta de Extremadura and by the European Regional Development Fund of the European Union through the reference grant GR21156.

Conflicts of Interest

The funders had no role in the design of the study; in the collection, analyses, or interpretation of data; in the writing of the manuscript, or in the decision to publish the results.

References

  1. Bradley, R.S.; Jones, P.D. Climate Since AD 1500; Psychology Press: Hove, UK, 1992; ISBN 0415120306. [Google Scholar]
  2. Holzhauser, H.; Magny, M.; Zumbuühl, H.J. Glacier and lake-level variations in west-central Europe over the last 3500 years. Holocene 2005, 15, 789–801. [Google Scholar] [CrossRef]
  3. Gómez Ortiz, A.; Plana Castellví, J.A. La pequeña Edad del Hielo en Sierra Nevada a partir de los escritos de la época (siglos) XVIII y XIX) y relaciones con el progreso de la geografía física y geomorfología española. Boletín Asoc. Geógrafos Españoles 2006, 42, 71–98. [Google Scholar]
  4. González Trueba, J.J.; Moreno, R.M.; Martínez de Pisón, E.; Serrano, E. ‘Little Ice Age’ glaciation and current glaciers in the Iberian Peninsula. Holocene 2008, 18, 551–568. [Google Scholar] [CrossRef]
  5. González Trueba, J.J. La Pequeña Edad del Hielo en los Picos de Europa (Cordillera Cantábrica, NO de España). Análisis morfológico y reconstrucción del avance glaciar histórico. Cuatern. Geomorfol. 2005, 19, 79–94. [Google Scholar]
  6. Kellerer-Pirklbauer, A.; Kaufmann, V. Deglaciation and its impact on permafrost and rock glacier evolution: New insight from two adjacent cirques in Austria. Sci. Total Environ. 2018, 621, 1397–1414. [Google Scholar] [CrossRef] [PubMed]
  7. Pandey, A.; Sarkar, M.S.; Kumar, M.; Singh, G.; Lingwal, S.; Rawat, J.S. Retreat of Pindari glacier and detection of snout position using remote sensing technology. Remote Sens. Appl. Soc. Environ. 2018, 11, 64–69. [Google Scholar] [CrossRef]
  8. Brighenti, S.; Tolotti, M.; Bruno, M.C.; Wharton, G.; Pusch, M.T.; Bertoldi, W. Ecosystem shifts in Alpine streams under glacier retreat and rock glacier thaw: A review. Sci. Total Environ. 2019, 675, 542–559. [Google Scholar] [CrossRef]
  9. Zhang, Q.; Yi, C.; Fu, P.; Wu, Y.; Liu, J.; Wang, N. Glacier change in the Gangdise Mountains, southern Tibet, since the Little Ice Age. Geomorphology 2018, 306, 51–63. [Google Scholar] [CrossRef]
  10. Chueca, J.; Julián, A. Movement of besiberris rock glacier, central pyrenees, Spain: Data from a 10-year geodetic survey. Arctic Antarct. Alp. Res. 2003, 37, 163–170. [Google Scholar] [CrossRef] [Green Version]
  11. Chueca, J.; Julián Andrés, A.; Saz Sánchez, M.A.; Creus Novau, J.; López Moreno, J.I. Responses to climatic changes since the Little Ice Age on Maladeta Glacier (Central Pyrenees). Geomorphology 2005, 68, 167–182. [Google Scholar] [CrossRef]
  12. Konrad, S.K.; Humphrey, N.F.; Steig, E.J.; Clark, D.H.; Potter, N., Jr.; Pfeffer, W.T. Rock glacier dynamics and paleoclimatic implications. Geology 1999, 27, 1131–1134. [Google Scholar] [CrossRef]
  13. Haeberli, W.; Hallet, B.; Arenson, L.; Elconin, R.; Humlum, O.; Kääb, A.; Kaufmann, V.; Ladanyi, B.; Matsuoka, N.; Springman, S.; et al. Permafrost creep and rock glacier dynamics. Permafr. Periglac. Process. 2006, 17, 189–214. [Google Scholar] [CrossRef]
  14. Whalley, W.B.; Martin, H.E. Rock glaciers: Part II models and mechanisms. Prog. Phys. Geogr. 1992, 16, 127–186. [Google Scholar] [CrossRef]
  15. Kääb, A.; Kaufmann, V.; Ladstädter, R.; Eiken, T. Rock glacier dynamics: Implications from high-resolution measurements of surface velocity fields. In Permafrost, Proceedings of the Eighth International Conference on Permafrost, Zurich, Switzerland, 21–25 July 2003; Phillips, M., Springman, S., Arenson, L., Eds.; Balkema: Zurich, Switzerland, 2003; Volume 1, pp. 501–506. [Google Scholar]
  16. Kääb, A.; Weber, M. Development of transverse ridges on rock glaciers: Field measurements and laboratory experiments. Permafr. Periglac. Process. 2004, 15, 379–391. [Google Scholar] [CrossRef]
  17. Haeberli, W. Modern research perspectives relating to permafrost creep and rock glaciers: A discussion. Permafr. Periglac. Process. 2000, 11, 290–293. [Google Scholar] [CrossRef]
  18. Berthling, I. Beyond confusion: Rock glaciers as cryo-conditioned landforms. Geomorphology 2011, 131, 98–106. [Google Scholar] [CrossRef]
  19. Martínez de Pisón, E. El glaciar rocoso activo de Los Gemelos en el macizo de Posets (Pirineo aragonés). Cuatern. Geomorfol. Rev. Soc. Española Geomorfol. Asoc. Española Estud. Cuatern. 1989, 3, 83. [Google Scholar]
  20. Serrano, E.; Agudo, C.; Martínez de Pisón, E. Rock glaciers in the Pyrenees. Permafr. Periglac. Process. 1999, 10, 101–106. [Google Scholar] [CrossRef]
  21. Serrano, E.; San José, J.J.; Agudo, C. Rock glacier dynamics in a marginal periglacial high mountain environment: Flow, movement (1991–2000) and structure of the Argualas rock glacier, the Pyrenees. Geomorphology 2006, 74, 285–296. [Google Scholar] [CrossRef]
  22. Serrano, E.; de Sanjosé, J.J.; González-Trueba, J.J. Rock glacier dynamics in marginal periglacial environments. Earth Surf. Process. Landf. 2010, 35, 1302–1314. [Google Scholar] [CrossRef]
  23. de Sanjosé, J.J.; Berenguer, F.; Atkinson, A.D.J.; De Matías, J.; Serrano, E.; Gómez-Ortiz, A.; González-García, M.; Rico, I. Geomatics techniques applied to glaciers, rock glaciers, and ice patches in Spain (1991–2012). Geogr. Ann. Ser. A Phys. Geogr. 2014, 96, 307–321. [Google Scholar] [CrossRef]
  24. Eiken, T.; Hagen, J.O.; Melvold, K. Kinematic GPS survey of geometry changes on Svalbard glaciers. Ann. Glaciol. 1997, 24, 157–163. [Google Scholar] [CrossRef] [Green Version]
  25. Prantl, H.; Nicholson, L.; Sailer, R.; Hanzer, F.; Juen, I.F.; Rastner, P. Glacier snowline determination from terrestrial laser scanning intensity data. Geosciences 2017, 7, 60. [Google Scholar] [CrossRef] [Green Version]
  26. Kaufmann, V.; Seier, G.; Sulzer, W.; Wecht, M.; Liu, Q.; Lauk, G.; Maurer, M. Rock glacier monitoring using aerial photographs: Conventional vs. UAV-based mapping—A comparative study. Int. Arch. Photogramm. Remote Sens. Spat. Inf. Sci. 2018, XLII, 239–246. [Google Scholar] [CrossRef] [Green Version]
  27. Gómez-Ortiz, A.; Salvador Franch, F.; Schulte, L.; de Sanjosé Blasco, J.J.; Atkinson Gordo, A.; Palacios Estremera, D. Evolución morfodinámica de un enclave montañoso recién deglaciado: El caso del Corral del Veleta (Sierra Nevada), ¿consecuencia del Cambio Climático? Scr. Nova 2008, 12, 270. [Google Scholar]
  28. Gómez-Ortiz, A.; Palacios, D.; Schulte, L.; Salvador-Franch, F.; Plana-Castellví, J.A. Evidences from historical documents of landscape evolution after Little Ice Age of a Mediterranean high mountain area, Sierra Nevada, Spain (eighteenth to twentieth centuries). Geogr. Ann. Ser. A Phys. Geogr. 2009, 91, 279–289. [Google Scholar] [CrossRef]
  29. Gómez-Ortiz, A.; Oliva Franganillo, M.; Salvador Franch, F.; Salvá Catireneu, M.; Palacios Estremera, D.; de Sanjosé Blasco, J.J.; Tanarro García, L.M.; Galindo Zaldívar, J.; Sanz Galdeano, C. Degradation of buried ice and permafrost in the Veleta cirque (Sierra Nevada, Spain) from 2006 to 2013 as a response to recent climate trends. Solid Earth 2014, 5, 979–993. [Google Scholar] [CrossRef] [Green Version]
  30. Gómez-Ortiz, A.; Salvador Franch, F.; de Sanjosé Blasco, J.J.; Palacios Estremera, D.; Oliva Franganillo, M.; Salvà Catarineu, M.; Tanarro, L.M.; Raso Nadal, J.M.; Atkinson Gordo, A.; Schulte, L.; et al. Degradación de hielo fósil y permafrost y cambio climático en Sierra Nevada. Proy. Investig. Parq. Nac. 2012, 25–43. [Google Scholar]
  31. Salvador Franch, F.; Gómez Ortiz, A.; Salvà Catarineu, M.; Palacios Estremera, D. Caracterización térmica de la capa activa de un glaciar rocoso en medio periglaciar de alta montaña mediterránea: El ejemplo del Corral del Veleta (Sierra Nevada, España). Cuad. Investig. Geográfica 2011, 37, 25–48. [Google Scholar] [CrossRef] [Green Version]
  32. Gómez-Ortiz, A.; Palacios, D.; Luengo, E.; Tanarro, L.M.; Schulte, L.; Ramos, M. Talus instability in a recent deglaciation area and its relationship to buried ice and snow cover evolution (Picacho del Veleta, Sierra Nevada, Spain). Geogr. Ann. Ser. A Phys. Geogr. 2003, 85, 165–182. [Google Scholar] [CrossRef]
  33. Sanz de Galdeano, C.; López-Garrido, A.C. Estratigrafía y estructura de las unidades alpujárrides en el borde occidental de Sierra Nevada (Granada, España). Rev. Soc. Geol. España 1999, 12, 187–198. [Google Scholar]
  34. Quelle, O. Beitrage zur Kenntnis der Spanischen Sierra Nevada. Ph.D. Thesis, Friedrich-Wilhelms-Universitat zu Berlin, Berlin, Germany, 1908. [Google Scholar]
  35. Messerli, B. Beiträge zur Geomorphologie der Sierra Nevada (Andalusien); Juris-Verlag: Zürich, Switzerland, 1965. [Google Scholar]
  36. Grunewald, K.; Scheithauer, J. Europe’s southernmost glaciers: Response and adaptation to climate change. J. Glaciol. 2010, 56, 129–142. [Google Scholar] [CrossRef] [Green Version]
  37. López, M.; Rodrigo, J.; Sanjosé, J.J. Formulación de un modelo matemático para el estudio y predicción del comportamiento del glaciar rocoso de las Argualas (Pirineos centrales). Datum XXI 2002, 2, 38–44. [Google Scholar]
  38. Sanjosé, J.J.; Lerma, J.L. Estimation of the rocks glaciers dynamics by environmental modeling and automatic photogrammetric technic. In Proceedings of the XXth Congress International Society for Photogrammetry and Remote Sensing, Istanbul, Turkey, 12–23 July 2004; pp. 905–909. [Google Scholar]
  39. Zuo, X.; Bu, J.; Li, X.; Chang, J.; Li, X. The quality analysis of GNSS satellite positioning data. Clust. Comput. 2019, 22, 6693–6708. [Google Scholar] [CrossRef]
  40. Sanjosé Blasco, J.J.; Atkinson, A.; Gómez-Ortiz, A.; Salvador Franch, F. Glaciar rocoso del “Corral del Veleta” (Sierra Nevada): Aplicaciones geomáticas en el periodo 2001–2006. Topogr. Cartogr. Rev. Ilustre Col. Of. Ing. Técnicos Topogr. 2007, 24, 8–17. [Google Scholar]
  41. Sanjosé, J.J.; Atkinson, A.D.J.; Salvador, F.; Gómez Ortiz, A. Application of geomatic technique in controlling of the dynamics and cartography of the Veleta rock glacier (Sierra Nevada, Spain). Z. Geomorphol. 2007, 51, 79–89. [Google Scholar] [CrossRef]
  42. Sanjosé, J.J.; Atkinson, A.; Berenguer, F. Aplicación de Sistemas GNSS en el Monitoreo del Cambio Climático en la Península Ibérica. In Proceedings of the III Encuentro de Sistemas de Información Geográfica, Castelo Branco, Portugal, 17–18 May 2012. [Google Scholar]
  43. Lambiel, C.; Delaloye, R. Contribution of real-time kinematic GPS in the study of creeping mountain permafrost: Examples from the Western Swiss Alps. Permafr. Periglac. Process. 2004, 15, 229–241. [Google Scholar] [CrossRef]
  44. Sanjosé, J.J.; Serrano, E. Determinación del Movimiento Superficial del Glaciar Rocoso de las Argualas (Huesca) Mediante el Empleo de Técnicas Fotogramétricas. In Proceedings of the VII Reunión Nacional de Geomorfología, Valladolid, Spain, 19–20 September 2002; pp. 263–273. [Google Scholar]
  45. Sanjosé Blasco, J.J. Estimación de la Dinámica de los Glaciares Rocosos mediante Modelización Ambiental y Técnicas Fotogramétricas Automáticas. Topogr. Cartogr. Rev. Ilustre Col. Of. Ing. Técnicos Topogr. 2004, 21, 10–16. [Google Scholar]
  46. De Matías, J.; De Sanjosé, J.J.; López-Nicolás, G.; Sagüés, C.; Guerrero, J.J. Photogrammetric methodology for the production of geomorphologic maps: Application to the Veleta Rock Glacier (Sierra Nevada, Granada, Spain). Remote Sens. 2009, 1, 829–841. [Google Scholar] [CrossRef] [Green Version]
  47. de Matías, J.; del Pozo, J.M.; Campo, J.J.G. A Multi-View Dense Reconstruction for Rock Glacier Modelling. In Proceedings of the 5th International Conference on Virtual Systems and Multimedia, Vienna, Austria, 9–12 September 2009; pp. 163–168. [Google Scholar] [CrossRef]
  48. Bemis, S.P.; Micklethwaite, S.; Turner, D.; James, M.R.; Akciz, S.; Thiele, S.T.; Bangash, H.A. Ground-based and UAV-Based photogrammetry: A multi-scale, high-resolution mapping tool for structural geology and paleoseismology. J. Struct. Geol. 2014, 69, 163–178. [Google Scholar] [CrossRef]
  49. Piermattei, L.; Carturan, L.; Guarnieri, A. Use of terrestrial photogrammetry based on structure-from-motion for mass balance estimation of a small glacier in the Italian alps. Earth Surf. Process. Landf. 2015, 40, 1791–1802. [Google Scholar] [CrossRef]
  50. Santise, M.; Thoeni, K.; Roncella, R.; Diotri, F.; Giacomini, A. Analysis of low-light and night-time stereo-pair images for photogrammetric reconstruction. Int. Arch. Photogramm. Remote Sens. Spat. Inf. Sci. 2018, 42, 1015–1022. [Google Scholar] [CrossRef] [Green Version]
  51. Ergun, B.; Sahin, C.; Baz, I.; Ustuntas, T. A case study on the historical peninsula of Istanbul based on three-dimensional modeling by using photogrammetry and terrestrial laser scanning. Environ. Monit. Assess. 2010, 165, 595–601. [Google Scholar] [CrossRef] [PubMed]
  52. Abellán, A.; Calvet, J.; Vilaplana, J.M.; Blanchard, J. Detection and spatial prediction of rockfalls by means of terrestrial laser scanner monitoring. Geomorphology 2010, 119, 162–171. [Google Scholar] [CrossRef]
  53. Kaiser, A.; Neugirg, F.; Rock, G.; Müller, C.; Haas, F.; Ries, J.; Schmidt, J. Small-scale surface reconstruction and volume calculation of soil erosion in complex Moroccan gully morphology using structure from motion. Remote Sens. 2014, 6, 7050–7080. [Google Scholar] [CrossRef] [Green Version]
  54. Frattini, P.; Riva, F.; Crosta, G.B.; Scotti, R.; Greggio, L.; Brardinoni, F.; Fusi, N. Rock-avalanche geomorphological and hydrological impact on an alpine watershed. Geomorphology 2016, 262, 47–60. [Google Scholar] [CrossRef]
  55. Micheletti, N.; Tonini, M.; Lane, S.N. Geomorphological activity at a rock glacier front detected with a 3D density-based clustering algorithm. Geomorphology 2017, 278, 287–297. [Google Scholar] [CrossRef]
  56. de Sanjosé Blasco, J.J.; Gómez-Ortiz, A.; Atkinson, A.; Salvador-Franch, F.; Matías, J.; Salvá-Catarineu, M.; Berenguer Sempere, F. Aplicación de Técnicas Geomáticas en el Glaciar Rocoso Activo del Corral del Veleta (2001–2011). In Proceedings of the XII Reunión Nacional de Geomorfología, Santander, Spain, 17–20 September 2012; pp. 641–644. [Google Scholar]
  57. Salvà-Catarineu, M.; Salvador-Franch, F.; Gómez-Ortiz, A.; Fenández, M.; Sanjosé, J.J.; Atkinson, A. Análisis Morfométrico Aplicado al Estudio Geodinámico de un Glaciar Rocoso en Sierra Nevada (España): Aportaciones metodológicas. In Proceedings of the VI Seminário Latino-Americano de Geografía Física, Coimbra, Portugal, 26–30 May 2010. [Google Scholar]
  58. Sanjosé-Blasco, J.J.; Atkinson, A.; Berenguer, F.; Matías, J. Control de la Dinámica de los Glaciares en España (1991–2012). In Proceedings of the X TOPCART 2012, Madrid, Spain, 16–19 October 2012. [Google Scholar]
  59. Haeberli, W.; Schmid, W. Aerophotogrammetrical Monitoring of Rock Glaciers. In Proceedings of the 5th International Conference on Permafrost, Trondheim, Norway, 2–5 August 1988; Volume 2, pp. 764–769. [Google Scholar]
  60. Kääb, A.; Haeberli, W.; Gudmundsson, G.H. Analysing the creep of mountain permafrost using high precision aerial photogrammetry: 25 years of monitoring Gruben rock glacier, Swiss Alps. Permafr. Periglac. Process. 1997, 8, 409–426. [Google Scholar] [CrossRef]
  61. Roer, I.; Nyenhuis, M. Rockglacier activity studies on a regional scale: Comparison of geomorphological mapping and photogrammetric monitoring. Earth Surf. Process. Landf. 2007, 32, 1747–1758. [Google Scholar] [CrossRef]
  62. Kaufmann, V.; Ladstädter, R. Application of Terrestrial Photogrammetry for Glacier Monitoring in Alpine Environments. In Proceedings of the 21st Congress of ISPRS, Beijing, China, 3–11 July 2008; Volume 37, pp. 813–818. [Google Scholar]
  63. Lowe, D.G. Distinctive image features from scale-invariant keypoints. Int. J. Comput. Vis. 2004, 60, 91–110. [Google Scholar] [CrossRef]
  64. Gómez-Ortiz, A.; Oliva, M.; Salvador-Franch, F.; Palacios, D.; Tanarro, L.M.; de Sanjosé-Blasco, J.J.; Salvà-Catarineu, M. Monitoring permafrost and periglacial processes in Sierra Nevada (Spain) from 2001 to 2016. Permafr. Periglac. Process. 2019, 30, 278–291. [Google Scholar] [CrossRef]
  65. Salvador Franch, F.; Gómez-Ortiz, A.; Palacios Estremera, D. Comportamiento térmico del suelo en un enclave de alta montaña mediterránea con permafrost residual: Corral del Veleta (Sierra Nevada, Granada). In Ambientes Periglaciares, Permafrost y Variabilidad Climática: II Congreso Ibérico de la IPA, Sigüenza, Spain, 21–24 June 2009; Blanco, J.J., De Pablo, M.A., Ramos, M., Eds.; Universidad de Alcalá de Henares: Sigüenza, Spain, 2010; pp. 61–68. [Google Scholar]
  66. Tanarro García, L.M.; Palacios Estremera, D.; Zamorano Orozco, J.J.; Gómez-Ortiz, A. Cubierta nival, permafrost y formación de flujos superficiales en un talud detrítico de alta montaña (Corral del Veleta, Sierra Nevada, España). Cuad. Investig. Geográfica 2010, 36, 39–56. [Google Scholar] [CrossRef] [Green Version]
  67. Kaufmann, V.; Ladstädter, R.; Kienast, G. 10 Years of Monitoring of the Doesen Rock Glacier (Ankogel Group, Austria)—A Review of the Research Activities for the Time Period 1995–2005. In Proceedings of the Fifth Mountain Cartography Workshop, Bohinj, Slovenia, 29 March–1 April 2006; Volume 1, pp. 129–144. [Google Scholar]
  68. de Sanjosé Blasco, J.J.; Gordo, A.; Kaufmann, V.; Ortiz, A.G.; Franch, F.S.; Cañadas, E.S.; Trueba, J.J.G. Técnicas geomáticas aplicadas al control de los glaciares rocosos. Comparación de los glaciares rocosos de Doesen (Alpes), Posets (Pirineos) y Corral del Veleta (Sierra Nevada). Rev. Cart. 2010, 45–62. [Google Scholar]
  69. Serrano Cañadas, E.; González Trueba, J.J.; Sanjosé Blasco, J.J. Dinámica, evolución y estructura de los glaciares rocosos de los Pirineos. Cuad. Investig. Geográfica 2011, 37, 145–170. [Google Scholar] [CrossRef] [Green Version]
  70. Kienast, G.; Kaufmann, V. Geodetic measurements on glaciers and rock glaciers in the Hohe Tauern National Park (Austria). In Proceedings of the 4th ICA Mountain Cartography Workshop, Vall de Núria, Spain, 30 September–2 October 2004; Volume 30, pp. 101–108. [Google Scholar]
  71. Krainer, K.; He, X. Flow velocities of active rock glaciers in the Austrian Alps. Geogr. Ann. Ser. A Phys. Geogr. 2006, 88, 267–280. [Google Scholar] [CrossRef]
Figure 1. Physical map of the Iberian Peninsula and the location of Sierra Nevada (Corral del Veleta rock glacier).
Land 11 00613 g001
Figure 2. The Veleta and its rock glacier. (a) Panoramic view of the Veleta (viewed towards the east, photograph from August 2007). (b) Part of the Veleta rock glacier (eastern part of the base of the Veleta, 3100 m, photograph from August 2008). (c) Vertical panoramic view of the base of the Veleta (view from Picacho del Veleta at 3389 m, photograph from August 2006).
Land 11 00613 g002
Figure 3. (a) Image (low quality) obtained using the total station with the position of the points measured on the front of the rock glacier. (b) Detailed image of point 29 in 2007, obtained with the total station. (c) The same point 29 in the year 2008. (d) Point 29 in the year 2009.
Land 11 00613 g003aLand 11 00613 g003b
Figure 4. Displacement (horizontal and vertical) of the rock glacier (2001–2019).
Land 11 00613 g004
Figure 5. (a) Positions of the topographic profiles and the geophysical profile on the automatic cartography (Restitutor) of 2008. (b) Evolution of profile P5 between 2004 and 2019.
Land 11 00613 g005
Figure 6. Transversal electrical tomography of Corral del Veleta (August 2009). In blue, the thickness of the frozen bodies, with a mean value of 10 m. The rock glacier is situated over it [29].
Land 11 00613 g006
Figure 7. Displacements in the period 2005–2019 of points in the upper (point #12), central (point #34) and lower (point #54) parts of the front of the rock glacier.
Land 11 00613 g007
Figure 8. Comparison of digital elevation models: (a) Period 2012–2014. (b) Period 2014–2016. (c) Period 2016–2019. (d) Whole period (7 years) 2012–2019.
Land 11 00613 g008
Figure 9. Representation of the thermal record from thermometers placed at −0.05 m (surface), −0.20 m, −0.50 m, −1.00 m and −1.50 m from the surface. (a) The period of seven years from September 2006 to September 2013. (b) The annual period from September 2017 to September 2018.
Land 11 00613 g009
Figure 10. Planimetric and altimetric comparison of mean displacement of the rock glaciers of Doesen in the Alps, Posets in Pyrenees and Corral del Veleta in Sierra Nevada.
Land 11 00613 g010
Figure 11. Comparison of profile 2 (Figure 5a) obtained using GNSS on the ground and the 3D models (MDE) of digital photogrammetry with Restitutor, TLS, and UAV.
Land 11 00613 g011
Table 1. Dynamic of steel rod 2 (located in frontal part of the rock glacier) in annual periods, and the total for the 18-year period of measurements (2001–2019).
PeriodDirectionHorizontal Displac.Subsidence
Centesimal GraduationMetresMetres
2001–2002194.04900.064−0.246
2002–2003196.75800.157−0.384
2003–2004210.27300.044−0.115
2004–2005201.26400.302−0.654
2005–2006176.69100.207−0.468
2006–2007203.56600.214−0.482
2007–2008178.27900.146−0.454
2008–2009165.50000.114−0.266
2009–2010SNOW (No data)--
2010–2011SNOW (No data)--
2009–2012 (3 years)165.94300.094−0.186
2012–2013SNOW (No data)--
2012–2014 (2 years)154.14600.065−0.317
2014–2015NO SNOW (No data)--
2014–2016 (2 years)153.91300.184−0.891
2016–2017NO SNOW (No data)--
2017–2018SNOW (No data)--
2016–2019 (3 years)149.64800.178−0.845
2001–2019 (18 years)180.35431.769 m−5.308 m
Table 2. Dynamic of steel rod 2 for 11 month periods (end of August-end of July) in consecutive years and periods of one month (August) [23].
PeriodDirectionHorizontal Displac.Subsidence
Centesimal GraduationMetresMetres
August 2005–July 2006166.42500.105−0.240
July 2006–August 2006187.07400.104−0.228
August 2006–July 2007208.94300.099−0.227
July 2007–August 2007198.89300.115−0.255
August 2007–July 2008180.71700.084−0.246
July 2008–August 2008175.02300.063−0.208
Table 3. Calculation of the volume loss of the rock glacier using data from the TLS.
PeriodVolume m3
August 2012–August 2014−625.95
August 2014–August 2016−1403.18
August 2016–August 2019−2418.76
August 2012–August 2019−4447.90
Publisher’s Note: MDPI stays neutral with regard to jurisdictional claims in published maps and institutional affiliations.

