
Modeling Cadmium Contents in a Soil–Rice System and Identifying Potential Controls
by
 and
and
Yingfan Zhang
1,2, 
Tingting Fu
2,
Xueyao Chen
2,
Hancheng Guo
2,
Hongyi Li
3 and
and
Bifeng Hu
3,4,5,* 1
Department of Computer Science, Swansea University, Fabian Way, Swansea SA1 8EN, UK
2
Key Laboratory of Environment Remediation and Ecological Health, Ministry of Education, College of Environmental and Resource Sciences, Zhejiang University, Hangzhou 310058, China
3
Department of Land Resource Management, School of Tourism and Urban Management, Jiangxi University of Finance and Economics, Nanchang 330013, China
4
Institute of Agricultural Remote Sensing and Information Technology Application, College of Environmental and Resource Sciences, Zhejiang University, Hangzhou 310058, China
5
Key Laboratory of Agricultural Remote Sensing and Information Systems, College of Environmental and Resource Sciences, Zhejiang University, Hangzhou 310058, China
*
Author to whom correspondence should be addressed.
Land 2022, 11(5), 617; https://0-doi-org.brum.beds.ac.uk/10.3390/land11050617
Submission received: 18 February 2022
/
Revised: 7 April 2022
/
Accepted: 15 April 2022
/
Published: 21 April 2022
(This article belongs to the Special Issue Heavy Metal(oid)s & Organic Pollutants in Soil: Effects, Sources, and Remediation Techniques. Machine Learning Approaches for the Assessment of Soil Pollution)
Abstract
:Cadmium (Cd) pollution in a soil–rice system is closely related to widely concerning issues, such as food security and health risk due to exposure to heavy metals. Therefore, modeling the Cd content in a soil–rice system and identifying related controls could provide critical information for ensuring food security and reducing related health risks. To archive this goal, in this study, we collected 217 pairs of soil–rice samples from three subareas in Zhejiang Province in the Yangtze River Delta of China. All soil–rice samples were air-dried and conducted for chemical analysis. The Pearson’s correlation coefficient, ANOVA, co-occurrence network, multiple regression model, and nonlinear principal component analysis were then used to predict the Cd content in rice and identify potential controls for the accumulation of Cd in rice. Our results indicate that although the mean total concentration of Cd in soil samples was higher than that of the background value in Zhejiang Province, the mean concentration of Cd in rice was higher than that of the national regulation value. Furthermore, a significant difference was detected for Cd content in rice planted in different soil groups derived from different parental materials. In addition, soil organic matter and total Cd in the soil are essential factors for predicting Cd concentrations in rice. Additionally, specific dominant factors resulting in Cd accumulation in rice planted at different subareas were identified via nonlinear principal component analysis. Our study provides new insights and essential implications for policymakers to formulate specific prevention and control strategies for Cd pollution and related health risks.
1. Introduction
In the last several decades, with the advancement of industrialization and urbanization, soil heavy metal pollution has become a hot and widely discussed issue globally [1,2,3,4,5,6]. An increasing concentration of heavy metals has entered the soil via atmospheric deposition, wastewater irrigation, and solid waste landfill sourced from anthropogenic activities, such as industry waste discharge, traffic emission, and application of chemical fertilizers and pesticides [7,8,9,10,11]. As a result, crops, such as rice, growing in contaminated soils, can absorb heavy metals in the soil, which could pose a significant health threat to the human body through the food chain.
Soil heavy metal pollution comprises characteristics including high mobility, easy accumulation, and strong toxicity. The per capita rice consumption in China was about 143 kg in 2019. However, Dudka et al. [12] reported that more than 50% of the rice growing was at risk of heavy metal pollution. Chen et al. [13] also revealed that the annual reduction in rice production due to heavy metal pollution was as high as 10 million tons in China. Among these pollutants, cadmium (Cd) is currently the most polluting heavy metal element in China, as revealed by the national survey [14]. Cd can enter rice roots through the epidermis and concentrate in the tissues of the rice plant, after which the human body can ingest Cd during the consumption of the contaminated rice [15,16,17]. Additionally, Cd can accumulate in the human body through skin contact, food-chain bioaccumulation, inhalation, and so on [18,19,20]. In addition, long-term exposure to Cd can cause severe and damaging effects on the human body, such as lung cancer, bone fractures, and kidney dysfunction [21,22,23]. A significant correlation was observed between the exchangeable state and available state of heavy metals [24], as the exchangeable state reflects the available form of heavy metals. Therefore, the available Cd content in soil samples has frequently been estimated using the exchangeable Cd content in soil [25]. Therefore, analyzing the pollution status and exploring the correlation between Cd pollution and the soil–rice system is of great significance to ensure soil environmental quality and food safety, which has attracted increasing attention from researchers in different disciplines, such as soil science, agricultural resources and environment, and ecological science [6,26,27,28].
Since the soil–rice ecosystem is an open system comprising the internal environment, external environment, and system interface environment, including those having natural characteristics and the imprint of manufacturing activities, Cd pollution has been closely related to the regional soil geochemical background. The natural background value, therefore, has a great effect on the spatial pattern of pollutant distribution in the soil [9,29].
Therefore, the study area, Zhejiang Province in the Yangtze River Delta, was selected for this study. Here, 217 pairs of soil–rice samples were collected from three subareas in Zhejiang Province to construct a model for predicting Cd in rice using auxiliary variables and identify related controls for managing Cd accumulation in rice. The obtained results are expected to provide scientific implications and essential references for controlling Cd pollution in the soil–rice system, thereby ensuring food security.
2. Materials and Methods
2.1. Study Area
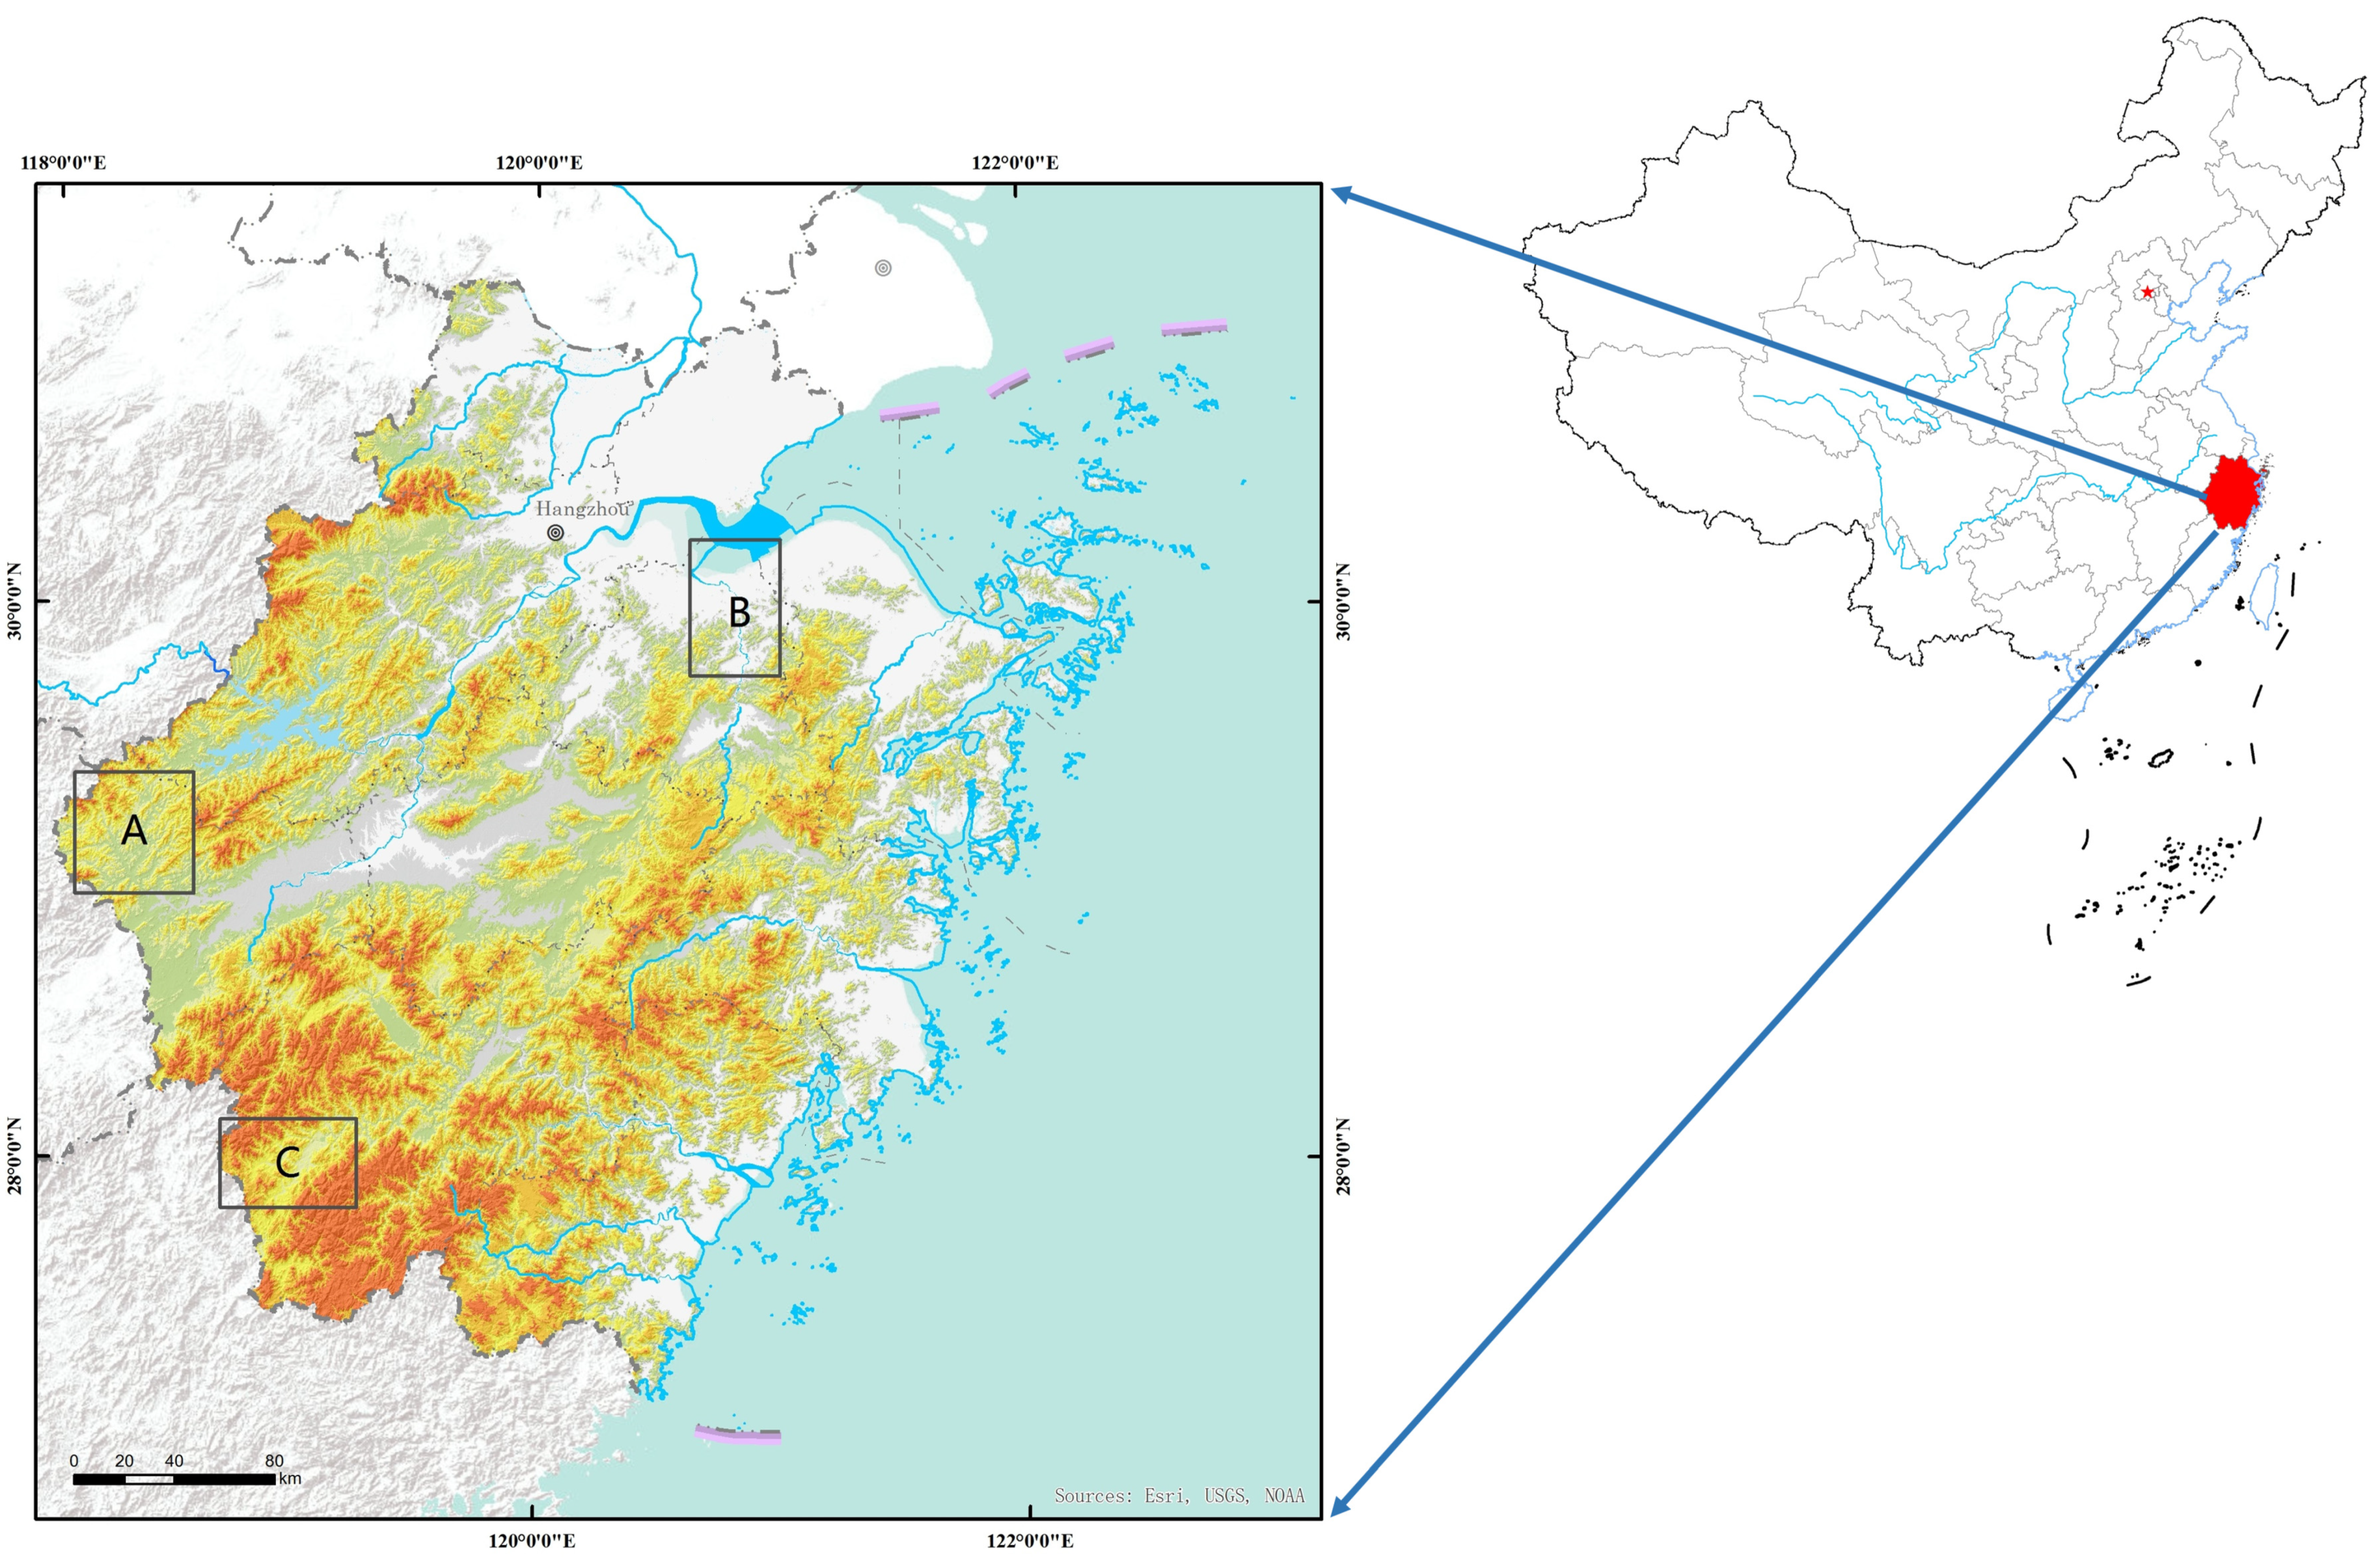
Study areas were selected from the west, southwest, and north of Zhejiang Province, which is located at the south wing of the Yangtze River Delta (121°3′ to 122°8′ E, 29°24′ to 30°4′ N). The three rice-growing areas (Sites A, B, and C) (Figure 1) selected were distributed in the plains, low hills, and mountains, respectively. Differences in the geological backgrounds of the soils in the three areas were observed. Although the soil parent materials (PmT) in Site A comprised high-silicon, high-aluminum, and potassium–sodium-rich rocks, mainly derived from metamorphic rocks, the primary rocks were mostly feldspar rocks. Furthermore, the geological age of the PmT was mostly Quaternary and Jurassic. Moreover, while the content of MgO in the surface soil was high, the range of CaO and Na2O was low.
The PmT in Site B was mostly aluminum-rich, silicon-rich, and ironrich loose sediments, comprising mainly loose sediments. As observed, primary rocks were porphyritic diorite and lamprophyre. Although the geological age periods of the parent materials were mostly Quaternary Holocene, the bedrock was weathered, comprising residual diluvial and alluvial lacustrine sediments. The soil in hilly areas was highly weathered and leached; a large amount of its salt base was leached. Additionally, the soil maturity in the plain area was high, as most of its salt base was also leached. Therefore, the contents of CaO, MgO, and Na2O in the topsoil were low, showing a relatively low background area.
The PmT in Site C were mostly silicon-rich, Al-rich, Fe-rich, and potassium-rich rocks, mainly comprising sedimentary rocks, primarily limestone, shale, and granite, formed in the Cambrian and Ordovician. As observed, average values of Ag, As, Ca, Cd, Na, S, and other elements, which existed as weathering products of the carbonate rocks at the study area, were higher than in other regions. Contents of Cd, Pb, Al, Cl, K, Na, CaO, and Na2O in weathering products of granite were significantly higher as well, showing a high background area [30].
2.2. Samples Collection and Analysis
From the three study areas, 217 soil surface (0–20 cm) samples were collected in 2013 based on the grid, with a size of 3000 m, including 94 soil samples from Site A, 106 soil samples from Site B, and 17 soil samples from Site C. Each soil sample was composited with five subsamples collected in the buffer zone with a radius of 5 m and then were mixed to compose a representative soil sample. There were 217 corresponding rice samples collected at the same locations as the soil samples during the harvest season. The sampling locations and elevation (Ele) were accurately recorded based on a differential global positioning system (GPS).
The soil surface sample was air-dried and ground to pass through a nylon sieve with a 2-mm pore diameter during data collection. Then, some soil samples were ground to pass through 100 meshes before laboratory chemical analysis. Soil pH (pH) was measured in water at a soil/solution ratio of 1:2.5 (m/v) using a pHS-3C digital pH meter (Shanghai REX Sensor Technology Co., Ltd., Shanghai, China) following the national standard of China (NY/T1377-2007). Total Cd in the soils (CdT) and rice (CdN) were determined from digested samples (HF–HNO3–HClO4) using inductively coupled plasma mass spectrometry (ICP-MS, Agilent 7500a, Santa Clara, CA, USA) [9]. Moreover, while the soil-available Cd (CdA) was determined using the CaCl2 solution method, the exchangeable state was extracted using the continuous extraction method (GB/T23739-2009). A significant correlation was observed between the exchangeable state and available state of heavy metals [24], as the exchangeable state reflects the available form of heavy metals. Therefore, the available Cd content in soil samples was frequently estimated using the exchangeable Cd content in soil [25].
All rice samples were oven-dried at 105 °C for one hour and then dried at 70 °C until a constant weight was reached. The rice samples were then comminuted using a pulverizer until the powder passed through a 100-mesh nylon sieve. This material was then stored in closed polyethylene bags for further analysis. The specific sample preparation method was adopted by national standards (NY/T 398-2000). The content of heavy metals in rice samples obtained was determined via inductively coupled plasma mass spectrometry (GB 5009.268-2016).
Additionally, pH, PmT, soil type (ST), soil cation exchange capacity (CEC), soil bulk density (BD), and soil organic matter (SOM) were selected as covariate data of soil environments. The quantity of irrigation water (IrW), pesticide (Pes), and fertilizer (Fer), including the density of enterprise (EnP) and elevation (Ele), were also selected as environmental variables for relevant research and analysis.
In addition, PmT information was sourced from Zhejiang Soil (National Soil Survey Office, 1995). The ST was taken from the second national soil survey in China (National soil survey office, 1998). The CEC data was provided by the China Soil Data Set (v1.1). The BD data were collected from the global soil grid in this study. The SOM data were from our previous study [1]. The EnP data were from the list of key monitoring enterprises of soil environment published by the industrial and commercial departments in 2017, the list of enterprises involved in heavy metal industries in 2018, and the list of key pollutant discharge units in Zhejiang Province in 2019. Information regarding IrW, Pes, and Fer were provided by the Zhejiang Statistical Yearbook of 2013. More details regarding the sampling and samples pretreatment were provided in our previous article [1].
2.3. Data Analysis
2.3.1. Correlation Analysis of Heavy Metal Content in Soil–Rice Systems
The Pearson’s correlation coefficient was used to calculate the correlation between Cd in the soil and rice samples. The formula used was as follows:
where is the Pearson’s correlation coefficient, which varied between −1 and 1. While the absolute value of the correlation coefficient represents the correlation between the two variables and the positive coefficient represents the positive correlation, the negative number represents the negative correlation. Additionally, represents the covariance between two variables, E(X) and E(Y) represent the expectations for X and Y variables, and and indicate the variances of X and Y, respectively. In addition, the first-order and second-order partial correlation coefficients were used to conduct relevant research and analysis, and related details are provided in the Support Information.
2.3.2. Quantification of Qualitative Variables
The soil environment, including external and internal environmental variables of rice samples, affect the CdN. These variables include quantitative factors, such as CdT, CdA, pH, SOM, and qualitative variables, comprising ST and PmT. All these variables have an important influence on the accumulation of Cd content in rice [31,32].
This study included three qualitative variables: soil texture, ST, and PmT. Conversely, 12 quantitative indices were considered, including CdT, pH, CdA, SOM, CEC, Ele, BD, EnP, IrW, Pes, Fer, and clay percentage. The qualitative variables were quantified through the following formula:
where represents the content of Cd in rice at a location planted in soil, which belongs to the kth parental material; represents the average Cd content of rice planted in the kth parental material, which can also reflect the variation in Cd content of rice planted in different parental materials. Alternatively, is the difference between the averaged Cd content of rice planted at the kth parental material and rice planted at a site , which reflects the invariance of Cd contents in rice planted in soil belonging to the same kind of parental material. Based on these parameters, all qualitative and quantitative variables were used for further analysis.
In this study, a co-occurrence network [33] was constructed to analyze the correlation between the independent and dependent variables. The nodes represent the independent variables such as pH, CEC, BD, SOM, Pes, Fer, IrW, EnP, Ele, CdT, and CdA and dependent variables such as CdN.
2.3.3. The Multiple Regression Model
The functional relationship between multiple independent and dependent variables was explored using mathematical statistics based on the combination of the existing empirical models and data. Ignoring the interaction between independent variables, the multiple regression models were established according to the relationship between the dependent variable Y and the respective variable Xi. Then, we overlayed each mathematical model to develop a new multivariate nonlinear regression equation to construct the evaluation index system better.
The log transformation was conducted on the SOM, CdT, CEC, CdA, BD, and EnP data. The Pes, Fer, and Irw were then integrated as a new variable named the outside input (OuI). Furthermore, we constructed a multiple regression model to predict Cd content in rice using other variables.
2.3.4. Nonlinear Principal Component Analysis
With conventional principal component analysis (PCA), both the covariance matrix and correlation coefficient matrix are transformed linearly, reflecting the linear correlation between different variables but not the nonlinear correlation.
Hence, Ye and Yang [34] previously proposed a nonlinear PCA to fill this gap, which combined the main direction information with peripheral information and imposed evaluation punishments according to the distance between the individual and main directions. Hence, suppose is the initial matrix composed of individuals and attributes to be evaluated, transformation into a standardized matrix using standardized formula becomes possible:
where is the maximum value of in each column and takes a value close to the minimum value of . After the standardization of variables, PCA was conducted on the standard variable . The number of principal components (a) were determined according to the principle that the eigenvalue was greater than 1 or the cumulative variance contribution rate exceeded 80%. The principal component was then calculated according to the load matrix in the following manner:
where, represents the eigenvector of the variable in the principal component , and represents the eigenvalues of the principal component . The final principal component factor should be an index of results obtained from the weighted combination.
2.3.5. Data Analysis
Summary statistical analysis, Shapiro–Wilk test, and correlation analysis were conducted in RStudio 1.1.383 [35]. One-way ANOVA was also analyzed in RStudio 1.1.383 [35] to explore the indigenous effect of qualitative indicators on CdT and CdN. The multiple regression model and nonlinear principal component analysis were processed in SPSS Statistics 24. The site map was edited in ArcGIS 10.7 (ESRI, Redlands, CA, USA).
3. Results and Discussion
3.1. Summarized Statistics of Cd Content in the Soil–Rice System
The descriptive statistics showing the content of heavy metals in soil–rice systems are presented in Table 1 and Figure S1. As observed, the averaged CdT in Sites A, B, and C were 1.50, 0.49, and 0.68 mg kg−1, respectively, which were higher than the background value of Cd (0.07 mg kg−1) in the soil in Zhejiang Province [9]. Correspondingly, the mean of CdA in Sites A, B, and C was 0.26, 0.07, and 0.18 mg kg−1, respectively. The mean CdN in Sites A, B, and C was 0.83, 0.22, and 0.25 mg kg−1, respectively, which exceeded the national regulation value (0.20 mg kg−1) [36]. Therefore, these results highlight the urgency of identifying potential Cd controls in rice and taking measures to control Cd pollution in the soil–rice system.
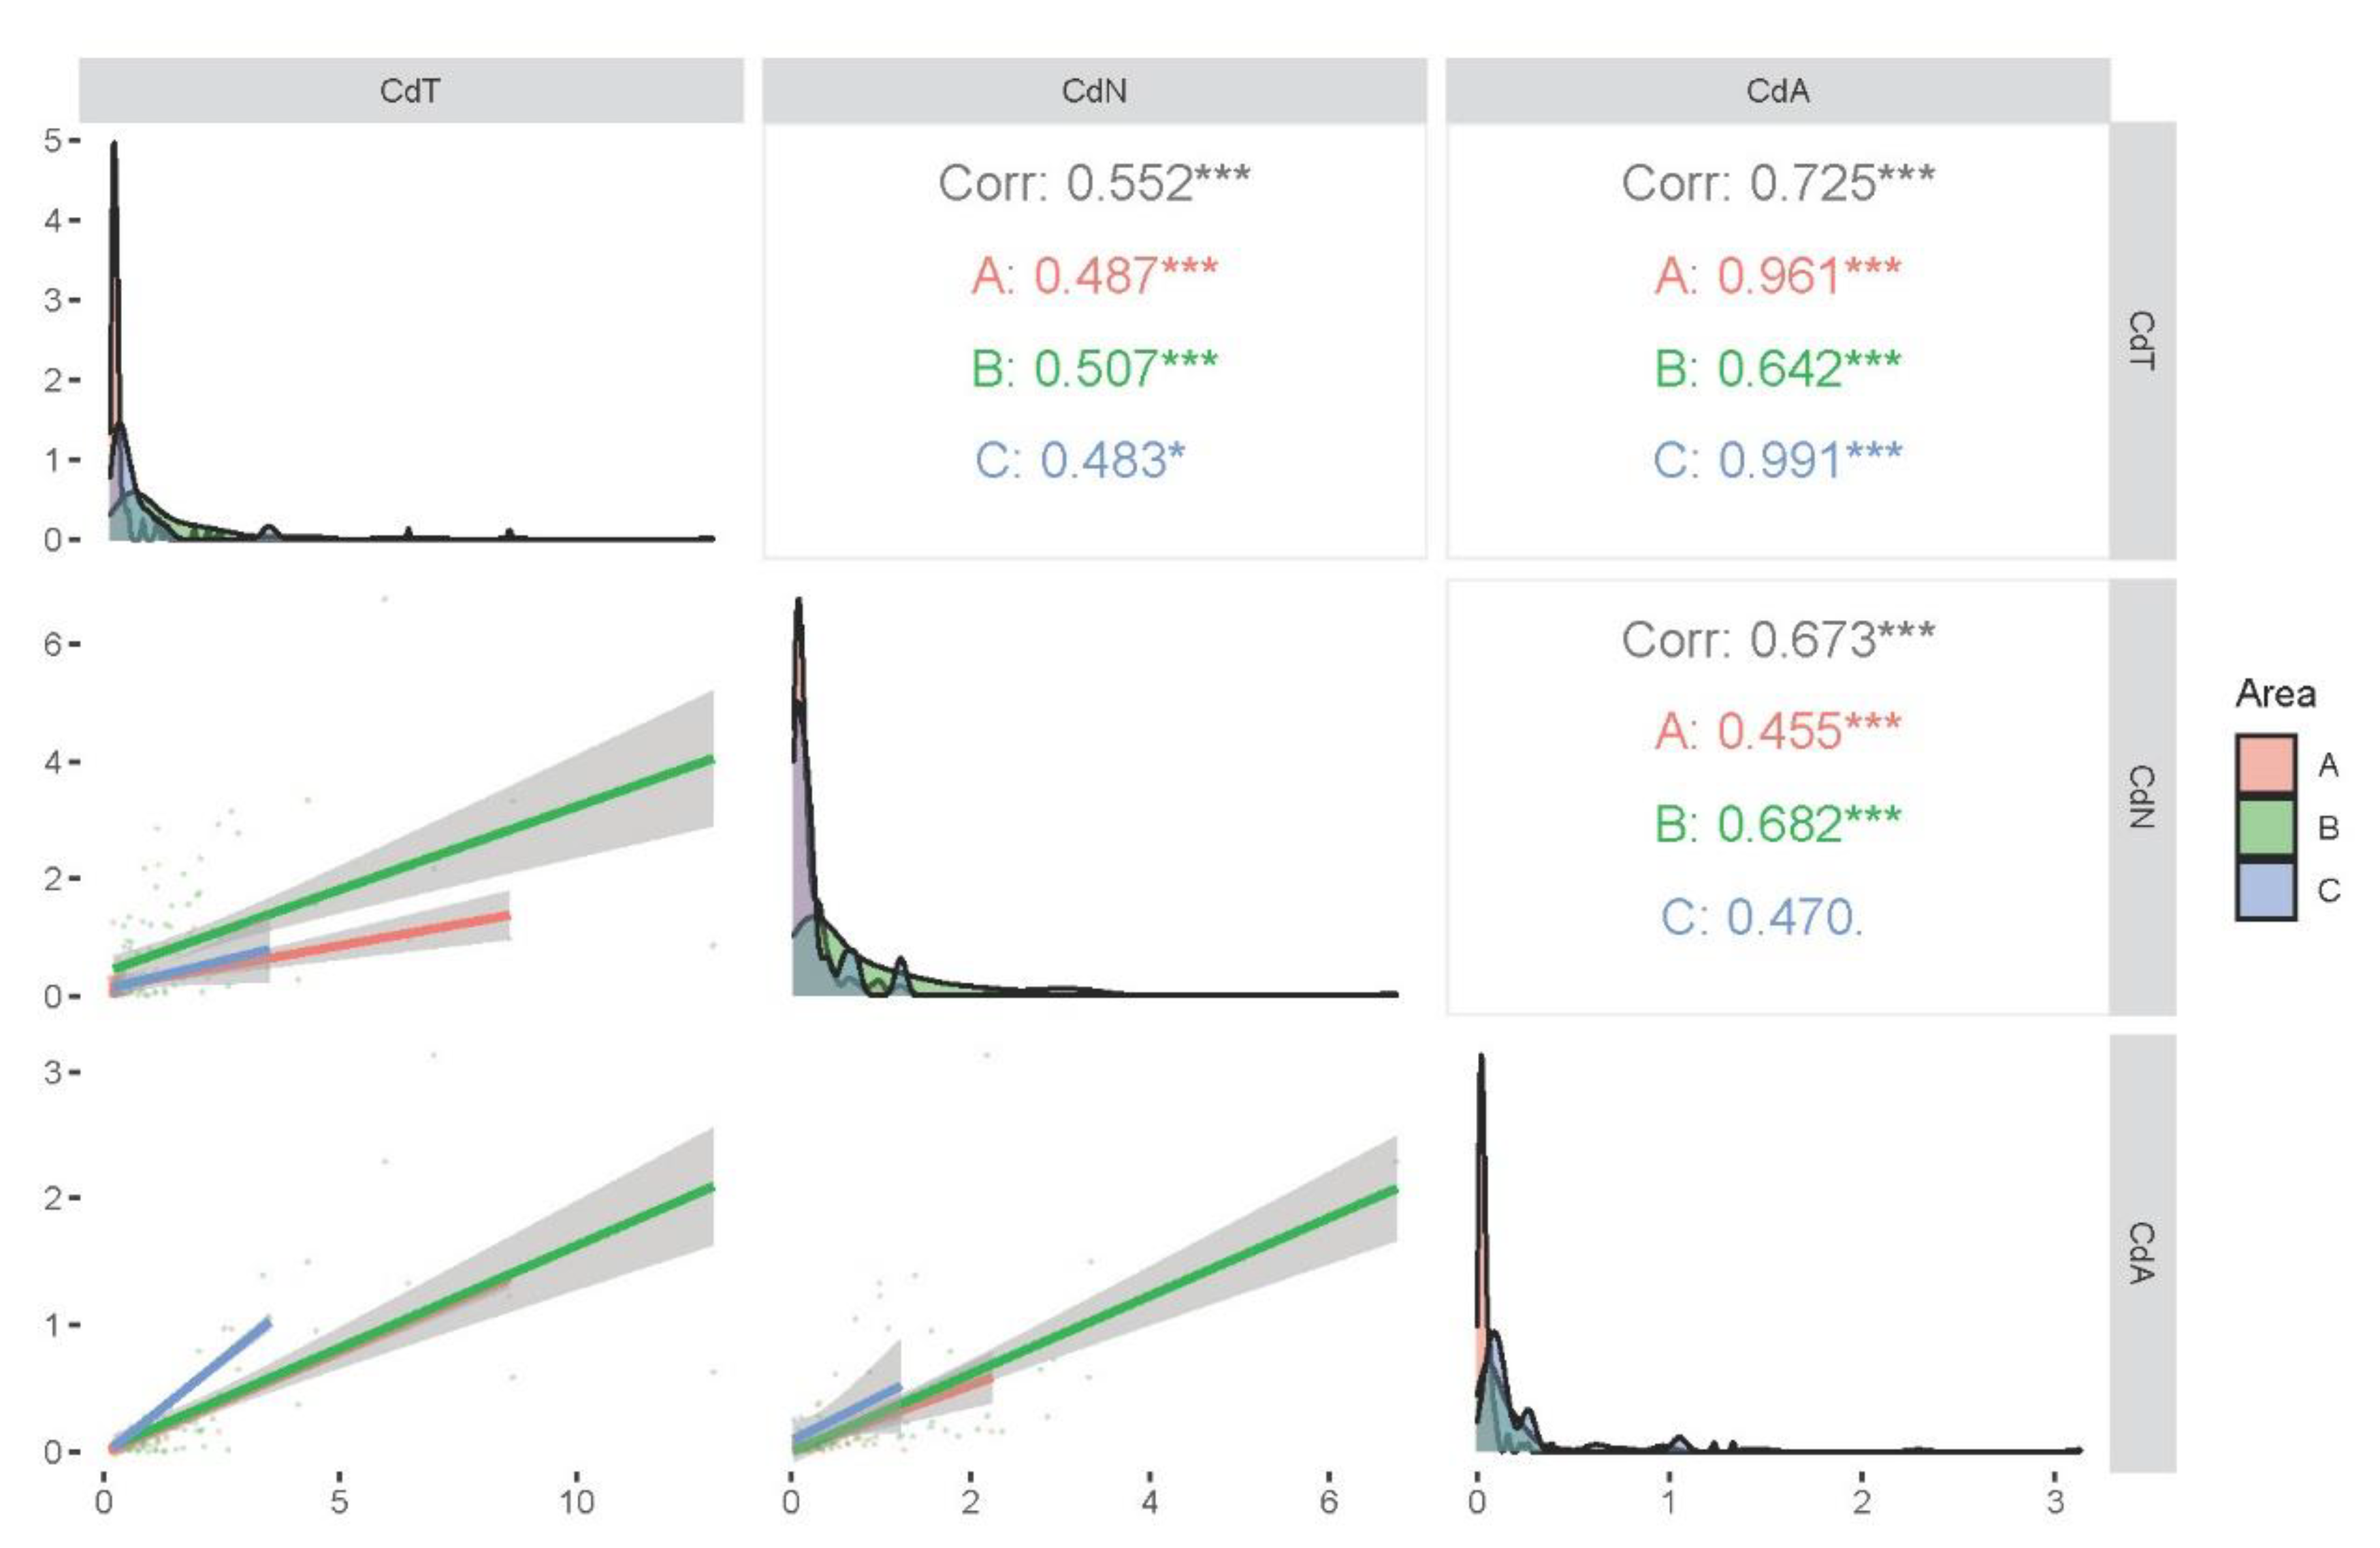
The averaged CdT and CdN collected from Site A was significantly higher than that collected from Sites B and C. The skewness and kurtosis coefficient of Cd content in all three sites were high, indicating that the data symmetry was unsatisfied (Table 1, Figure 2). Nevertheless, more extreme values than the mean were observed. In addition, the data transformed by Log were conducted by the approximate Shapiro–Wilk test.
3.2. Correlation Analysis of Cd Content in a Soil–Rice System
3.3. Identifying the Main Controls of Cd in Soil and Rice via Multivariate Statistical Analysis
Variance analysis was used to test the significant differences in CdN planted in soils with different soil textures, ST, and PmT in the study area. As listed in Table 2, significant differences were detected for soil and rice Cd contents in different ST and PmT (p < 0.05). Meanwhile, Cd was not significantly different in soil and rice samples collected from the soil with different soil textures (p > 0.05). The physical and chemical soil properties are largely dependent on soil types, thus soil types are closely related to the transfer of Cd in a soil–rice system. Meanwhile, the PmT represents the types of rocks the soil is derived from, which can also greatly affect the physical and chemical soil properties [40]. Therefore, the ST and PmT were listed as potential controls for CdN accumulation during further analysis.
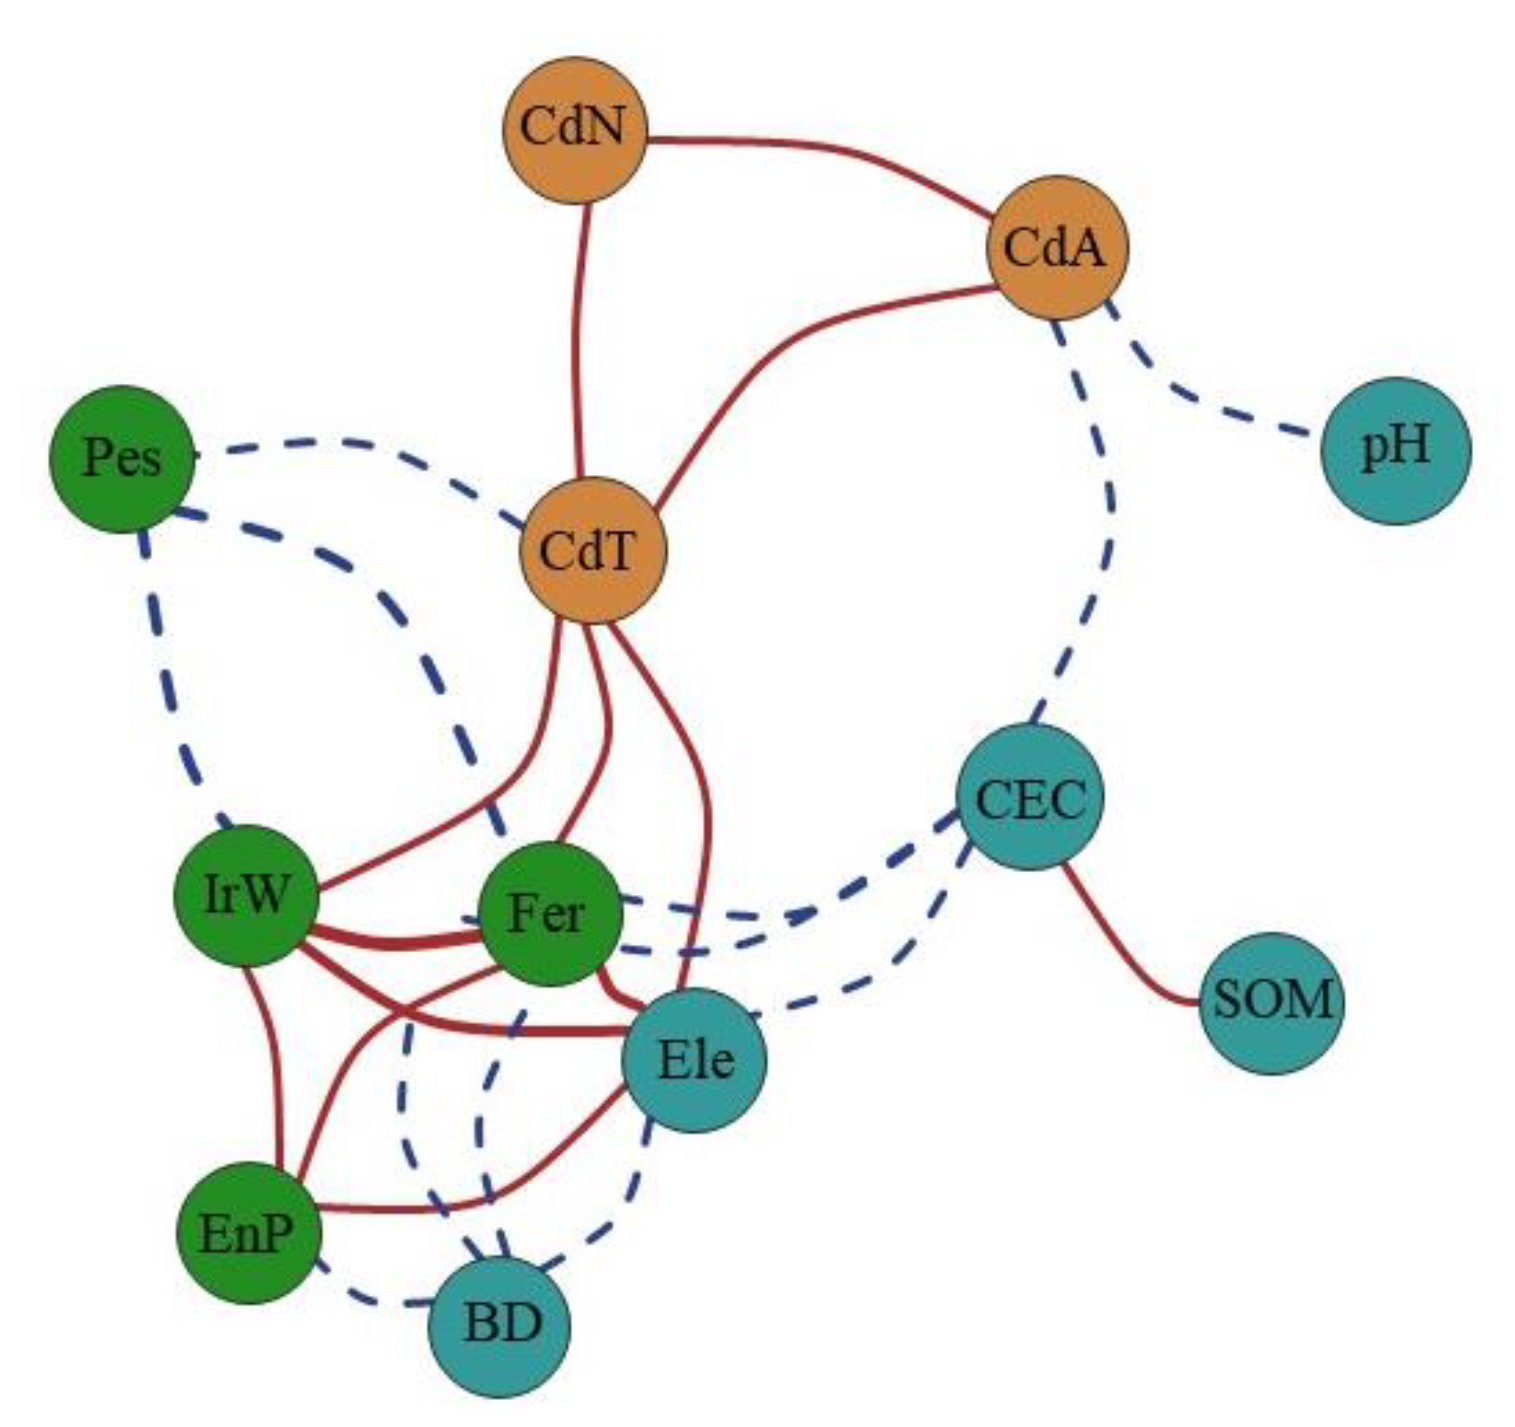
After selecting qualitative indicators (Table 3), quantitative variables were subsequently screened based on the correlation between independent (quantitative variables) and dependent variables (CdN). As shown in Figure 3, the lines represent the relationship between variables with a correlation coefficient greater than 0.5. While the solid line represents a positive correlation, the dashed line indicates a negative correlation. Our results also show that although the CdN only had a positive and direct relationship with CdT and CdA, CdT and CdA were closely related to other factors, such as Ele, Fer, Pes, IrW, pH, and CEC. Thus, these variables can indirectly affect the accumulation of CdN by affecting the accumulation of CdT and CdA. For example, pH is closely related to the Cd phytoavailability. As suggested by Zhao et al. [41], liming of acidic soils should be implemented to reduce Cd phytoavailability, especially in the areas with a high risk of Cd exceedance. In terms of CEC, high CEC could significantly slow down Cd uptake by rice from the soil [42], and the CEC can also allow the minerals in soil to absorb Cd ions from soil solutions through ion-exchange processes [43].
Furthermore, we constructed a multiple regression model to predict CdN using other variables. As observed, the R2 of the multiple regression model was 0.68, with a p value of 1.68 × 10−47. These results, therefore, represent that our model can explain most of the variances and make reliable predictions of CdN.
Fitted parameters for the multiple regression model are presented in Table 3. As listed in Table 3, the CdN showed a significant relationship with soil type, SOM, and the CdT, with a p value < 0.05 (Table 3). This finding revealed that soil type, SOM, and the CdT were potential dominators for CdN accumulation, consistent with previously reported results [1,44,45]. In addition, the SOM could supply organic chemicals that would enhance the availability of Cd to plants [1], thereby leading to more CdN accumulation. Additionally, Zeng et al. [45] observed that SOM affected the ability of soils to retain Cd in an exchangeable state. A previous study also reported that the contents of Cd absorbed in soil constituents declined with a decrease in SOM [46]. In contrast, since CdT is the major source of CdN, most CdN is absorbed from the soil it was planted in, which explains the strong relationship between CdN and CdT. Alternatively, the ST can indirectly affect CdT accumulation through other soil properties.
However, other factors, especially pH and CdA, showed no significant relationship with CdN. This result contradicts our expectations but is consistent with the results reported by Hu et al. [1] and Xie et al. [40]. However, the research organized by Xiao et al. [47], Liu et al. [48], and Zhang et al. [49] revealed that pH and CdA show a significant relationship with CdN. Thus, further surveys and studies are necessary to make this issue more clear in our future work.
3.4. Identifying Main Controls of Cd in Rice via Nonlinear PCA
In this study, strong collinearity was detected among the variables used. Using the multiple regression model, we identified ST, SOM, and CdT as potential controls of Cd in rice. However, we did not consider the collinearity of different variables in the multiple regression model, negatively affecting the model’s performance and feasibility. Therefore, to make up for this shortcoming, we used the nonlinear PCA to confirm the potential controls of CdN.
Four main components were extracted using logarithmic PCA (Table 4), which explains 80.14% of the total variance. The first principal component (PC1) was most loaded through elevation, EnP, IrW, and Fer (Table 5). However, the second principal component (PC2) mainly consisted of ST, PmT, and Pes. The third principal component (PC3) mainly included CdT and CdA. The fourth principal component (PC4) mainly included pH, SOM, CEC, and BD. Based on these results, we classified these four principal components under the following four factors: anthropogenic action (PC1), geology (PC2), Cd in soil (PC3), and soil property (PC4).
Subsequently, these four factors were inputted as an independent variable to predict Cd in rice using a stepwise regression method. After which, dominant controls of Cd in rice from different survey areas were identified on the basis of a 95% confidence double-tail test.
Our results reveal that the main controls of Cd in rice from Site A were Cd in soil and geology; the main controls of Cd in rice from Site B were Cd in soil and anthropogenic action, whereas the main controls of Cd in rice from Site C were Cd in soil and soil property. Thus, CdT was identified as the dominant factor affecting CdN from all three survey areas in this study, which also agreed with our expectations and numerous existing studies [50,51,52]. The geology is identified as another control of CdN from Site A. This may be attributed to the complex regional geological environment and high geological background value of Cd in Site A. Anthropogenic action was another control of CdN from Site B. Site B was located in a flood plain comprising important agricultural production bases’ industrial enterprises. Thus, extensive industrial and agricultural activities were expected in this region. A large quantity of fertilizer and pesticide was applied to the farmland, accompanied by the emission of a large amount of wastewater and solid waste, leading to Cd accumulation in the soil–rice system. Therefore, this soil property was confirmed as one of the two controls of CdN from Site C. Although mountainous regions and an underdeveloped economy dominated Site C, anthropogenic disturbances still have no negligible effects on the ecological environment. Nevertheless, natural factors dominated the CdN from Site C, including CdT and soil property.
3.5. Recommendations
Several strategies are recommended to reduce the Cd content in the soil–rice system, especially rice. Firstly, it is worth more effort to accurately identify the sources of Cd in the soil–rice system and then stop the further accumulation of Cd in the soil–rice system. Secondly, in areas with a high background value of Cd, the food crops should be avoided, and other crops such as flowers, landscape seeding, and cotton are recommended to be planted. Thirdly, phytoavailability of Cd, instead of the total concentration of Cd, is the focus of risk management regarding soil contamination with Cd. Thus, we should pay more attention to manipulating the Cd phytoavailability. Finally, in areas with a relatively high risk of Cd pollution, breeding rice cultivars with low accumulation is suggested, which is more readily acceptable for farmers.
4. Conclusions
In conclusion, our results reveal that the average total Cd content in soil samples collected from the study area was higher than the background value in Zhejiang Province. Although the mean concentration of Cd in rice was higher than the national regulation value, a significant difference was observed for Cd content in rice planted in soils with different STs and PmT. This study also observed that ST, SOM, and CdT were the most critical factors for predicting CdN using a multiple regression model. Our results detect specific controls of Cd in rice from different regions. As observed, natural and anthropogenic factors play different roles in heavy metal accumulation in the soil–rice ecosystem in various sites. CdT was the same main control of CdN in three areas. Creating specific measures to control and reduce heavy metals in different regions’ soil–rice ecosystem was highlighted, thereby enhancing further surveying in the other areas. Finally, we also provide specific suggestions for reducing the accumulation of Cd in the soil–rice system. Our study revealed the heterogeneous spatial dominators accounting for CdN accumulation and enhanced the necessity to conduct surveys on other areas to propose more specific and efficient measures for controlling heavy metal pollution, reducing related health risks posed to humans. The main findings of this study are also expected to enhance our knowledge of Cd accumulation in the soil–rice system, contributing to food safety and reducing the human health risk of consuming Cd-contaminated rice.
Supplementary Materials
The following supporting information can be downloaded at: https://0-www-mdpi-com.brum.beds.ac.uk/article/10.3390/land11050617/s1, Figure S1: (a) Boxplot of total Cd content in soil. (b) Boxplot of available Cd content in soil. (c) Boxplot of Cd content in rice.
Author Contributions
Conceptualization, B.H. and T.F.; methodology, T.F., Y.Z. and X.C.; software, T.F., Y.Z. and H.G.; formal analysis, T.F. and H.G.; resources, B.H. and H.L.; data curation, Y.Z., T.F. and X.C.; writing—original draft preparation, Y.Z., T.F. and X.C.; writing—review and editing, Y.Z. and X.C.; supervision, B.H. and H.L.; project administration, B.H.; funding acquisition, B.H. All authors have read and agreed to the published version of the manuscript.
Funding
This research is funded by the Key Research and Development Program of Zhejiang Province (2020C03011), the Open Foundation of Key Laboratory of Agricultural Remote Sensing and Information System of Zhejiang Province (No. ZJRS-2022001), and Ten-thousand Talents Plan of Zhejiang Province (2019R52004).
Institutional Review Board Statement
Not applicable.
Informed Consent Statement
Not applicable.
Data Availability Statement
Not applicable.
Acknowledgments
This work was financially supported by the Key Research and Development Program of Zhejiang Province (2020C03011), the Open Foundation of Key Laboratory of Agricultural Remote Sensing and Information System of Zhejiang Province (No. ZJRS-2022001), and Ten-thousand Talents Plan of Zhejiang Province (2019R52004).
Conflicts of Interest
The authors declare no conflict of interest.
References
- Hu, B.F.; Xue, J.; Zhou, Y.; Shao, S.; Fu, Z.; Li, Y.; Chen, S.C.; Lin, Q.; Shi, Z. Modelling bioaccumulation of heavy metals in soil-crop ecosystems and identifying its controlling factors using machine learning. Environ. Pollut. 2020, 262, 114308. [Google Scholar] [CrossRef] [PubMed]
- Jia, X.L.; Fu, T.T.; Hu, B.F.; Shi, Z.; Zhou, L.Q.; Zhu, Y.W. Identification of the potential risk areas for soil heavy metal pollution based on the source-sink theory. J. Hazard. Mater. 2020, 393, 122424. [Google Scholar] [CrossRef] [PubMed]
- Liu, J.; Liu, R.Z.; Yang, Z.F.; Kuikka, S. Quantifying and predicting ecological and human health risks for binary heavy metal pollution accidents at the watershed scale using Bayesian Networks. Environ. Pollut. 2021, 269, 116125. [Google Scholar] [CrossRef] [PubMed]
- Ogundele, L.T.; Oluwajana, O.A.; Ogunyele, A.C.; Inuyomi, S.O. Heavy metals, radionuclides activity and mineralogy of soil samples from an artisanal gold mining site in Ile-Ife, Nigeria: Implications on human and environmental health. Environ. Earth Sci. 2021, 80, 202. [Google Scholar] [CrossRef]
- Sanaei, F.; Amin, M.M.; Alavijeh, Z.P.; Esfahani, R.A.; Sadeghi, M.; Bandarrig, N.S.; Fatehizadeh, A.; Taheri, E.; Rezakazemi, M. Health risk assessment of potentially toxic elements intake via food crops consumption: Monte Carlo simulation-based probabilistic and heavy metal pollution index. Environ. Sci. Pollut. Res. 2021, 28, 1479–1490. [Google Scholar] [CrossRef]
- Sellami, S.; Zeghouan, O.; Dhahri, F.; Mechi, L.; Moussaoui, Y.; Kebabi, B. Assessment of heavy metal pollution in urban and peri-urban soil of Setif city (High Plains, eastern Algeria). Environ. Monit. Assess. 2022, 194, 1–17. [Google Scholar] [CrossRef]
- Chen, H.R.; Wang, L.; Hu, B.F.; Xu, J.M.; Liu, X.M. Potential driving forces and probabilistic health risks of heavy metal accumulation in the soils from an e-waste area, southeast China. Chemosphere 2022, 289, 133182. [Google Scholar] [CrossRef]
- De Silva, S.; Ball, A.S.; Indrapala, D.V.; Reichman, S.M. Review of the interactions between vehicular emitted potentially toxic elements, roadside soils, and associated biota. Chemosphere 2021, 263, 128135. [Google Scholar] [CrossRef]
- Hu, B.F.; Shao, S.; Ni, H.; Fu, Z.Y.; Hu, L.S.; Zhou, Y.; Min, X.X.; She, S.F.; Chen, S.C.; Huang, M.X.; et al. Current status, spatial features, health risks, and potential driving factors of soil heavy metal pollution in China at province level. Environ. Pollut. 2020, 266, 114961. [Google Scholar] [CrossRef]
- Xia, F.; Zhu, Y.W.; Hu, B.F.; Chen, X.Y.; Li, H.Y.; Shi, K.J.; Xu, L.C. Pollution Characteristics, Spatial Patterns, and Sources of Toxic Elements in Soils from a Typical Industrial City of Eastern China. Land 2021, 10, 1126. [Google Scholar] [CrossRef]
- Tang, M.; Lu, G.; Fan, B.; Xiang, W.; Bao, Z. Bioaccumulation and risk assessment of heavy metals in soil-crop systems in Liujiang karst area, Southwestern China. Environ. Sci. Pollut. Res. 2021, 28, 9657–9669. [Google Scholar] [CrossRef] [PubMed]
- Dudka, S.; Piotrowska, M.; Terelak, H. Transfer of cadmium, lead, and zinc from industrially contaminated soil to crop plants: A field study. Environ. Pollut. 1996, 94, 181–188. [Google Scholar] [CrossRef]
- Chen, B.Y.; Wang, H.J.; Cao, T.H.; Liang, X.H.; Yang, J.; Ren, J. Spatio-temporal characteristics of heavy metal accumulation in soil-rice cropping systems under different phosphate fertilizer concentrations. J. Agro Environ. Sci. 2010, 29, 2274–2280. (In Chinese) [Google Scholar]
- Ministry of Ecology and Environment of the People’s Republic of China. China Soil Pollution Survey Communique; MEEPRC: Beijing, China, 2014. (In Chinese)
- DalCorso, G.; Farinati, S.; Maistri, S.; Furini, A. How plants cope with cadmium: Staking all on metabolism and gene expression. J. Integr. Plant. Biol. 2008, 50, 1268–1280. [Google Scholar] [CrossRef]
- Qian, Y.Z.; Chen, C.; Zhang, Q.; Li, Y.; Chen, Z.J.; Li, M. Concentrations of cadmium, lead, mercury and arsenic in Chinese market milled rice and associated population health risk. Food Control 2010, 21, 1757–1763. [Google Scholar] [CrossRef]
- Ronzan, M.; Piacentini, D.; Fattorini, L.; Della Rovere, F.; Eiche, E.; Riemann, M.; Falasca, G. Cadmium and arsenic affect root development in Oryza sativa L. negatively interacting with auxin. Environ. Exp. Bot. 2018, 151, 64–75. [Google Scholar] [CrossRef]
- Giri, S.; Singh, A.K. Human health risk assessment due to dietary intake of heavy metals through rice in the mining areas of Singhbhum Copper Belt, India. Environ. Sci. Pollut. Res. 2017, 24, 14945–14956. [Google Scholar] [CrossRef]
- Sawut, R.; Kasim, N.; Maihemuti, B.; Hu, L.; Abliz, A.; Abdujappar, A.; Kurban, M. Pollution characteristics and health risk assessment of heavy metals in the vegetable bases of northwest China. Sci. Total Environ. 2018, 642, 864–878. [Google Scholar] [CrossRef]
- Tokatli, C.; Ustaoğlu, F. Health risk assessment of toxicants in Meriç river delta wetland, thrace region, Turkey. Environ. Earth Sci. 2020, 79, 426. [Google Scholar] [CrossRef]
- Hu, B.F.; Jia, X.L.; Hu, J.; Xu, D.; Xia, F.; Li, Y. Assessment of heavy metal pollution and health risks in the soil-plant-human system in the Yangtze River Delta, China. Int. J. Environ. Res. Public Health 2017, 14, 1042. [Google Scholar] [CrossRef] [Green Version]
- Jahromi, M.A.; Jamshidi-Zanjani, A.; Darban, A.K. Heavy metal pollution and human health risk assessment for exposure to surface soil of mining area: A comprehensive study. Environ. Earth Sci. 2020, 79, 1–18. [Google Scholar]
- Ugulu, I.; Ahmad, K.; Khan, Z.I.; Munir, M.; Wajid, K.; Bashir, H. Effects of organic and chemical fertilizers on the growth, heavy metal/metalloid accumulation, and human health risk of wheat (Triticum aestivum L.). Environ. Sci. Pollut. R 2021, 28, 12533–12545. [Google Scholar] [CrossRef] [PubMed]
- Yu, B.B.; Yan, X.L.; Liao, X.Y.; Lin, L.Y. Screening of Chemical Extracting Agents for Characterizing Soil Bio-effective Arsenic on Panax Notoginseng. J. Agro. Environ. Sci. 2011, 30, 1573–1579. [Google Scholar]
- Yan, S.H.; Wu, C.F.; Hu, Y.B.; Li, Z.X.; Lu, Q.S.; Chen, S.; Yang, Q.J. Optimization of CaCl2 extraction of abvailable Cadmium in Typical Soils. Chinese. Agric. Sci. Bull. 2013, 29, 99–104. [Google Scholar]
- Deng, M.H.; Malik, A.; Zhang, Q.; Sadeghpour, A.; Zhu, Y.W.; Li, Q.R. Improving Cd risk managements of rice cropping system by integrating source-soil-rice-human chain for a typical intensive industrial and agricultural region. J. Clean. Prod. 2021, 313, 127883. [Google Scholar] [CrossRef]
- Liu, X.; Yu, T.; Yang, Z.F.; Hou, Q.Y.; Yang, Q.; Li, C.; Ji, W.B.; Li, B.; Duan, Y.R.; Zhang, Q.Z.; et al. Transfer mechanism and bioaccumulation risk of potentially toxic elements in soil–rice systems comparing different soil parent materials. Ecotox. Environ. Saf. 2021, 216, 112214. [Google Scholar] [CrossRef]
- Wiggenhauser, M.; Aucour, A.M.; Bureau, S.; Campillo, S.; Telouk, P.; Romani, M.; Ma, F.Q.; Landrot, G.; Sarret, G. Cadmium transfer in contaminated soil-rice systems: Insights from solid-state speciation analysis and stable isotope fractionation. Environ. Pollut. 2021, 269, 115934. [Google Scholar] [CrossRef]
- Hu, B.F.; Shao, S.; Ni, H.; Fu, Z.Y.; Huang, M.X.; Chen, Q.X.; Shi, Z. Assessment of potentially toxic element pollution in soils and related health risks in 271 cities across China. Environ. Pollut. 2021, 270, 116196. [Google Scholar] [CrossRef]
- Wang, Q.H.; Dong, Y.X.; Zhou, G.H.; Zheng, W. Soil geochemical baseline and environmental background values of agricultural regions in Zhejiang province. J. Ecol. Rural Environ. 2007, 2, 81–88. (In Chinese) [Google Scholar]
- Liu, Y.Z.; Xiao, T.F.; Xiong, Y.; Ning, Z.P.; Shuang, Y.; Li, H.; Ma, L.; Chen, H.Y. Accumulation of heavy metals in agricultural soils and crops from an area with a high geochemical background of Cadmium, Southwestern China. Environ. Sci. 2019, 40, 2877–2884. (In Chinese) [Google Scholar]
- Zhao, W.F.; Song, Y.X.; Guan, D.X.; Ma, Q.; Guo, C.; Wen, Y.B.; Ji, J.F. Pollution status and bioavailability of heavy metals in soils of a typical black shale area. J. Agro Environ. Sci. 2018, 37, 1332–1341. (In Chinese) [Google Scholar]
- Dai, L.; Wang, L.; Liang, T.; Zhang, Y.Y.; Li, J.; Xiao, J.; Dong, L.L.; Zhang, H.D. Geostatistical analyses and co-occurrence correlations of heavy metals distribution with various types of land use within a watershed in eastern QingHai-Tibet Plateau, China. Sci. Total Environ. 2019, 653, 849–859. [Google Scholar] [CrossRef] [PubMed]
- Ye, M.Q.; Yang, Y.J. Erroneous zone identification and improvement of synthesis evaluation based on principal component analysis. J. Quant. Tech. Econ. 2016, 10, 142–153. (In Chinese) [Google Scholar]
- Hu, B.F.; Zhou, Y.; Jiang, Y.F.; Ji, W.J.; Fu, Z.Y.; Shao, S.; Li, S.; Huang, M.X.; Zhou, L.Q.; Shi, Z. Spatio-temporal variation and source changes of potentially toxic elements in soil on a typical plain of the Yangtze River Delta, China (2002–2012). J. Environ. Manag. 2020, 271, 110943. [Google Scholar] [CrossRef] [PubMed]
- Hu, B.F.; Shao, S.; Fu, Z.Y.; Li, Y.; Ni, H.; Chen, S.C.; Zhou, Y.; Jin, B.; Shi, Z. Identifying heavy metal pollution hot spots in soil-rice systems: A case study in South of Yangtze River Delta, China. Sci. Total. Environ. 2019, 658, 614–625. [Google Scholar] [CrossRef] [PubMed]
- Brun, L.A.; Maillet, J.; Richarte, J.; Herrmann, P.; Remy, J.C. Relationships between extractable copper, soil properties and copper uptake by wild plants in vineyard soils. Environ. Pollut. 1998, 102, 151–161. [Google Scholar] [CrossRef]
- McLaughlin, M.J.; Zarcinas, B.A.; Stevens, D.P.; Cook, N. Soil testing for heavy metals. Commun. Soil. Sci. Plant Anal. 2000, 31, 1661–1700. [Google Scholar] [CrossRef]
- Zhang, J.; Wen, Y.L.; Wang, Y.; Chen, S.Z.; Yang, K.M.; Zhang, X.C.; Liao, Y.Q. Correlation analysis of the heavy metal contents and the effective contents in the combination of planting and breeding recycling mode. J. Southwest Univ. Natl. 2010, 36, 970–974. (In Chinese) [Google Scholar]
- Xie, M.D.; Li, H.Y.; Zhu, Y.W.; Xue, J.; You, Q.H.; Jin, B.; Shi, Z. Predicting bioaccumulation of potentially toxic element in soil-rice systems using multi-source data and machine learning methods: A case study of an industrial city in southeast China. Land 2021, 10, 558. [Google Scholar] [CrossRef]
- Zhao, F.J.; Ma, Y.; Zhu, Y.G.; Tang, Z.; McGrath, S.P. Soil contamination in China: Current status and mitigation strategies. Environ. Sci. Technol. 2014, 49, 750–759. [Google Scholar] [CrossRef]
- Gupta, S.; Nayek, S.; Saha, R.N.; Satpati, S. Assessment of heavy metal accumulation in macrophyte, agricultural soil, and crop plants adjacent to discharge zone of sponge iron factory. Environ. Earth Sci. 2008, 55, 731–739. [Google Scholar] [CrossRef]
- Shen, X.Y.; Chen, S.G.; Wang, Y.; Wang, Y.M.; Cai, W.X. Study on different clays as adsorbents in heavy metals-containing waste water treatment. Environ. Pollut. Control 1998, 20, 15–18. [Google Scholar]
- Singh, R.; Gautam, N.; Mishra, A.; Gupta, R. Heavy metals and living systems: An overview. Indian. J. Pharmacol. 2011, 43, 246. [Google Scholar] [CrossRef] [Green Version]
- Zeng, F.R.; Ali, S.; Zhang, H.T.; Ouyang, Y.N.; Qiu, B.Y.; Wu, F.B.; Zhang, G.P. The influence of pH and organic matter content in paddy soil on heavy metal availability and their uptake by rice plants. Environ. Pollut. 2011, 159, 84–91. [Google Scholar] [CrossRef]
- Antoniadis, V.; Robinson, J.S.; Alloway, B.J. Effects of short-term pH fluctuations on cadmium, nickel, lead, and zinc availability to ryegrass in a sewage sludge-amended field. Chemosphere 2008, 71, 759–764. [Google Scholar] [CrossRef] [PubMed]
- Xiao, L.; Guan, D.S.; Peart, M.R.; Chen, Y.J.; Li, Q.Q.; Dai, J. The influence of bioavailable heavy metals and microbial parameters of soil on the metal accumulation in rice grain. Chemosphere 2017, 185, 868–878. [Google Scholar] [CrossRef]
- Liu, C.S.; Chang, C.Y.; Fei, Y.H.; Li, F.B.; Wang, Q.; Zhai, G.S.; Lei, J. Cadmium accumulation in edible flowering cabbages in the Pearl River Delta, China: Critical soil factors and enrichment models. Environ. Pollut. 2018, 233, 880–888. [Google Scholar] [CrossRef]
- Zhang, J.R.; Li, H.Z.; Zhou, Y.Z.; Dou, L.; Cai, L.M.; Mo, L.P.; You, J. Bioavailability and soil-to-crop transfer of heavy metals in farmland soils: A case study in the Pearl River Delta, South China. Environ. Pollut. 2018, 235, 710–719. [Google Scholar] [CrossRef]
- Wang, L.; Yang, D.; Li, Z.; Fu, Y.; Liu, X.; Brookes, P.C.; Xu, J. A comprehensive mitigation strategy for heavy metal contamination of farmland around mining areas—Screening of low accumulated cultivars, soil remediation and risk assessment. Environ. Pollut. 2019, 245, 820–828. [Google Scholar] [CrossRef]
- Zhang, F.; Wang, S.L.; Nan, Z.R.; Ma, J.M.; Zhang, Q.; Chen, Y.Z.; Li, Y.P. Accumulation, spatio-temporal distribution, and risk assessment of heavy metals in the soil-corn system around a polymetallic mining area from the Loess Plateau, northwest China. Geoderma 2017, 305, 188–196. [Google Scholar] [CrossRef]
- Mao, C.P.; Song, Y.X.; Chen, L.X.; Ji, J.F.; Li, J.Z.; Yuan, X.Y.; Yang, Z.F.; Godwin, A.A.; Ray, L.F.; Frederick, T. Human health risks of heavy metals in paddy rice-based on transfer characteristics of heavy metals from soil to rice. Catena 2019, 175, 339–348. [Google Scholar] [CrossRef]
Figure 1.
A map showing the study areas (A, B, and C means three different rice-growing areas where the sampling work was conducted).
Figure 1.
A map showing the study areas (A, B, and C means three different rice-growing areas where the sampling work was conducted).

Figure 2.
Correlation between Cd content in a soil–rice system (significance codes, ***: p < 0.001, *: p ≤ 0.05).
Figure 2.
Correlation between Cd content in a soil–rice system (significance codes, ***: p < 0.001, *: p ≤ 0.05).

Figure 3.
A co-occurrence network showing quantitative factors (note: CdT means total content of Cd in the soil, CdN means the content of Cd in rice, CdA means available Cd in soil, pH means soil pH, SOM means soil organic matter, CEC means soil cation exchange capacity, Ele means elevation, BD means bulk density, EnP means the density of enterprise, IrW means irrigation water, Pes means the amount of pesticide applied, and Fer means the amount of fertilizer applied).


Table 1.
Descriptive statistics of Cd content in soil and rice.
| Variables | Site | n | Mean mg kg−1 | Min mg kg−1 | Max mg kg−1 | SD mg kg−1 | CV % | Skewness | Kurtosis | Approximate Shapiro–Wilk |
|---|---|---|---|---|---|---|---|---|---|---|
| CdT | A | 94 | 1.50 | 0.21 | 12.90 | 1.86 | 124 | 3.65 | 17.02 | Non-normal |
| B | 106 | 0.49 | 0.13 | 8.59 | 1.06 | 218 | 6.17 | 41.49 | Normal | |
| C | 17 | 0.68 | 0.21 | 3.50 | 0.79 | 121 | 3.21 | 11.22 | Normal | |
| CdA | A | 94 | 0.26 | 0.00 | 3.13 | 0.47 | 181 | 3.94 | 18.65 | Non-normal |
| B | 106 | 0.07 | 0.00 | 1.33 | 0.18 | 257 | 6.34 | 41.88 | Normal | |
| C | 17 | 0.18 | 0.02 | 1.05 | 0.24 | 140 | 3.46 | 12.84 | Normal | |
| CdN | A | 94 | 0.83 | 0.03 | 6.76 | 1.03 | 123 | 2.74 | 11.02 | Non-normal |
| B | 106 | 0.22 | 0.02 | 2.24 | 0.31 | 142 | 3.66 | 17.50 | Normal | |
| C | 17 | 0.25 | 0.02 | 1.22 | 0.32 | 120 | 2.08 | 4.44 | Normal |
Note: SD means standard deviation and CV refers to the coefficient of variation (%). Significance level of Approximate Shapiro–Wilk test is 0.05.
Table 2.
ANOVA analysis for testing the significance and effects of three qualitative variables on the variance of cadmium in rice.
Table 2.
ANOVA analysis for testing the significance and effects of three qualitative variables on the variance of cadmium in rice.
| Qualitative Variable | Soil Texture | Soil Type | Soil Parent Material | |||
|---|---|---|---|---|---|---|
| Soil Cd | Rice Cd | Soil Cd | Rice Cd | Soil Cd | Rice Cd | |
| P | 0.931 | 0.968 | 0.007 | 0.000 | 0.067 | 0.004 |
Note: Significance level: 0.05.
Table 3.
Parameters accounting for the multiple regression model.
| Coefficients | Standard Error | t Stat | p Value | |
|---|---|---|---|---|
| Intercept | 2.771 | 2.153 | 1.287 | 0.199 |
| ST | 0.512 | 0.086 | 5.955 | 0.000 |
| log10 (SOM) | −0.721 | 0.239 | −3.013 | 0.003 |
| log10 (CdT) | 0.378 | 0.205 | 1.839 | 0.047 |
| PmT | −0.159 | 0.086 | −1.858 | 0.065 |
| Ele | 0.001 | 0.001 | 1.621 | 0.107 |
| OuI | −0.787 | 0.646 | −1.219 | 0.224 |
| log10 (CEC) | 0.275 | 0.299 | 0.920 | 0.359 |
| pH | −0.054 | 0.117 | −0.460 | 0.646 |
| log10 (CdA) | 0.083 | 0.191 | 0.434 | 0.665 |
| log10 (BD) | 0.990 | 4.374 | 0.226 | 0.821 |
| EnP | −0.010 | 0.068 | −0.146 | 0.884 |
Note: ST means soil type, SOM means soil organic matter, CdT means total soil Cd, PmT means parent material type, Ele means Elevation, OuI means outside input (pesticide, fertilizer, and irrigation water), CEC means cation exchange capacity, pH means soil pH, CdA means available soil Cd, BD means bulk density, and EnP means enterprise.
Table 4.
Eigenvalue and variance contribution rates obtained from nonlinear principal component analysis.
Table 4.
Eigenvalue and variance contribution rates obtained from nonlinear principal component analysis.
| PC | Eigenvalue | Variance % | Cumulative Contribution Rate% |
|---|---|---|---|
| 1 | 4.426 | 34.049 | 34.049 |
| 2 | 2.713 | 20.870 | 54.919 |
| 3 | 2.130 | 16.381 | 71.300 |
| 4 | 1.150 | 8.844 | 80.144 |
Table 5.
A rotation matrix table showing nonlinear principal component analysis results.
| Factor Load after Rotation | ||||
|---|---|---|---|---|
| PC1 | PC2 | PC3 | PC4 | |
| Zscore (CdT) | 0.117 | 0.211 | 0.322 | 0.214 |
| Zscore (pH) | −0.037 | −0.003 | 0.008 | 0.347 |
| Zscore (CdA) | 0.119 | 0.244 | −0.408 | −0.004 |
| Zscore (SOM) | −0.118 | 0.067 | −0.057 | 0.546 |
| Zscore (CEC) | −0.159 | 0.105 | 0.093 | 0.400 |
| Zscore (Ele) | 0.162 | −0.164 | −0.180 | 0.177 |
| Zscore (BD) | −0.130 | 0.143 | 0.154 | −0.360 |
| Zscore (EnP) | 0.163 | −0.106 | −0.030 | 0.283 |
| Zscore (IrW) | 0.189 | −0.053 | 0.226 | −0.003 |
| Zscore (Pes) | −0.034 | −0.102 | −0.093 | 0.055 |
| Zscore (Fer) | 0.190 | −0.056 | 0.220 | −0.002 |
| Zscore (ST) | 0.099 | 0.294 | −0.046 | −0.036 |
| Zscore (PmT) | 0.070 | 0.296 | −0.143 | 0.015 |
Publisher’s Note: MDPI stays neutral with regard to jurisdictional claims in published maps and institutional affiliations. |
© 2022 by the authors. Licensee MDPI, Basel, Switzerland. This article is an open access article distributed under the terms and conditions of the Creative Commons Attribution (CC BY) license (https://creativecommons.org/licenses/by/4.0/).
Share and Cite
MDPI and ACS Style
Zhang, Y.; Fu, T.; Chen, X.; Guo, H.; Li, H.; Hu, B. Modeling Cadmium Contents in a Soil–Rice System and Identifying Potential Controls. Land 2022, 11, 617. https://0-doi-org.brum.beds.ac.uk/10.3390/land11050617
AMA Style
Zhang Y, Fu T, Chen X, Guo H, Li H, Hu B. Modeling Cadmium Contents in a Soil–Rice System and Identifying Potential Controls. Land. 2022; 11(5):617. https://0-doi-org.brum.beds.ac.uk/10.3390/land11050617
Chicago/Turabian StyleZhang, Yingfan, Tingting Fu, Xueyao Chen, Hancheng Guo, Hongyi Li, and Bifeng Hu. 2022. "Modeling Cadmium Contents in a Soil–Rice System and Identifying Potential Controls" Land 11, no. 5: 617. https://0-doi-org.brum.beds.ac.uk/10.3390/land11050617
Note that from the first issue of 2016, this journal uses article numbers instead of page numbers. See further details here.