
Suitability Prediction and Enhancement of Future Water Supply Systems in Barwon Region in Victoria, Australia


School of Architecture and Urban Design, Royal Melbourne Institute of Technology (RMIT), Building 100, Victoria St, Carlton, VIC 3000, Australia
*
Author to whom correspondence should be addressed.
Land 2022, 11(5), 621; https://0-doi-org.brum.beds.ac.uk/10.3390/land11050621
Submission received: 31 March 2022
/
Revised: 21 April 2022
/
Accepted: 22 April 2022
/
Published: 23 April 2022
(This article belongs to the Topic Climate Change and Environmental Sustainability)
Abstract
:Intensive agricultural production accompanied by the climate change impacts in post-Colonial rural landscapes have continuously increased the demand for water resources and coastal areas, showing an unprecedented water supply crisis. By taking extreme weather conditions and rainfall events for future trends, a resilient water storage facility for the landscape requires the collaborative approach of natural systems and simulation modelling techniques to develop sustainable future scenarios. In this study, an ecological suitability model is used to identify potential sites for the construction of multi-purpose dams. As part of the model structure, multi factors are classified using the patterns of changing landscapes, and then weighted overlay analysis is conducted on a Geographic Information System (GIS) platform. Compared to previous studies, this paper derives its principal impact parameters and projections based on historical land cover information. The suitability maps that are generated visually guide the geographical location of the multi-purpose dams and indicate the areas from highly suitable to least suitable, clarifying the possibility of building blue infrastructure alongside the waterways in west-central Barwon. The workflow proposes a resilient water system based on existing land characteristics and measures that future water storage capacity will be a valid increase of approximately 1.5 times. This strategy alleviates water scarcity during the dry season to benefit traditional agricultural activities. Digital calculations are utilized to demonstrate the feasibility of the experimental results, providing a methodology for regulating the distribution and supply of river flows throughout the year while retaining runoff in a hierarchical pattern at precipitation periods.
1. Introduction
Contemporary research shows that intensive production-led models of environmental exploitation are leading to global climate anomalies, ecosystem degradation, and biodiversity loss [1]. Meanwhile, the world population is expected to increase from 7.7 billion to 9.7 billion by 2050 [2]. Rapid population growth and its potential impact on the surrounding areas have become a geological phenomenon as far as the functioning of natural systems is concerned. Their combined forces mark the planet’s transformation towards a new epoch, the Anthropocene, driven essentially by human behaviors and inducing global changes that will, in turn, push the context of the times facing wider society from resource acquisition and material exploitation to ecological constraints and conservation issues [3,4,5].
Since the Industrial Revolution, large-scale material production has caused dramatic changes in ecological networks’ structure and functional capacity. It threatened the stability and values they provide, which can be traced back to 1836 when colonists began ‘settlement’ and land clearance, with livestock and plantations breaking up the traditional low-disturbance land management patterns by Aboriginal Australians [6,7]. In addition, climate change associated with the dominance of the Anthropocene will be a factor that cannot be ignored in transforming ecological service functions [8,9]. Continued climate change is expected to put extreme pressure on water supplies in arid and semi-arid areas and to negatively affect water quality. Increased risks to flora and fauna, as well as to the occurrence of extreme events, will be reflected through freshwater storage and the transfer of energy from biomes and will impair their ecological significance [10,11].
Estuaries and coastal areas have long been overexploited as focal points for human settlement and marine resource use and have led to the destruction of natural habitats and the transformation of ecological suitability. In addition, urban regeneration has not only increased their degradation but also undermined their structural resilience and the resource values they provide [12,13]. Given the importance of this transitional system between terrestrial and marine environments for people and organisms, they have become the focus of efforts to develop strategies based on environmental management and long-term restoration [12,14,15,16]. In Australia, 85 percent of the population lives within 50 km of the coastline [16]. Therefore, the dynamics between coastal land and ecology are highly relevant to the human habitat. The Wadawurrung and Gadubanud people settled along the southern coast of Victoria between 40,000 and 60,000 years ago and are the traditional owners of this land. Indigenous people used sustainable methods of growing crops near their shelters to ensure that they would not create an ecological burden, and they modified basalt to construct waterways and weirs as a water management system to obtain subsistence supplies [6,17]. However, the tendency towards dense coastal migration, intensive land clearing and agriculture and climatic anomalies after the 1970s has affected the distribution of water resources in the region. Rainfall in Victoria has declined in most seasons in recent decades, and temperatures in Victoria rose by more than 1 degree Celsius between 1910 and 2018 [18,19]. Environmental change and the rapid population growth accompanying urbanization have led to a shortage of water supplies as a potential threat to intensive local agricultural activities [20,21,22].
Most previous studies have evaluated ecological risk from the perspective of a single element or specific evolutionary process, which is often isolated as an expected outcome of a project, rather than providing ecological risk mitigation and early warning in the context of broader environmental functions. Because of its multi-risk components, multi-stakeholders, and complex interaction mechanisms, the quantification and characterization of integrated factors are key to ecological risk assessment [23,24].
This study builds on the conventional use of gridded sample cells to calculate an ecological risk index for the landscape, taking into account changes in historical land-use patterns and drivers of ecological degradation [12,14,25] to assess areas of ecological vulnerability in the Barwon region of Australia. The overall objective is to anticipate and mitigate the environmental challenges coming to the region in the next stages from a temporal change perspective. A weighted overlay approach was used to identify areas of reasonable presence for future water supply infrastructure and to calculate the volumes that could be provided to cope with the collateral effects of ongoing climate change. The ecological infrastructure selected through the analysis has the capacity to balance the contradictions in water supply within the year and to make adequate utilization of the potential blue infrastructure to serve the increasing local water demand due to production specificities and population migration. The strategy for landscape risk prediction and enhancement improves the previous single-factor analysis of the target zones, so the new approach is equally applicable to other coastal regions of the world. Its precise characterization could be determined by the impact factors selected, but its application can verify its positive impact on local industrial farming and land use.
2. Materials and Methods
2.1. Study Area
Barwon is located in the south-central part of Victoria, which is the second-largest metropolitan region near Melbourne and is a rapidly expanding area in terms of demographics. Aside from this, the region is Australia’s largest supplier of dairy products, accounting for nearly 25% of total output, and about 20% of the country’s plantation forests are here [18]. The study site is sensitive to reduced water supply and increased temperatures, including diverse land languages, intensive cultivation, urban areas, marginal towns, grazing, forestry, water catchment areas, and coastal areas. As a result of the confluence of human production and climate change, Geelong’s water storage, the most important city in Barwon, had fallen to 14% in 2007, making residents more concerned about the security of their water supply [26,27]. The area applied in this scientific research is approximately 9000 km2 (4% of Victoria), with the southern part of the region forming part of Australia’s south-eastern coastline and much of the northeast being densely populated and connected to the edge of metropolitan areas (Figure 1) [28]. The Barwon River and the Moorabool River are the most extensive waterways in the Barwon Basin [29]. It is projected that significant population growth and climate change will impose increasing pressure on the sustainability of the basin’s watersheds and its natural landscape. Moreover, the abundant water resources are accompanied by an unbalanced distribution of storage facilities, which can lead to scenarios of seasonal flooding and short-term water scarcity in summer, and directly affect the livelihoods of the surrounding residents and livestock activities [30].
2.2. Data Source
The Victorian database is used as the base evaluation database for this research. DEM data are extracted from the United States Geological Survey (USGS) (https://www.usgs.gov/, accessed 21 October 2021). Geographical location information for towns and cities is obtained from Open Street Map (OSM) (https://www.openstreetmap.org/, accessed 21 October 2021). High-resolution satellite and aerial imagery were extracted from the United States Geological Survey (USGS) (https://www.usgs.gov/, accessed 7 July 2021). Victorian NDVI data are collected from the Australian Bureau of Statistics (http://www.bom.gov.au/, accessed 21 October 2021). The same projection coordinate system is defined for all data: Lambert_Conformal_Conic_2SP.
2.3. Methods
Everything from energy cycles and water security to responses to natural disasters serves as concrete social manifestations of climate change mitigation and anthropogenic interventions. A paradigm from addressing traditional material requirements to nature-based solutions can protect, manage, restore, and modify natural ecosystems that may increase their resilience and human adaptability in facing climate change [31,32,33]. Digital workflows in GIS and CAD platform are a diagnostic approach being developed by many researchers that reshape environmental systems through landscape planning and design. These results have the advantage of allowing multiple lenses to be engaged and provide descriptive, explanatory, and predictive analyses of a range of influencing factors [34,35].
The ecologically suitable zones are derived from a weighted overlay of the digital elevation model, spatial analysis of coastal areas, hydrological and geological contexts, and urban distribution, which allows for the prioritization of known environmental parameters and provides the conditions required for water supply assessment. This workflow can simulate the location of multiple water infrastructures and calculate their water storage capacity. Its conclusions will guide the adoption of a multi-stage blue infrastructure in the Barwon region to achieve a green wetland system that retains surface runoff and enhances the stability of the water supply.
2.3.1. Changes in Land-Use Patterns
Regardless of human involvement in natural processes, a distinctive feature of landscapes and ecosystems is their constant change and evolution, and they are inevitably subject to dynamic adjustments due to their spatio-temporal complexity and chaotic character. Although landscapes have diverse spatial and functional attributes in public land, their fluctuations hinder the ability to predict and control their future development [36]. The limited human knowledge of the essence of the operation and these uncertainties have prompted a shift in the focus of analysis from spatial drivers (species–landscape patch interactions) to a more dynamic, process-oriented ecological perception [37,38]. Whereas dissecting the essence of the operation requires identifying patterns of land-use change over time, this approach emphasizes patterns of variation in landscape configuration rather than information about land cover over a specific period.
Comparative GIS analysis can explore the driving forces behind change trajectories and the main consequences of these processes, since modern landscape patches are associated with a specific land-use history [36]. The application of this technique is valuable as an assessment tool to explicitly link land elements and extract their characteristics from the fragments. Water resources, land use, and ecosystem services are key factors in mitigating the negative impacts of future climate change [39]. Remote sensing analysis at different time nodes allows a spatial summary of development trends and a comparison of previous configurations to create models for forward-looking predictions in landscape patterns synthetically.
Over a century of evolution from colonial exploration in 1866 to the present, the indigenous peoples of this region have gradually migrated and integrated, while the main productive activities have remained as timber production and agricultural grazing (Figure 2). The change in land use mode from a predominantly dryland cultivation to a grazing pattern is an epochal choice of local economic development and climate change. Its historical iteration clearly illustrates the precise relevance of water resources as a fundamental element of land patch use to the change in its production pattern following the reduction of annual precipitation by 100~200 mm in recent decades [18]. From this, it can be inferred that future population growth and agricultural production will be susceptible to water sources.
2.3.2. Screening for Ecological Suitability Factors
Ecological suitability analysis is an assessment of the suitability of land for redevelopment in order to find the best pattern and planning [40]. This screening is based on the assumption that the effects of a risk source are the same for different ecosystems but that different environmental factors may influence the level of ecological suitability. Suitability in this context refers to the indicators that comprise ecological stability under potential environmental conditions. It is more applicable on a large-scale with less complex studies [41]. The overall assessment can be constructed using a weighted overlay technique. Four basic categories are considered to filter the influences: climate; topography; ground surface; and human activity, then decomposed into their associated parameters. The climate and topography include geology, groundwater, and salinity; the factor of ground surface is represented by the Normalized Difference Vegetation Index (NDVI) and surface runoff; the Euclidean distance of the town signifies the anthropogenic factor [42,43]. All these indicators need to be standardized before further processing [44].
The formulae used for evaluating ecological suitability are as follows [42,43,44]:
where S represents the eco-environmental suitability; represents the normalized suitability factors (Multiple classes, 1 is extremely unsuitable gradually shifting to 9 is highly suitable.); represents the weights of ; is the number of suitability factors; and 0 < n < .
In general, the higher the NDVI, water table, and rock hardness values, the higher the adaptation of regional water supply facilities; moreover, it performs lower with higher salinity levels [42,43,44]. However, all distances of ecological infrastructure are expected to simultaneously satisfy moderate surface runoff and reasonable distribution of built-up areas [45]. Therefore, a screening of regional suitability influencing factors was achieved, as shown in Table 1.
2.3.3. Spatial Analysis Assessment of Potential Catchment Areas Based on a Weighted Overlay Technique
The graphical overlay is the most coherent and effective way to represent or conclude multiple specific components by transforming the layered structure of a vertical transect onto a horizontal plane, and it allows hidden relationships to ‘emerge’ by extracting different spatial information [46]. Geographic Information Systems (GIS) provide a powerful toolset for spatial analysis by preparing raster images of the above ecological suitability factors to identify potential water supply zones in conjunction with multi- environmental criteria.
In raster superimposed analysis, each cell in every layer must refer to the exact geographical location to couple the features of the numerous layers and combine them into a single one [47]. A particular thematic layer’s pixels (cells) are assigned numerical weight values mathematically simulated to generate a new value for the corresponding pixel in the output layer. The scale weight for each category of the weighted overlay analysis is defined in the range 1–10, and weights are allocated according to their suitability for water supply [45,48]. The formulation of this multi-layer methodology is:
where, S refers to weighted index value (consolidated water supply potential values); ST indicates surface runoff; N refers to NDVI; CT concerns distance from towns; L indicates soil context; GW refers to groundwater level; SA indicates salinity. In addition, the subscript letter ‘’ indicates the scale weight assigned to a layer-specific feature class, while ‘’ indicates the percentage of influencing weight allocated to the thematic layer.
In summary, parameters such as surface runoff and NDVI are regarded as core features and attributed to high influence weights’ values. Moreover, the dispersal distance of towns and soil context is also relevant for water storage, but groundwater level fluctuation rates and salinity are also considered indirect indicators for identifying potential zones.
Their practical significance for the site water supply is discussed separately, with surface runoff (Figure 3a) as an important parameter determining the extent of supply, routes, surface volumes, and infiltration rates [49]. Barwon is in a coastal estuary with abundant streamflow, and its flood pulses during the deluge period mainly function on a flood plain two kilometers offshore. Natural water level fluctuations occurring transversely (perpendicular to the river) could easily change the environmental conditions to moderate the rate of ecological competition and improve flora diversity, in which dynamic interactions are integral to the protection of the river’s hinterland [50,51,52]. It purifies water by decomposing sediments and maintains a diverse ecological structure that benefits agricultural production on a global level. Hence, the proposed water infrastructure uses plant roots to slow and retain surface seepage between the river and the land, requiring the structures to be a suitable distance from the river. To reduce the disturbance of the existing nearshore ecology by new facilities, the area of the by-pass waterway 2–4 km from the main river is chosen as the optimum, and a decreasing principle is adopted to create an adequate water storage space on both sides. As illustrated by NDVI (Figure 3b), plant health is controlled by rainfall and drought conditions, and its value reflects the ability to contribute to water conservation actively. The towns should be at an appropriate distance from the water storage system (Figure 3c) to prevent pollution from human activities, but destinations that are too far away can increase transport costs, so a balance is required between the interests of both to determine the final site. According to the satellite images, the area 6–7 km away from the town is generally undisturbed by human intervention and has an accessible geographic configuration. The suitability of the location decreases along the sides with this central threshold. Furthermore, the properties of lithology (Figure 3d) are direct variables that govern differences in water storage, regulating the dynamic configuration of groundwater and surface runoff through changes in percolation rates and storage capacity [53]. In this background of global warming and reduced precipitation, the storage level and quality (salinity) of groundwater (Figure 3e,f) determine ecosystem composition and productivity, while distribution patterns generally modulate seasonal drought [49].
Because these factors collectively drive the ultimate evaluation of site suitability and the intensity of ecological influence they provide, this database of land characteristics is used as a source of information to compare the scale weight and percentage of influence weights assigned to each criterion theme layer based on their contribution to water availability. They are all performed with reference to the literature and expert opinion [42,43,44,48], as shown in Table 2.
A weighted overlay analysis of all the parameters from the sum of the above total percentages equal to 100%, converting the feature layers (vectors) to a raster grid format and reclassifying them, results in Figure 4. Further, the weighted thematic raster layers are input to Equation (2) to generate a water supply potential map in the ArcGIS platform. The output map is graded into four zones of a progressive transition from high suitability to extreme unsuitability based on water storage potential [48].
2.3.4. Distribution and Projections of Future Water Supply Systems
The distribution of water storage facilities, such as hierarchical dams or resilient wetlands, is simulated in areas of high suitability. However, since dams can effectively retain surface runoff and release water in a manageable manner [54], they are developed for use in this study as the primary structure for improving water supply. The proposed solutions can be applied to existing terrain environments and ultimately determine different allocation options by analyzing the advantages and drawbacks of water storage. These strategies allow the researcher to modify, test and simulate, which enables us to easily add checkpoints and dams onto the suitability map to create retention catchments. The application of multilevel water storage and eco-infrastructure in the watershed’s high vulnerability areas effectively increases the storage capacity of future water supplies by intercepting seasonal floods during the rainy season and allowing for gentle releases for the rest of the year, offering diverse possibilities for an iterative design process.
By inputting a Digital Elevation Model (DEM) and potential pour points into the GIS environment to simulate the hydrological system. This workflow model the flow network and hierarchy of a pre-defined site by calculating the raster’s flow direction and flow accumulation [34]. Snapping pour points is a necessary procedure for computing the watershed, which is combined with the profile graph of pour points to produce a value for the volume of water stored through surface volume. Note that two parameters will affect the final volume result, one is the planned height as the original terrain height plus the proposed dam height (determined by the whole depth of the profile), and the other is the selection below the reference plane.
Consequently, these fundamental steps to move forward (Figure 5) identify vulnerabilities in the water supply system and locations of a hypothetical eco-infrastructure, which reasonably derives water storage capacity and explores the possibility of future infrastructure as an ecological landscape [55].
3. Results
3.1. Characterization and Analysis of Ecological Suitability Factors
A cross-comparison of multiple parameters reveals their intrinsic correlation affecting the level of ecological suitability, which examines the large-scale land elements of the site and decomposes the related variables that make them up, such as surface runoff, NDVI, town distribution, soil typology, groundwater status, and salinity. By selecting appropriate factors to overlay, the proportion of their scale weight and their characteristics in the site are analyzed.
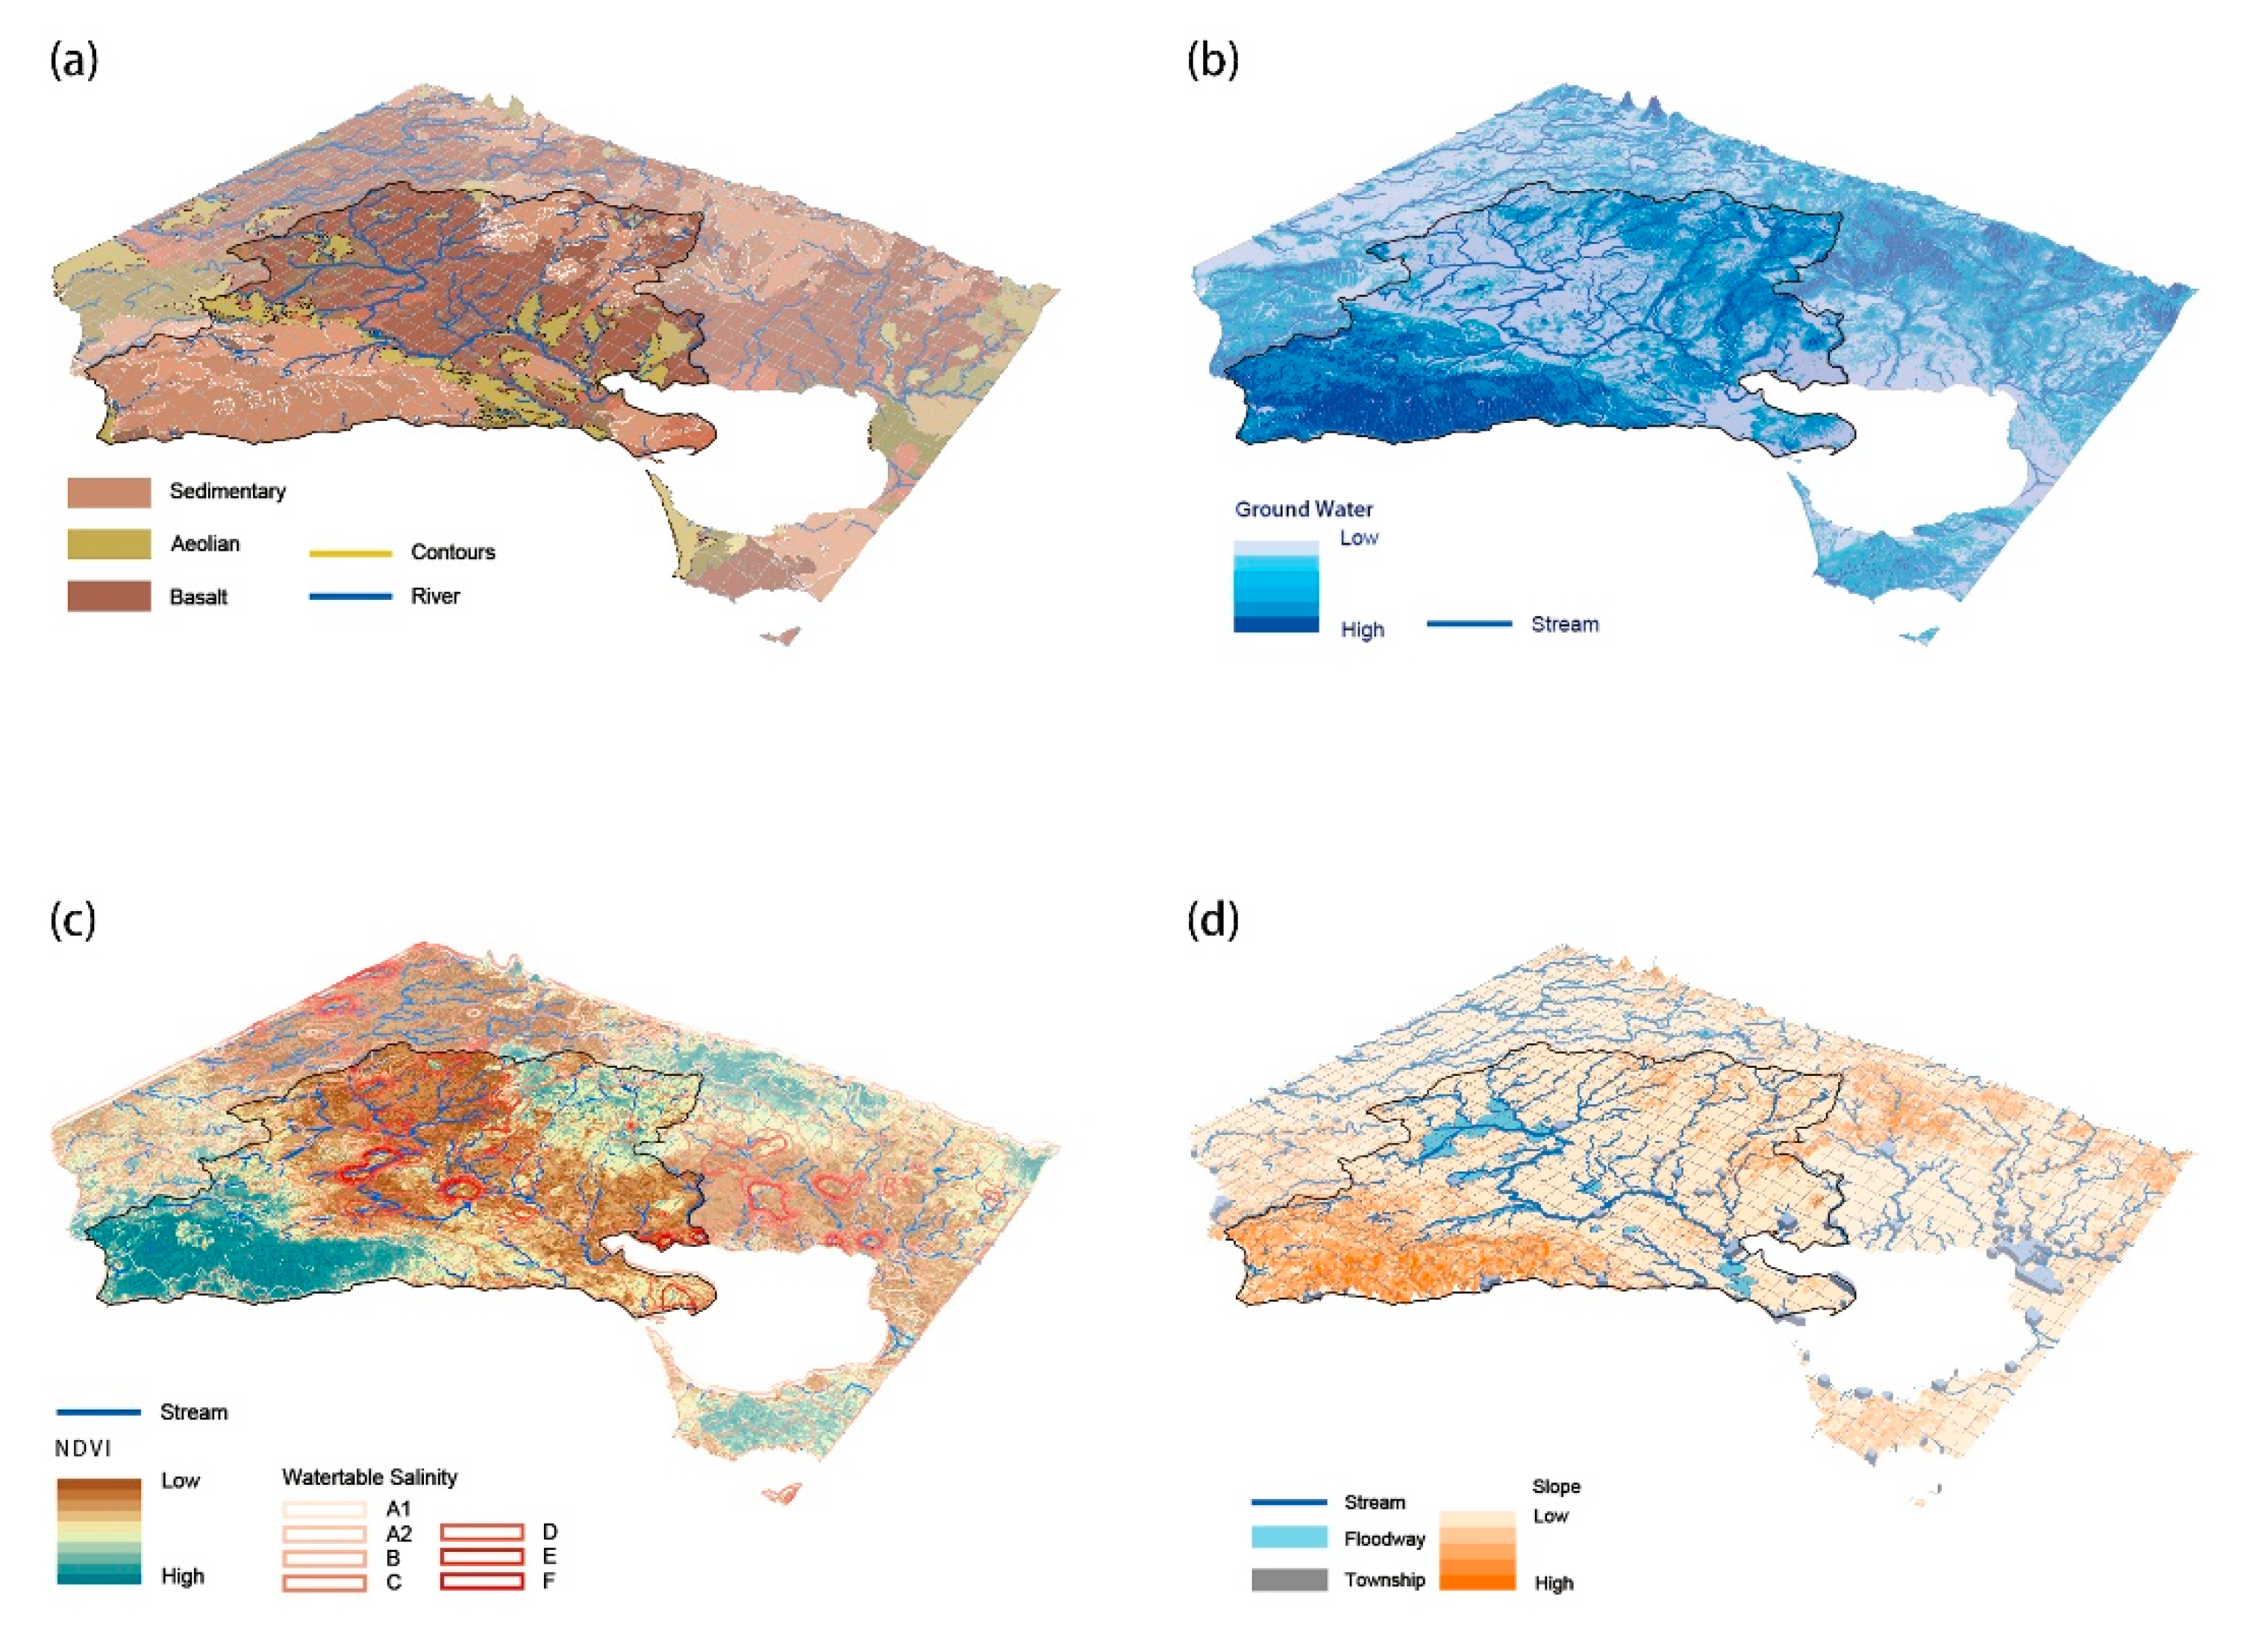
According to the information compared in Figure 6, it is concluded that the Barwon area ecological landscape has the following characteristics: (1) The terrain throughout the study area gradually changes from a forested plateau in the southwest to the northern plains. The space between the canyons is conducive to the convergence of water and guides its direction, which provides a topographical difference for the catchment area. Compared with the mapping of land types, lithology intuitively shows that most of southern Barwon is sedimentary and aeolian soil types. This property enhances water permeability and groundwater retention. In contrast, the central basin of the mainstream is composed of basalt (complex rock formations) in the north and extends towards the sedimentary rock plain (Figure 6a,b), which suggests that the hardness of the land may influence the direction of the flow; (2) NDVI values in areas of high salinity show a negative performance (Figure 6b,c). However, its role as an indicator of the healthy growth of vegetation typically fluctuates with dry climates and reduced precipitation, where farmlands and grasslands, the most crucial type of production occupying the Barwon region, are particularly impacted [56,57]. Plant rhizomes can also contribute to the consolidation of groundwater sources and become a buffer zone between humans and nature, thus increasing the space for water resilience; (3) The gently sloping central plain is a floodplain for seasonal inundation and is partly adjacent to towns (Figure 6d). Streams and settlements are interdependent, and the distances between them tend to be in a relatively stable ecological environment. Because the cleanliness and safety of water storage have been proven to be highly linked to the distance between water flows and communities, and as human activity has been converting large vegetated areas into productive land with the expansion of coastal development, the quality of water sources close to built-up areas is vulnerable to human intervention.
3.2. Map of Potential Catchment Areas Generated by the Weighted Overlay
The raster criteria layers were redefined using the reclassification tool provided by ArcGIS based on the weighting information summarized in Table 2. Each layer has and only has unique values corresponding to suitability for the same location pixels. In order to better identify the dam site, the six sub-influence layers in Figure 3 are included in the analysis of the potential catchment areas, and a weighted overlay produces the potential catchment suitability map (Figure 7), which is classified as ‘high, medium, low and least suitable’. The first two of these potential zones are significant for managing water resources at Barwon in terms of the geographic site configuration.
The high suitability areas represented in blue on this map provide a visual representation of where dams might be built and suggest the exact boundaries for further examination and iteration. The Midwest plateau and plains interface are abundant with watercourses and rugged rock formations, essential for dam construction. Potential objective areas are within approximately equal distance of surrounding settlements and have a more substantial likelihood of supplying numerous towns in the future. In addition, the water needs of the central plain for extensive cultivation and grazing are concentrated in the calculated areas of high suitability, which provides opportunities for efficient agricultural production and reduces dependence on precipitation.
Smaller patches in the north and east also demonstrate potential for water storage facilities. Nonetheless, the results are mainly based on the parameters of the river and its surroundings, which are difficult to form a coherent network with the inherent water system and have comparatively high salinity. The south-eastern coastal area has several tributaries and ample groundwater resources. At the same time, the soft and permeable rock type makes it challenging to retain intercepted surface runoff and is adjudged to be unsuitable. Therefore, the overall suitable sites for dams and resilient wetlands are the Midwest’s geologically rigid and agriculturally stable riverine areas.
3.3. Assessment of Dams and Testing of Water Storage Capacity
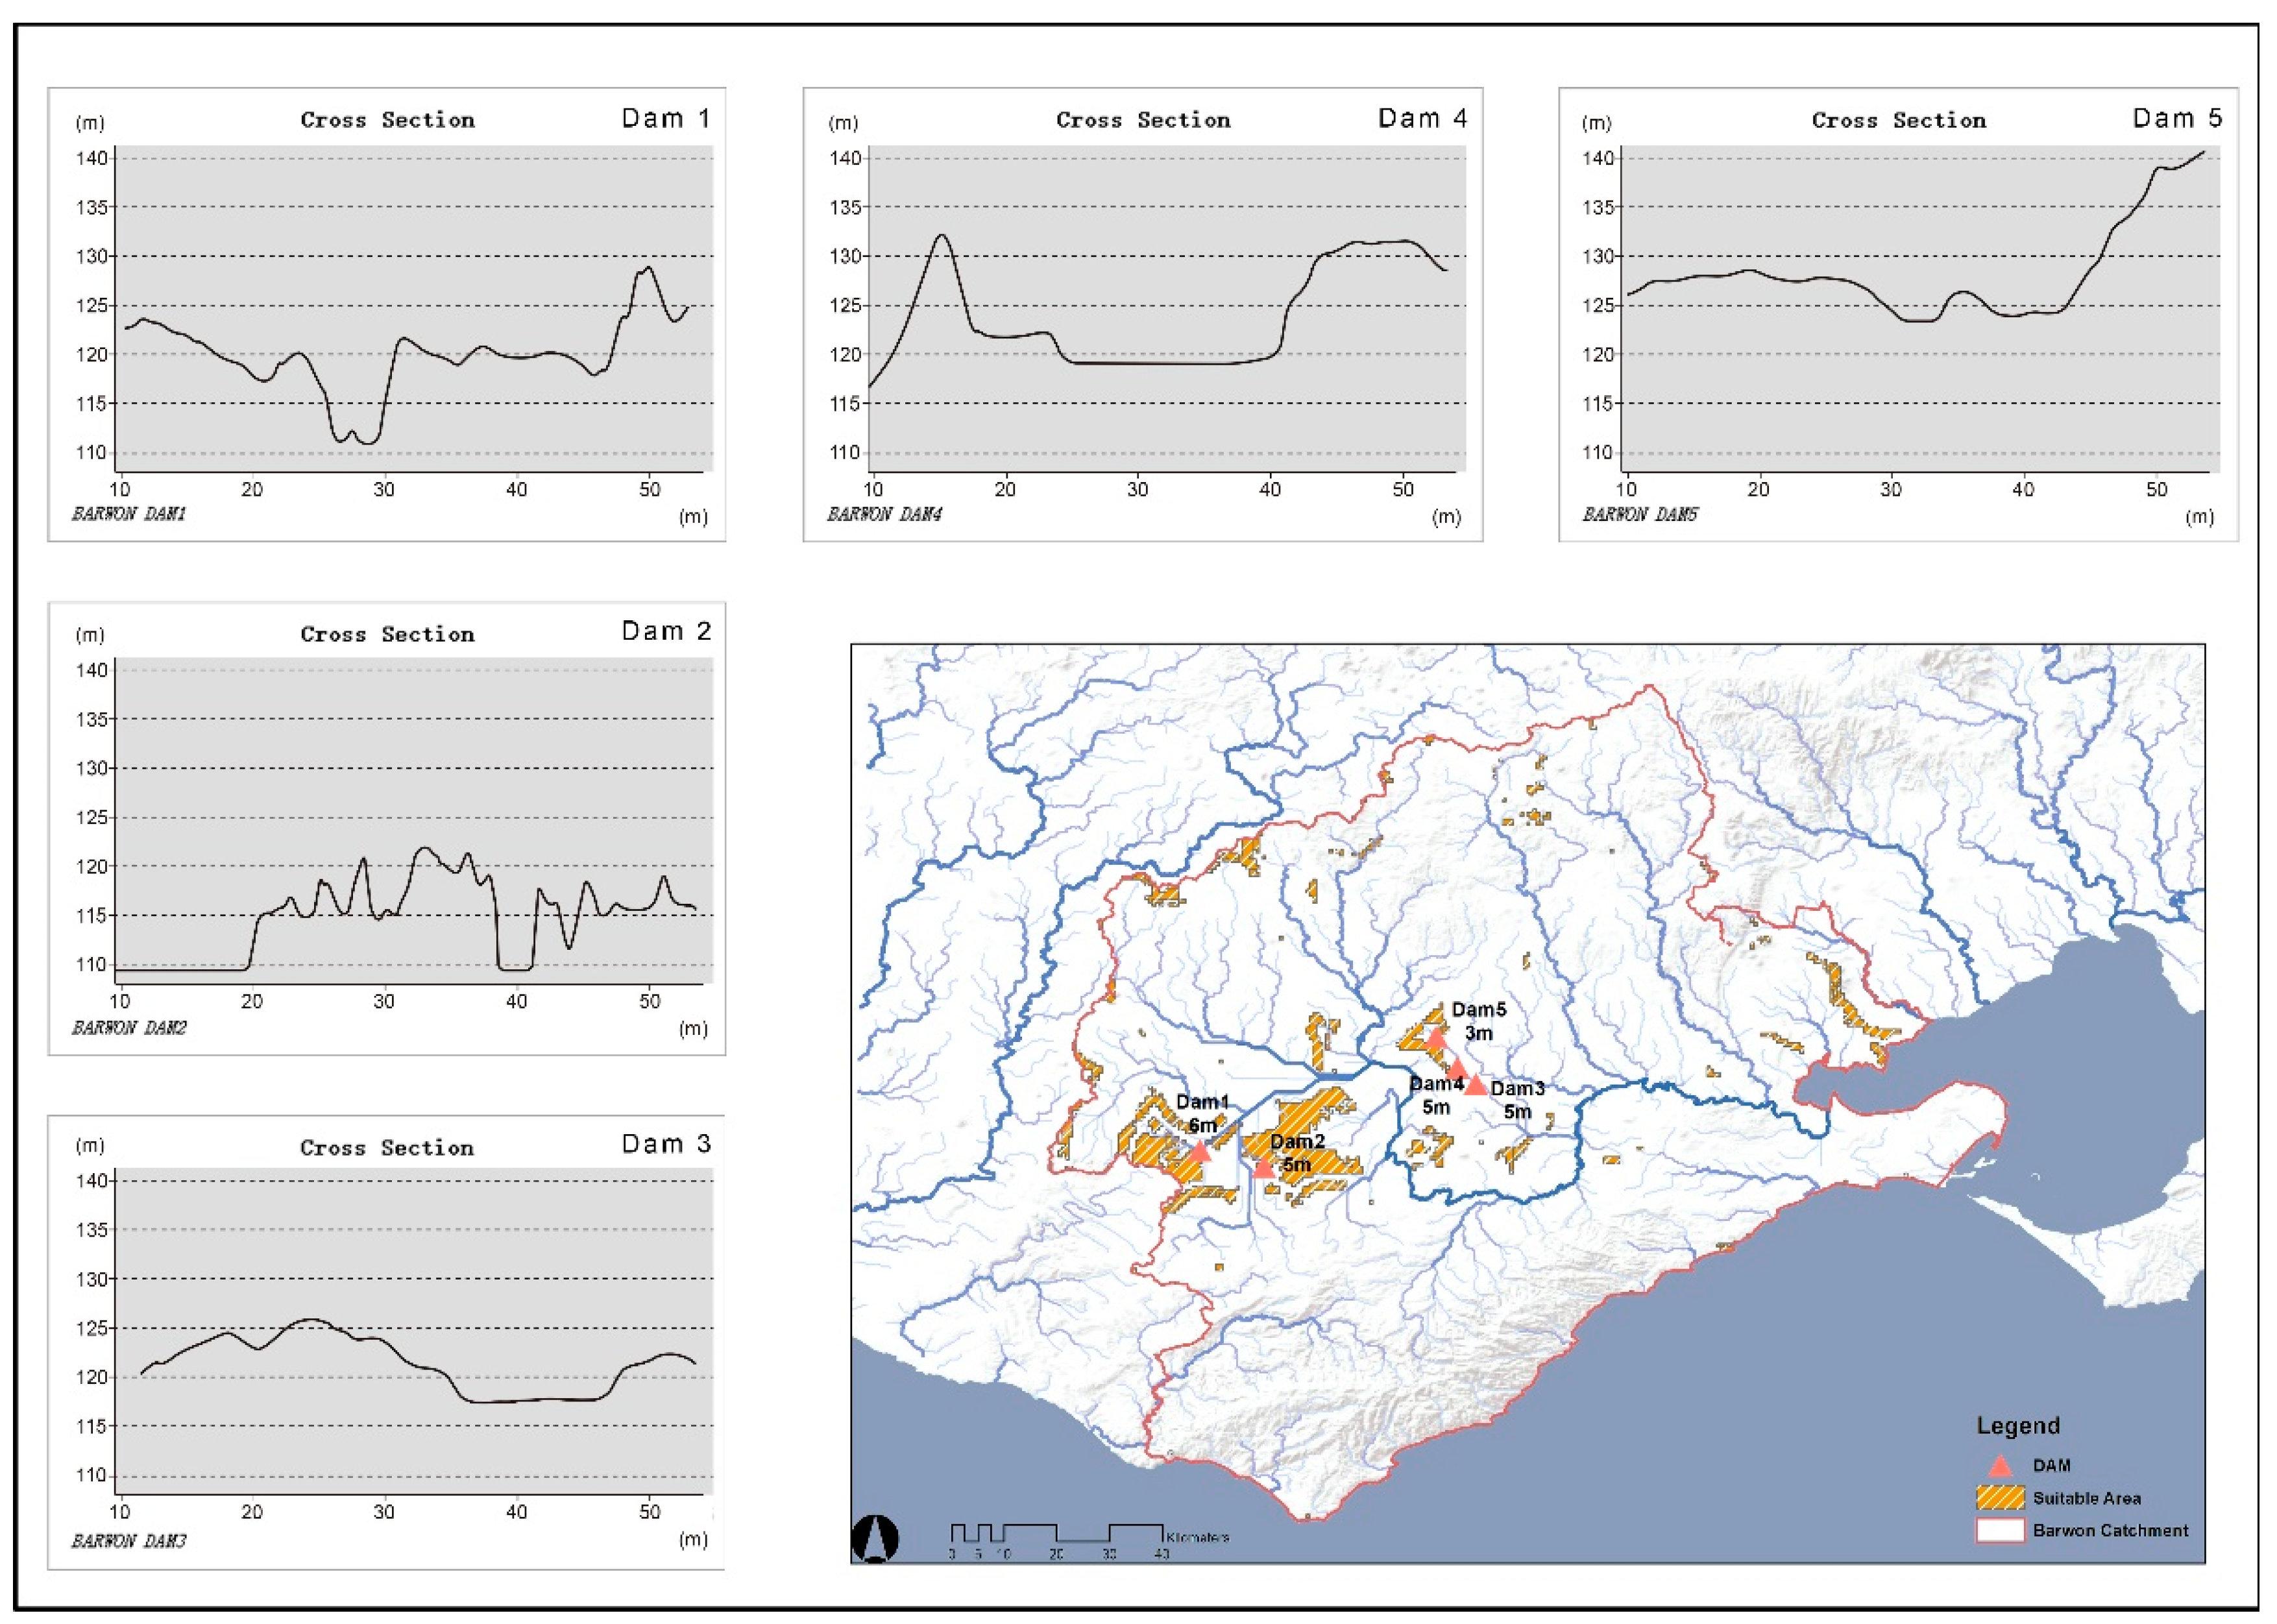
Five ecologically resilient areas are proposed for dam site testing and selection based on weighted calculations, with the overall objective being to alleviate water scarcity in the dry season and serve traditional agricultural activities. The dams and wetlands can be used as a cushion between humans and nature to regulate stream volumes when extreme precipitation increases during the flood season. In particular, in periods of abnormal water levels, dams are utilized to suppress runoff and redistribute it to other times of the year [54]. As shown in Figure 8, they are located within the high suitability areas of the synthetic map and mainly around the middle and lower reaches. The simulated dam locations are input into a spatial analysis platform (GIS) as pour points to create scenarios that intercept the water flow, and a cross-section of the terrain is viewed in the built-in 3D function to provide a reference dam height for the following estimation of storage capacity. It is proposed that hierarchical dams in plain regions should not be too high to prevent overflow during the rainy season, which requires the fundamental condition that their structures are lower than the hills on either side. More specifically, for the first dam, its valley floor is shown in the profile as about 113 m, while the height of the abutting cliffs is approximately 121 m. Based on these requirements and allowing for sufficient safety margins, this dam is most suitable at a maximum height of 6 m. The five sites are tested in sequential order, and their heights are 6 m, 5 m, 5 m, 5 m and 3 m, respectively.
Using the Surface Volume function to calculate the volume of water stored will help to summarize whether the project could make a meaningful contribution to the future water supply. This technique has two main parameters that directly affect the outcome, and the DEM model has been entered into the software ready for use. The Plan Height is the original topographic elevation plus the proposed dam height and has been chosen to generate the volumes below the Reference Plan, which are presented (Table 3) and compared to the original water storage capacity of the Barwon area.
A brief estimate of the enhancement of the water supply system can be obtained by summing the total capacity of the Barwon (98,628 ML) and the additional volume provided by the envisaged multi-stage dam (49,373 ML), divided by the original water storage capacity, resulting in an improvement of approximately 1.5 times, which explains the value of the experiment. Furthermore, this diagram (Figure 9) outlines the entire mechanism of the dam’s operation, with a continuously hierarchical water storage facility that uses multiple interruptions to increase surface water retention opportunities and improve the site’s overall ecological configuration and stability. The inhabitants of the surrounding towns can extract the vital water resources from the linear system for productive activities and create a healthy habitat for living creatures. The proposed blue infrastructure provides water to support a wide range of intensive agricultural activities and creates ecological wetlands along the river to accommodate the collateral effects of future precipitation deficits.
4. Discussion
In recent years, Australia’s high vulnerability and sensitivity to climate change were reflected in severe droughts caused by a combination of rainfall deficits and rising temperatures [58]. There is a 66% probability that the future affected area will extend to Victoria by the 2150s [59], and this finding has driven the increasingly apparent contradiction in the water supply to the coastal areas where most settlers are concentrated.
In order to establish a deeper understanding of the potential impacts of changing landscape patterns on coastal ecological suitability, the spatial and temporal distribution characteristics of shifting land-use in Barwon were investigated. It is evident that the Anthropocene transformation is mainly embodied in more efficient agricultural grazing and woodland development. We took the macro-predictions that population growth and climate change will tend towards drought as a premise for our strategy and extrapolated the conflicts between future water demand and actual supply capacity.
This article screened the basic parameters for the suitability analysis of dams based on previous literature and practice. In the study, geomorphological attributes such as surface hydrology, groundwater level, NDVI, salinity, lithology, and distance from towns comprised the objective factors for analyzing the construction of water supply systems in the catchment area, and weighting proportions consistent with their self-significance were applied to the parameters of the model. A graded map of dam suitability was extracted by utilizing GIS data visualization to systematize the entire siting analysis process, and so the accuracy of the results is further credible. The high suitability areas produced by the model are centered on the plateau-plain convergence in the Midwest, which is the primary productive place for local economic activity and has many settlements in its downstream reaches, such as Geelong, one of Victoria’s largest regional cities [28]. Since the population around the river is predominantly dependent on its supply, after assessing the storage capacity of potential dam sites, five small dams of around five meters were identified to provide a positive reaction to the ecological capacity of the area. In addition, the proposed multi-level dams intercept seasonal floods to achieve resilient landscape space. These sites were selected with ecological service purposes in view, and all factors were simulated and overlaid to achieve the optimum volumes and conditions.
From a more comprehensive global perspective, with approximately 2.5 billion hectares of land available for mixed crop farming, agriculture is the most vulnerable to climate change owing to its enormous size and sensitivity [60,61]. In Australia, almost one-third of the agricultural area is mixed farming. The changing climatic parameters of recent decades have been a significant factor in the risks of intensive agriculture. Across much of the southern part of the country, abnormal rainfall and rising temperatures have combined to drive less streamflow into rivers and dams, which will reduce the amount of water available for irrigation [60,62,63]. In addition, its adverse effects involve periodic prolonged droughts and reduced groundwater recharge rates. Thus, the issue surrounding productive activities along most rivers is that the intensity and frequency of precipitation may be affected to different extents by climate change [64].
The water systems program mentioned in the text is presented as an adaptation action to mitigate agro-pastoral complexities in the future. The strategies of this workflow might be applied to these areas where water resources are unevenly scattered due to seasonal rainfall fluctuations. For instance, in South Asia, human and economic losses caused by extreme weather have risen exponentially over the century. One of the more obvious landscape risks in flooding has demonstrated an upward trend in the Indian region [65]. The multi-purpose dam concept allows for applying similar ecological conditions, converting excess surface runoff into resilient wetlands through low disturbance hierarchical retention. This model relieves pressure on water systems and can be associated with other hydrological modelling platforms such as HEC-RAS and HEC-GeoRAS to provide practical support in further developing iterative topography. The precise design of the positioning and function of the blue infrastructure achieved with the help of digital simulation makes a positive contribution to the efficient balancing of water allocation and reuse in the region.
Properly planned land regeneration is essential for the improvement of future landscape risk. Nevertheless, indirect site characteristics may also affect the accuracy of suitability judgements, such as economic performance, human customs, site accessibility, and other factors that have not been fully addressed. The results of the predictions are not simply causal, which leads to uncertainty, and the fact that the evaluation and projection of this study are without field surveys limits the precision of our exploration. This technology can be used coupled with traditional methods of geological prospecting to shortlist locations for the construction of water supply facilities, increasing efficiency, and saving time and resources. Future research directions could invest more effort in methodologies such as high-resolution land information extraction, artificial intelligence-based data collection and multi-period water flow simulation to cope with the coupling and coordination of elements under complex model construction.
5. Conclusions
The ecological suitability of the coast is influenced by the potential landscape pattern and environmental carrying capacity. Because of human activities and climate change interventions, it is difficult to strike a balance for the future water supply in the Barwon region between its service functions through natural regulation dynamically. Landscape ecological risks reveal the current state of environmental security and provide urgency for research to optimize regional ecosystems [66].
When analyzing more than 100 years of land-use transformation in the district, it is recognized that the site will remain strongly characterized by grazing and dryland agriculture, but the proportion of the former has experienced a marked increase, the driving forces behind which are not only determined by geographical morphology and economic orientation but are also linked to the long-term anthropogenic impact on the climate. The water shortage during the dry season, becoming more acute this century, has exposed a predictable water supply crisis. For this reason, mitigating the effects of extreme weather conditions on the population has been widely discussed as a fundamental social issue at this stage.
In the field of land use, ecological conservation, and economic development strategies, a model is being proposed that utilizes raster map forms to integrate multiple impact parameters to overlay analysis and calculate the corresponding priorities. It combines GIS, remote sensing, and landscape infrastructure to describe surface landforms and classifications of suitability assessment over various time ranges. The application of this method identifies viable sites for constructing a multi-purpose dam at Barwon within the potential area of the generating rank. As a result, five sites are identified and evaluated using surface volume. Besides, the assumed water storage capacity is compared with the original values to verify the feasibility of the project implementation. As it is approximately 1.5 times higher than the previous value, this will substantially enhance the stability of the water availability on the site after a reduction in rainfall and provide sustainable support for local agricultural development.
This study simulates the insecurity of future water supply, prospectively improving the retention of surface runoff and the rational distribution of water resources. The proposed hierarchy management system effectively optimizes production patterns and water storage capacity, thereby reducing the potential for additional land degradation.
Author Contributions
Conceptualization, S.Z., A.T.; methodology and software, S.Z., J.L., J.W.; site suitability analysis, S.Z., J.T., A.T.; hydrological assessment. S.Z., J.T. and J.W.; writing original draft preparation, S.Z.; review and editing, J.W., A.T.; supervision, A.T. All authors have read and agreed to the published version of the manuscript.
Funding
This research received no external funding.
Institutional Review Board Statement
Not applicable.
Informed Consent Statement
Not applicable.
Data Availability Statement
The datasets used or analyzed during the current study are available in the article/from the corresponding author on request.
Acknowledgments
Thanks to the help of all our friends and professional scholars from RMIT, this paper has meant a phenomenal amount to us, and it was the first step in starting our academic research. We all found each other’s passion and sparkle while writing the manuscript. Once again, sincere thanks to all those associated with this article.
Conflicts of Interest
The authors declare no conflict of interest.
References
- Cumming, G.S.; Buerkert, A.; Hoffmann, E.M.; Schlecht, E.; von Cramon-Taubadel, S.; Tscharntke, T. Implications of Agricultural Transitions and Urbanization for Ecosystem Services. Nature 2014, 515, 50–57. [Google Scholar] [CrossRef] [PubMed]
- United Nations. World Population Prospects 2019: Data Booklet; Statistical Papers—United Nations (Ser. A), Population and Vital Statistics Report; UN: New York, NY, USA, 2019; ISBN 9789210042475. [Google Scholar]
- Wu, J. Landscape Sustainability Science: Ecosystem Services and Human Well-Being in Changing Landscapes. Landsc. Ecol. 2013, 28, 999–1023. [Google Scholar] [CrossRef]
- Steffen, W.; Persson, Å.; Deutsch, L.; Zalasiewicz, J.; Williams, M.; Richardson, K.; Crumley, C.; Crutzen, P.; Folke, C.; Gordon, L.; et al. The Anthropocene: From Global Change to Planetary Stewardship. AMBIO 2011, 40, 739–761. [Google Scholar] [CrossRef] [PubMed] [Green Version]
- Zalasiewicz, J.; Williams, M.; Haywood, A.; Ellis, M. The Anthropocene: A New Epoch of Geological Time? Phil. Trans. R. Soc. A 2011, 369, 835–841. [Google Scholar] [CrossRef] [Green Version]
- Roös, P.; Jones, D. Geelong’s Changing Landscape: Ecology, Development and Conversation; CSIRO Publishing: Clayton, Australia, 2019; ISBN 9780643103603. [Google Scholar]
- Bonwick, J.; Sayers, C.E. John Batman the Founder of Victoria, Link History Series; Link History ed.; Wren: Melbourne, Australia, 1973; ISBN 9780858850224. [Google Scholar]
- Millennium Ecosystem Assessment (Program). Ecosystems and Human Well-Being: Wetlands and Water Synthesis: A Report of the Millennium Ecosystem Assessment; Millennium Ecosystem Assessment (Program), Ed.; World Resources Institute: Washington, DC, USA, 2005; ISBN 9781569735978. [Google Scholar]
- Steiner, F.R.; Thompson, G.F.; Carbonell, A. Nature and Cities: The Ecological Imperative in Urban Design and Planning. Lincoln Institute of Land Policy, in association with the University of Texas at Austin School of Architecture. 2016. Available online: https://www.lincolninst.edu/sites/default/files/pubfiles/nature_and_cities_w16ll.pdf (accessed on 20 March 2021).
- Wang, H.; Zhou, S.; Li, X.; Liu, H.; Chi, D.; Xu, K. The Influence of Climate Change and Human Activities on Ecosystem Service Value. Ecol. Eng. 2016, 87, 224–239. [Google Scholar] [CrossRef]
- Mallen-Cooper, M.; Zampatti, B.P. Restoring the Ecological Integrity of a Dryland River: Why Low Flows in the Barwon–Darling River Must Flow. Ecol. Manag. Restor. 2020, 21, 218–228. [Google Scholar] [CrossRef]
- Lotze, H.K.; Lenihan, H.S.; Bourque, B.J.; Bradbury, R.H.; Cooke, R.G.; Kay, M.C.; Kidwell, S.M.; Kirby, M.X.; Peterson, C.H.; Jackson, J.B.C. Depletion, Degradation, and Recovery Potential of Estuaries and Coastal Seas. Science 2006, 312, 1806–1809. [Google Scholar] [CrossRef]
- Yan, Y.; Ju, H.; Zhang, S.; Chen, G. The Construction of Ecological Security Patterns in Coastal Areas Based on Landscape Ecological Risk Assessment—A Case Study of Jiaodong Peninsula, China. Int. J. Environ. Res. Public Health 2021, 18, 12249. [Google Scholar] [CrossRef]
- Pikitch, E.K.; Santora, C.; Babcock, E.A.; Bakun, A.; Bonfil, R.; Conover, D.O.; Dayton, P.; Doukakis, P.; Fluharty, D.; Heneman, B.; et al. Ecosystem-Based Fishery Management. Science 2004, 305, 346–347. [Google Scholar] [CrossRef]
- Trigger, D.S.; Toussaint, Y.; Mulcock, J. Ecological Restoration in Australia: Environmental Discourses, Landscape Ideals, and the Significance of Human Agency. Soc. Nat. Resour. 2010, 23, 1060–1074. [Google Scholar] [CrossRef]
- Geedicke, I. Anthropogenic Impacts on Mangrove and Saltmarsh Communities in Eastern Australia; von Ossietzky, C., Ed.; Staats-und Universitätsbibliothek Hamburg: Hamburg, Germany, 2019. [Google Scholar]
- Wissing, R.J.; Jones, D.S. A Tale of Three Cities: Food in Aboriginal, European and Chinese Geelong. In Proceedings of the 14th Australasian Urban History Planning History Conference, Melbourne, Australia, 31 January–2 February 2018. [Google Scholar]
- Climate-Ready Victoria: Barwon South West: How Climate Change Will Affect the Barwon South West Region and How You Can Be Climate-Ready. Available online: https://nla.gov.au/nla.obj-298224176 (accessed on 20 April 2021).
- Clarke, J.; Grose, M.; Thatcher, M.; Hernaman, V.; Heady, C.; Round, V.; Rafter, T.; Trenham, C.; Wilson, L. Victorian Climate Projections 2019 Technical Report. In Melbourne Australia; CSIRO: Melbourne, Australia, 2019. [Google Scholar]
- Regan, A.P. Re-Manufacturing the City: Geelong 1945–1993. Ph.D. Thesis, Monash University, Melbourne, Australia, 2017. [Google Scholar]
- Fünfgeld, H. Framing the Challenge of Climate Change Adaptation for Victorian Local Governments. Proc. R. Soc. Vic. 2013, 125, 45–55. [Google Scholar] [CrossRef] [Green Version]
- Perera, B.; Muttil, N.; Hasofer, M. Climate Corrected Urban Water Use and Estimation of Water Savings. In Proceedings of the 18th World IMACS/MODSIM Congress, Cairns, Australia, 13–17 July 2009. [Google Scholar]
- Simmons, M.T.; Venhaus, H.C.; Windhager, S. Exploiting the Attributes of Regional Ecosystems for Landscape Design: The Role of Ecological Restoration in Ecological Engineering. Ecol. Eng. 2007, 30, 201–205. [Google Scholar] [CrossRef]
- Liao, J.; Jia, Y.; Tang, L.; Huang, Q.; Wang, Y.; Huang, N.; Hua, L. Assessment of Urbanization-Induced Ecological Risks in an Area with Significant Ecosystem Services Based on Land Use/Cover Change Scenarios. Int. J. Sustain. Dev. World Ecol. 2018, 25, 448–457. [Google Scholar] [CrossRef]
- Qu, Z.; Zhao, Y.; Luo, M.; Han, L.; Yang, S.; Zhang, L. The Effect of the Human Footprint and Climate Change on Landscape Ecological Risks: A Case Study of the Loess Plateau, China. Land 2022, 11, 217. [Google Scholar] [CrossRef]
- Victoria’s Water in a Changing Climate. Available online: https://www.water.vic.gov.au/climate-change/research/vicwaci (accessed on 20 March 2021).
- Annual Report. Available online: https://www.barwonwater.vic.gov.au/about-us/at-a-glance/annual-report (accessed on 20 April 2022).
- Regional Population, 2020–21 Financial Year|Australian Bureau of Statistics. Available online: https://www.abs.gov.au/statistics/people/population/regional-population/latest-release (accessed on 23 April 2021).
- Skinner, S. Our Living Rivers of the Barwon—Barwon River Ministerial Advisory Committee: Final Recommendations Report; Finsbury Green: Melbourne, Australia, 2020; ISBN 9978-1-76105-476-1. [Google Scholar]
- Yumpu.com Climate Change Adaptation Strategy—City of Greater Geelong. Available online: https://www.yumpu.com/en/document/read/21385079/climate-change-adaptation-strategy-city-of-greater-geelong (accessed on 20 April 2021).
- Cohen-Shacham, E.; Walters, G.; Janzen, C.; Maginnis, S. (Eds.) Nature-Based Solutions to Address Global Societal Challenges; IUCN International Union for Conservation of Nature: Grand, Switzerland, 2016; ISBN 9782831718125. [Google Scholar]
- World Wildlife Fund. Natural and Nature-Based Flood Management: Agreen Guide; World Wildlife Fund: Washington, DC, USA, 2016. [Google Scholar]
- Kabisch, N.; Frantzeskaki, N.; Pauleit, S.; Naumann, S.; Davis, M.; Artmann, M.; Haase, D.; Knapp, S.; Korn, H.; Stadler, J.; et al. Nature-Based Solutions to Climate Change Mitigation and Adaptation in Urban Areas: Perspectives on Indicators, Knowledge Gaps, Barriers, and Opportunities for Action. Ecol. Soc. 2016, 21, art39. [Google Scholar] [CrossRef] [Green Version]
- Tara, A.; Ninsalam, Y.; Tara, N.; Muni, V. Designing with Nature-Based Solutions to Mitigate Flooding in Mataniko River Catchment, Honiara. JoLA-J. Landsc. Archit. 2020, 5, 457–466. [Google Scholar] [CrossRef]
- Vollmer, D.; Costa, D.; Lin, E.S.; Ninsalam, Y.; Shaad, K.; Prescott, M.F.; Gurusamy, S.; Remondi, F.; Padawangi, R.; Burlando, P.; et al. Changing the Course of Rivers in an Asian City: Linking Landscapes to Human Benefits through Iterative Modeling and Design. J. Am. Water Resour. Assoc. 2015, 51, 672–688. [Google Scholar] [CrossRef]
- Käyhkö, N.; Skånes, H. Change Trajectories and Key Biotopes—Assessing Landscape Dynamics and Sustainability. Landsc. Urban Plan. 2006, 75, 300–321. [Google Scholar] [CrossRef]
- Bartel, A. Analysis of Landscape Pattern: Towards a ‘Top down’ Indicator for Evaluation of Landuse. Ecol. Model. 2000, 130, 87–94. [Google Scholar] [CrossRef]
- Antrop, M. Landscape Change: Plan or Chaos? Landsc. Urban Plan. 1998, 41, 155–161. [Google Scholar] [CrossRef]
- Jiang, D.; Guo, Y.; Liu, J.; Zhu, H.; Qi, Z.; Chen, Y. Spatiotemporal Assessment of Water Conservation Function for Ecosystem Service Management Using a GIS-Based Data-Fusion Analysis Framework. Water Resour. Manag. 2021, 35, 4309–4323. [Google Scholar] [CrossRef]
- Liu, J.; Ye, J.; Yang, W.; Yu, S.-x. Environmental Impact Assessment of Land Use Planning in Wuhan City Based on Ecological Suitability Analysis. Procedia Environ. Sci. 2010, 2, 185–191. [Google Scholar] [CrossRef] [Green Version]
- Fekete, A.; Damm, M.; Birkmann, J. Scales as a Challenge for Vulnerability Assessment. Nat. Hazards 2010, 55, 729–747. [Google Scholar] [CrossRef]
- Xu, X.; Xu, L.; Yan, L.; Ma, L.; Lu, Y. Integrated Regional Ecological Risk Assessment of Multi-Ecosystems under Multi-Disasters: A Case Study of China. Environ. Earth Sci. 2015, 74, 747–758. [Google Scholar] [CrossRef]
- Wang, H. Regional Assessment of Ecological Risk Caused by Human Activities on Wetlands in the Muleng-Xingkai Plain of China Using a Pressure–Capital–Vulnerability–Response Model. Wetl. Ecol Manag. 2021, 30, 111–126. [Google Scholar] [CrossRef]
- Wang, H.; Song, C.; Song, K. Regional Ecological Risk Assessment of Wetlands in the Sanjiang Plain with Respect to Human Disturbance. Sustainability 2020, 12, 1974. [Google Scholar] [CrossRef] [Green Version]
- Roozbahani, R.; Abbasi, B.; Schreider, S.; Iversen, J. Dam Location-Allocation under Multiple Hydrological Scenarios. Water Resour. Manag. 2021, 35, 993–1009. [Google Scholar] [CrossRef]
- Carrascal Aguire, G. Het Stapelen van Ruimtelijke Informatie: Enkele Gedachten over Het Structureren in Lagen En de Oorsprong Ervan. Over Holl. 2017, 9, 92–120. [Google Scholar] [CrossRef]
- Malczewski, J. GIS-Based Land-Use Suitability Analysis: A Critical Overview. Prog. Plan. 2004, 62, 3–65. [Google Scholar] [CrossRef]
- Kaliraj, S.; Chandrasekar, N.; Magesh, N.S. Evaluation of Multiple Environmental Factors for Site-Specific Groundwater Recharge Structures in the Vaigai River Upper Basin, Tamil Nadu, India, Using GIS-Based Weighted Overlay Analysis. Environ. Earth Sci. 2015, 74, 4355–4380. [Google Scholar] [CrossRef]
- Shao, Z.; Jahangir, Z.; Muhammad Yasir, Q.; Atta-ur-Rahman; Mahmood, S. Identification of Potential Sites for a Multi-Purpose Dam Using a Dam Suitability Stream Model. Water 2020, 12, 3249. [Google Scholar] [CrossRef]
- Chormanski, J.; Okruszko, T.; Ignar, S.; Batelaan, O.; Rebel, K.T.; Wassen, M.J. Flood Mapping with Remote Sensing and Hydrochemistry: A New Method to Distinguish the Origin of Flood Water during Floods. Ecol. Eng. 2011, 37, 1334–1349. [Google Scholar] [CrossRef]
- Overton, I.C. Modelling Floodplain Inundation on a Regulated River: Integrating GIS, Remote Sensing and Hydrological Models. River Res. Applic. 2005, 21, 991–1001. [Google Scholar] [CrossRef]
- Pollock, M.M.; Naiman, R.J.; Hanley, T.A. Plant Species Richness in Riparian Wetlands—A Test of Biodiversity Theory. Ecology 1998, 79, 94–105. [Google Scholar] [CrossRef]
- Hahm, W.J.; Rempe, D.M.; Dralle, D.N.; Dawson, T.E.; Lovill, S.M.; Bryk, A.B.; Bish, D.L.; Schieber, J.; Dietrich, W.E. Lithologically Controlled Subsurface Critical Zone Thickness and Water Storage Capacity Determine Regional Plant Community Composition. Water Resour. Res. 2019, 55, 3028–3055. [Google Scholar] [CrossRef]
- Arheimer, B.; Hjerdt, N.; Lindström, G. Artificially Induced Floods to Manage Forest Habitats Under Climate Change. Front. Environ. Sci. 2018, 6, 102. [Google Scholar] [CrossRef] [Green Version]
- Doherty, G.; Waldheim, C. (Eds.) Is Landscape…? Essays on the Identity of Landscape; Routledge: London, UK, 2015; ISBN 9781315697581. [Google Scholar]
- Tian, F.; Wu, J.; Liu, L.; Leng, S.; Yang, J.; Zhao, W.; Shen, Q. Exceptional Drought across Southeastern Australia Caused by Extreme Lack of Precipitation and Its Impacts on NDVI and SIF in 2018. Remote Sens. 2019, 12, 54. [Google Scholar] [CrossRef] [Green Version]
- Otto, M.; Höpfner, C.; Curio, J.; Maussion, F.; Scherer, D. Assessing Vegetation Response to Precipitation in Northwest Morocco during the Last Decade: An Application of MODIS NDVI and High Resolution Reanalysis Data. Theor. Appl. Climatol. 2016, 123, 23–41. [Google Scholar] [CrossRef]
- Spinoni, J.; Barbosa, P.; De Jager, A.; McCormick, N.; Naumann, G.; Vogt, J.V.; Magni, D.; Masante, D.; Mazzeschi, M. A New Global Database of Meteorological Drought Events from 1951 to 2016. J. Hydrol. Reg. Stud. 2019, 22, 100593. [Google Scholar] [CrossRef]
- Kirono, D.G.C.; Kent, D.M.; Hennessy, K.J.; Mpelasoka, F. Characteristics of Australian Droughts under Enhanced Greenhouse Conditions: Results from 14 Global Climate Models. J. Arid. Environ. 2011, 75, 566–575. [Google Scholar] [CrossRef]
- Malhi, G.S.; Kaur, M.; Kaushik, P. Impact of Climate Change on Agriculture and Its Mitigation Strategies: A Review. Sustainability 2021, 13, 1318. [Google Scholar] [CrossRef]
- Ghahramani, A.; Kingwell, R.S.; Maraseni, T.N. Land Use Change in Australian Mixed Crop-Livestock Systems as a Transformative Climate Change Adaptation. Agric. Syst. 2020, 180, 102791. [Google Scholar] [CrossRef]
- Freebairn, J. Adaptation to Climate Change by Australian Farmers. Climate 2021, 9, 141. [Google Scholar] [CrossRef]
- Bell, L.W.; Moore, A.D. Integrated Crop–Livestock Systems in Australian Agriculture: Trends, Drivers and Implications. Agric. Syst. 2012, 111, 1–12. [Google Scholar] [CrossRef]
- Dottori, F.; Szewczyk, W.; Ciscar, J.-C.; Zhao, F.; Alfieri, L.; Hirabayashi, Y.; Bianchi, A.; Mongelli, I.; Frieler, K.; Betts, R.A.; et al. Increased Human and Economic Losses from River Flooding with Anthropogenic Warming. Nat. Clim Chang. 2018, 8, 781–786. [Google Scholar] [CrossRef]
- Kale, V.S. Is Flooding in South Asia Getting Worse and More Frequent?: Flooding in South Asia. Singap. J. Trop. Geogr. 2014, 35, 161–178. [Google Scholar] [CrossRef]
- Gao, Y.; Wu, Z.; Lou, Q.; Huang, H.; Cheng, J.; Chen, Z. Landscape Ecological Security Assessment Based on Projection Pursuit in Pearl River Delta. Environ. Monit. Assess. 2012, 184, 2307–2319. [Google Scholar] [CrossRef]
Figure 1.
Situation of the study cases.

Figure 2.
The historical iteration of land-use patterns.

Figure 3.
(a–f) Essential parameters: (a) distance from streams; (b) NDVI; (c) lithology; (d) distance from towns; (e) groundwater; (f) salinity.
Figure 3.
(a–f) Essential parameters: (a) distance from streams; (b) NDVI; (c) lithology; (d) distance from towns; (e) groundwater; (f) salinity.

Figure 4.
(a–f) Reclassified layers: (a) distance from streams; (b) NDVI; (c) lithology; (d) distance from towns; (e) groundwater; (f) salinity.
Figure 4.
(a–f) Reclassified layers: (a) distance from streams; (b) NDVI; (c) lithology; (d) distance from towns; (e) groundwater; (f) salinity.

Figure 5.
Workflow in ArcGIS to model stream network, watershed, profile graph and surface volume based on input DEM and pour point.
Figure 5.
Workflow in ArcGIS to model stream network, watershed, profile graph and surface volume based on input DEM and pour point.

Figure 6.
Spatial overlay and comparison of ecological suitability factors. (a) Land texture and stream; (b) Hydrology; (c) NDVI and Salinity; (d) Towns and land elements.
Figure 6.
Spatial overlay and comparison of ecological suitability factors. (a) Land texture and stream; (b) Hydrology; (c) NDVI and Salinity; (d) Towns and land elements.

Figure 7.
Map of potential catchment areas generated by the weighted overlay.

Figure 8.
Assessment of dam locations in areas of high suitability.

Figure 9.
The model of hierarchical dams and their supply pattern.


Table 1.
Screening of regional suitability factors.
| Factors | Selection Basis | The Range of Values after Assignment |
|---|---|---|
| Distance from stream | Reflecting the extent of supply, routes, and water volumes | 3, 4, 5, 7, 9 |
| NDVI Distance from towns Lithology Groundwater Salinity | Reflects plant vigor as affected by rainfall and drought conditions Reflects the accessibility of water to humans Reflecting differences in infiltration rates and water storage capacity Reflecting positive effects on water retention capacity Reflects the potential quality of water storage | 1–9 1–9 1–9 2, 4, 6, 8, 9 1, 2, 3, 4, 6, 8, 9 |
Table 2.
Reclassified layers and their preference value.
| Sl. No | Parameter | Feature Class | Scale Weight | % of Influence |
|---|---|---|---|---|
| 1. | Distance from stream (km) | 2–4 4–6 | 9 7 | 25 |
| 6–8 8–9 | 5 4 | |||
| 0–2 | 3 | |||
| 2. | NDVI | 0.80–1 | 9 | 25 |
| 0.70–0.80 0.60–0.70 0.50–0.60 0.40–0.50 0.30–0.40 0.20–0.30 0.10–0.20 0–0.10 | 8 7 6 5 4 3 2 1 | |||
| 3. | Distance from towns | 6–7 | 9 | 15 |
| (km) | 5–6 | 8 | ||
| 7–8 | 7 | |||
| 8–9 4–5 3–4 2–3 1–2 0–1 | 6 5 4 3 2 1 | |||
| 4. | Lithology | Granite | 9 | 15 |
| Basalt Volcanics Fluvial Lagoonal Fluvial Aeolian Aeolian & Marl Alluvium Sedimentary | 8 7 6 5 4 3 2 1 | |||
| 5. | Groundwater (m) | >50 | 9 | 10 |
| 20–50 10–20 5–10 0–5 | 8 6 4 2 | |||
| 6. | Salinity TDS (mg/L) | A1 (0–600) | 9 | 10 |
| A2 (601–1200) B (1201–3100) C (3101–5400) D (5401–7100) E (7101–10,000) F (>10001) | 8 6 4 3 2 1 |
Table 3.
The volumes of the proposed dam are compared to the original water storage capacity in Barwon.
Table 3.
The volumes of the proposed dam are compared to the original water storage capacity in Barwon.
| Regions. | Volume (ML) | Proposed Dam | Height (M) | Volume (ML) |
|---|---|---|---|---|
| Geelong | 95,324 | Dam1 | 6 | 105 |
| Colac Region Lorne Apollo Bay Gellibrand System | 2654 215 375 60 | Dam2 Dam3 Dam4 Dam5 | 5 5 5 3 | 37,250 7513 4475 30 |
| Total Capacity (ML) | 98,628 | Total Capacity (ML) | 49,373 | |
Publisher’s Note: MDPI stays neutral with regard to jurisdictional claims in published maps and institutional affiliations. |
© 2022 by the authors. Licensee MDPI, Basel, Switzerland. This article is an open access article distributed under the terms and conditions of the Creative Commons Attribution (CC BY) license (https://creativecommons.org/licenses/by/4.0/).
Share and Cite
MDPI and ACS Style
Zhang, S.; Tan, J.; Liu, J.; Wang, J.; Tara, A. Suitability Prediction and Enhancement of Future Water Supply Systems in Barwon Region in Victoria, Australia. Land 2022, 11, 621. https://0-doi-org.brum.beds.ac.uk/10.3390/land11050621
AMA Style
Zhang S, Tan J, Liu J, Wang J, Tara A. Suitability Prediction and Enhancement of Future Water Supply Systems in Barwon Region in Victoria, Australia. Land. 2022; 11(5):621. https://0-doi-org.brum.beds.ac.uk/10.3390/land11050621
Chicago/Turabian StyleZhang, Shihao, Junhe Tan, Junhang Liu, Jiaqi Wang, and Ata Tara. 2022. "Suitability Prediction and Enhancement of Future Water Supply Systems in Barwon Region in Victoria, Australia" Land 11, no. 5: 621. https://0-doi-org.brum.beds.ac.uk/10.3390/land11050621
Note that from the first issue of 2016, this journal uses article numbers instead of page numbers. See further details here.