
Investment Promotion, Tax Competition, and Industrial Land Price in China—Evidence from the Corporate Tax Collection Reform

Center for Research of Private Economy (CRPE), School of Economics, Zhejiang University, Hangzhou 310058, China
*
Author to whom correspondence should be addressed.
Land 2022, 11(5), 682; https://0-doi-org.brum.beds.ac.uk/10.3390/land11050682
Submission received: 23 March 2022
/
Revised: 16 April 2022
/
Accepted: 29 April 2022
/
Published: 4 May 2022
(This article belongs to the Special Issue The Governance of Land Use)
Abstract
:Fiscal arrangements have significant influences on the use of land in China. The tax collection reform in 2002 stipulates that firms establish after the reform are levied by the state tax bureau while those established before the reform continue to be levied by local tax bureaus. The reform divided similar firms into two groups by the date of establishment and created a discontinuity in the tax enforcement for those firms established around the date of the reform. Based on the land transaction data on a parcel basis, we used the regression discontinuity design to study the impact of reform on industrial land prices. We found that the reform has resulted in significant discontinuities in land prices. The firms levied by the state tax authority receive lower land prices relative to the same type of firms that are levied by local tax authorities. The intuition is that tax collection reform has brought an exogenous constraint on local governments’ ability to engage in tax competition. As a countermeasure, local governments use low-cost land as another way to attract investment.
1. Introduction
Understanding local governments’ land transactions is of great significance in understanding Chinese economic development [1]. Globally, land use is also at the core of food security, ecosystem services, and sustainable development [2]. Therefore, the use of land has become an increasingly important policy option for the government in exploring future developments [3]. Investment competition, political competition, and fiscal competition are the keys to determining the use of land in China [4]. Driven by the “promotion tournaments”, land has been used as an important source of promoting investment in China [5,6,7,8]. In addition to political incentives, the use of land is largely influenced by the fiscal arrangement. This is partly because tax and land serve as instruments for investment promotion; the heavy reliance of Chinese local governments on land-leasing revenues is another contributing factor [9,10].
In recent years, the fiscal power has been increasingly centralized in China. One of the most noteworthy arrangements is that the central tax bureau’s right in tax collection has been continuously strengthened. Before the fiscal reforms in 1994, there were only local tax authorities. In 1994, the central taxation authority was established to collect taxes for the central government. In the 2002 reform, the government changed the tax collection agency of income tax from the local tax authorities to the central tax authority. In 2018, the local tax authorities were abolished, and all taxes were collected by the central taxation authority. Because the central tax authority and the local tax authority are different in management and incentives, the enforcement of tax collection changed. As an informal method of adjusting effective tax rates [11,12], the government can change the effective tax rates without altering the statutory tax rates by adjusting the intensity of tax enforcement and hence competing for mobile capital [13,14]. Most existing studies have focused on the impact of tax collection on tax enforcement and the tax competition [15]; some have used the reform of tax collection as an exogenous shock on effective tax rates [16]. However, few have noticed the role of tax collection reform in shaping the use of land for promoting investment in China. Our research fills the gap in this regard.
A major challenge in identifying the responses of land price to the regulation of tax collection is that the land price is endogenous, as a number of unobserved dimensions may simultaneously affect the choice of local government and land prices. For example, to the extent that the less developed regions are more likely to employ a strategy of tax competition than their more developed counterparts, the former would have lower land prices independent of changes in tax competition. More generally, the unobserved year-over-year changes in the local economy may affect both land prices and local government’s behavior. The reform in 2002 has brought an exogenous shock to the regulation of tax collection, providing us with an opportunity to separate the variation in land prices and tax collection.
On 31 December 2001, China implemented a reform of tax collection for all enterprises established after 1 January 2002, shifting the collection of corporate income tax (CIT) from the local taxation authority to the central taxation authority. The change in taxation authority applied to firms established after 1 January 2002. Namely, the reform divides similar enterprises into two groups according to their establishment date. The central tax authority levies taxes from one group, and the local taxation authority collects taxes from the other group. The tax collection reform has changed local governments’ ability to engage in tax competition, thus changing their willingness to attract investment by land. It offers a unique opportunity to compare local governments’ strategy of land supply among firms with different tax competition restrictions.
The use of RDD provides several advantages. First, the RDD compares firms established within a narrow time window around the cut-off date, preventing the identification problem caused by industrial structure, government financial pressures, or firm characteristics. Second, the tax-sharing reform only impacts private and collective firms, allowing us to use state-owned and foreign firms as a control experiment. Third, the establishment date can be different from the date of land transfer. This trait further rules out the problem of common trends. We assessed the robustness of the RDD results in the following ways. First, this study examined the number of firms established around the date of reform. As mentioned, a key requirement for identification was that the firms established shortly before and after the reform must be comparable. This requirement could be invalid if some firms had strategically selected their establishment date in response to the reform. Second, firms in the treatment groups and control groups should not have discontinuities in the covariates; otherwise, the discontinuity in the outcome variable may be caused by the covariates—for example, firm size. Therefore, this study examined whether there are discontinuities in the covariates. Third, our analysis was based on the assumption that the tax collection reform drives land price discontinuities. If the discontinuity can be observed in other time windows or in the placebo sample, it is reasonable to suspect that reform may not be the reason for the discontinuity. Therefore, we performed a placebo test on SOEs, FOEs, and cut-off dates. Fourth, China joined the WTO in November 2001, shortly before the reform. Local governments can use the land as a tool to promote export, introducing an alternative explanation for the discontinuities. We also checked this. Finally, tax enforcement may change the financial constraints of businesses, which could make land unaffordable, eventually leading to lower land prices. Therefore, we also discuss alternative explanations of financial constraints.
Over the past decades, the transaction of industrial land has emerged as one of the most feasible options for investment promotion in China. Local governments in those developing countries often enjoy more flexibility in managing their land assets than they do in adjusting tax rates [17]. The tendency for more stringent regulation of tax collection resulted in the local governments’ ability with regard to tax competition decreasing. However, little is known about its potentially important impact on the land market, which is another instrument for investment promotion in China. Our work fills the gap in this regard. Second, we also highlight the impact of fiscal arrangement on the use of land through the lens of investment promotion. The impact of fiscal arrangement on the use of land has been documented in the literature. However, most literature studies the impact of the tax system on the land transaction from the perspective of land finance [4,18,19,20]. For example, the financial pressures brought about by fiscal decentralization have led to local governments using the land illegally [19]. The fiscal transfers and fiscal decentralization significantly influenced the strategy of the land transaction [18]. The proportion of industrial land varies in the land supply when the fiscal incentives changes [20]. Their logic is that the changes in the fiscal arrangement have changed the fiscal condition of the local government. Therefore, the local governments use the land rent, especially the rent of commercial land and residential land, as another source of fiscal revenue. The strict division of land allows local governments to apply different strategies to the separate land markets. Another important usage of the land, especially the industrial land, is to promote investment. This study fills the gap in the literature by studying the impact of the finance arrangement on land use from the aspect of investment promotion.
The rest of this paper is organized as follows. Section 2 presents the policy background and related literature. Section 3 explains the empirical methodology and describes the data. Section 4 and Section 5 present the results of the baseline model, mechanisms, robustness checks, and alternative explanations. The last section presents the conclusion.
2. Policy Background and Literature Review
2.1. Policy Background
2.1.1. China’s Fiscal System and Tax Collection System Reform
After 1949, China implemented a number of fiscal reforms. With the changes in the fiscal system, the tax collection system has also undergone several reforms. Before the tax-sharing system reform in 1994, China implemented a financial contract system. It is characterized by decentralizing powers of revenue and expenditure. In the financial contract system, local governments manage their own tax collection and fiscal spending; they need only to turn over a certain proportion of income to the central government. Therefore, China had only the local taxation authority; the local taxation authority collected all tax revenue. Since local governments are in charge of the tax collection, they can manipulate the tax collection and collude with firms [21]. The fiscal power of the central government was dampened [22].
To reassert the central government’s fiscal control over local governments, the Chinese central government implemented a tax-sharing reform in 1994. The reform divides taxes into central, local and shared taxes. The revenue of central and local taxes belongs to the central and local governments, respectively. Shared tax revenue is shared proportionally by the central and local governments. In addition, the central taxation authority was established to collect taxes for the central government. China’s political system has a strict hierarchy. The motivations and actions of local tax authorities and central tax authorities are very different. The local taxation authority is supervised by the local government; they have incentives to cooperate with the local officials to attract investment by controlling the effort of tax enforcement. In contrast, the central government supervises the central taxation authority, and the tax enforcement of the central tax authority is less likely to be affected by the local government [23]. The establishment of the central taxation authority completely changed the plight that the central government entirely relied on local taxation authorities and prevented local governments from intervening in tax enforcement [24]. After the reform in 1994, the Chinese central government also implemented several reforms to strengthen its fiscal power.
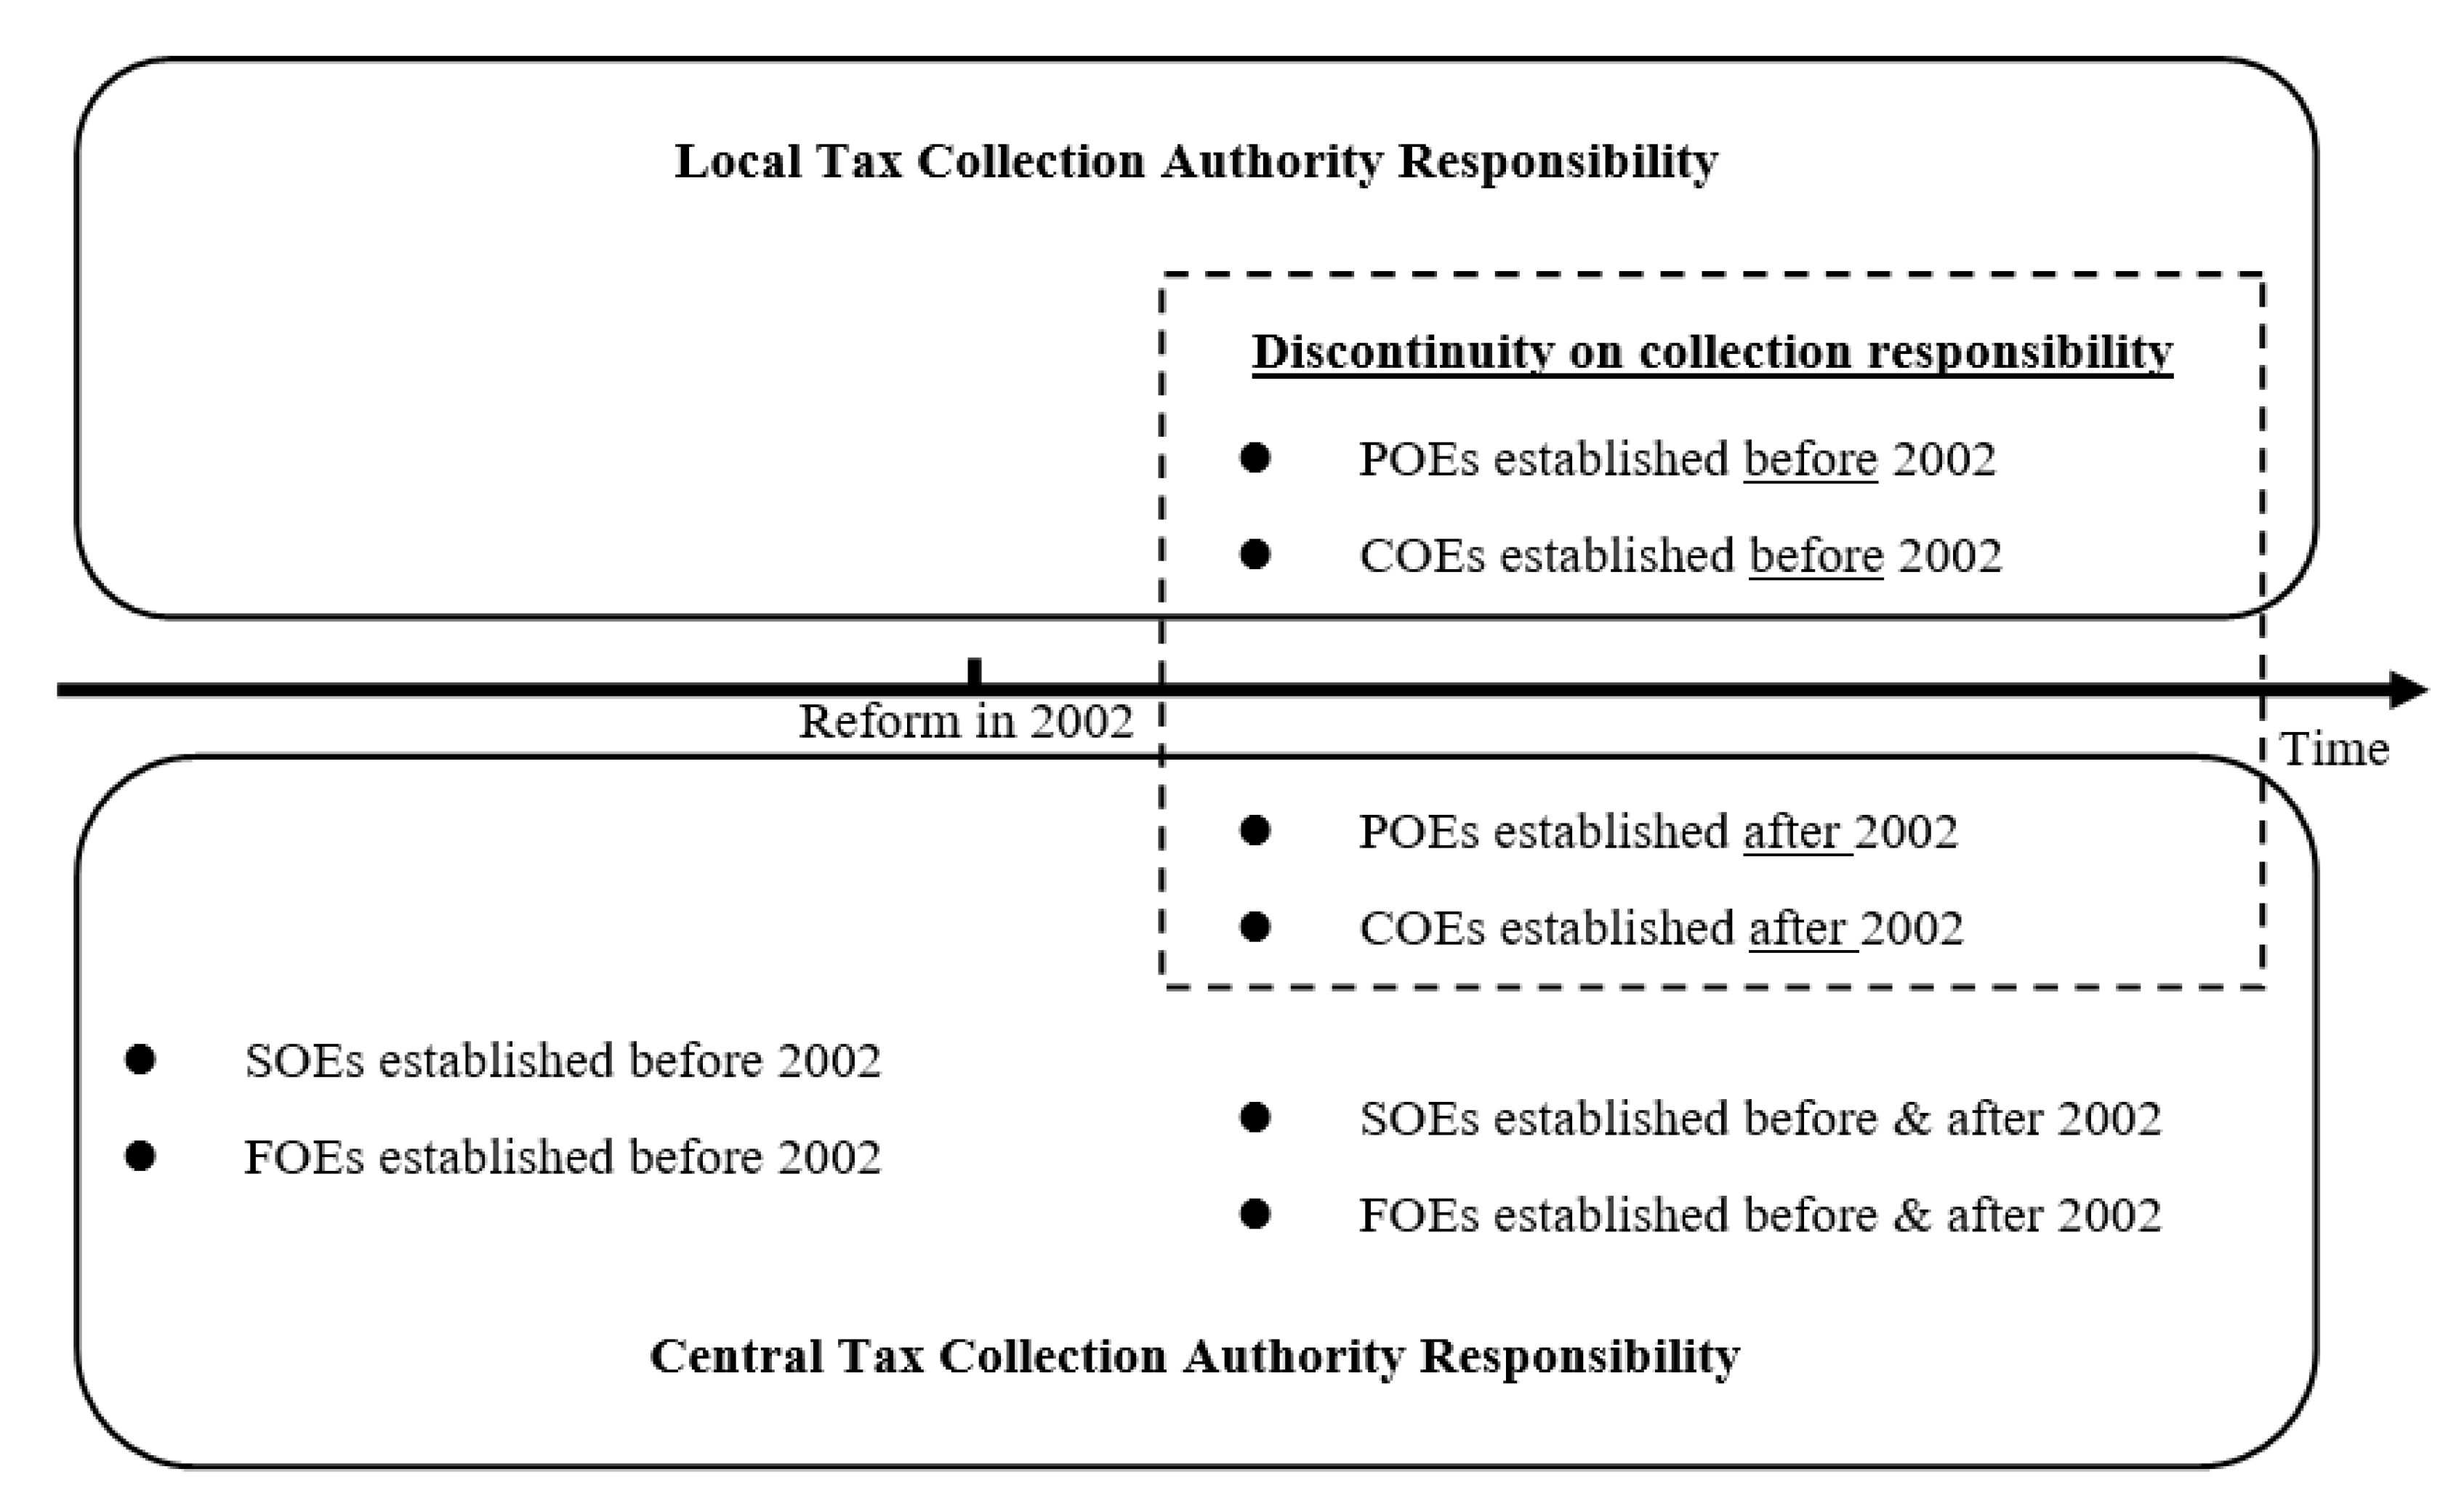
This study is based on the tax collection reform of corporate income tax in 2002. Before the reform, local authorities levied the income tax on POEs (private-owned enterprises) and COEs (collective-owned enterprises); the central authority levied the income tax of SOEs (state-owned enterprises) and FOEs (foreign-owned enterprises) (see the left side of Figure 1). After the reform, the income tax of all newly established firms is collected by the central tax authority, regardless of the firm type. The tax collection responsibility of the firm established before 2002 remains the same (see the right side of Figure 1). The reform prompted a change in the tax collection authority for POEs and COEs based on the date of establishment. The POEs and COEs established before 2002 are levied by the local authorities, and the POEs and COEs established after 2002 are levied by the central authority1. Therefore, similar enterprises with different establishment dates have different taxing authorities. POEs, COEs, SOEs, and FOEs are different in terms of firm ownership. For example, the POE is a private company, an enterprise where privately owned assets invest more than 50% of the shares. Because this study compares firms with the same ownerships (POEs and COEs), the firm’s ownerships should not affect the identification.
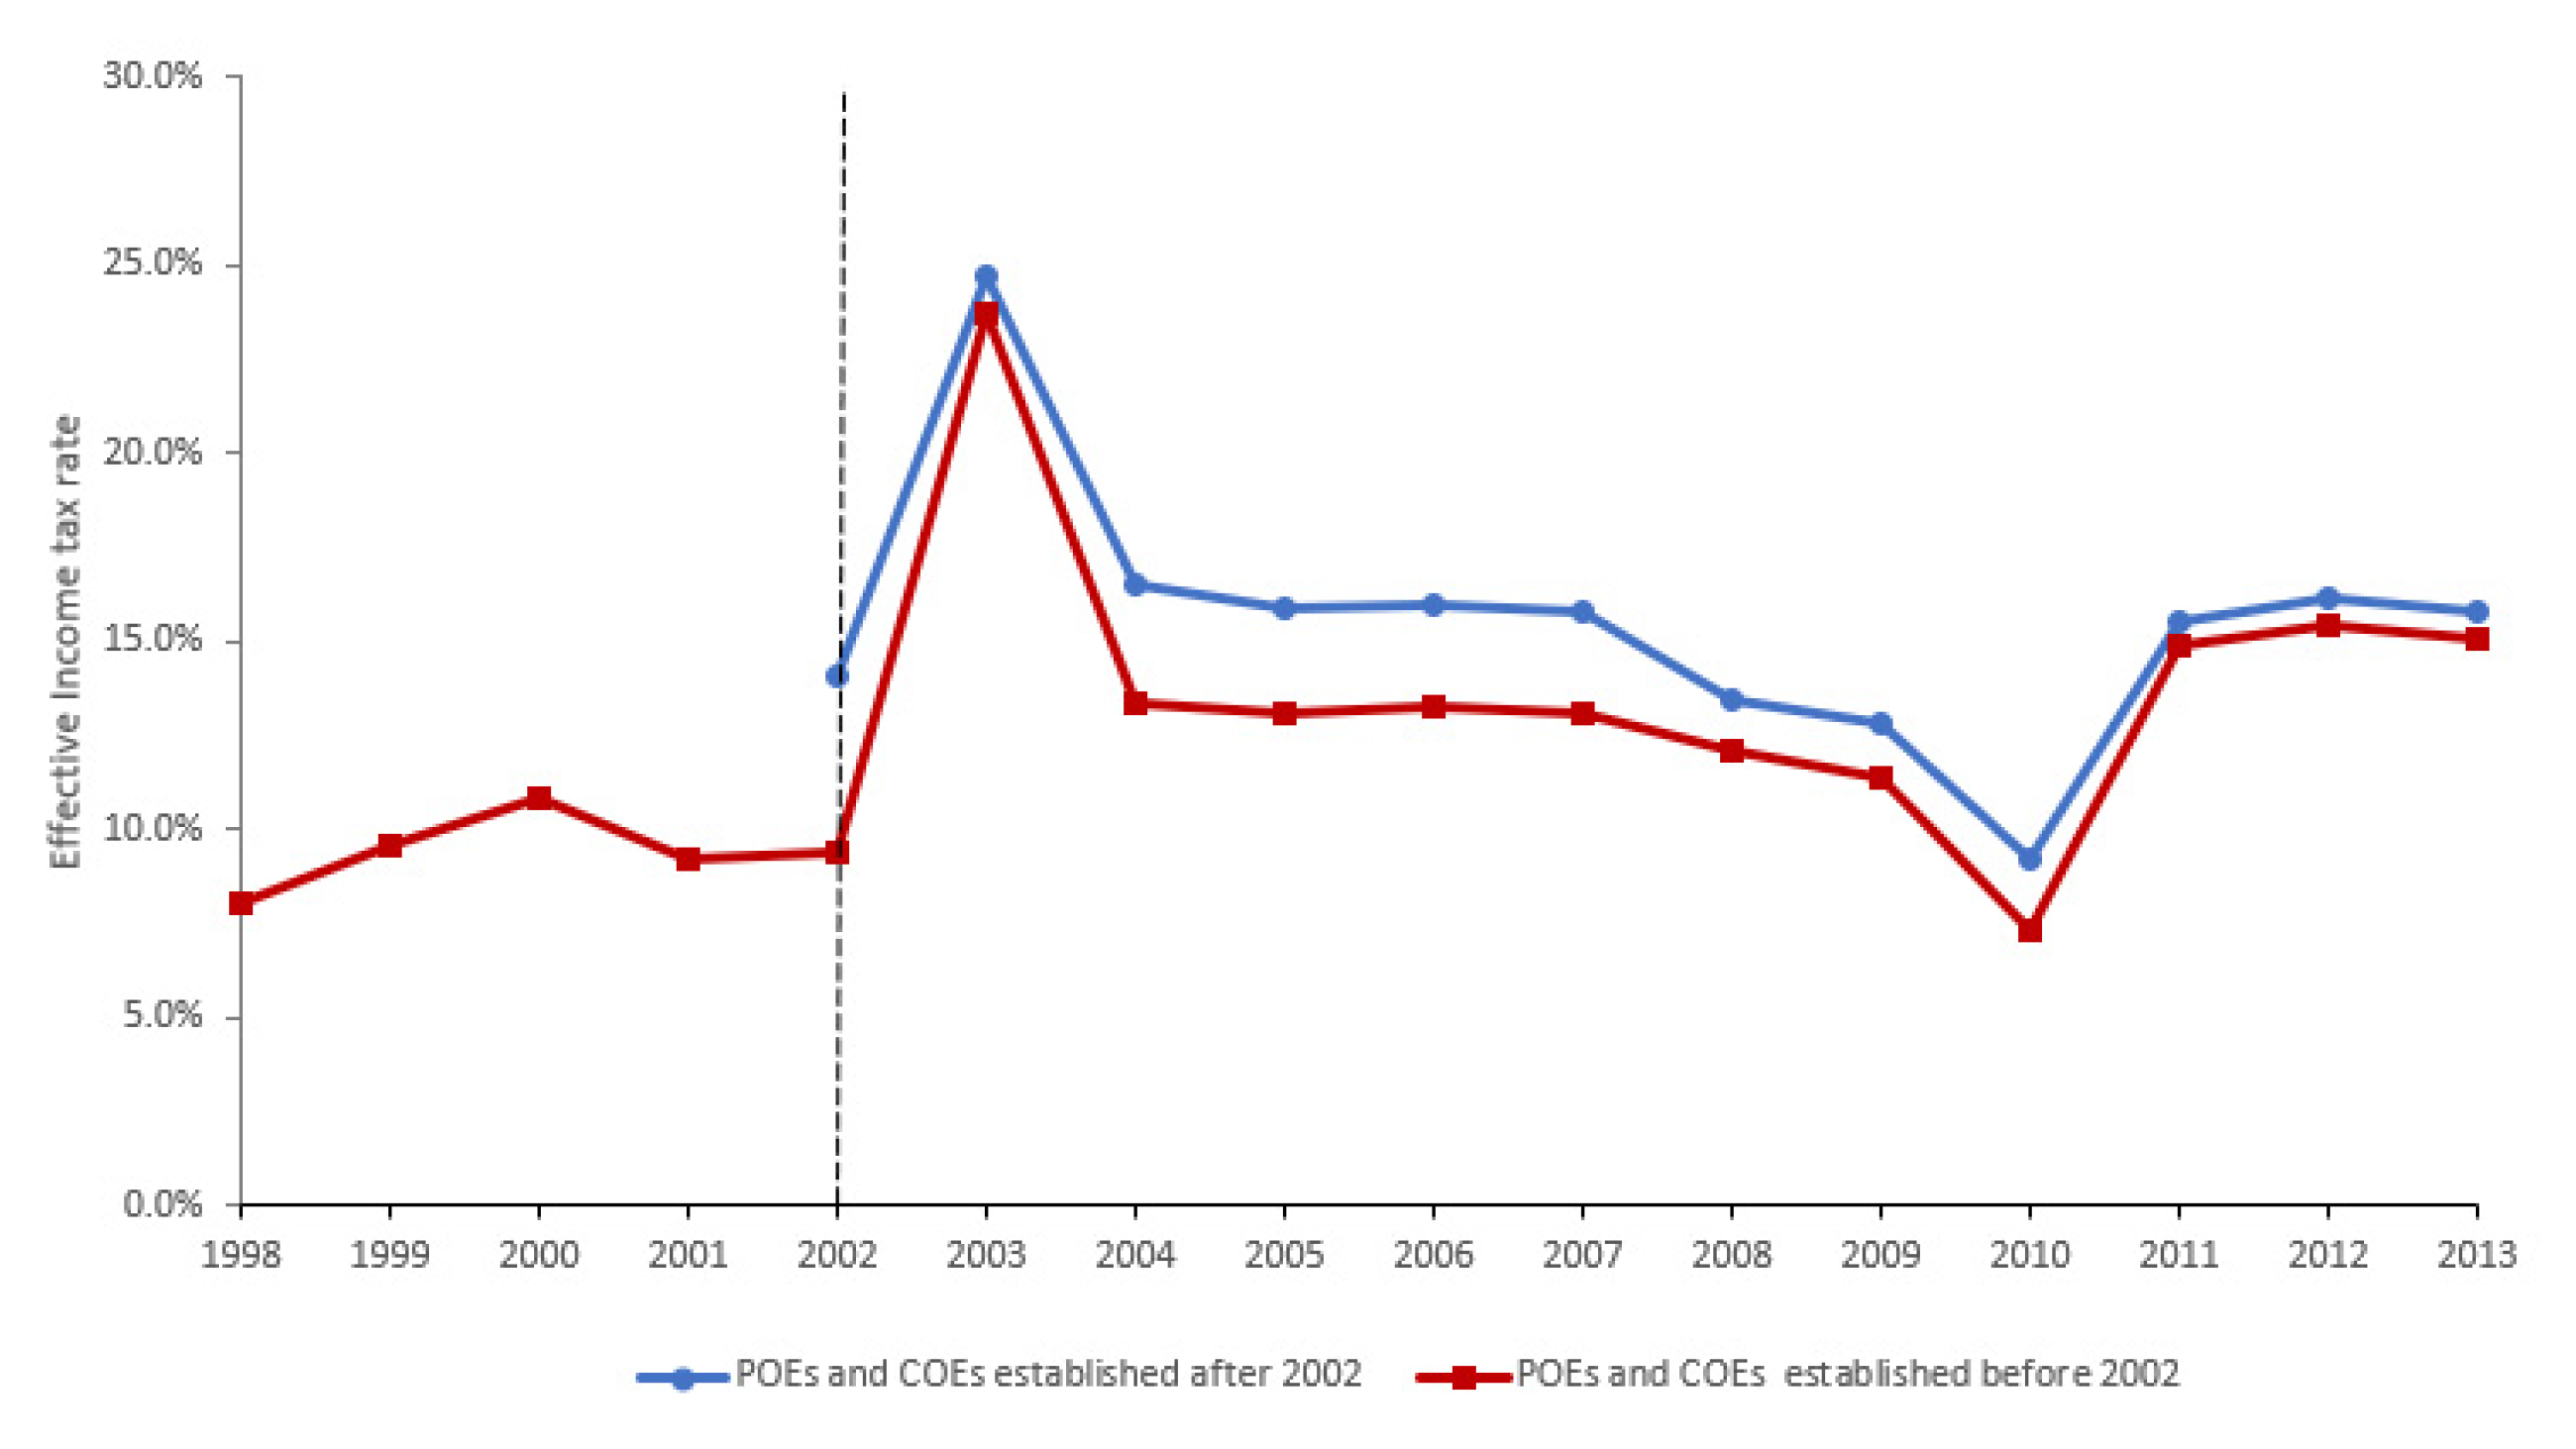
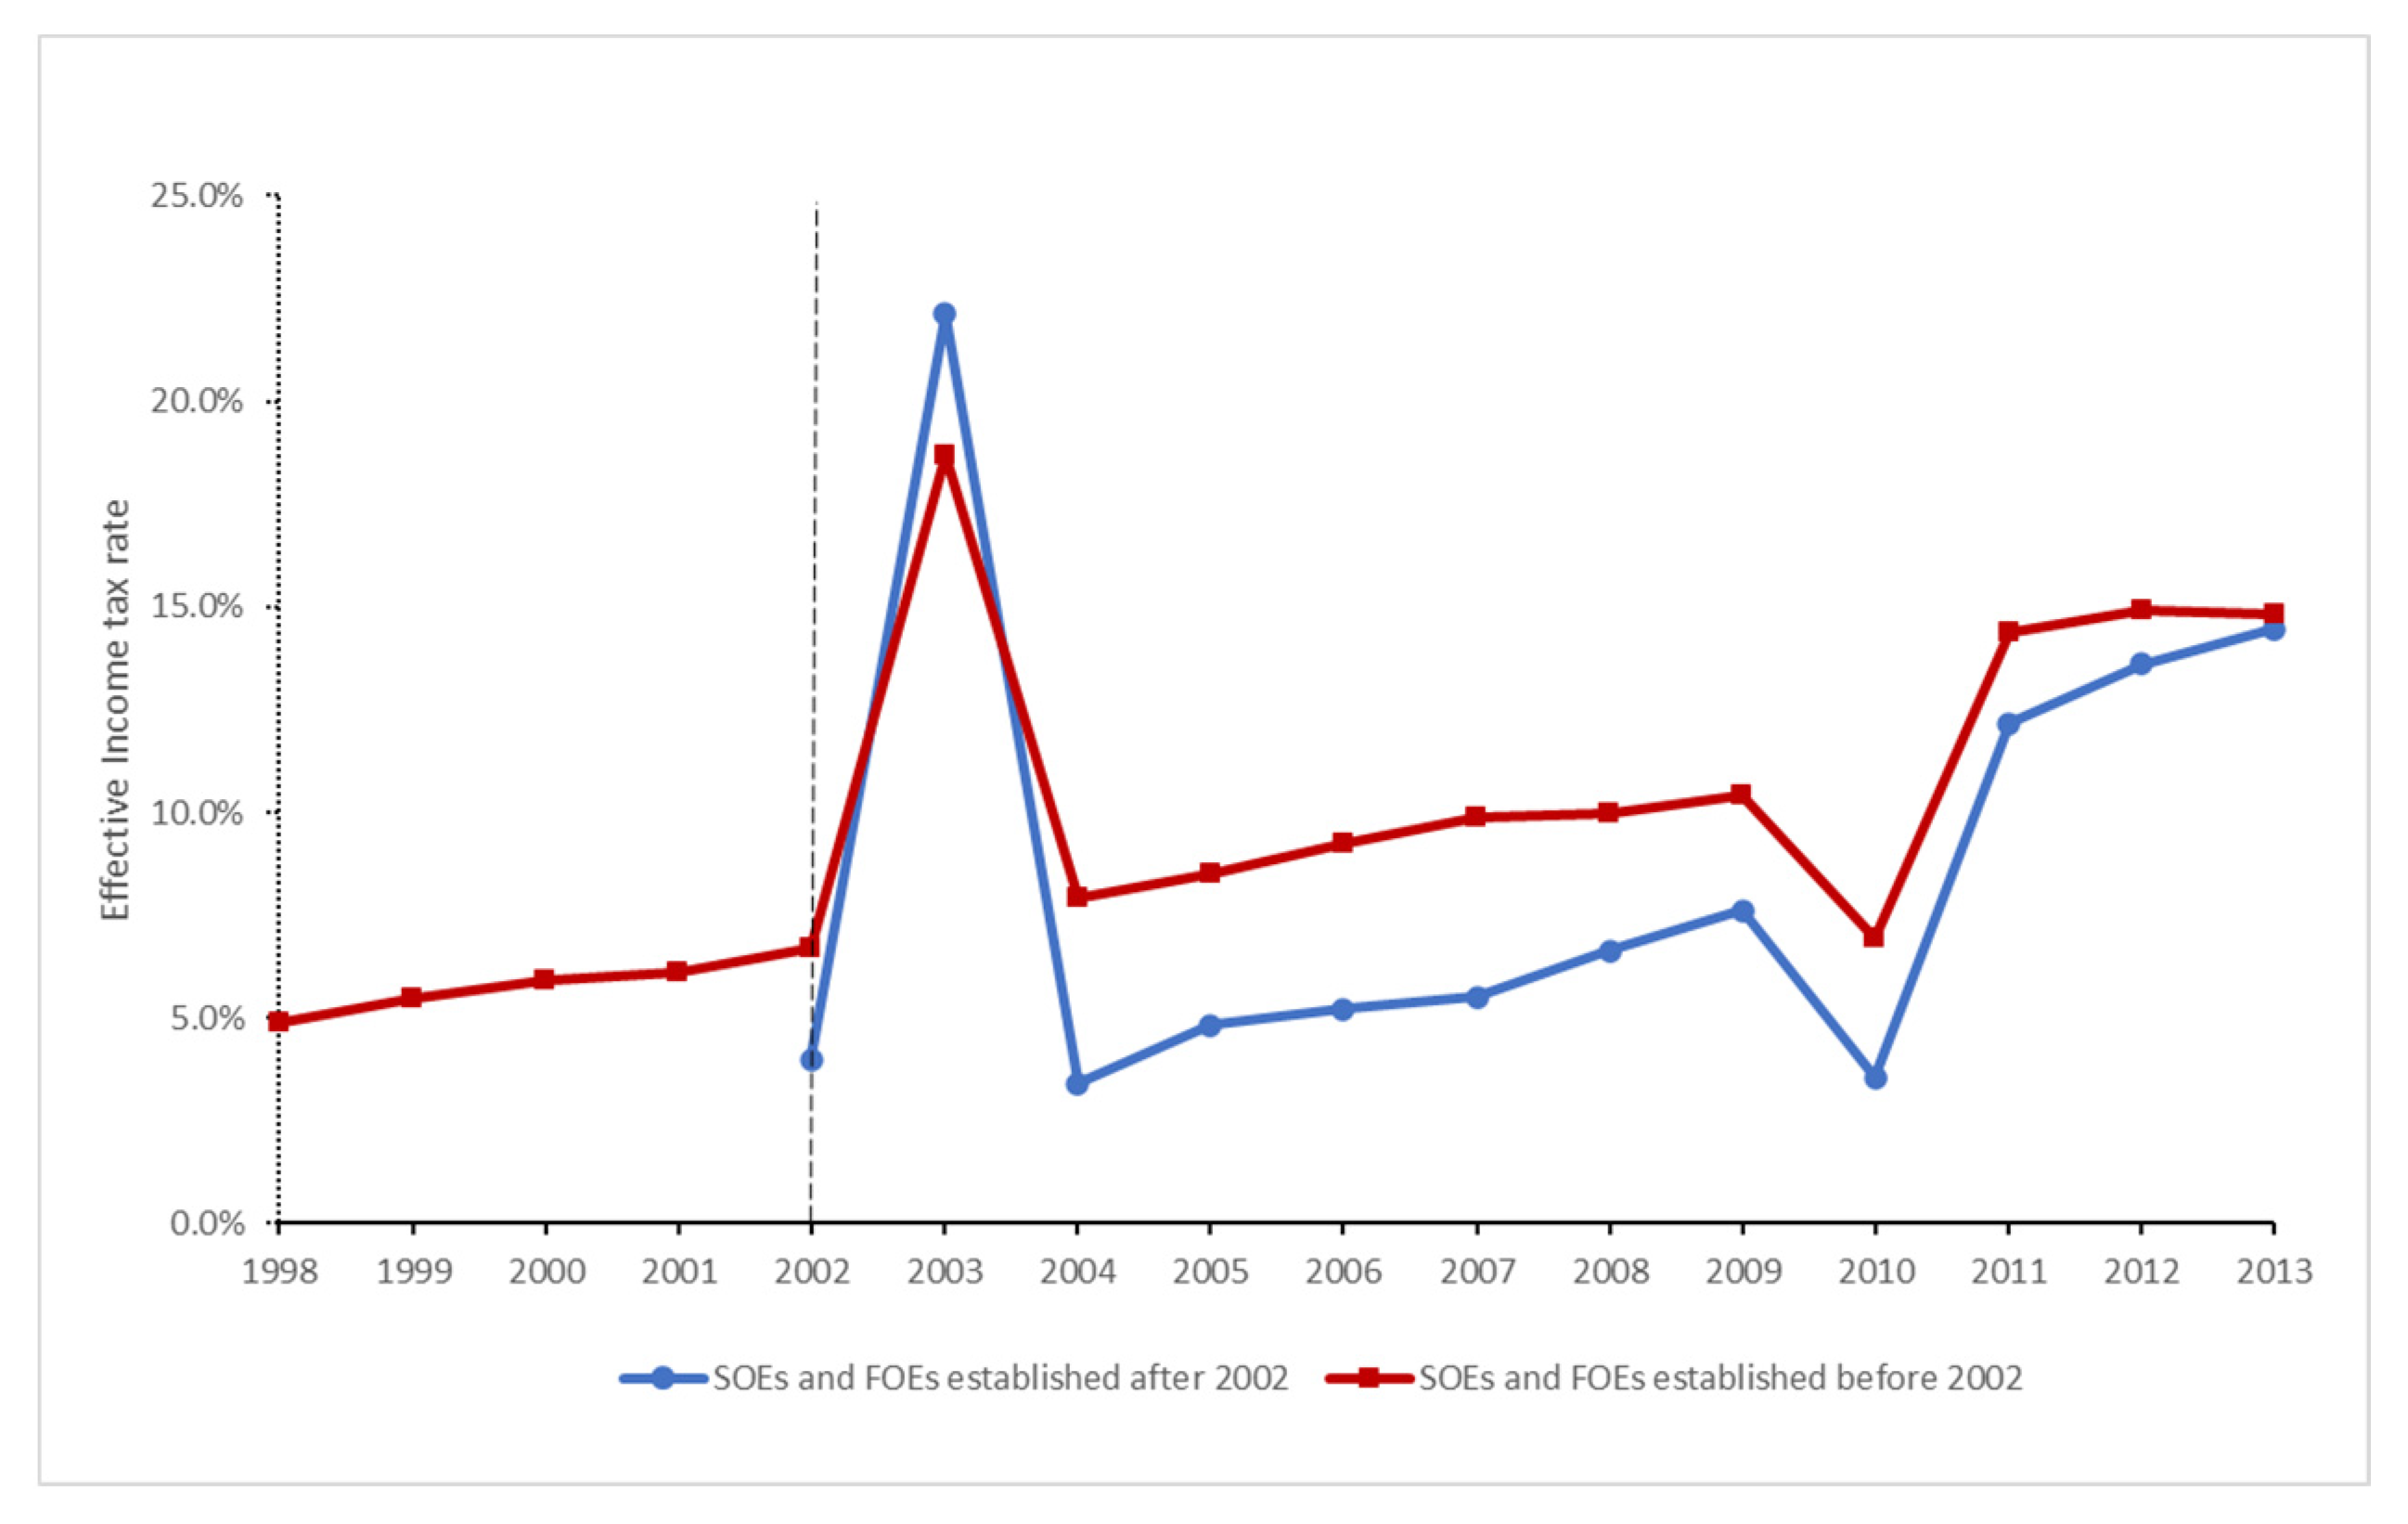
Figure 2 shows the effective income tax rate for POEs and COEs established pre-reform and postreform, respectively. The line with the circle symbol reflects the average effective income tax rate for pre-reform entrants, collected by local authorities. The line with square signs depicts the corresponding average value for postreform entrants, collected by the central authority. Figure 2 shows that the effective income tax rate of the former continues to be lower. This result indicated that the change in tax collection authority has constrained local governments’ ability to engage in tax competition, making the postreform entrants that are levied by the central tax authority receive higher effective tax rates. Figure 3 also plots the average effective corporate income tax rate for SOEs and FOEs. However, a similar pattern does not exist in the SOEs and FOEs that the central authority has been collecting.
2.1.2. Industrial Land Market and Local Government Strategic Choice
The land-use rights transactions in China’s land market are limited in duration. The land is not private property and can only be rented out for a limited period of time. China’s land market has a primary land market and a secondary land market, of which the primary land market is the transfer of land-use rights from the government (owner of the property) to firms by means of leasing. The secondary market includes the transfer, lease and mortgage of land-use rights between firms or individuals. If a firm leased the land from the local government, the company could release the land to a third party only if the terms of the lease contract drawn up by the company and the government were met.
The land-use-right transaction regulation in China stipulates that land transfer must be done through English auction (Paimai), two-stage auction (Guapai), and tender (Zhaobiao). In the English auction, bidders conduct public bidding at a designated time and place. The land user is determined according to the result of the bidding. The two-stage auction and the tender give local governments more room to choose bidders [25,26]. The two-stage auction and the tender require the local government to issue a transfer announcement before bidding. In the announcement, the local government should list the requirements of bidders. The local government will then accept bid applications from qualified bidders. By setting the bidding qualification, local governments can screen some bidders when transferring land through the two-stage auction and the tender. Therefore, the firm selected by the local government can acquire the land at a lower price [25,26,27].
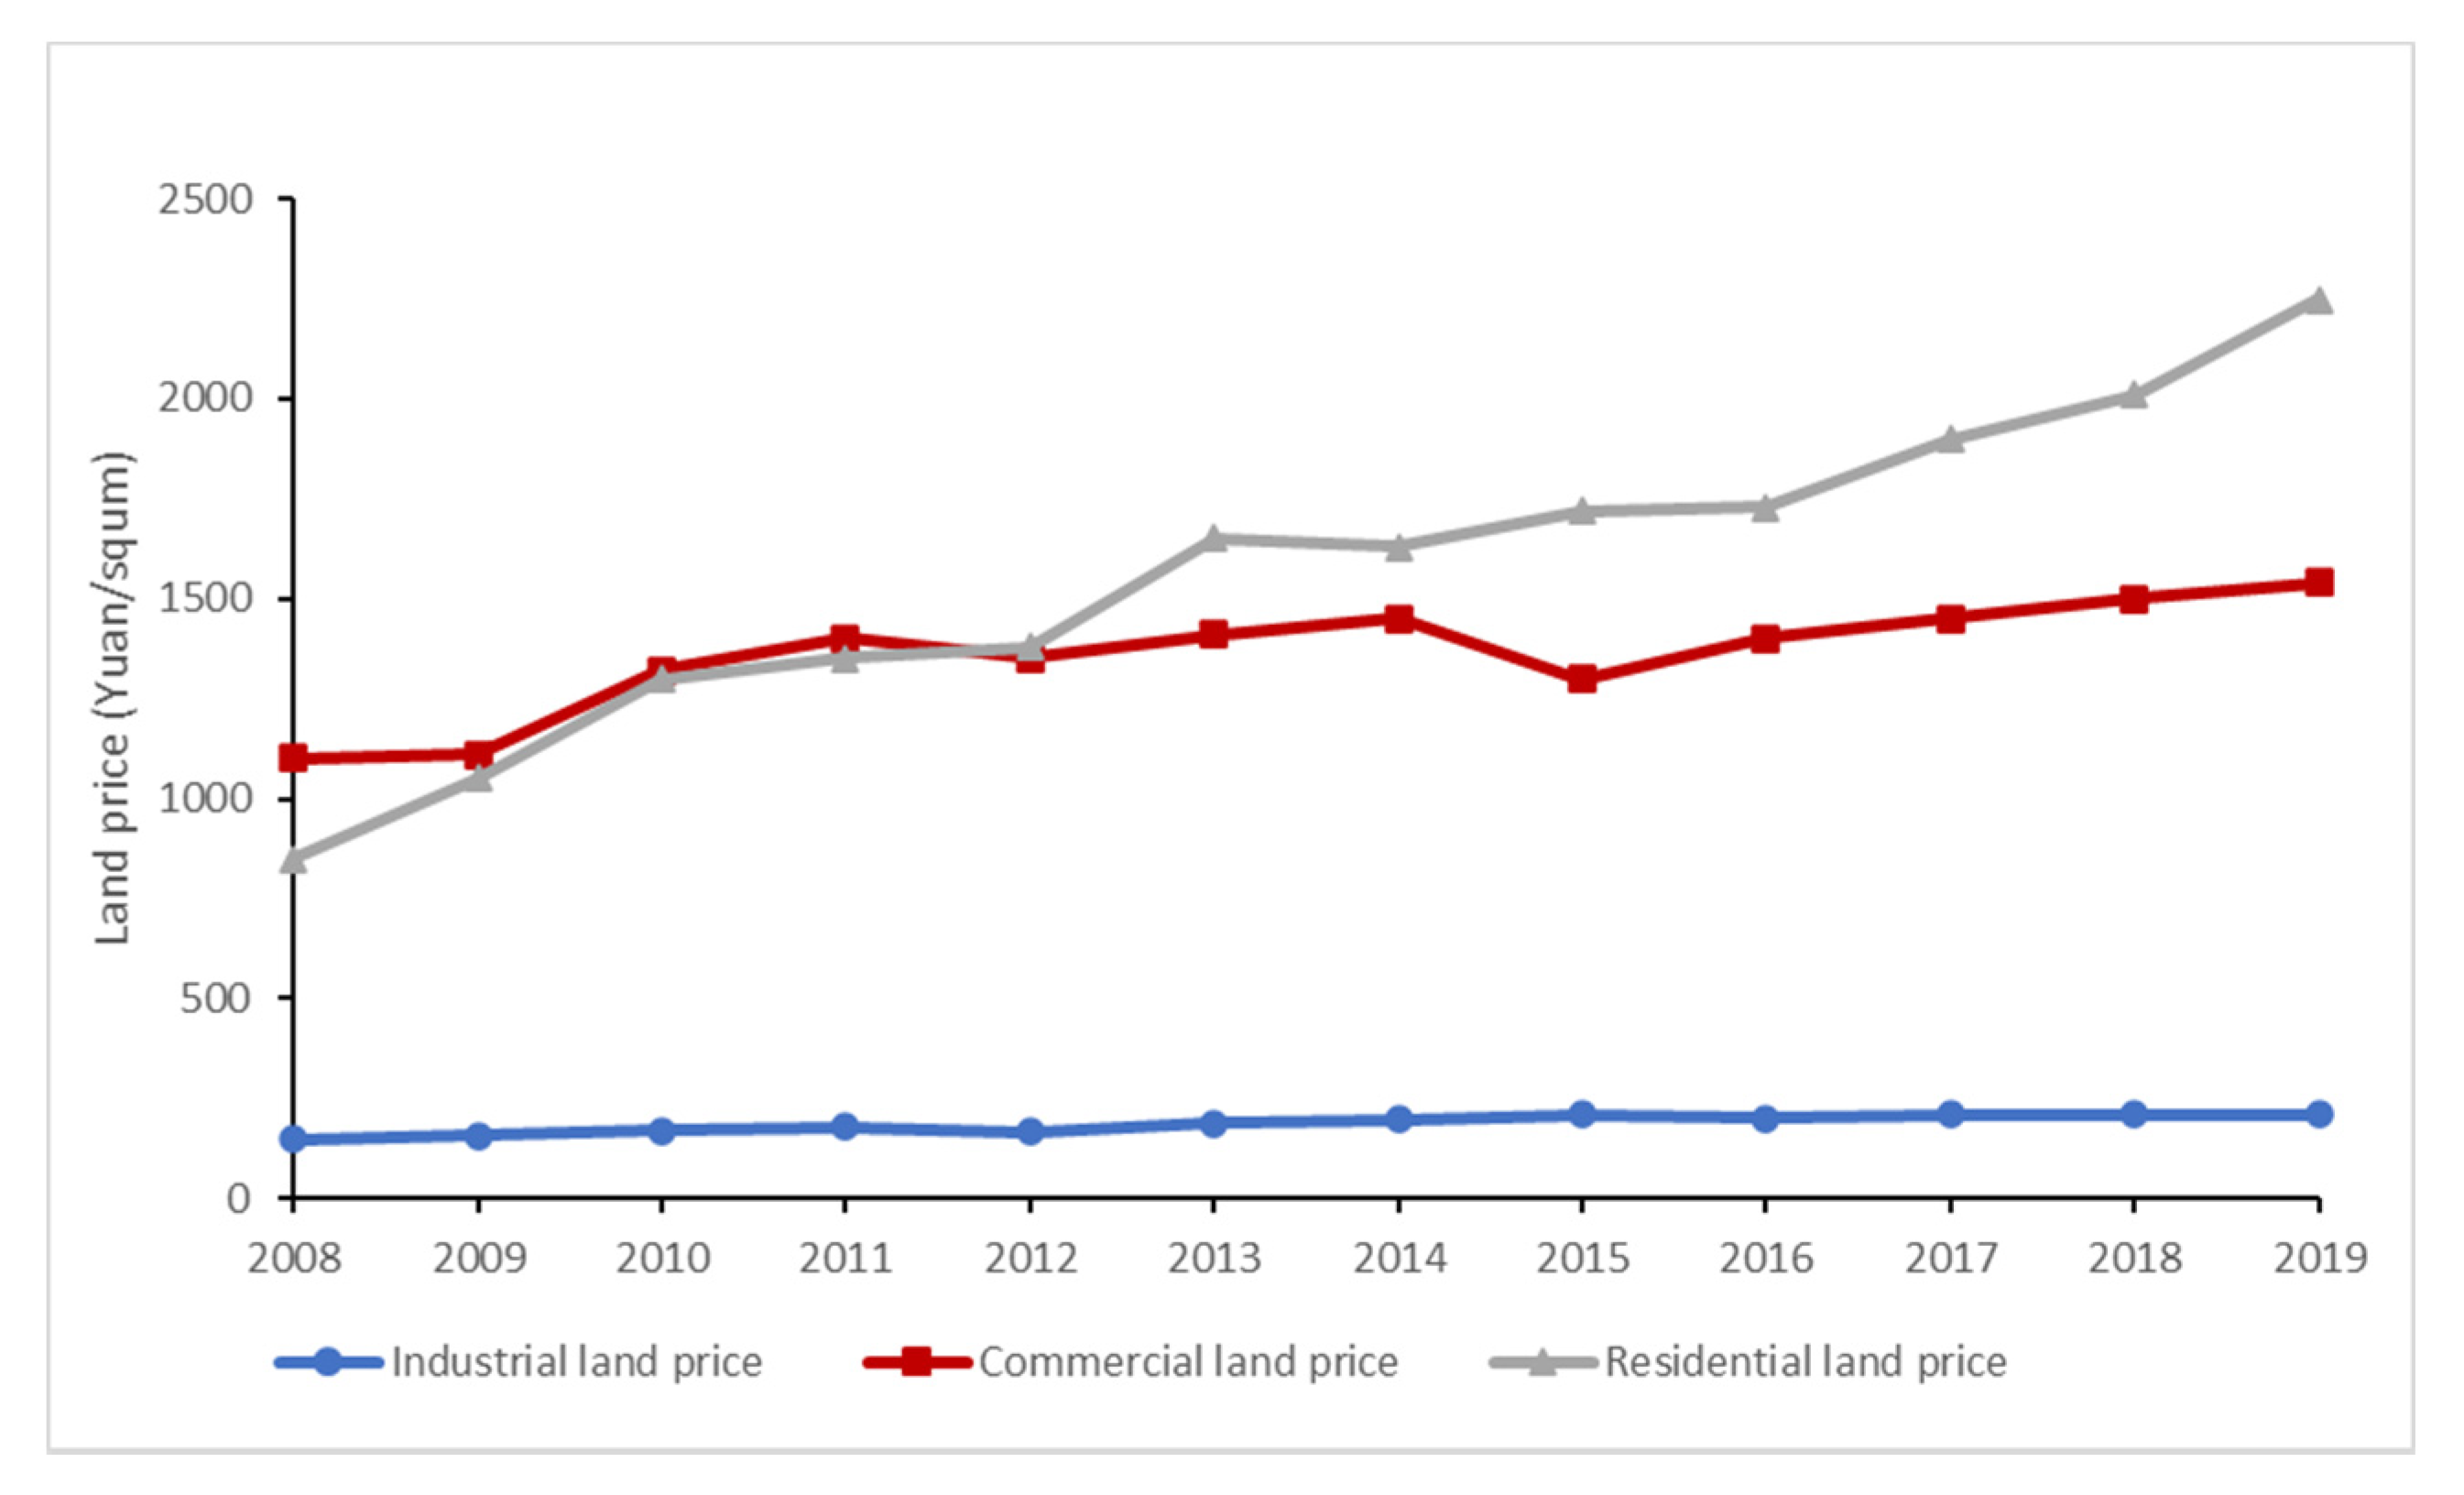
In China, industrial land can only be used for production-related sites. Residential buildings and commercial facilities can only be built on residential and commercial land. The use of industrial land to attract investment has resulted in the price of industrial land being seriously lower than the market value. Figure 4 shows the average price of different types of land in China from 2008 to 2019. The line with the circle symbols reflects the average price of industrial land. Lines with square and triangle symbols depict the average price of commercial land and residential land. As can be seen from the figure, the price of industrial land continues to be lower than that of commercial and residential land, as does the growth rate of land prices. In 2019, the average residential land price was approximately 2000 yuan/sqm. Average prices rose 9.2% annually from 2008 to 2019. However, the average price of industrial land in 2019 was less than 300 yuan/square meter, and the average price from 2008 to 2019 rose by only 3.2%.
2.2. Literature Review
Our study involves the literature on using taxes and land as the instruments for investment promotion. Assuming that capital is fully mobile, when the government raises the tax rate, the net rate of return on capital located there falls, and capital chooses to migrate elsewhere [28]. There is fierce and tacit cross-jurisdictional tax competition in China [29]. Local governments usually adjust the effective tax rates for their interests by adjusting the effort of tax enforcement. Although corporate income tax revenue has increased rapidly, enforcement and collection of corporate income tax are still relatively weak [30]. The statutory tax rates ignore the complexity of tax credits, tax exemptions, tax deductions, tax enforcement and tax planning [31]. Unless regional governments acquire legal power, the opaque competition in enforcement policies appears more practical than a transparent competition in statutory tax parameters [14]. In addition to investment promotion, local governments adjust the intensity of tax enforcement for various purposes. Chen investigated the impact of the abolition of agricultural taxes on county governments’ incentives for tax enforcement [13]. He found that the county’s revenue losses were offset mainly by stricter tax enforcement. Based on the exogenous shock of China’s income tax sharing reform, research finds that local governments will increase tax enforcement on local business tax and surcharges (BTS) to offset the adverse fiscal shock [32].
The second strand is the literature on using land as a policy instrument. Several studies have documented that transferring industrial land at a low price is a policy tool to attract investment. Land supply rules in China allow local governments to adopt specific development strategies [25,26,27]. The low-cost land provided by the local government has created favorable conditions for enterprises, thereby promoting growth [33]. Therefore, local governments can strategically influence land prices for their benefit [34,35]. In addition to land prices, local governments also use the amount of land transferred as a policy tool. For example, some studies have found that local governments prefer to provide more industrial land to promote firm investment. This strategy leads to short-term growth but causes severe environmental quality losses [36,37]. A study focusing on spatial dislocation has found that an imbalanced increase in land supply leads to decreased innovation productivity [38].
3. Model Specification and Data
3.1. Data and Sample
The first dataset we used was the dataset of land transaction2, which provides wide-ranging information on land transactions in China. We used land transactions from 1999 to 2008. We chose this period because China adopted the tax reform of value-added tax (VAT) in 20093. Considering that RDD investigates the price discontinuities around the cut-off date, a ten-year dataset was sufficient for the study. We only keep the transaction of industrial land. The abnormal samples with negative transaction prices and areas are deleted.
The second dataset we used was the Database of Industrial Enterprises from 1998 to 2008. Referring to existing research, we removed the incorrect samples with a negative gross output value, sales revenue, fixed assets, number of employees, and the date of establishment. Additionally, we deleted the enterprises established earlier than 1990, when China’s marketization reform was still brewing. We match the two datasets according to the company name. In this study, we obtained a dataset that matched the firm and land information. In addition, the research truncates land transactions (bottom 2.5% and top 2.5%) along the dimension of land price. Finally, our dataset consisted of 12,531 transactions.
3.2. Model Specification
Regression-discontinuity design (RDD) draws on a set of continuous numeric data [39], which is the date of establishment in this article. All units with an assignment variable value of at least c were assigned to the treatment group, and all units with an assignment value less than c were assigned to the control group. The 2002 reform divided firms into treatment groups and control groups based on the establishment date. Firms established before 1 January 2002 composed the control group; their fees were collected by local authorities. Firms established after 1 January 2002 composed the treatment group; their fees were collected by the central authority. Accordingly, similar firms that differ in the establishment date are taxed by different tax collection authorities.
The RDD compares the outcome (land prices) of the control group and treatment group. Because firm characteristics vary by establishment date, old entrants may be larger due to experience. Therefore, we cannot compare new entrants with older ones directly. However, in the absence of the 2002 reform, we should expect the difference between new and old entrants to shrink when we compare firms established shortly before and after the cut-off date. This feature naturally leads to regression discontinuous design. The logic of using RDD was that the exogenous reform divides companies into two groups around the cut-off date. By comparing the two groups of samples within a narrower window, we can exclude the influence of other factors. The discontinuity on the outcome variable can be attributed to the exogenous reform.
The cut-off date defined here was 1 January 2002. The POEs and COEs established after the cut-off date compose the treatment group. The control group was POEs and COEs established before the cut-off date, to whom the local government can adjust the intensity of tax enforcement. This article first used a nonparametric RDD. To avoid the “typical” point estimate problem, we explored the sensitivity of the results to a range of bandwidths and covariates. In addition, we compared the result of the nonparametric RDD with the result of multivariate regression as a robustness check4 [29,40]. Here, we used the multivariate regression discontinuity model developed by Saez [41]. The effect of tax collection reform is identified by the following regression Model (1):
In the above expression, is the independent variable. is a dummy variable that equals 1, representing that firm i is the private or collective firm established after 1 January 2002. is the coefficient that captures the discontinuity effect. is the month of establishment date deviated from the cut-off date. We included to control for the effect of establishment date on outcome in a flexible way. The tax collection reform restructures tax enforcement from a local level to a central level. The tax enforcement of the treatment group, which is taxed by the central taxation authority, was relatively stronger. Since the motivation of investment attraction remains the same, we expect local governments to lower land prices as an alternative tool to attract investment. Since the local government is expected to lower the land price, the coefficient is negative. Additionally, local governments generally prefer some firms with certain traits. For example, local governments often prefer larger companies which may contribute more tax revenue. Typically, firms in some industries benefit from preferential policies for promoting local industrial development. Accordingly, this article controls for the firm size, the firm age, corporate income tax revenue, and the value-added revenue. Furthermore, we control the time fixed-effect and the industry fixed-effect on two digits. See Table 1 for the variable definitions and summary statistics. The correlation matrix of the variables is in the Appendix A.
4. Empirical Analysis and the Impact Mechanism
4.1. The Graphical Evidence
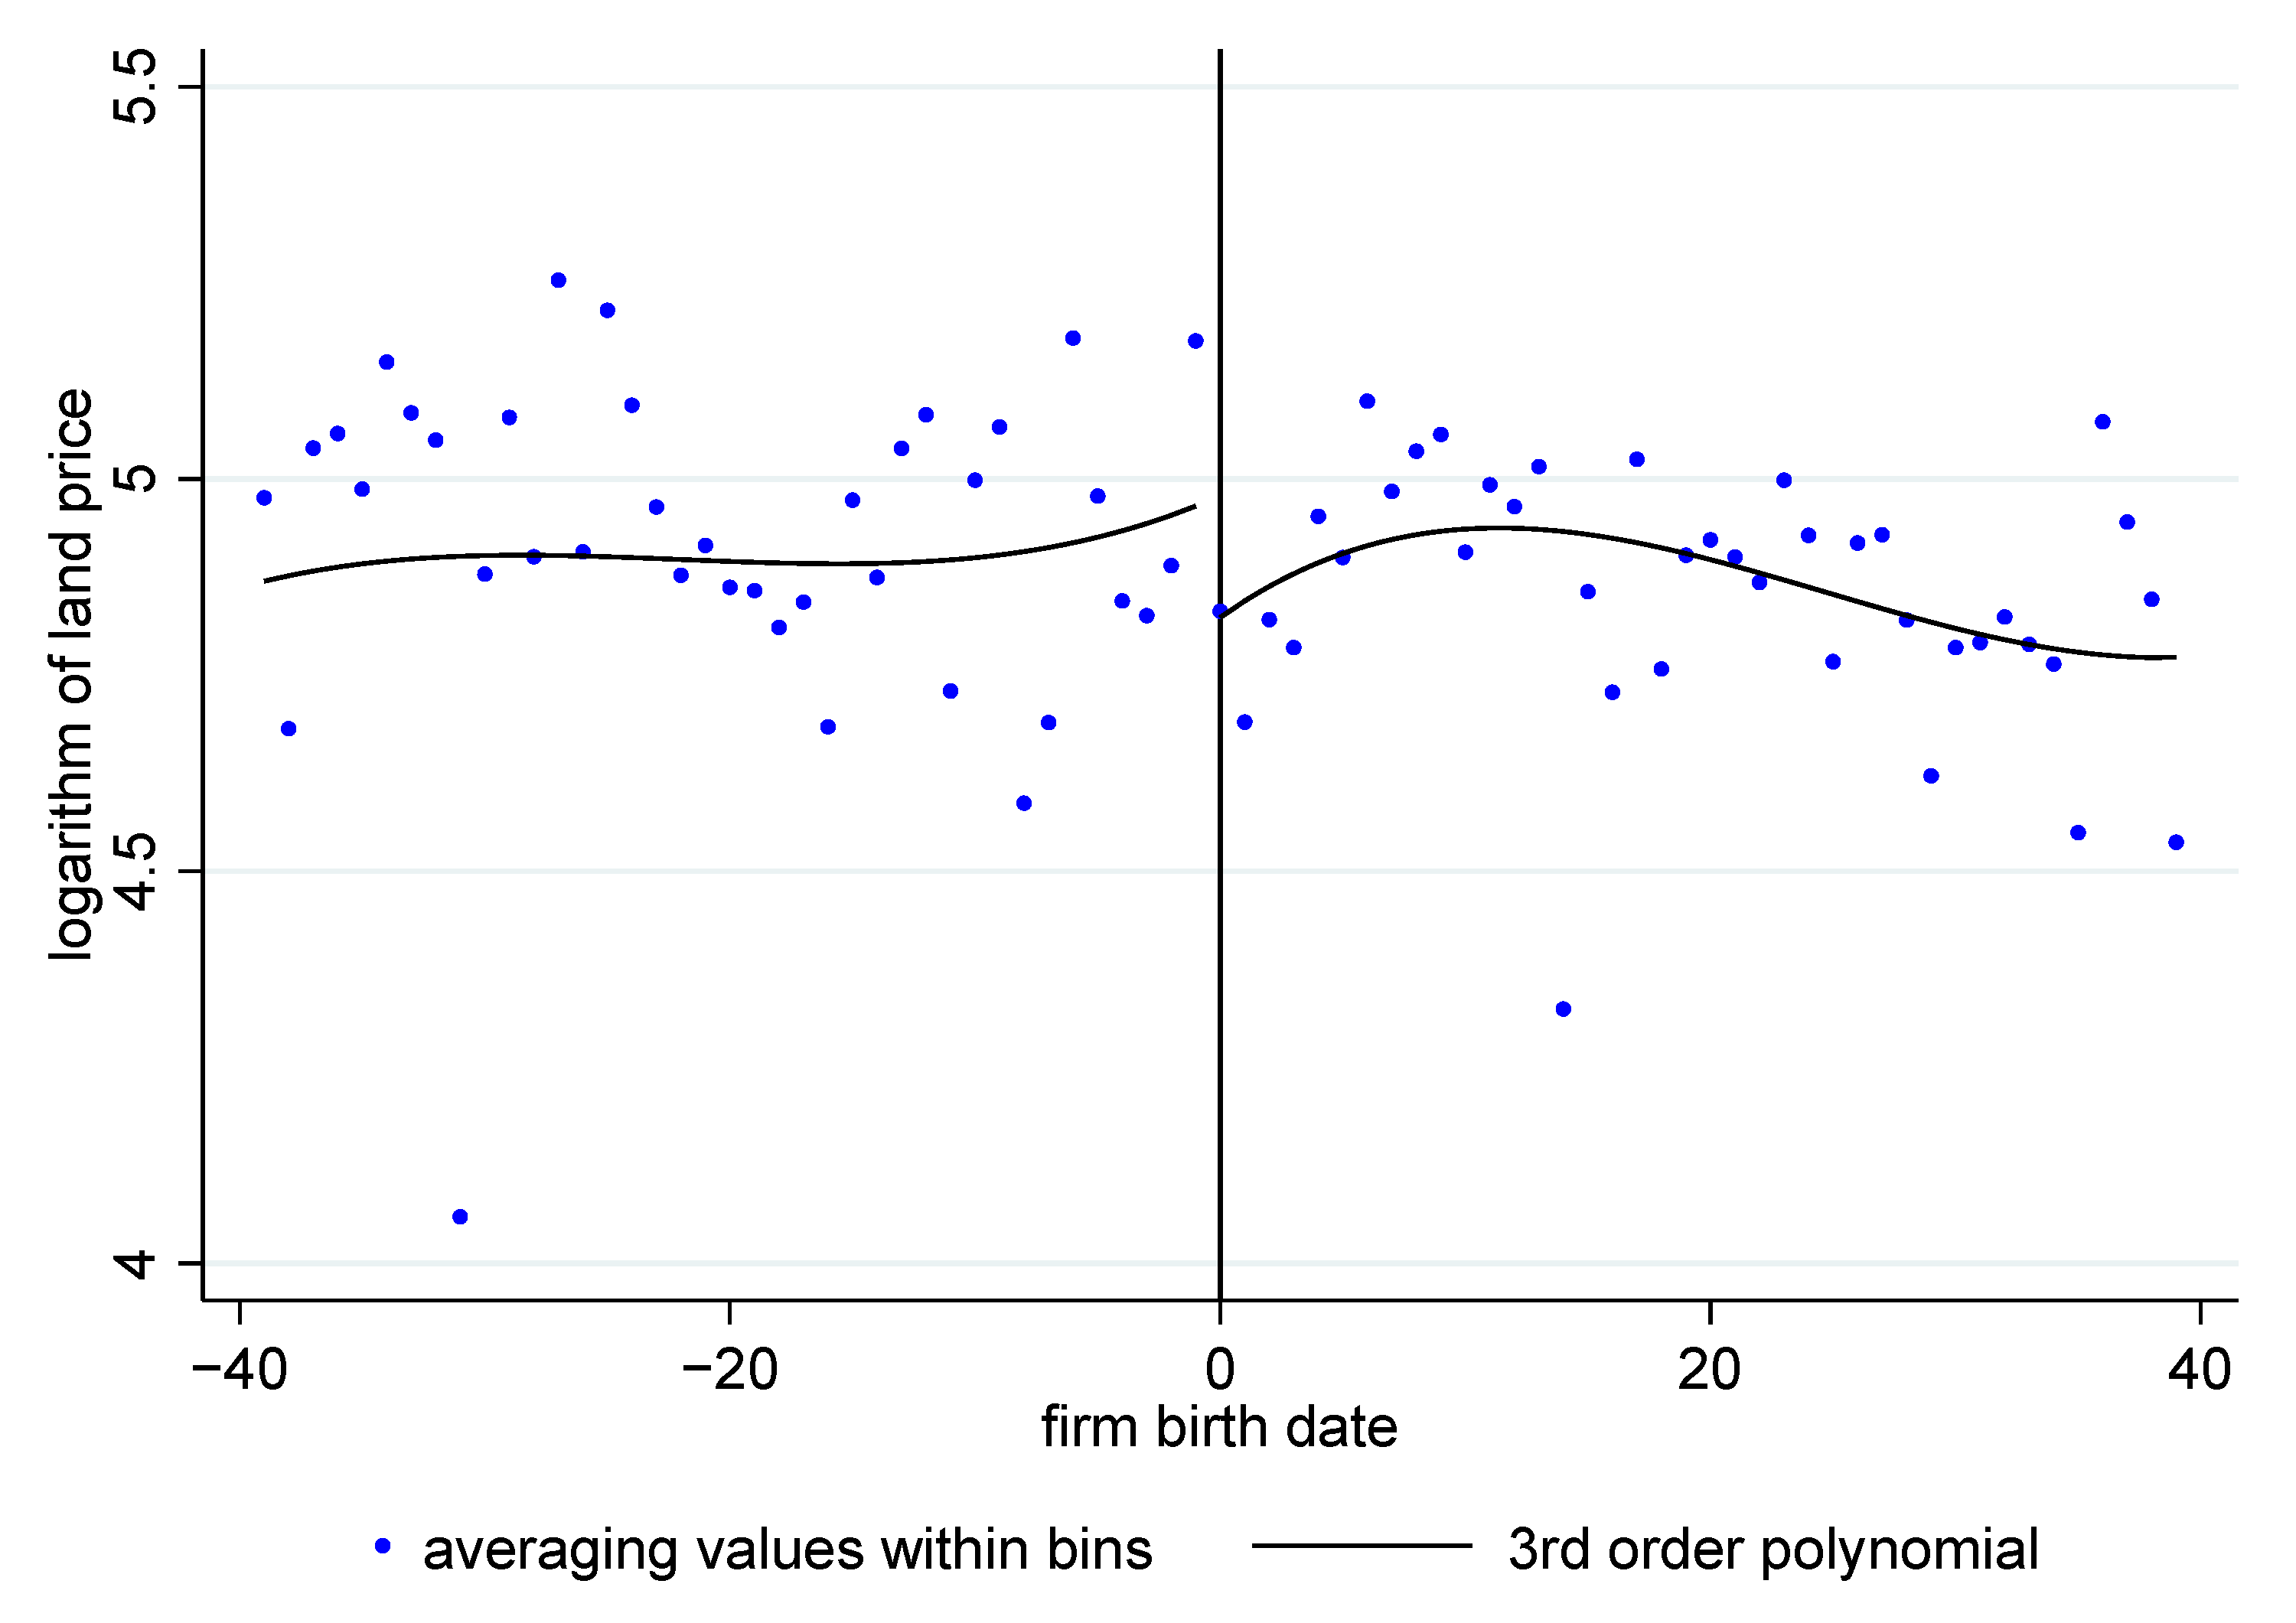
First, to give the direct impression of discontinuity, Figure 5 plots the average land price for POEs and COEs by the month of the establishment. The RDD compares the data within a certain bandwidth around the cut-off date. The dots in Figure 5 are the mean values after grouping the samples. The solid line shows the fitted value using the third-order polynomial. This figure compares land prices for companies established before and after the reform. The gap suggested that local governments give companies that are taxed by central tax authorities price discounts. However, the figure can only provide descriptive information. It does not include the significance of the differences across firms and years. Next, we give the baseline result of the discontinuity.
4.2. The Baseline Result
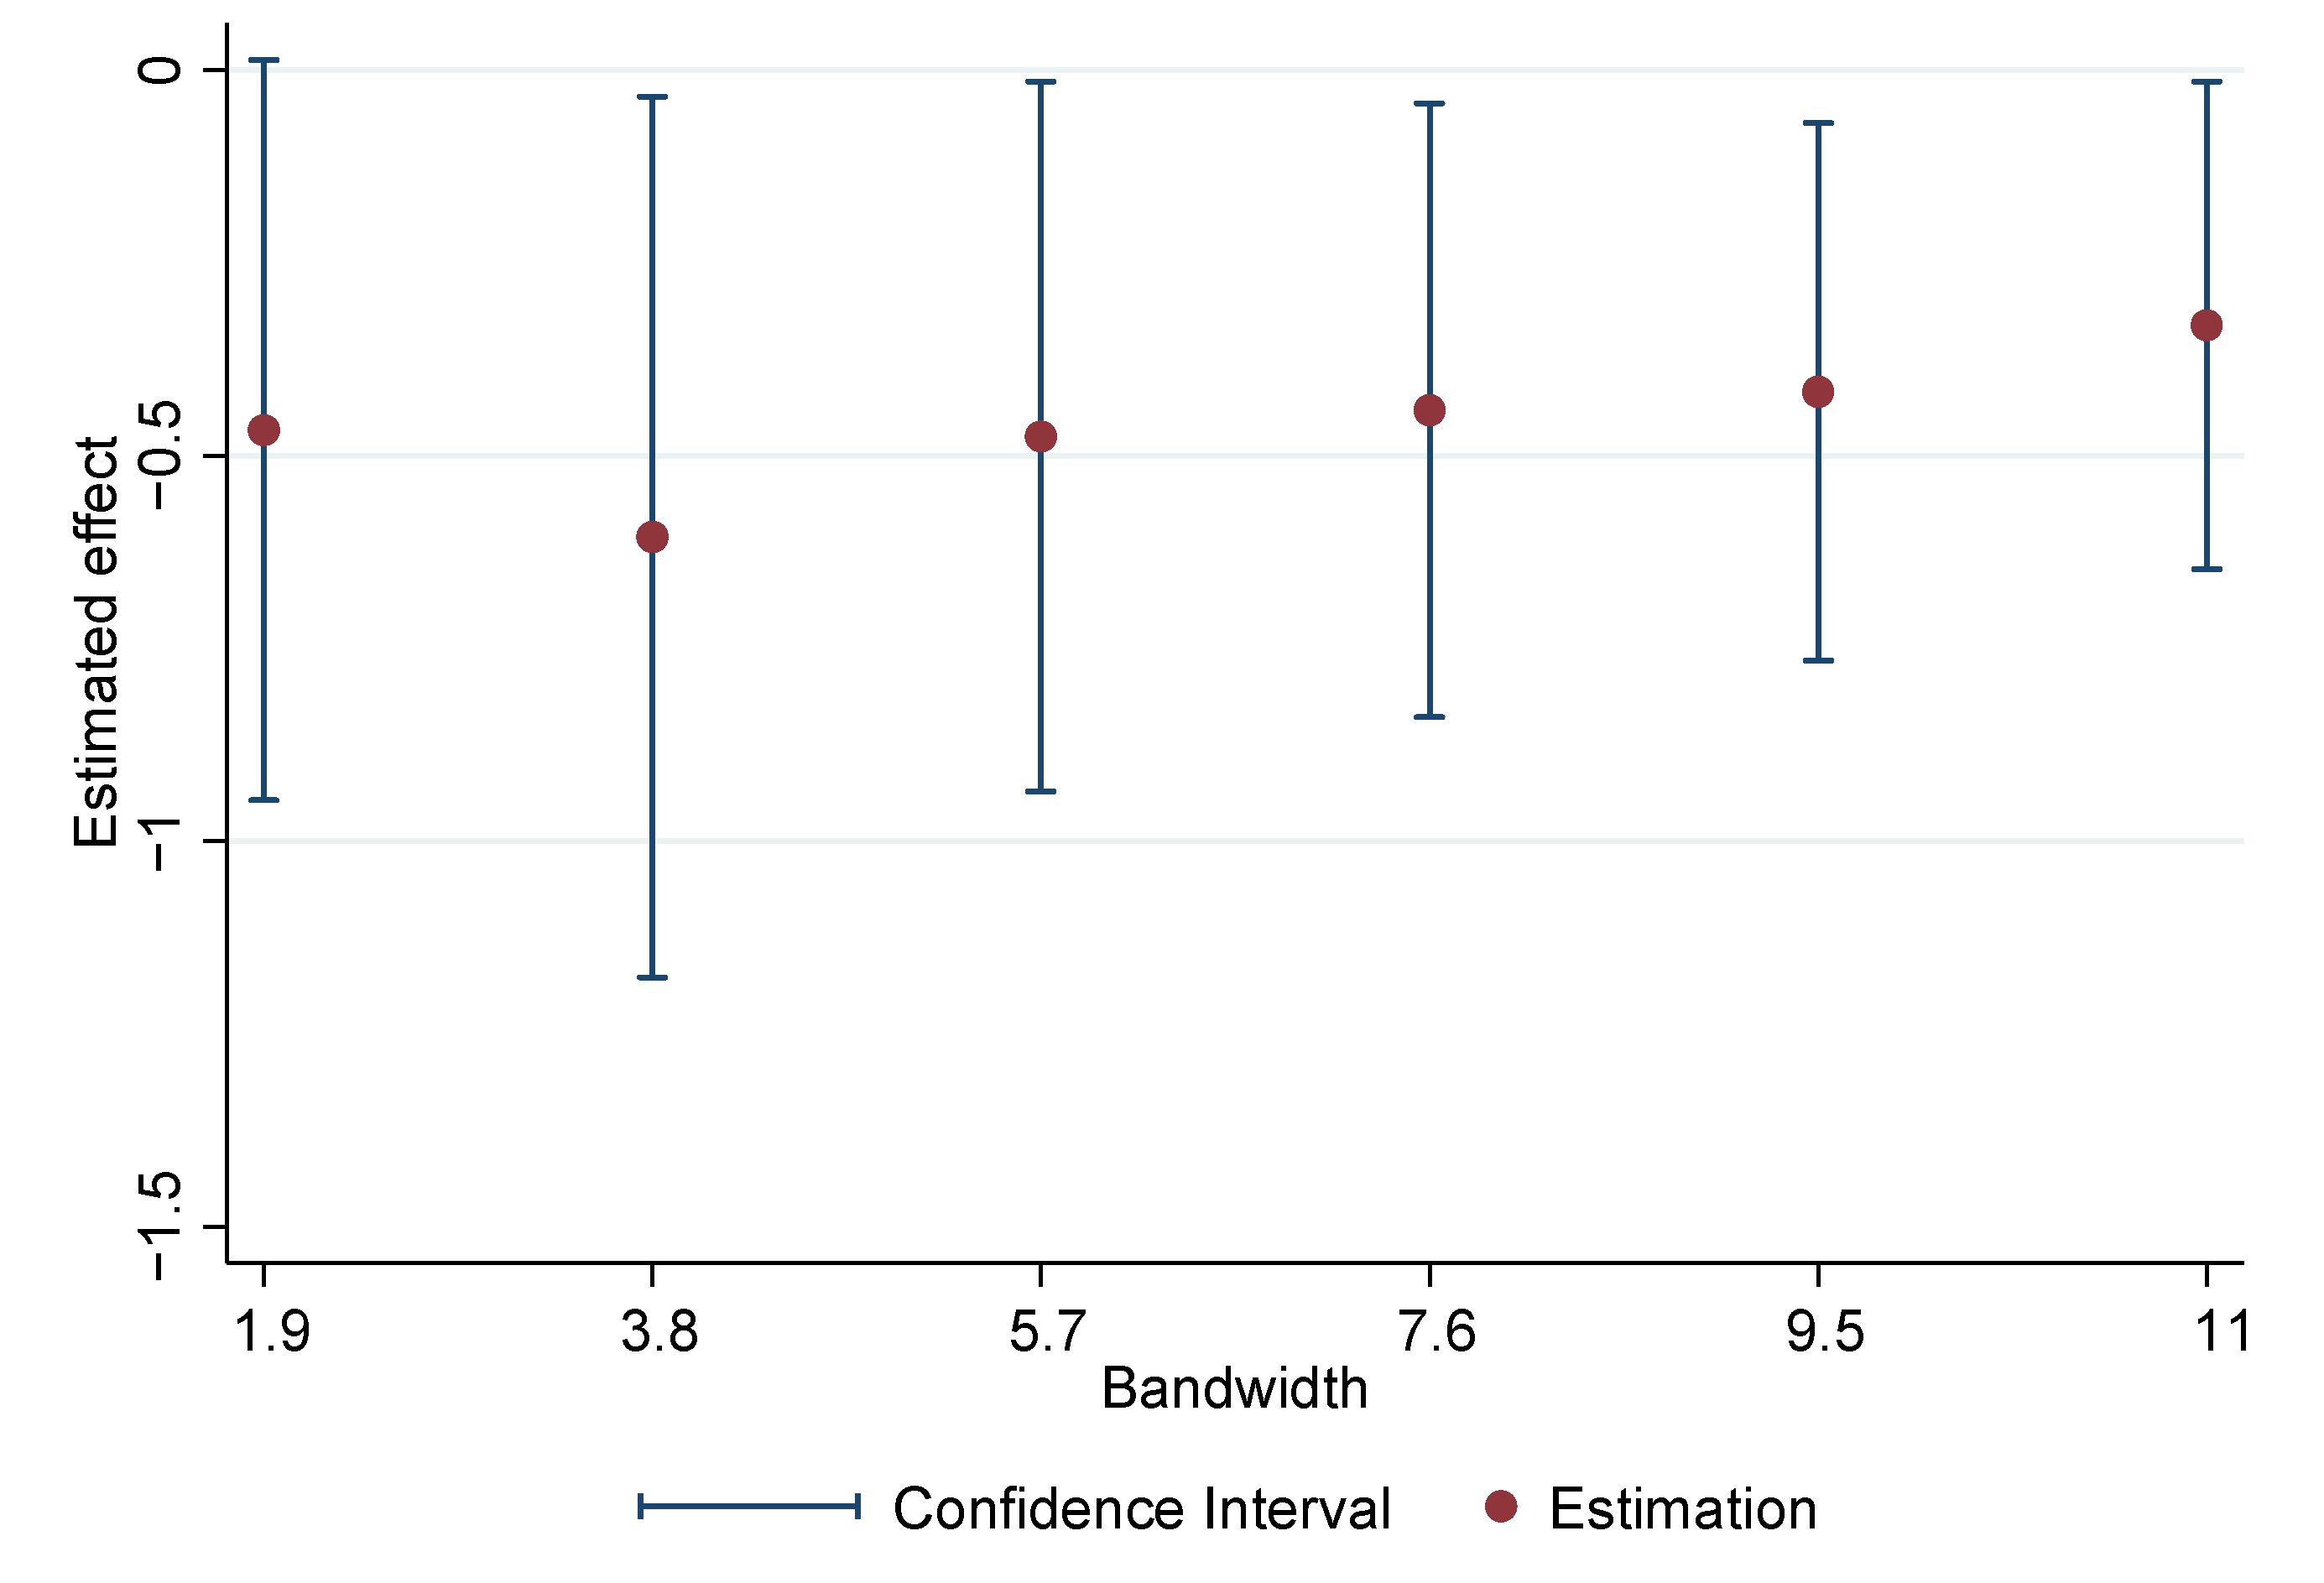
Table 2 presents the results for RDD with different combinations of bandwidths and covariates. In the RDD settings, we typically focus on the average treatment effect of units in which the running variable is close to the threshold [39,43]. To avoid the “typical” point estimate problem, we explored the sensitivity of the results to a range of bandwidths and covariates. The bandwidth values were 1.9, 3.8 and 5.7 by using the kernel estimators. In Table 2, the results confirm that the discontinuity in land price was robust across different bandwidths and covariates. Additionally, the result is shown in Figure 6 by extending the bandwidth, which also demonstrates the significance of discontinuity.
Table 2 (4) reports the results, including all covariates. In the Bandwidth 1 scenario, postreform entrants receive a 37.31% price discount. This result translated to a price reduction of 50.76 yuan/sqm (203.88 × 37.31%), or 2,124,767.19 yuan per land parcel (5,694,900 × 37.31%)5. The estimation used different bandwidths ranging from 37.31% to 39.64%6 [44,45].
Overall, the discontinuity of land prices was significant. Among the POEs and COEs established shortly around the cut-off date, firms collected by the central authority pay lower land prices than those levied by local authorities. Economically, this result demonstrates that when the manipulation of tax enforcement is no longer applicable, local governments lower the industrial land price to attract investment.
4.3. The Mechanism
The restructuring of corporate income tax collection from the local to the central level has changed the intensity of tax enforcement, which supposedly increased effective tax rates and constrained the tax competition. Therefore, local governments used industrial land prices as an alternative instrument to attract investment. We further investigated this mechanism by using 2SLS. Specifically, we used the effective CIT rate as the instrumental variable for the 2002 reform.
Columns (1)–(3) of Table 3 report the results of using CIT as the instrument variable, controlling for different fixed effects. The result for the first stage reported in Column (3) of Table 3 shows that the reform resulted in a 3.3% increase in the CIT rate. In the second stage, a 1% increase in the CIT rate due to the 2002 reform resulted in a 2.73% decrease in land prices. This result confirmed the mechanism we proposed. Compared with the CIT rate, the results reported in Columns (4)–(6) of Table 3 showed that the change in VAT rate has no significant impact on the land price, thus denying a similar mechanism.
5. Robustness
5.1. Identification Check on the Number of Entrants
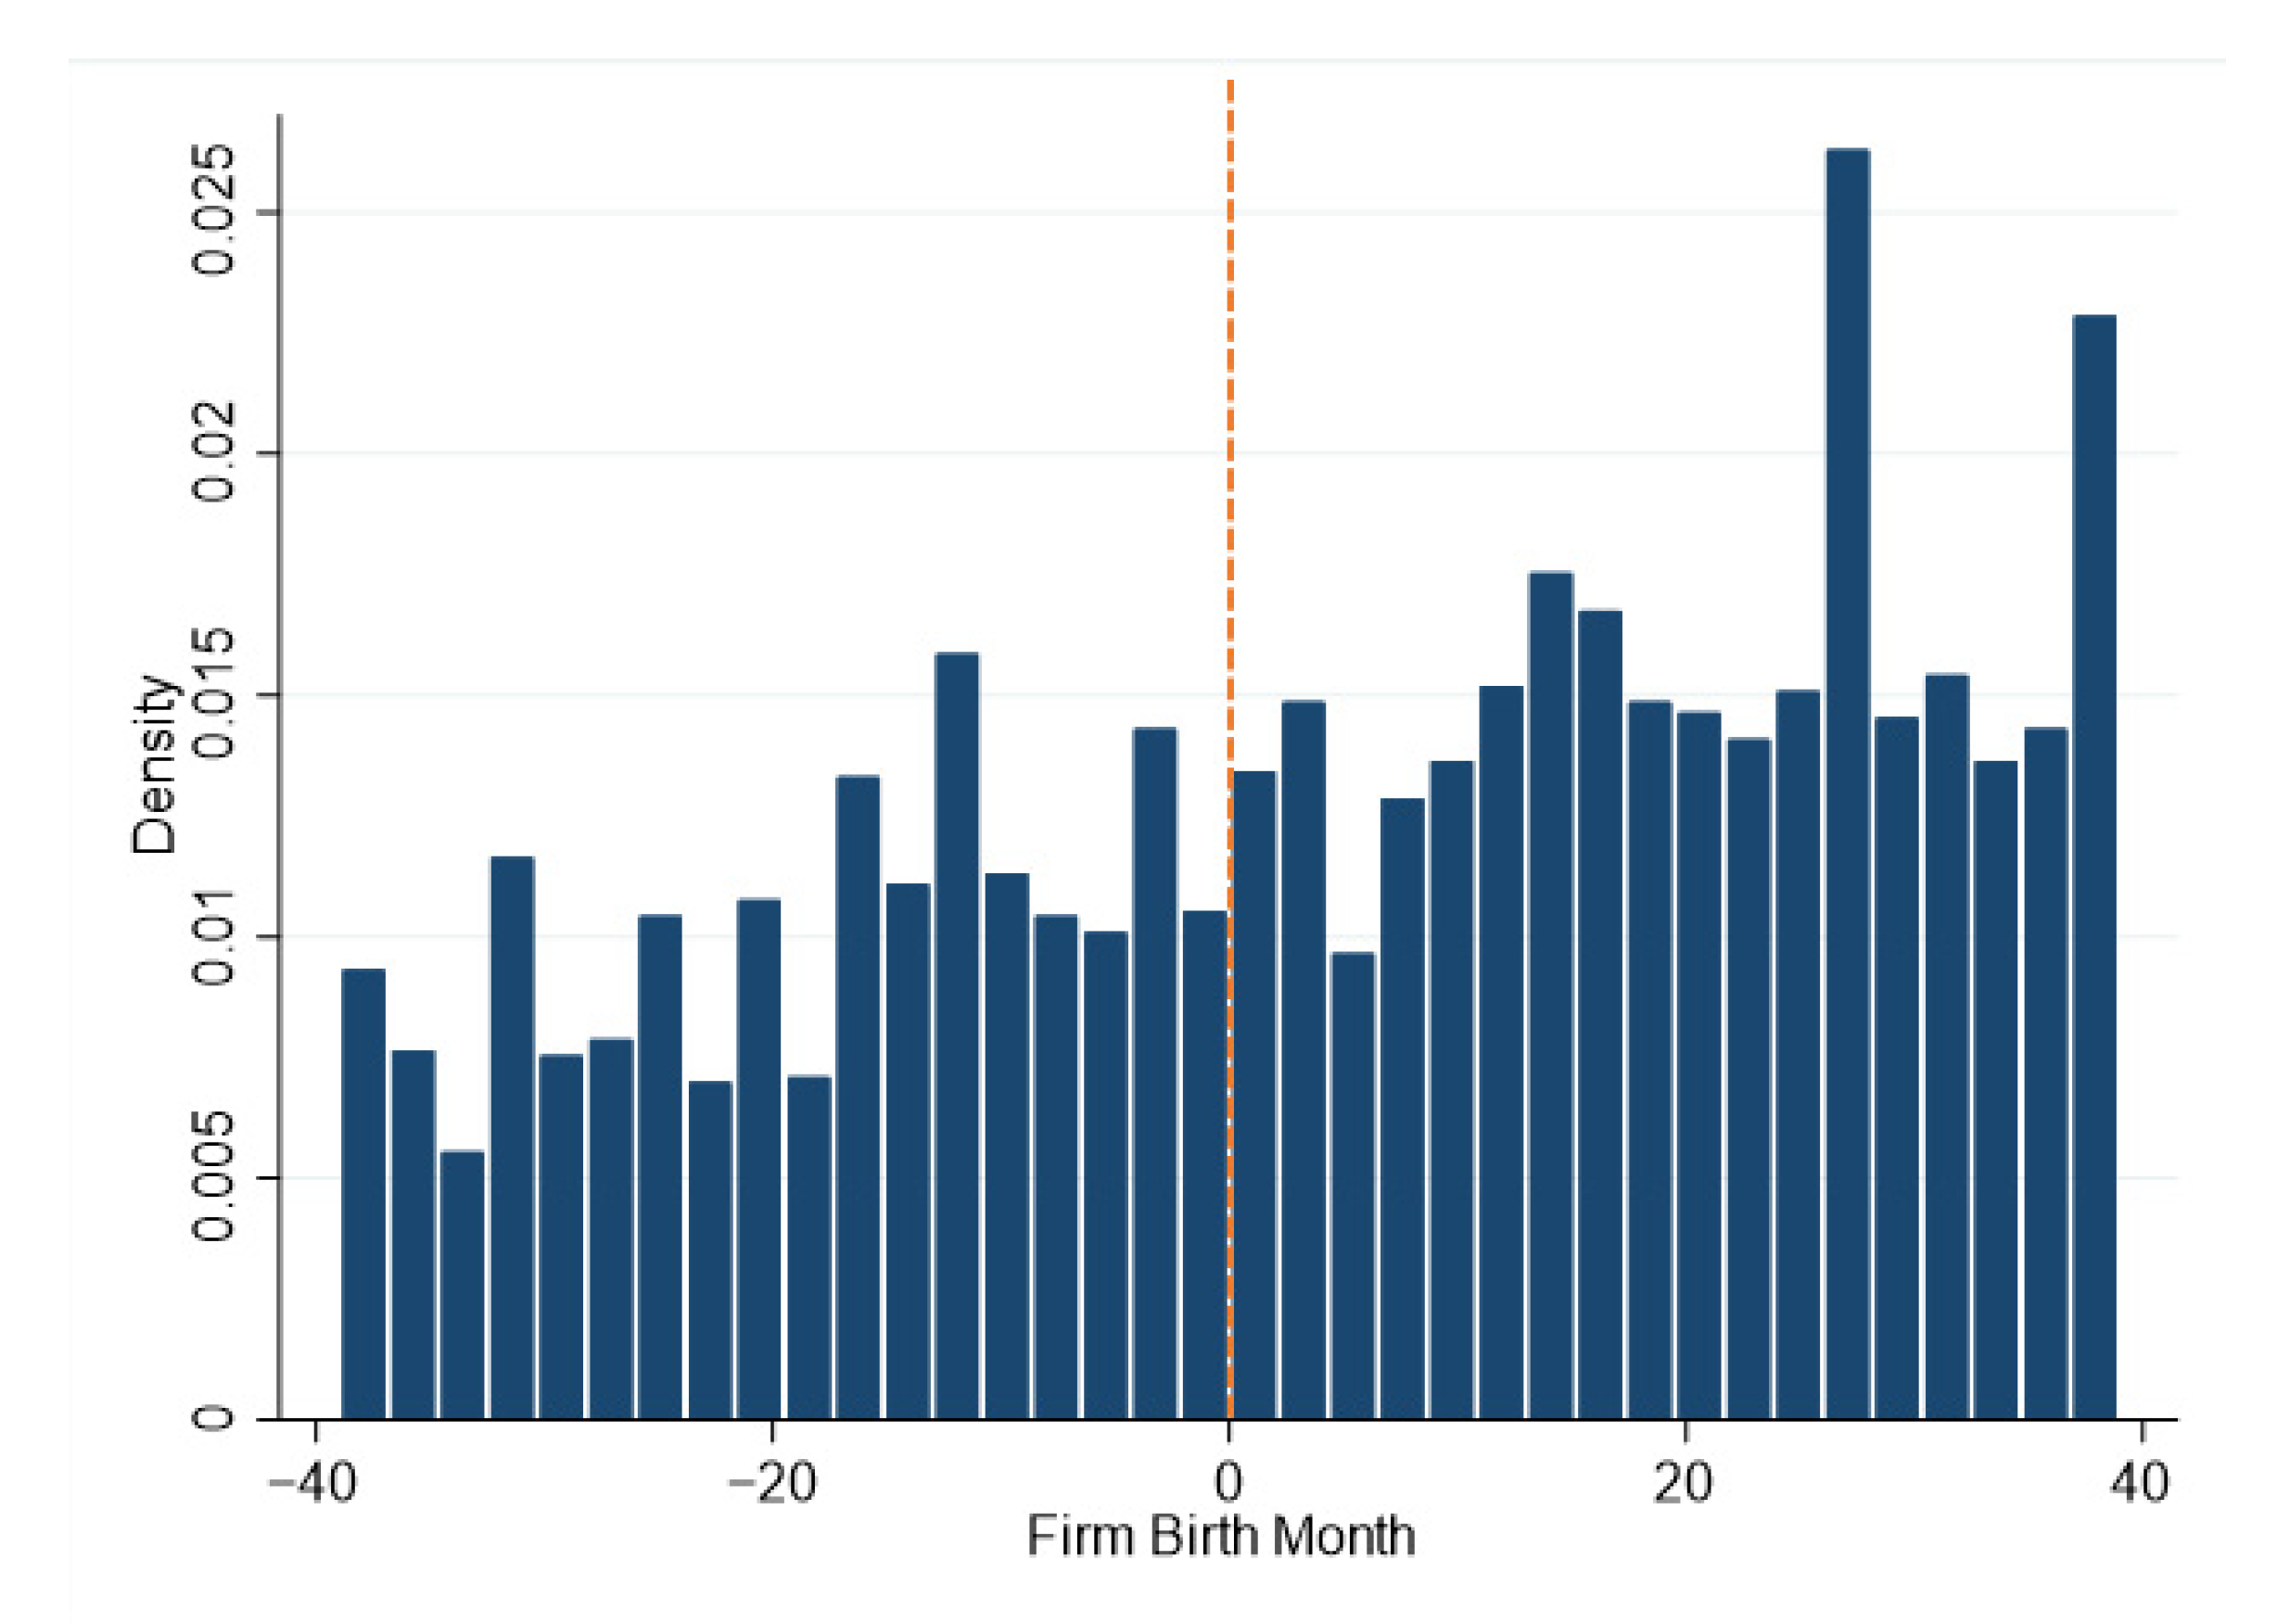
The possibility that some firms strategically selected their establishment date in response to the reform may lead to an invalid estimation. Although the policy was highly confidential until it was released on 31 December 2001, we still checked the data. Suppose the assumption that there is no precise manipulation or that the sorting of the firm establishment is valid. There should be no discontinuities in the number of firms established around the threshold. Figure 7 plots the density of firms by month of entry on both sides of the cut-off date. The number of companies established around the cut-off date was stable, thus ruling out the possibility of self-selecting the sample.
5.2. Identification Check on Covariates
We used the RDD to assess the continuity of covariates across the threshold. Table 4 displays the results. The results for most covariates are insignificant. This result rejected the hypothesis that covariates account for the discontinuity in the land price. Furthermore, we explored the sensitivity of the results to bandwidths, preventing the problem of “typical point estimates”.
5.3. The Placebo Test
5.3.1. The Placebo Test on SOEs and FOEs
In the 2002 reform, only the taxation authority of POEs and COEs was changed. Therefore, discontinuities should only exist in POEs and COEs. Here, we conducted empirical tests with SOEs and FOEs as controls. Columns (1)–(2) in Table 5 report the results. The discontinuity in land prices was insignificant among SOEs and FOEs. This result also rejects the possibility that the decrease in land price was because of the variation of local governments, as it would simultaneously impact all types of firms.
5.3.2. The Placebo Test on the Cut-Off Date
In addition to placebo test on SOEs and FOEs, we also conducted a placebo test on the cut-off date by moving them forwards and backwards one to four months, respectively. Columns (3)–(10) of Table 5 show the results. We found no discontinuity in the placebo cut-off date. Additionally, relaxing the time range from one month to four months, the land price discontinuity is insignificant in the placebo cases.
5.4. Alternative Specifications: Parametric Estimation
We used regression Model (1) to estimate the effect of the policy shock on the land price. Table 6 reports the results with various combinations of control variables and bandwidths. We only added the policy effect in Columns (1)–(3) of Table 6. Columns (4)–(6) in Table 6 adds control variables. Next, in Columns (7)–(9), we added the time fixed effect and industry fixed effect. We employed two, four, and six months as the bandwidths in each group, respectively7. As shown in Table 6, the parametric estimation results are consistent with the nonparametric estimation, supporting the robustness of the estimation.
5.5. Alternative Explanation
5.5.1. Addressing the Concern of Joining the WTO
After joining the World Trade Organization (WTO) in December 2001, China adopted a series of industrial policies to promote export [46,47]. Local governments have incentives to use the land to promote exports. Consequently, the local governments’ behavior of land transfer varies after joining the WTO. The joining the WTO has occurred at a similar time as the tax collection reform. This raised concerns about the alternative explanation that joining the WTO caused the decline in land prices. Previous empirical results preclude this possibility. First, as discussed in the placebo test of cut-off dates, the discontinuity was not significant in December 2001. Second, the policy affects the industrial land price of POEs and COEs only (discussed in the placebo test on SOEs and FOEs), also denying the possibility of joining the WTO since the trade policy impacts all types of enterprises simultaneously.
Even so, we addressed the concern of joining the WTO by using the interaction term of the policy shock and firm export status. The regression function is shown in Equation (2). The logic for using the cross-term is as follows. Given that the discounts of land prices were caused by the incentives of promoting exports, firms that export should have been preferred by local governments after the policy shock. Hence, we can observe that firms that export receive more land price discounts after the policy shock. In that case, the coefficient of the cross-term of the policy shock and export status should be negative:
Here, equals 1 if the firm I is established after the reform. is a dummy variable where takes a value of 1 if the firm exports and 0 otherwise. Table 7 reports the results. First, the interaction of policy shock and export status is insignificant regardless of fixed effect groups. This result denies the alternative explanation of joining the WTO.
5.5.2. Addressing the Concern That Financial Constraints
Changes in the responsibility of tax collection have resulted in higher effective tax rates, so firms face more restricted internal financing and increased investment costs [48]. This gives rise to the concern that the postreform entrants cannot afford the high land price as the pre-reform entrants can do due to the higher tax burden. Consequently, land prices decreased. If financial constraints cause the discontinuity of land prices, then there must be a discontinuity in firms’ financial conditions. We conducted empirical research by examining whether there were significant discontinuities in firm financial conditions to assess the concern. We considered ROA, SA (Size-age index [42]), sales margin, liability rate, and long-term liability rate. Table 8 reports the results with different bandwidths. The results show that there is no discontinuity in the ROA, SA, sales margin, liability rate, and long-term liability rate. This result denies the alternative explanation of joining the WTO.
6. Conclusions
In the recent process of fiscal transformation in China, the tax collection rights of the central government have been continuously strengthened. The fiscal arrangement has an essential influence on the use of land in China. While most of the studies focused on land finance, little attention has been paid to the influence of tax collection arrangements through the perspective of investment promotion. This paper fills the gap in this regard. The tax collection reform in 2002 has brought an exogenous constraint on local governments’ ability to engage in tax competition, and hence provided a quasi-natural experiment of tax compliance. This paper highlights how the more stringent regulation of tax collection influences the use of land in China through the perspective of investment promotion.
In 2002, China shifted the responsibility for collecting the corporate income tax from the local tax authority to the central tax authority, resulting in an increased difficulty in tax competition among local governments. Based on a comprehensive dataset of enterprises, combined with land transaction data in China, we use the RDD to study the impact of this policy reform. Our research provides three main results. First, the reform has resulted in significant discontinuities in land prices. In principle, firms that entered shortly before and after the reform should be identical to the local government and should be charged the same land rent. But as we found in this study, local governemnts charged lower land rent for those firms established after the reform. Second, the reform significantly increased the effective corporate income tax rates. The increase in effective tax rates proves that the tax collection reform has made it more difficult for local governments to participate in tax competition and provide tax incentives to investments. Third, there was no discontinuity in the number of firms established around the cut-off date. This result proves that firms had not gamed the law by rushing into the market after the reform was announced. (31 December 2001). This finding is crucial for the validity of the RDD analysis. All of these findings provide evidence that the increasingly stringent regulation of tax collection by the central government makes the local government relies more on using preferential land price to attract investment.
We acknowledge some limitations in this work, which are mainly related to the narrow economic and political institutional settings: publicly-owned land, political centralization, and economic decentralization. In this regard, further research is needed to analyze the efficiency of the substitution of land prices for tax enforcement and assess the extent to which the results of our analysis can be extended to other countries with different institutional settings.
Author Contributions
Conceptualization, H.S. and G.S.; methodology, G.S.; software, G.S.; validation, G.S.; formal analysis, G.S.; resources, H.S. and G.S.; data curation, G.S.; writing—original draft preparation, G.S.; writing—review and editing, H.S.; supervision, H.S.; project administration, H.S.; funding acquisition, H.S. All authors have read and agreed to the published version of the manuscript.
Funding
This research was funded by Social Science Fund of Zhejiang Province in China (Grant No. 17NDJC191YB).
Institutional Review Board Statement
Not applicable.
Informed Consent Statement
Not applicable.
Data Availability Statement
All data, models, or code that support the findings of this study are available from the corresponding author upon reasonable request.
Conflicts of Interest
The authors declare that they have no conflicts of interest.
Appendix A
Table A1 shows the covariance matrix of all variables. The results show that the correlation coefficients between the policy shock and other variables are not significant.

Table A1.
Correlation matrix.
| Variables | (1) | (2) | (3) | (4) | (5) | (6) | (7) | (8) | (9) | (10) | (11) | (12) | (13) | (14) |
|---|---|---|---|---|---|---|---|---|---|---|---|---|---|---|
| (1) shock | 1.000 | |||||||||||||
| (2) land price | −0.048 | 1.000 | ||||||||||||
| (3) outputvlue | −0.268 | −0.009 | −0.268 | |||||||||||
| (4) Age | 0.603 | −0.038 | −0.432 | 1.000 | ||||||||||
| (5) CIT value | −0.251 | 0.001 | 0.806 | −0.348 | 1.000 | |||||||||
| (6) VAT value | −0.307 | −0.024 | 0.873 | −0.464 | 0.786 | 1.000 | ||||||||
| (7) CIT rate | −0.036 | 0.017 | −0.033 | 0.016 | 0.242 | 0.014 | 1.000 | |||||||
| (8) VAT rate | −0.079 | 0.014 | 0.01 | −0.081 | 0.103 | 0.274 | 0.056 | 1.000 | ||||||
| (9) export | −0.147 | 0.078 | 0.343 | −0.17 | 0.287 | 0.28 | 0.012 | −0.025 | 1.000 | |||||
| (10) ROA | 0.019 | −0.037 | 0.123 | −0.005 | 0.199 | 0.116 | −0.033 | −0.056 | 0.018 | 1.000 | ||||
| (11) SA | −0.436 | −0.026 | 0.814 | −0.763 | 0.688 | 0.798 | 0.001 | 0.09 | 0.316 | −0.092 | 1.000 | |||
| (12) Sales margin | −0.088 | −0.005 | 0.21 | −0.123 | 0.406 | 0.275 | 0.054 | −0.018 | 0.048 | 0.454 | 0.102 | 1.000 | ||
| (13) debt | −0.034 | 0.027 | 0.052 | −0.051 | −0.026 | 0.037 | −0.007 | 0.061 | −0.002 | −0.038 | 0.087 | −0.120 | 1.000 | |
| (14) ltdebt | −0.09 | −0.069 | 0.273 | −0.189 | 0.239 | 0.287 | −0.018 | 0.072 | 0.061 | −0.073 | 0.422 | 0.019 | 0.262 | 1.000 |
| 1 | The tax authority (local or central) responsible for collecting a company is unlikely to change in most cases. Even if the following situations occur, the authority responsible for tax collection will not change: (a) relocating; (b) merging another firm that is collected by the same authority; (c) changing to the type of firm collected by the same tax collection authority. |
| 2 | The Ministry of Land and Resources of the People’s Republic of China also publishes the consolidated land transaction data. |
| 3 | This reform has profoundly influenced China’s fiscal system by changing the way value-added tax is administrated. |
| 4 | Hahn et al. provided a derivation of the systematic bias in kernel regression estimation, and suggested running local linear regression to reduce the bias [40]. |
| 5 | The average price of the land is 203.88 yuan/sqm; the average cost of the land is 5,694,900 yuan per parcel. |
| 6 | In comparison, Wu et al. (2012) found that state-owned enterprises have a 27.4% price discount in Beijing. Chen and Kung conclude that the princeling firms (firms that have political connections) can obtain price discounts ranging from 55.4% to 59.9% [44]. |
| 7 | We choose these bandwidths because the bandwidths selected by the nonparametric estimation are 1.9, 3.8, and 5.7, respectively. |
References
- Wu, Y.; Zhang, X.; Skitmore, M.; Song, Y.; Hui, E.C.M. Industrial Land Price and Its Impact on Urban Growth: A Chinese Case Study. Land Use Policy 2014, 36, 199–209. [Google Scholar] [CrossRef] [Green Version]
- Stehfest, E.; van Zeist, W.-J.; Valin, H.; Havlik, P.; Popp, A.; Kyle, P.; Tabeau, A.; Mason-D’Croz, D.; Hasegawa, T.; Bodirsky, B.L.; et al. Key Determinants of Global Land-Use Projections. Nat. Commun. 2019, 10, 2166. [Google Scholar] [CrossRef] [PubMed] [Green Version]
- Hertel, T.W. Land Use in the 21st Century: Contributing to the Global Public Good. Rev. Dev. Econ. 2017, 21, 213–236. [Google Scholar] [CrossRef]
- Fan, J.; Zhou, L. Three-Dimensional Intergovernmental Competition and Urban Sprawl: Evidence from Chinese Prefectural-Level Cities. Land Use Policy 2019, 87, 104035. [Google Scholar] [CrossRef]
- Chen, T.; Kung, J.K.-S. Do Land Revenue Windfalls Create a Political Resource Curse? Evidence from China. J. Dev. Econ. 2016, 123, 86–106. [Google Scholar] [CrossRef]
- Fan, X.; Qiu, S.; Sun, Y. Land Finance Dependence and Urban Land Marketization in China: The Perspective of Strategic Choice of Local Governments on Land Transfer. Land Use Policy 2020, 99, 105023. [Google Scholar] [CrossRef]
- Xu, Z.; Huang, J.; Jiang, F. Subsidy Competition, Industrial Land Price Distortions and Overinvestment: Empirical Evidence from China’s Manufacturing Enterprises. Appl. Econ. 2017, 49, 4851–4870. [Google Scholar] [CrossRef]
- Li, H.; Zhou, L.-A. Political Turnover and Economic Performance: The Incentive Role of Personnel Control in China. J. Public Econ. 2005, 89, 1743–1762. [Google Scholar] [CrossRef]
- Cai, M.; Fan, J.; Ye, C.; Zhang, Q. Government Debt, Land Financing and Distributive Justice in China. Urban Stud. 2021, 58, 2329–2347. [Google Scholar] [CrossRef]
- Zhong, T.; Zhang, X.; Huang, X.; Liu, F. Blessing or Curse? Impact of Land Finance on Rural Public Infrastructure Development. Land Use Policy 2019, 85, 130–141. [Google Scholar] [CrossRef]
- Slemrod, J. Tax Compliance and Enforcement. J. Econ. Lit. 2019, 57, 904–954. [Google Scholar] [CrossRef]
- Stowhase, S.; Traxler, C. Tax Evasion and Auditing in a Federal Economy. Int. Tax Public Financ. 2005, 12, 515–531. [Google Scholar] [CrossRef] [Green Version]
- Chen, S.X. The Effect of a Fiscal Squeeze on Tax Enforcement: Evidence from a Natural Experiment in China. J. Public Econ. 2017, 147, 62–76. [Google Scholar] [CrossRef]
- Maria Duran-Cabre, J.; Esteller-More, A.; Salvadori, L. Empirical Evidence on Horizontal Competition in Tax Enforcement. Int. Tax Public Financ. 2015, 22, 834–860. [Google Scholar] [CrossRef] [Green Version]
- Tang, T.; Mo, P.L.L.; Chan, K.H. Tax Collector or Tax Avoider? An Investigation of Intergovernmental Agency Conflicts. Account. Rev. 2016, 92, 247–270. [Google Scholar] [CrossRef]
- Cai, J.; Chen, Y.; Wang, X. The Impact of Corporate Taxes on Firm Innovation: Evidence from the Corporate Tax Collection Reform in China; Social Science Research Network: Rochester, NY, USA, 2018. [Google Scholar]
- Clarke Annez, P.; Peterson, G.E. Financing Cities: Fiscal Responsibility and Urban Infrastructure in Brazil, China, India, Poland and South Africa; World Bank: Washington, DC, USA, 2007. [Google Scholar]
- Wang, W.; Ye, F. The Political Economy of Land Finance in China. Public Budg. Financ. 2016, 36, 91–110. [Google Scholar] [CrossRef]
- Tang, P.; Feng, Y.; Li, M.; Zhang, Y. Can the Performance Evaluation Change from Central Government Suppress Illegal Land Use in Local Governments? A New Interpretation of Chinese Decentralisation. Land Use Policy 2021, 108, 105578. [Google Scholar] [CrossRef]
- Han, L.; Kung, J.K.-S. Fiscal Incentives and Policy Choices of Local Governments: Evidence from China. J. Dev. Econ. 2015, 116, 89–104. [Google Scholar] [CrossRef]
- Ahmad, E.; Keping, L.; Richardson, T.J.; Singh, R. Recentralization in China? Social Science Research Network: Rochester, NY, USA, 2002. [Google Scholar]
- Yang, Z. Tax Reform, Fiscal Decentralization, and Regional Economic Growth: New Evidence from China. Econ. Model. 2016, 59, 520–528. [Google Scholar] [CrossRef]
- Shen, C.; Jin, J.; Zou, H. Fiscal Decentralization in China: History, Impact, Challenges and Next Steps. Ann. Econ. Financ. 2012, 13, 1–51. [Google Scholar]
- Loo, B.P.Y.; Chow, S.Y. China’s 1994 Tax-Sharing Reforms: One System, Differential Impact. Asian Surv. 2006, 46, 215–237. [Google Scholar] [CrossRef]
- Cai, H.; Henderson, J.V.; Zhang, Q. China’s Land Market Auctions: Evidence of Corruption? RAND J. Econ. 2013, 44, 488–521. [Google Scholar] [CrossRef] [PubMed] [Green Version]
- Wang, Y.; Hui, E.C. Are Local Governments Maximizing Land Revenue? Evidence from China. China Econ. Rev. 2017, 43, 196–215. [Google Scholar] [CrossRef]
- Wang, L.; Yang, Y. Political Connections in the Land Market: Evidence from China’s State-Owned Enterprises. Real Estate Econ. 2021, 49, 7–35. [Google Scholar] [CrossRef]
- Wilson, J.D. Theories of Tax Competition. Natl. Tax J. 1999, 52, 269–304. [Google Scholar] [CrossRef]
- Hynes, K.; Liu, Y.; Ma, J.; Wooton, I. Tax Competition for FDI: China’s Exceptional Approach. Int. Tax Public Financ. 2021. [Google Scholar] [CrossRef]
- Cai, H.; Liu, Q. Competition and Corporate Tax Avoidance: Evidence from Chinese Industrial Firms*. Econ. J. 2009, 119, 764–795. [Google Scholar] [CrossRef]
- Shevlin, T.; Shivakumar, L.; Urcan, O. Macroeconomic Effects of Corporate Tax Policy. J. Account. Econ. 2019, 68, 101233. [Google Scholar] [CrossRef]
- Xu, W.; Zeng, Y.; Zhang, J. Tax Enforcement as a Corporate Governance Mechanism: Empirical Evidence from China. Corp. Gov. 2011, 19, 25–40. [Google Scholar] [CrossRef]
- He, C.; Huang, Z.; Wang, R. Land Use Change and Economic Growth in Urban China: A Structural Equation Analysis. Urban Stud. 2014, 51, 2880–2898. [Google Scholar] [CrossRef]
- Han, W.; Zhang, X.; Zheng, X. Land Use Regulation and Urban Land Value: Evidence from China. Land Use Policy 2020, 92, 104432. [Google Scholar] [CrossRef]
- Zhou, L.; Tian, L.; Gao, Y.; Ling, Y.; Fan, C.; Hou, D.; Shen, T.; Zhou, W. How Did Industrial Land Supply Respond to Transitions in State Strategy? An Analysis of Prefecture-Level Cities in China from 2007 to 2016. Land Use Policy 2019, 87, 104009. [Google Scholar] [CrossRef]
- Liu, J.; Jiang, Z.; Chen, W. Land Misallocation and Urban Air Quality in China. Environ. Sci. Pollut. Res. 2021, 28, 58387–58404. [Google Scholar] [CrossRef] [PubMed]
- Ma, A.; He, Y.; Tang, P. Understanding the Impact of Land Resource Misallocation on Carbon Emissions in China. Land 2021, 10, 1188. [Google Scholar] [CrossRef]
- Zhang, J.; Shi, Z.; Chu, X.; Shen, Y. The Effect of the Spatial Misallocation of Land Supply on Entrepreneurial Activity. Appl. Econ. Lett. 2021, 28, 949–953. [Google Scholar] [CrossRef]
- Imbens, G.W.; Lemieux, T. Regression Discontinuity Designs: A Guide to Practice. J. Econom. 2008, 142, 615–635. [Google Scholar] [CrossRef] [Green Version]
- Hahn, J.; Todd, P.; Van der Klaauw, W. Identification and Estimation of Treatment Effects with a Regression-Discontinuity Design. Econometrica 2001, 69, 201–209. [Google Scholar] [CrossRef]
- Saez, E.; Matsaganis, M.; Tsakloglou, P. Earnings Determination and Taxes: Evidence from a Cohort-Based Payroll Tax Reform in Greece. Q. J. Econ. 2012, 127, 493–533. [Google Scholar] [CrossRef] [Green Version]
- Hadlock, C.J.; Pierce, J.R. New Evidence on Measuring Financial Constraints: Moving Beyond the KZ Index. Rev. Financ. Stud. 2010, 23, 1909–1940. [Google Scholar] [CrossRef]
- Imbens, G.; Kalyanaraman, K. Optimal Bandwidth Choice for the Regression Discontinuity Estimator. Rev. Econ. Stud. 2012, 79, 933–959. [Google Scholar] [CrossRef]
- Chen, T.; Kung, J.K. Busting the “Princelings”: The Campaign against Corruption in China’s Primary Land Market*. Q. J. Econ. 2019, 134, 185–226. [Google Scholar] [CrossRef] [Green Version]
- Wu, J.; Gyourko, J.; Deng, Y. Evaluating Conditions in Major Chinese Housing Markets. Reg. Sci. Urban Econ. 2012, 42, 531–543. [Google Scholar] [CrossRef] [Green Version]
- Gourdon, J.; Monjon, S.; Poncet, S. Trade Policy and Industrial Policy in China: What Motivates Public Authorities to Apply Restrictions on Exports? China Econ. Rev. 2016, 40, 105–120. [Google Scholar] [CrossRef] [Green Version]
- Chen, Z.; Poncet, S.; Xiong, R. Inter-Industry Relatedness and Industrial-Policy Efficiency: Evidence from China’s Export Processing Zones. J. Comp. Econ. 2017, 45, 809–826. [Google Scholar] [CrossRef] [Green Version]
- Goh, B.W.; Lee, J.; Lim, C.Y.; Shevlin, T.J. The Effect of Corporate Tax Avoidance on the Cost of Equity; Social Science Research Network: Rochester, NY, USA, 2013. [Google Scholar]
Figure 1.
Changes in tax collection responsibility and the regression discontinuity design. POEs (private-owned enterprises), COEs (collective-owned enterprises), SOEs (state-owned enterprises), FOEs (foreign-owned enterprises).
Figure 1.
Changes in tax collection responsibility and the regression discontinuity design. POEs (private-owned enterprises), COEs (collective-owned enterprises), SOEs (state-owned enterprises), FOEs (foreign-owned enterprises).

Figure 2.
The effective corporate income tax (CIT) rates of private-owned enterprises (POEs) and collective-owned enterprises (COEs) established before and after the reform.
Figure 2.
The effective corporate income tax (CIT) rates of private-owned enterprises (POEs) and collective-owned enterprises (COEs) established before and after the reform.

Figure 3.
The effective corporate income tax (CIT) rates of state-owned enterprises (SOEs) and foreign-owned enterprises (FOEs) established before and after the reform.
Figure 3.
The effective corporate income tax (CIT) rates of state-owned enterprises (SOEs) and foreign-owned enterprises (FOEs) established before and after the reform.

Figure 4.
Changes in land prices with different land types.

Figure 5.
Land prices by month of entry around the tax collection reform.

Figure 6.
The discontinuity effects by using different bandwidths.

Figure 7.
Identification checks: Number of entrants by month of entry around the reform.

Table 1.
Variable definition and summary statistics.
| Variable | Definition | Obs. | Mean | S.D. | Min. | Max. |
|---|---|---|---|---|---|---|
| shock | POEs or COEs established after 1 January 2002 equals to 1, equals to 0 otherwise | 12,531 | 0.539 | 0.499 | 0 | 1 |
| land price | The logarithm of land price (Yuan/sqm) | 12,531 | 4.913 | 0.915 | 1.763 | 8.499 |
| outputvlue | The logarithm of firm total output value | 12,439 | 11.486 | 1.674 | 8.826 | 16.887 |
| Age | Land acquisition date minus establishment date | 12,531 | 4.430 | 4.176 | 0 | 17 |
| CIT value | The logarithm of corporate income tax’s revenue | 10,214 | 6.564 | 2.445 | 2.334 | 11.978 |
| VAT value | The logarithm of revenue of value added tax | 10,959 | 7.623 | 2.134 | 3.753 | 14.156 |
| CIT rate | Effective corporate income tax rates | 11,961 | 0.167 | 0.152 | 0.068 | 0.383 |
| VAT rate | Effective value-added tax rates | 9351 | 0.112 | 0.110 | 0.023 | 0.274 |
| export | Equals 1 if the firm exports, equals to 0 otherwise | 12,531 | 0.389 | 0.488 | 0 | 1 |
| ROA | Return on Assets: Net profit divided by total asset | 11,761 | 0.114 | 0.154 | −0.044 | 0.552 |
| SA | Size-age index: −0.737 × log(Asset) + 0.043 × [log(Asset)]2 − 0.04 × life [42] | 11,784 | −2.591 | 0.484 | −3.109 | −1.328 |
| Sales margin | Net profit divided by revenue | 12,455 | 0.056 | 0.071 | −0.066 | 0.225 |
| debt | Total liabilities divided by total assets | 11,781 | 0.620 | 0.295 | 0.096 | 1.168 |
| ltdebt | Long-term liabilities divided by total assets | 10,325 | 0.074 | 0.130 | 0 | 0.443 |
Table 2.
Impact of the tax collection reform on land prices.
| (1) | (2) | (3) | (4) | |
|---|---|---|---|---|
| Land Price | Land Price | Land Price | Land Price | |
| Bandwidth 1 (BW = 1.9) | −0.345 * | −0.357 * | −0.485 ** | −0.467 * |
| (0.187) | (0.190) | (0.243) | (0.245) | |
| Bandwidth 2 (BW = 3.8) | −0.551 ** | −0.486 ** | −0.591 ** | −0.505 ** |
| (0.231) | (0.235) | (0.283) | (0.291) | |
| Bandwidth 3 (BW = 5.7) | −0.431 ** | −0.344 * | −0.584 ** | −0.475 ** |
| (0.181) | (0.185) | (0.228) | (0.235) | |
| Outputvlue | No | Yes | No | Yes |
| Age | No | Yes | No | Yes |
| CIT value | No | No | Yes | Yes |
| VAT value | No | No | Yes | Yes |
| N | 9891 | 9891 | 9891 | 9891 |
** and * here denote significance at the 5% and 10% confidential levels, respectively. “Yes” in the table indicates that we add the corresponding covariate.
Table 3.
Mechanism: Impact of the reform on the effective tax rates and land prices by using 2SLS.
| (1) | (2) | (3) | (4) | (5) | (6) | |
|---|---|---|---|---|---|---|
| Land Price | Land Price | Land Price | Land Price | Land Price | Land Price | |
| Second stage regression | ||||||
| CIT rates | −1.738 * | −3.494 *** | −2.732 *** | |||
| (1.017) | (1.011) | (0.989) | ||||
| VAT rates | −7.673 | −2.553 | −5.116 | |||
| (6.121) | (5.405) | (5.592) | ||||
| Outputvlue | −0.076 | −0.165 *** | −0.135 *** | −0.488 | −0.206 | −0.347 |
| (0.047) | (0.047) | (0.048) | (0.342) | (0.302) | (0.321) | |
| Age | −0.029 *** | −0.031 *** | −0.028 *** | −0.030 *** | −0.023 *** | −0.019 *** |
| (0.003) | (0.004) | (0.003) | (0.007) | (0.006) | (0.006) | |
| Constants | 5.757 *** | 6.825 *** | 5.679 *** | 8.269 *** | 6.561 *** | 6.148 *** |
| (0.498) | (0.49) | (0.553) | (2.191) | (1.902) | (1.996) | |
| Time fixed effect | No | Yes | Yes | No | Yes | Yes |
| Industry fixed effect | No | No | Yes | No | No | Yes |
| First stage regression | ||||||
| shock | 0.031 *** | 0.034 *** | 0.033 *** | −0.011 ** | −0.011 ** | −0.011 ** |
| (0.0044) | (0.0045) | (0.0045) | (0.0050) | (0.0050) | (0.0051) | |
***, **, and * here denotes significance at the 1%, 5%, and 10% confidential levels, respectively. Yes in the table denotes we control the corresponding fixed effect.
Table 4.
Identification checks: impact of the tax collection reform on covariates.
| (1) | (2) | (3) | (4) | |
|---|---|---|---|---|
| Bandwidth | Outputvlue | Age | VAT Value | CIT Value |
| Bandwidth = 1.9 | −0.360 | 0.007 | -- | −0.930 |
| (0.544) | (0.119) | -- | (1.034) | |
| Bandwidth = 3.8 | −0.133 | 0.128 | −0.447 | −0.639 |
| (0.347) | (0.194) | (0.485) | (0.630) | |
| Bandwidth = 5.7 | −0.008 | 0.299 * | −0.256 | −0.508 |
| (0.278) | (0.157) | (0.390) | (0.482) |
* here denotes significance at the 10% confidential level.
Table 5.
Identification Checks: Placebo test on SOEs, FOEs and the cut-off dates.
| (1) | (2) | (3) | (4) | (5) | (6) | (7) | (8) | (9) | (10) | |
|---|---|---|---|---|---|---|---|---|---|---|
| SOE and FOE | +4 Months | +3 Months | +2 Months | +1 Month | −1 Month | −2 Months | −3 Months | −4 Months | ||
| Bandwidth = 1.9 | 0.434 | 0.085 | 0.117 | −0.149 | 0.222 | 0.084 | 0.217 | 0.214 | 0.129 | −0.311 |
| (0.367) | (0.470) | (0.208) | (0.537) | (0.337) | (0.278) | (0.225) | (0.24) | (0.222) | (0.239) | |
| Bandwidth = 3.8 | 0.304 | 0.341 | 0.199 | 0.099 | 0.244 | −0.225 | 0.245 | 0.294 | 0.039 | −0.316 |
| (0.281) | (0.402) | (0.17) | (0.337) | (0.223) | (0.202) | (0.169) | (0.183) | (0.178) | (0.167) | |
| Bandwidth = 5.7 | 0.327 | 0.396 | 0.243 | 0.220 | 0.087 | −0.277 | 0.118 | 0.139 | −0.049 | −0.180 |
| (0.228) | (0.337) | (0.151) | (0.245) | (0.182) | (0.173) | (0.147) | (0.155) | (0.151) | (0.144) | |
Control variables include the firm size, the firm age, corporate income tax revenue, and value-added tax revenue.
Table 6.
The effect of tax collection reform on land prices by using parametric estimation.
| (1) | (2) | (3) | (4) | (5) | (6) | (7) | (8) | (9) | |
|---|---|---|---|---|---|---|---|---|---|
| 2 Months | 4 Months | 6 Months | 2 Months | 4 Months | 6 Months | 2 Months | 4 Months | 6 Months | |
| shock | −0.440 *** | −0.404 * | −0.372 ** | −0.583 * | −0.658 * | −0.525 * | −0.786 ** | −0.812 ** | −0.502 * |
| (0.155) | (0.216) | (0.162) | (0.344) | (0.363) | (0.272) | (0.368) | (0.375) | (0.284) | |
| |month| | 0.161 | −0.063 | −0.014 | 0.258 | −0.005 | 0.022 | 0.060 | −0.046 | −0.013 |
| (0.134) | (0.044) | (0.025) | (0.191) | (0.057) | (0.032) | (0.208) | (0.061) | (0.034) | |
| shock*|month| | 0.108 | 0.077 | 0.001 | 0.055 | 0.074 | 0.079 | |||
| (0.097) | (0.049) | (0.121) | (0.061) | (0.127) | (0.064) | ||||
| Outputvlue | −0.086 | −0.028 | −0.022 | −0.184 | −0.002 | −0.009 | |||
| (0.119) | (0.069) | (0.053) | (0.122) | (0.072) | (0.055) | ||||
| Age | 0.115 | 0.395 | 0.154 | 0.378 | 0.448 | 0.112 | |||
| (0.325) | (0.259) | (0.2) | (0.368) | (0.274) | (0.208) | ||||
| VAT value | −0.031 | −0.068 | −0.055 | −0.013 | −0.054 | −0.027 | |||
| (0.082) | (0.051) | (0.04) | (0.093) | (0.057) | (0.043) | ||||
| CIT value | 0.051 | 0.032 | 0.027 | 0.092 | 0.039 | 0.038 | |||
| (0.06) | (0.037) | (0.029) | (0.062) | (0.039) | (0.031) | ||||
| Constants | 4.969 *** | 5.065 *** | 5.012 *** | 5.935 *** | 7.075 *** | 6.352 *** | 6.848 *** | 6.214 *** | 5.136 *** |
| (0.096) | (0.085) | (0.074) | (1.478) | (1.097) | (0.983) | (1.663) | (1.183) | (1.045) | |
| Year Dummy | No | No | No | Yes | Yes | Yes | Yes | Yes | Yes |
| Industry Dummy | No | No | No | No | No | No | Yes | Yes | Yes |
| R-squared | 0.037 | 0.016 | 0.009 | 0.112 | 0.112 | 0.092 | 0.448 | 0.264 | 0.187 |
***, **, and * here denotes significance at the 1%, 5%, and 10% confidential levels, respectively. “Yes” in the table denotes that we control the corresponding fixed effect.
Table 7.
Alternative Explanation: Impact of joining WTO on land prices.
| (1) | (2) | (3) | (4) | |
|---|---|---|---|---|
| Land Price | Land Price | Land Price | Land Price | |
| Shock | −0.151 *** | −0.163 *** | −0.141 *** | −0.154 *** |
| (0.031) | (0.031) | (0.031) | (0.03) | |
| Export | 0.042 | 0.068 | 0.009 | 0.033 |
| (0.043) | (0.043) | (0.043) | (0.042) | |
| Export*shock | 0.017 | −0.035 | 0.022 | −0.032 |
| (0.054) | (0.053) | (0.053) | (0.052) | |
| Constants | 5.246 *** | 6.111 *** | 4.096 *** | 4.394 *** |
| (0.104) | (0.896) | (0.144) | (0.876) | |
| Controls | Yes | Yes | Yes | Yes |
| Time fixed effect | No | Yes | No | Yes |
| Industry fixed effect | No | No | Yes | Yes |
| Obs. | 5503 | 5503 | 5503 | 5503 |
| R-squared | 0.008 | 0.048 | 0.074 | 0.117 |
*** here denotes significance at the 1% confidential level. Control variables include the firm size, the firm age, corporate income tax revenue, and the revenue from the value-added tax. “Yes” in the table denotes that we control the corresponding fixed effect.
Table 8.
Alternative Explanation: Impact of the tax collection reform on financial constraints.
| (1) | (2) | (3) | (4) | (5) | |
|---|---|---|---|---|---|
| Bandwidth | ROA | SA | Sales Margin | Liability Rate | Long-Term Liability Rate |
| Bandwidth = 1.9 | −0.046 | −0.149 | −0.085 | 0.038 | −0.019 |
| (0.073) | (0.133) | (0.102) | (0.22) | (0.072) | |
| Bandwidth = 3.8 | −0.053 | −0.005 | 0.002 | -- | 0.025 |
| (0.046) | (0.082) | (0.062) | (--) | (0.046) | |
| Bandwidth = 5.7 | −0.043 | −0.046 | −0.033 | −0.066 | 0.001 |
| (0.054) | (0.103) | (0.078) | (0.154) | (0.055) |
Publisher’s Note: MDPI stays neutral with regard to jurisdictional claims in published maps and institutional affiliations. |
© 2022 by the authors. Licensee MDPI, Basel, Switzerland. This article is an open access article distributed under the terms and conditions of the Creative Commons Attribution (CC BY) license (https://creativecommons.org/licenses/by/4.0/).
Share and Cite
MDPI and ACS Style
Song, H.; Sun, G. Investment Promotion, Tax Competition, and Industrial Land Price in China—Evidence from the Corporate Tax Collection Reform. Land 2022, 11, 682. https://0-doi-org.brum.beds.ac.uk/10.3390/land11050682
AMA Style
Song H, Sun G. Investment Promotion, Tax Competition, and Industrial Land Price in China—Evidence from the Corporate Tax Collection Reform. Land. 2022; 11(5):682. https://0-doi-org.brum.beds.ac.uk/10.3390/land11050682
Chicago/Turabian StyleSong, Huasheng, and Guili Sun. 2022. "Investment Promotion, Tax Competition, and Industrial Land Price in China—Evidence from the Corporate Tax Collection Reform" Land 11, no. 5: 682. https://0-doi-org.brum.beds.ac.uk/10.3390/land11050682
Note that from the first issue of 2016, this journal uses article numbers instead of page numbers. See further details here.