Article

Study on the Coupling System of Grain-Grass-Livestock of Herbivorous Animal Husbandry in Agricultural Areas: A Case Study of Najitun Farm of Hulunbuir Agricultural Reclamation in China

1
State Key Laboratory of Urban and Regional Ecology, Research Center for Eco-Environmental Sciences, China Academy of Sciences, Beijing 100085, China
2
Institute of Agricultural Economics and Development, Chinese Academy of Agricultural Sciences, Beijing 100081, China
*
Author to whom correspondence should be addressed.
Submission received: 7 April 2022 / Revised: 30 April 2022 / Accepted: 2 May 2022 / Published: 6 May 2022
(This article belongs to the Special Issue Land Use and Livelihood Change)

Abstract

:
With the population growth and the upgrading of residents’ food consumption structures, the consumption demand for herbivorous animal products will maintain relatively rapid growth. However, restrictive factors for the development of herbivorous animal husbandry in pastoral areas have increased, and how to undertake herbivorous animal husbandry in agricultural areas has become the focus of widespread social concern. This study is based on survey data of Najitun Farm of Hulunbuir Agricultural Reclamation in China. Through field investigation and computer simulation technology of system dynamics, a development system of herbivorous animal husbandry in agricultural areas was established with the development of herbivorous animal husbandry at the core, and the balance of grassland-livestock and the combination of planting-breeding as the constraint. Moreover, the system designs the development strategy compared with the development of system inertia—strengthening and optimizing herbivorous animal husbandry and optimizing the structure of grain, economy, and the feed planting industry, and simulates the above three scenarios, respectively. The study found that without any development strategy, the inertia trend is subject to the influence of factors such as the scale of female livestock, epidemic diseases, and breeding level, so it is difficult to realize the sustainable development of the industry in the next five years. However, expanding the scale of breeding alone will occupy too much environmental capacity, and there will be a shortage in the supply of grass for a long time. According to the scheme of optimizing the structure of the grain, economy, and feed planting industry, it will not only provide feed sources for grass-feeding livestock of about 58,200 sheep units, but also realize the total agricultural output value of USD 7.02 million by the end of the 14th Five-Year Plan, which is 1.89 times of the inertia trend. At the same time, the nutrient demand of grass crops has alleviated 20.42% of the environmental pressure. Based on the results of this study, it is proven that herbivorous animal husbandry has a broad development potential in agricultural areas, and at the same time, it contributes to decisions of developing herbivorous animal husbandry in agricultural areas. This study has important theoretical and practical significance for expanding the industrial space and building a new type of planting-breeding relationship.

1. Introduction

Herbivorous animal husbandry is an industry that uses the special rumen structure of herbivores to convert non-grain resources into animal food [1]. With the development of economy and society, people’s living standards have improved steadily, and the consumption structure of residents has also changed. This is mainly reflected in the gradual slowdown in residents’ demands for traditional grain products, while the consumption of herbivorous animal products has increased very rapidly. This change has been particularly pronounced in developing countries. Taking the four BRICS countries of Brazil, China, Russia, and South Africa as an example, according to the statistics of the Food and Agriculture Organization of the United Nations (FAO), the per capita food consumption of BRICS residents increased 1.64 times from 69.81 kg in 1961 to 184.21 kg in 2019 during the nearly 60 years from 1961 to 2019 when records were available. The consumption of beef, mutton, and milk as the main herbivorous livestock products increased from 12.31 kg to 58.65 kg, a 3.76-times increase. According to this development trend, consumption demand for herbivorous animal products will continue to increase rapidly for a long period in the future [2]. At the same time, traditionally, the production of herbivorous animal husbandry in our country mainly comes from grassland pastoral areas. However, due to long-term overload and overgrazing, grassland degradation has occurred. At this stage, the supply capacity of herbivorous animal products in pastoral areas is very limited. While agricultural areas are vast and fertile, the land resources, water, and heat conditions are good, and grass resources are abundant, which are suitable for the development of herbivorous animal husbandry. For this reason, many scholars have put forward the hypothesis of undertaking the transfer of herbivorous animal husbandry in agricultural areas [3,4,5].
Although the agricultural area has the potential for the development of herbivorous animal husbandry, it still faces some problems. The agricultural area is an important traditional farming area in the world. The planting industry mainly produces rice, wheat, corn, and other traditional grains. Animal husbandry is a single structure dominated by grain-consuming monogastric animals, such as pigs and chickens. Relatively speaking, herbivorous animal husbandry is underdeveloped. Such an agricultural structure consumes a lot of food and threatens food security [6]. In addition, in recent years, in the food consumption structure of the global population, as the proportion of herbivorous animal products has continued to increase [7], this has led to the contradiction between people-food-grass-livestock agricultural areas and the problem of environmental constraints has become increasingly prominent [8,9,10]. Therefore, how to develop herbivorous animal husbandry in agricultural areas is the focus of this study.
As early as 1943, the book “Farming for Security” first described the phenomenon of the decline of soil fertility caused by the extensive production of some farmers in the United States. It also put forward the development of grassland agriculture, promoted cultivating grass in cultivated land, maintaining soil and water, fertility, and the development of a herbivorous animal husbandry agricultural development strategy [11]. Grassland agriculture has become a typical model of agricultural colocalization for a time [12], and a series of decision-making schemes for systematic grass-livestock relationship management have emerged [13,14]. For example, Zhang W S et al. [15] used binary logistic regression to integrate the alfalfa–maize rotation planting model into the shed-fed production system of mutton sheep. They found that single planting of alfalfa is not enough to support economic development, single planting of corn is often affected by the climate, and only mixed planting can achieve the sustainability of the sheep feeding system. Lei Y D et al. [16] used a simple input–output equation to evaluate the comprehensive agricultural benefits of different cropping patterns in the arid areas and found that the grain-change-grass mode reduced ecological pressure by 87.79% compared with the grain-based planting mode, an increase of about USD 564.69 (based on 2016 exchange rates) in economic income per hectare have achieved diversification of income sources, indicating that agricultural producers have a certain degree of acceptance of the policy of planting grass and raising livestock. In addition, Li F J et al. [17] introduced a system dynamics method based on the characteristics of dynamic feedback of the beef cattle industry chain, and designed simulation models of subsystems, including breeding, waste discharge and utilization, crop production, and straw recycling, etc., to realize the dynamic operation of the beef cattle industry chain. In addition, scholars based on the China Agricultural Sustainable Development Decision Support System (CHINAGRO) designed under the general equilibrium framework to evaluate the potential of the grass industry in an agricultural area [18] and the potential of agricultural herbivorous animal husbandry [19] conducted an in-depth study. The existence of the above-mentioned research results provides valuable reference and methodological support for the design and optimization of herbivorous animal husbandry systems in agricultural areas from different perspectives.
Through searching literature, it is found that herbivorous animal husbandry is a product of economic and social development stages [20]. Existing research is mostly qualitative, or a single system, even though multiple systems fail to achieve dynamic feedback between systems. According to the theory of grassland agriculture, compared with traditional agriculture, the herbivorous animal husbandry system has obvious economic and ecological attributes, economically guarantees higher biological yields, and ecologically emphasizes the cycle and feedback between plants and animals, that is grass-livestock integrated and a combination of planting-breeding [21]. Therefore, the production process of herbivorous animal husbandry in agricultural areas is full of the interweaving of the natural reproduction process and economic reproduction process. In such a system, there are many elements and different attributes [22]. The interrelationships among the various constituent elements are both causal and complex, and they are not all linearly related. Therefore, the herbivorous animal husbandry system has the characteristics of high-order (multiple state variables), non-linearity, and multiple feedback (multiple elements are causal to each other). Although the traditional econometric model can capture the basic dynamic characteristics of each element through parameters, if the element attributes are different, the model cannot be expressed completely, and an error in the estimation result can be obtained [23]. Only the structure–function model can reveal the causes and processes of system changes [24].
Inspired by this idea, this research relied on the core demonstration base of Hulunbuir Agricultural Reclamation, which is the project supported by the ‘Strategic Priority Research Program of the Chinese Academy of Sciences “Ecological Grass-Based Livestock Husbandry Special Project”’. Based on the follow-up survey data of Najitun Farm since 2019, the main research ideas are: cultivated grass in cultivated land, grain–grass coupling production, and efficient transformation of herbivorous livestock; using system dynamics simulation as a technical means, through scientifically and accurately constructing a system of herbivorous animal husbandry development strategies, designing different development strategies, and simulating the industrial development effects and optimization strategies under different strategies; and aiming to promote rationally the structural adjustment of the grain-cash-grass planting industry in the agricultural area, the transformation and upgrading of the herbivorous animal husbandry, and the sustainable development of the grassland agriculture system, provide references for the industrial planning and production decision-making of the government, enterprises and other business entities.

2. Study Area and Data
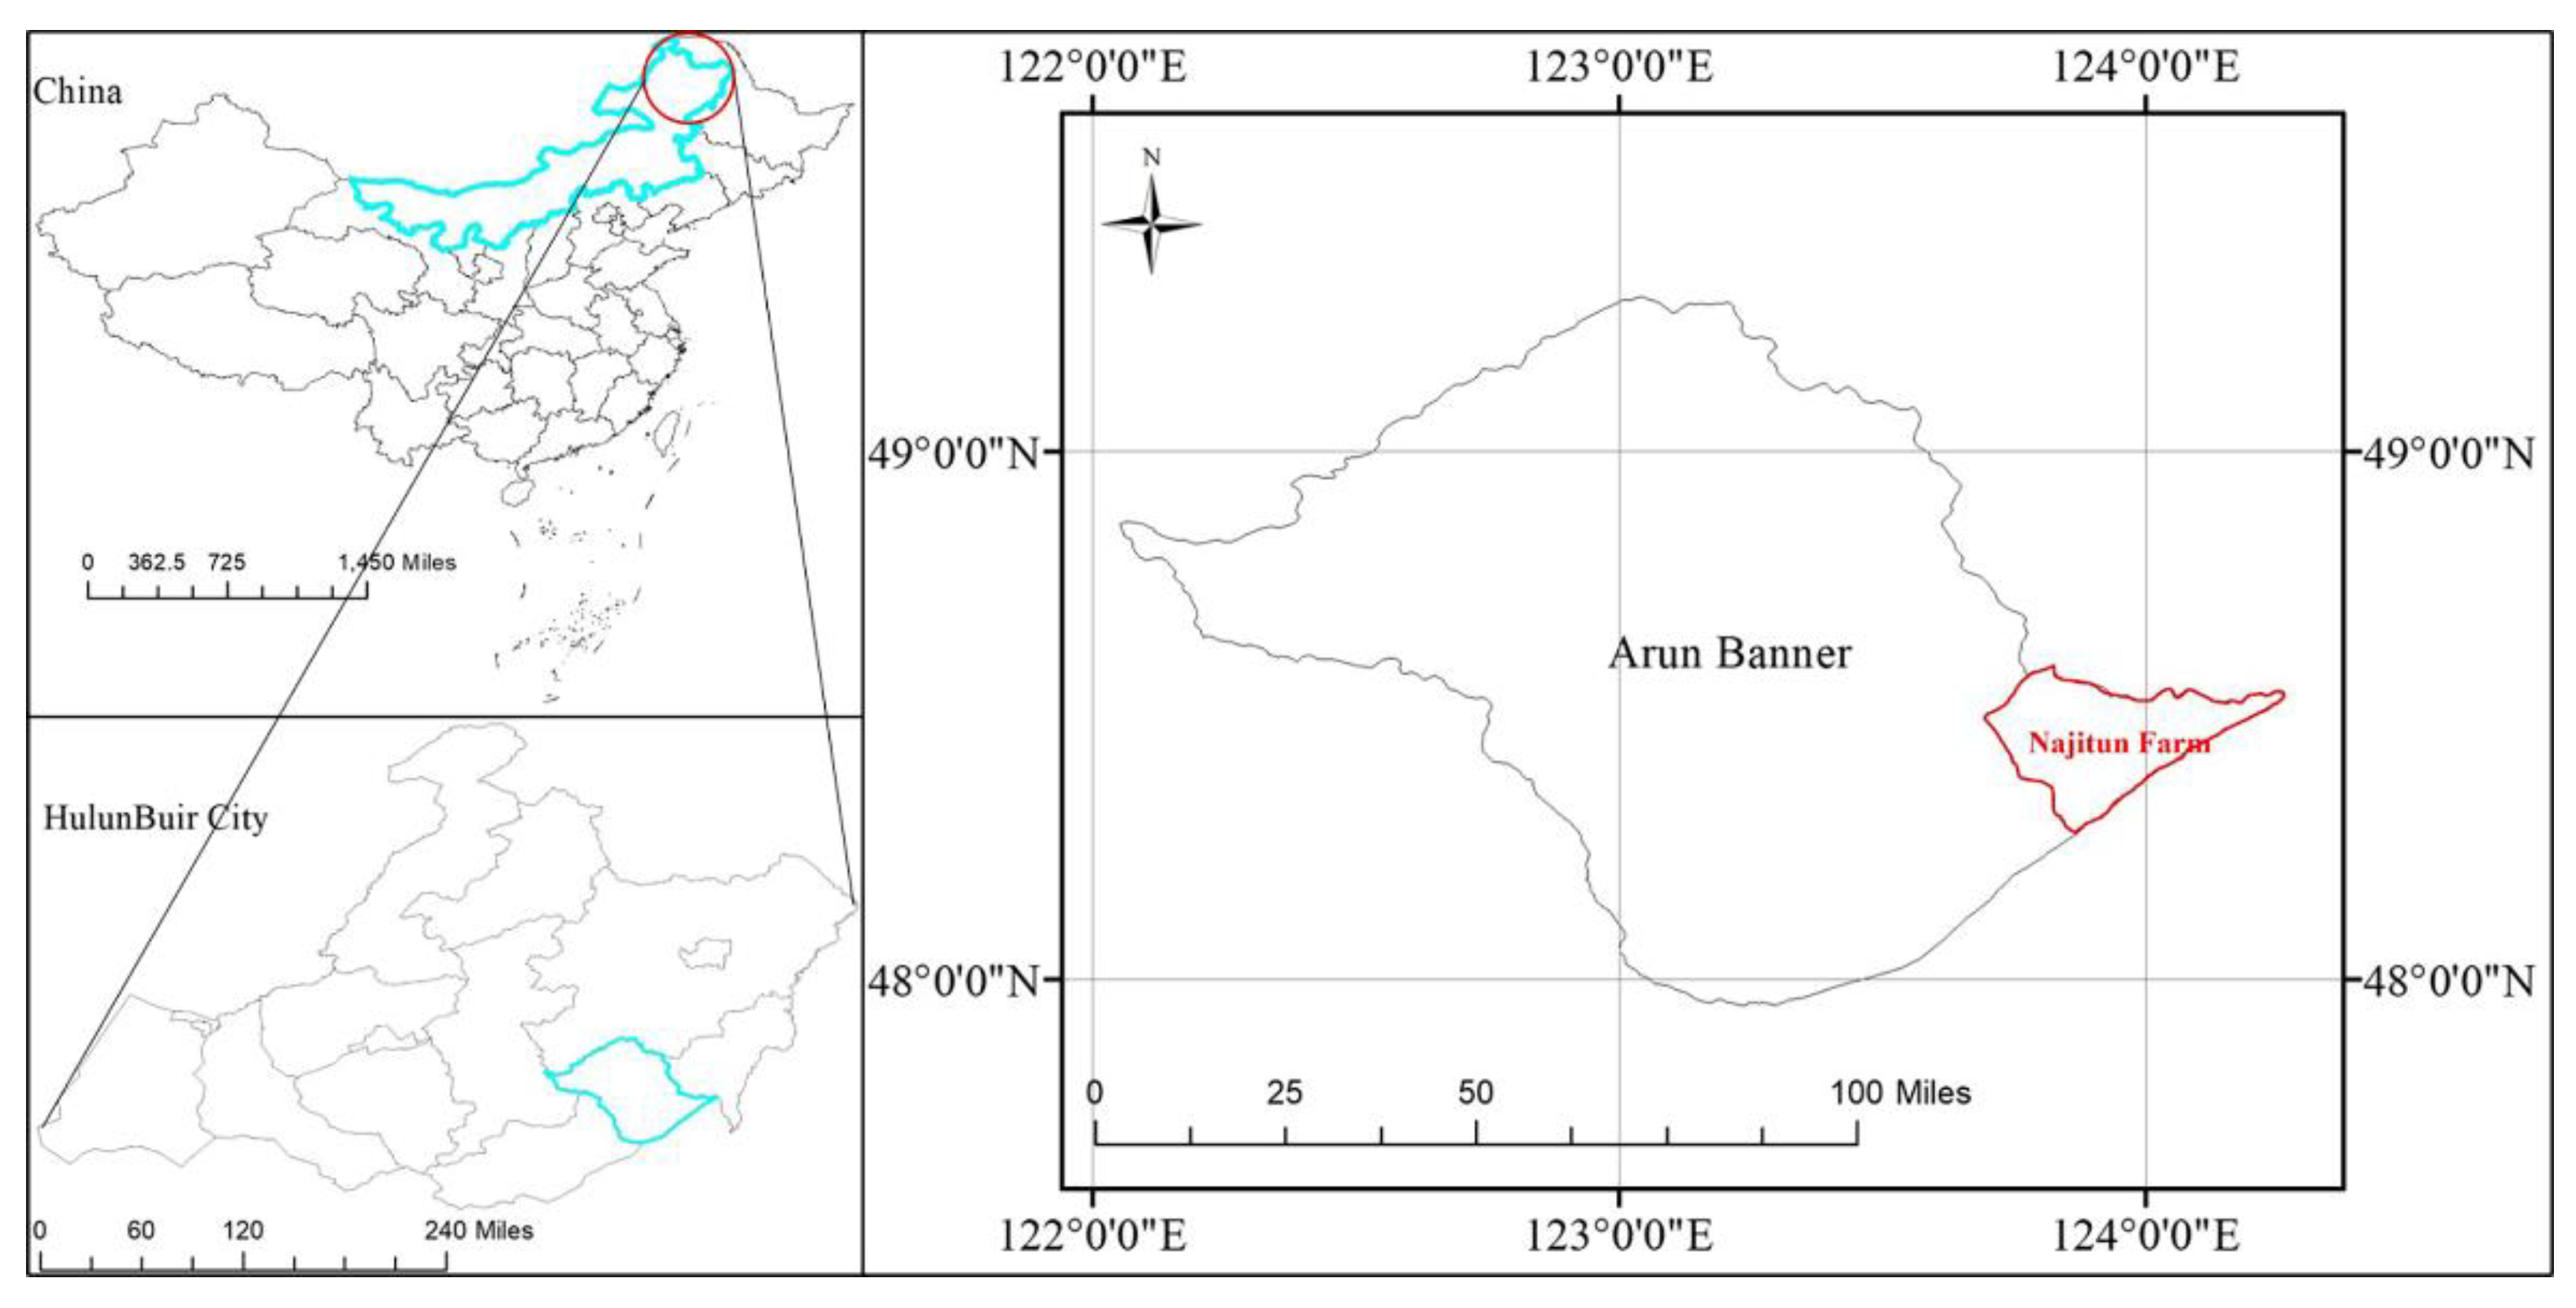
2.1. Study Area

Najitun Farm is located in the territory of Arun Banner at the southeast foot of the Daxingan Mountains in Hulunbuir, Inner Mongolia Autonomous Region. The geographical coordinates are between east longitude 123°26′23″~123°47′00″ and north latitude 48°04′58″~48°18′02″ (Figure 1). The annual frost-free period is generally about 120 days, the annual average precipitation is 380–460 mm, and the annual accumulated temperature is generally between 2300~2500 °C, which belongs to the cold temperate continental monsoon climate. The total area of the site is 332.25 km2, including 22,800 hm2 of cultivated land and 4200 hm2 of grassland. The soil in the whole site is black, chernozem, and other humus and high organic matter content, rich in nutrients, suitable for corn, soybean, wheat, potato, sunflower, and other grain crops, and has made outstanding contributions to my country’s food security and food safety. The population of Najitun Farm is 18,495, among which 6006 are employees. Calculated by the total population, the per capita arable land is 1.23 hm2, and the population density is 55.67 population/km2.
There is contiguous land in the construction area of Najitun Farm, which includes both cultivated land and grassland, as well as plantation and animal husbandry. It is the farm with the most complete agricultural industry structure among the 13 farms in the East Fourth Banner of Hulunbuir Agricultural Reclamation. Therefore, Najitun Farm as a case area, and the design of a development system of herbivorous animal husbandry in the agricultural area, is more universal. In addition, according to the deployment of the Central Committee of the Communist Party of China, as well as the agricultural and animal husbandry development plan and the dairy industry revitalization plan of the Ministry of Agriculture and Rural Affairs, the Inner Mongolia Autonomous Region and Hulunbuir City, Agricultural Area in the eastern Greater Hinggan Mountains will be built into an intensive and efficient agricultural and animal husbandry development area. Among them, it is planned to rely on the advantages of Najitun standardized breeding base, slaughter line, and cold storage, adhere to the development principle of “grass-livestock integrated and combining planting-breeding”, build the beef and mutton breeding base and 5000 demonstration pastures for whole herds of cows, and strive to achieve the goal of USSD 15,735.64 (based on 2022 exchange rates) per capita annual income at the end of the 14th Five-Year Plan period. The herbivorous animal husbandry of Najitun Farm ushered in a rare development opportunity. Although the adaptability of developing herbivorous animal husbandry in Najitun Farm is theoretically stronger than that in pastoral areas, the overall level is still low, which is mainly reflected in the insufficient stocking of basic mother animals, the single planting structure, and the frequent occurrence of cow diseases affecting the death rate. Therefore, it is urgent to carry out in-depth research on the design and optimization of development strategies for herbivorous animal husbandry and put forward the adjustment scheme of “make up and enhanced weaknesses, and consolidation of advantages”, so as to provide decision-making reference for the sustainable development of herbivorous animal husbandry in agricultural areas.

2.2. Data Sources

The system dynamics model of herbivorous animal husbandry development in agricultural areas established in this study involves the scale of herbivorous livestock breeding, grain-grass-livestock production chain, land scale, planting structure, employee structure and related process technology data that came from the research group to Hulunbuir Agricultural Reclamation long-term baseline survey of Najitun Farm, and from the statistical annual report of the finance department (2016–2019) and other official documents. Since the data and technical parameters of this study are derived from the actual production, it makes up for the shortcomings of parameter trial-and-error in the simulation experiment and makes the designed herbivorous animal husbandry system in agricultural areas closer to the realistic system.

3. Research Methods

3.1. Applicability Interpretation of System Dynamics

The herbivorous animal husbandry system’s production process can theoretically include four levels, namely pre-primary production, primary production, secondary production and post-secondary production. In the process of reproduction, it is full of the interweaving of natural reproduction processes and economic reproduction processes; therefore, the herbivorous animal husbandry system is a large complex system with wide extension and deep connotation. There are many components of the complex system, and the interconnection between various components is both causal and complex, and not all of them are linearly related. Therefore, herbivorous animal husbandry systems are characterized by high order (multiple state variables), nonlinearity and multiple feedback (multiple elements are mutually causal). To complete the study of such large systems, the functional models developed by general quantitative methods cannot reveal the characteristics of the internal structure of the system. The importance of the system structure is that it can determine the function of the system; therefore, only the structure–function model may reveal the causes and processes of system changes. The herbivorous animal husbandry system dynamics model, precisely from the structural analysis of complex systems, establishes a structure–function model with high-order, multi-loop and non-linear characteristics, through the overall operation of the model, in order to demonstrate the dynamic process of system development, reveal the dynamics and obstacles of the development process, and propose ways and methods to improve the system behavior.

3.2. Threshold Setting

3.2.1. Grass-Livestock Balance Index

“Integration of agriculture and animal husbandry, circular development” is the basic principle of the development of herbivorous animal husbandry in China. Therefore, the system structure and threshold setting of this study are designed under this principle. The purpose is to highlight the driving planting by breeding, promote the combination of planting-breeding, and support the integration of grass-livestock, forming a virtuous cycle system of plant production, animal transformation, and microbial reduction.
The concept of grass-livestock balance can be divided into narrow and broad terms according to the source of grass. Grass-livestock balance originally refers to the amount of grass feed provided through grassland primary production or other means [25]. The usual calculation method is the ratio of the difference between the actual stocking capacity of the grassland and the allowable stocking capacity of the grassland to the theoretical stocking capacity. The above-mentioned concept of grass-livestock balance is based on natural grassland production, is the concept of grass-livestock balance before the adjustment of agricultural structure, and is a narrow concept of grass-livestock balance. At the same time, under the strategic background of advancing the adjustment of the agricultural structure and accelerating the development of grain economy and feed, by the principle of “grass determination by livestock” proposed by academician Fang J Y [3], considering the wide range of grass sources in agricultural areas, a generalized concept of grass-livestock balance was proposed based on the traditional concept of grass-livestock balance, that is, the total amount of available grass obtained through the structural adjustment of natural grassland and planting industry was dynamically balanced with the amount of grass required for raising livestock. The narrow grass-livestock balance and the broad grass-livestock balance are shown in formulas (1) and (2):
R n = G a - G b G a × 100 %
R g = ( G a + G c ) - G b G a + G c × 100 %
In the above formula, Rn is the narrow grass-livestock balance, Rg is the generalized grass-livestock balance, and the result is positive, indicating that the grassland is underloaded, and the result is negative, indicating that the grassland is overloaded; Ga is the theoretical livestock carrying capacity of natural grassland; Gb is the actual regional livestock carrying capacity; Gc is the theoretical livestock carrying capacity of artificially cultivated grassland and crop straw.
Among them, the calculation of the carrying capacity of the grassland refers to the calculation method of the NY/T635-2015 industry standard of the Ministry of Agriculture and Rural Affairs. The formula is:
G a / c = F u s e I × D
In formula (3), Fuse is the amount of available grass, I is the daily grass intake per standard sheep unit, and D is the grazing days. According to the research experience of related scholars in Hulunbuir [26,27], the daily grass intake per sheep unit is 1.8 kg (sheep unit a day), and the number of grazing days is 360 days; the conversion coefficient of standard livestock units according to the NY/T635-2015 standard of the Ministry of Rural Affairs, medium-sized sheep with a carcass weight of 40–50 kg, such as Hulunbuir sheep, take 1.0, and large-scale cows with carcasses above 500 kg, such as Sanhe cattle, Simmental and Holstein cattle, are taken as 8.0.
Generally speaking, when the grass-livestock balance index is positive, it indicates that the grassland is under-loaded, and when the result is negative, it indicates that the grassland is overloaded, which means that the grassland is at the risk of over-utilization.

3.2.2. Planting and Breeding Balance Index

The development of herbivorous animal husbandry must not only consider the balance of grass and livestock from the source of grass, but also consider the sustainable development of the ecological environment, consider the balance of planting and breeding, and achieve the coordination between the scale of industrial development and the quality of the ecosystem. Planting and breeding balance (some literature call it nutrient balance) refers to the rational planning of breeding scale from the perspective of material circulation in the planting and breeding system to prevent excessive production of livestock and poultry manure from increasing environmental pressure [28]. The total balance between nutrient supply in livestock and poultry emissions and nutrient demand for crop growth is usually measured by the planting and breeding balance index, which is described by the ratio of total nutrient demand per unit of land (usually nitrogen and phosphorus) to supply [29]. Numerous studies and practices have shown that the overload of phosphorus balance carrying capacity always precedes the overload of nitrogen balance carrying capacity [30]. Therefore, in order to facilitate the analysis, this study only considers the phosphorus balance carrying capacity in the calculation of the planting and breeding balance index. The detailed calculation process is as follows:
First, calculate the phosphorus emissions of different herbivorous livestock. According to the daily excretion of different animals and the phosphorus concentration value in the feces, multiplying the feeding period of the animal, the cumulative phosphorus emission of different animals can be calculated. The calculation method is in formula (4), and various animal feces, the recommended values of urine production, feeding cycle, and phosphorus content in manure are shown in Table 1. The feeding period of cattle and sheep is generally longer than one year. Therefore, the stock at the end of the year is the feeding amount. The specific calculation process of phosphorus nutrient production is shown in formula (5), and the unit is calculated in t:
NMi, P = Mi × Ci, P × Di × 10−3
In the formula, NMi, P is the phosphorus emissions of the different kinds of animals(i) in the area, unit in kg/head; Mi is the number of feces produced by the different kinds of animals(i) in the area each day, unit in kg/d; Ci, P is the different kinds of animals(i) phosphorus concentration in feces, unit in g/kg; D is the feeding cycle of the different kinds of animals(i), unit in day:
NMP = ΣNMi, P × Pi × 10−3
In the formula, NMP is the total phosphorus excretion of all animals in the area, unit in t; NMi, P is the total phosphorus excretion of species I animals in the area, unit in kg/ head; Pi is the first animal feed in the area, unit in head.
Then, calculate the phosphorus emissions of different herbivorous livestock. According to regional statistics on the output of major grain crops, cash crops, grass crops, and natural grassland production, multiplied by the amount of phosphorus required for each crop unit output, the recommended values of nutrient absorption per unit output of main crops are shown in Table 2. Cumulative summation obtains the total nutrient requirements of the crops in the area, the unit is calculated in t, and the specific calculation formula is as follows:
NAtotal, P = Σyi × ai × 10−2
In the formula, NAtotal, P is the total amount of phosphorus that needs to be absorbed under the total output of various crops in the area, unit in t; yi is the total output of the crop(i) in the region, unit in t; ai is the phosphorus absorbed by the crop(i) in 100 kg yield, unit in kg/100 kg.
Finally, calculate the phosphorus balance carrying capacity. In the total phosphorus emissions from all animals in the region, considering the loss of ammonia in the form of collection, storage and treatment process, the actual nutrient component that can supply farmland needs to be multiplied by a certain coefficient, and the calculation formula of regional manure supply can be obtained:
NMsup, P = NM × (1 − Plost)
In the formula, NMsup, P is the total supply of phosphorus in livestock and poultry manure in the area, unit in t; NM is the total phosphorus excreted by all animals in the area, unit in t; Plost is the loss rate of phosphorus in the management of livestock and poultry manure, generally 30%.
According to the total nutrient supply of various livestock and poultry manure in the area divided by the total area of the land, the total nutrient supply per unit of land can be obtained. The calculation formula is as follows:
N M a v e r a g e , p = N M sup , p × 1000 A r e a t o t a l
In the formula, NMsup, P is the total phosphorus nutrient supply of herbivores in the area, unit in t; Areatotal is the total land area in the area, unit in hm2; NMaverage, P is the manure nutrient supply per unit land area in the region, unit in kg/hm2.
According to the total nutrient requirement of the crop divided by the total land area of the area, the phosphorus nutrient requirement per unit land area can be obtained. The calculation formula is as follows:
N A a v e r a g e , p = N A sup , p × 1000 A r e a t o t a l
In the formula, NAtotal, P is the total amount of phosphorus that needs to be absorbed under the total output of various crops in the area, unit in t; Areatotal is the total land area in the area, unit in hm2; NAaverage, P is the average demand for phosphorus per unit land area in the area, unit in kg/hm2.
By multiplying the proportion coefficient of the highest replacement of fertilizer with manure in the region by the nutrient demand per unit cultivated land area, the nutrient demand per unit cultivated land area can be calculated. The calculation formula is as follows:
NAneed, P = NAaverage, P × Psubstitution
In the formula, NAaverage, P is the average phosphorus demand per unit land area in the area, unit in kg/hm2; Psubstitution is the manure utilization rate. According to the survey in Najitun Farm, the manure utilization rate for dairy cattle, beef cattle, and sheep is 25%, 25%, and 50%; NAneed, P is the phosphorus requirement per unit land area in the area after application of manure, unit in kg/hm2.
Referring to foreign experience and domestic related research results and standards, the phosphorus balance carrying capacity is obtained by using the unit land phosphorus supply, then the unit land phosphorus demand. If the phosphorus balance carrying capacity is greater than 1, it is overloaded, which means that the existing land resources cannot absorb the discharge of herbivorous livestock breeding. If the phosphorus balance carrying capacity is less than or equal to 1, it can be carried, meaning that existing land resources can absorb emissions from herbivorous animal husbandry.

3.3. System Structure Analysis

3.3.1. Modeling Purpose, Model Boundaries, and Hypotheses

The spatial boundary of the model is Najitun Farm. The selection of the time boundary of the model mainly refers to two important time nodes. First is 2016, which is the first year of the “social function reform” of the national agricultural reclamation system. The division of management functions and property rights is clearer, and data materials are more unified and neater. The second is 2025, which is the final year of the “14th Five-Year Plan” period. With 2020 as the boundary, we can look forward to the development of the Farm after the reform, find problems and make up for shortcomings. We can look forward to the 14th Five-Year Plan, the scientific and systematic plan Najitun Farm should adhere to for the development strategy of the herbivorous animal husbandry during the 14th Five-Year Plan period. Therefore, the model simulation time boundary is 2016 to 2025, divided into two periods, the first period is 2016 to 2019, the second period is 2020 to 2025, the base year is 2016, and the simulation time interval is 1 year. Among them, 2016 to 2019 is the test period of model operation and actual conditions, which can be used for model debugging and determination of related parameter variables. Further, 2020 to 2025 is the system policy simulation and forecast period. The simulation at this stage is to predict the next 6 years. The development trend of herbivorous animal husbandry and related systems will help to facilitate scenario analysis.
Reasonable hypotheses can simplify the model to highlight the main research issues. Given the objectives and content of this research, the following hypotheses are proposed:
(1) The industrial boundaries studied only include herbivorous animal husbandry, planting, and related processing industries, but not other industries. In the system dynamics model of herbivorous animal husbandry in the agricultural area involved in this study, herbivorous animal husbandry is the core. The planting industry system provides feed source and environmental carrying capacity for herbivorous animal husbandry through the adjustment of agricultural structure and provides a reference system for the scale management of herbivorous animal husbandry. Other industries have little impact on herbivorous animal husbandry. Therefore, to make the research goals more concentrated, industries other than herbivorous animal husbandry and planting are not considered within the industrial boundary. From the actual situation, in the past 4 years, herbivorous animal husbandry and planting also occupy a major position in the industrial structure of Najitun Farm. Agriculture is the pillar industry of Najitun Farm. The agricultural output value accounts for about 60.08% of the total Farm output value, which is much higher than the national average (7.42%), the total output value of herbivorous animal husbandry and planting accounted for about 93.42% of the total agricultural output value. The two major industries are an important part of the agricultural structure of Najitun Farm.
(2) The nature of the land will not change during the study period, and it is assumed that the area of natural grassland is at least not lower than the status quo. Land and space planning provides practical support for this hypothesis. The “Master Plan for Land Use in Hulunbuir” requires that construction and occupation of cultivated land in the area should be restricted, and grassland reclamation is strictly prohibited; at the same time, this hypothesis highlights a very strong reality when the land stock and reserve resources are limited. The historical data from 2016 to 2019 show that the proportion of cultivated land has increased from 62.38% in 2016 to 68.52%, the proportion of grassland has dropped from 29.08% to 18.66%, and the change rate of cultivated land is less than 10%. With steady changes, the area of grassland has decreased substantially. According to the requirements of the "Plan", the area of natural grassland should not continue to decrease in the future.
(3) During the study period, the social economy is stable and there is no time-variant. Generally speaking, other social abnormal events, such as major natural disasters, violent market volatility, and strikes will cause discretionary decisions in business management, resulting in time-varying social relations and economic structure. If social relations are unstable, it is difficult to have accurate sample extrapolation forecasts, and it is difficult to formulate effective economic policies; when the economic structure changes, even if the economic model can explain the history well, it may not be correct to make more accurate predictions in the future [31]. Therefore, social and economic stability is a prerequisite for prediction and program simulation. The reality of the farm benefits from the high level of agricultural machinery and agricultural technology in the agricultural reclamation system, which has played a role in water storage and moisture conservation, drought resistance and drainage, and disaster resistance, and livestock protection. The average yield area is only about 7.12%. Compared with other places, it is easier to withstand the impact of major emergencies and achieve stable production.

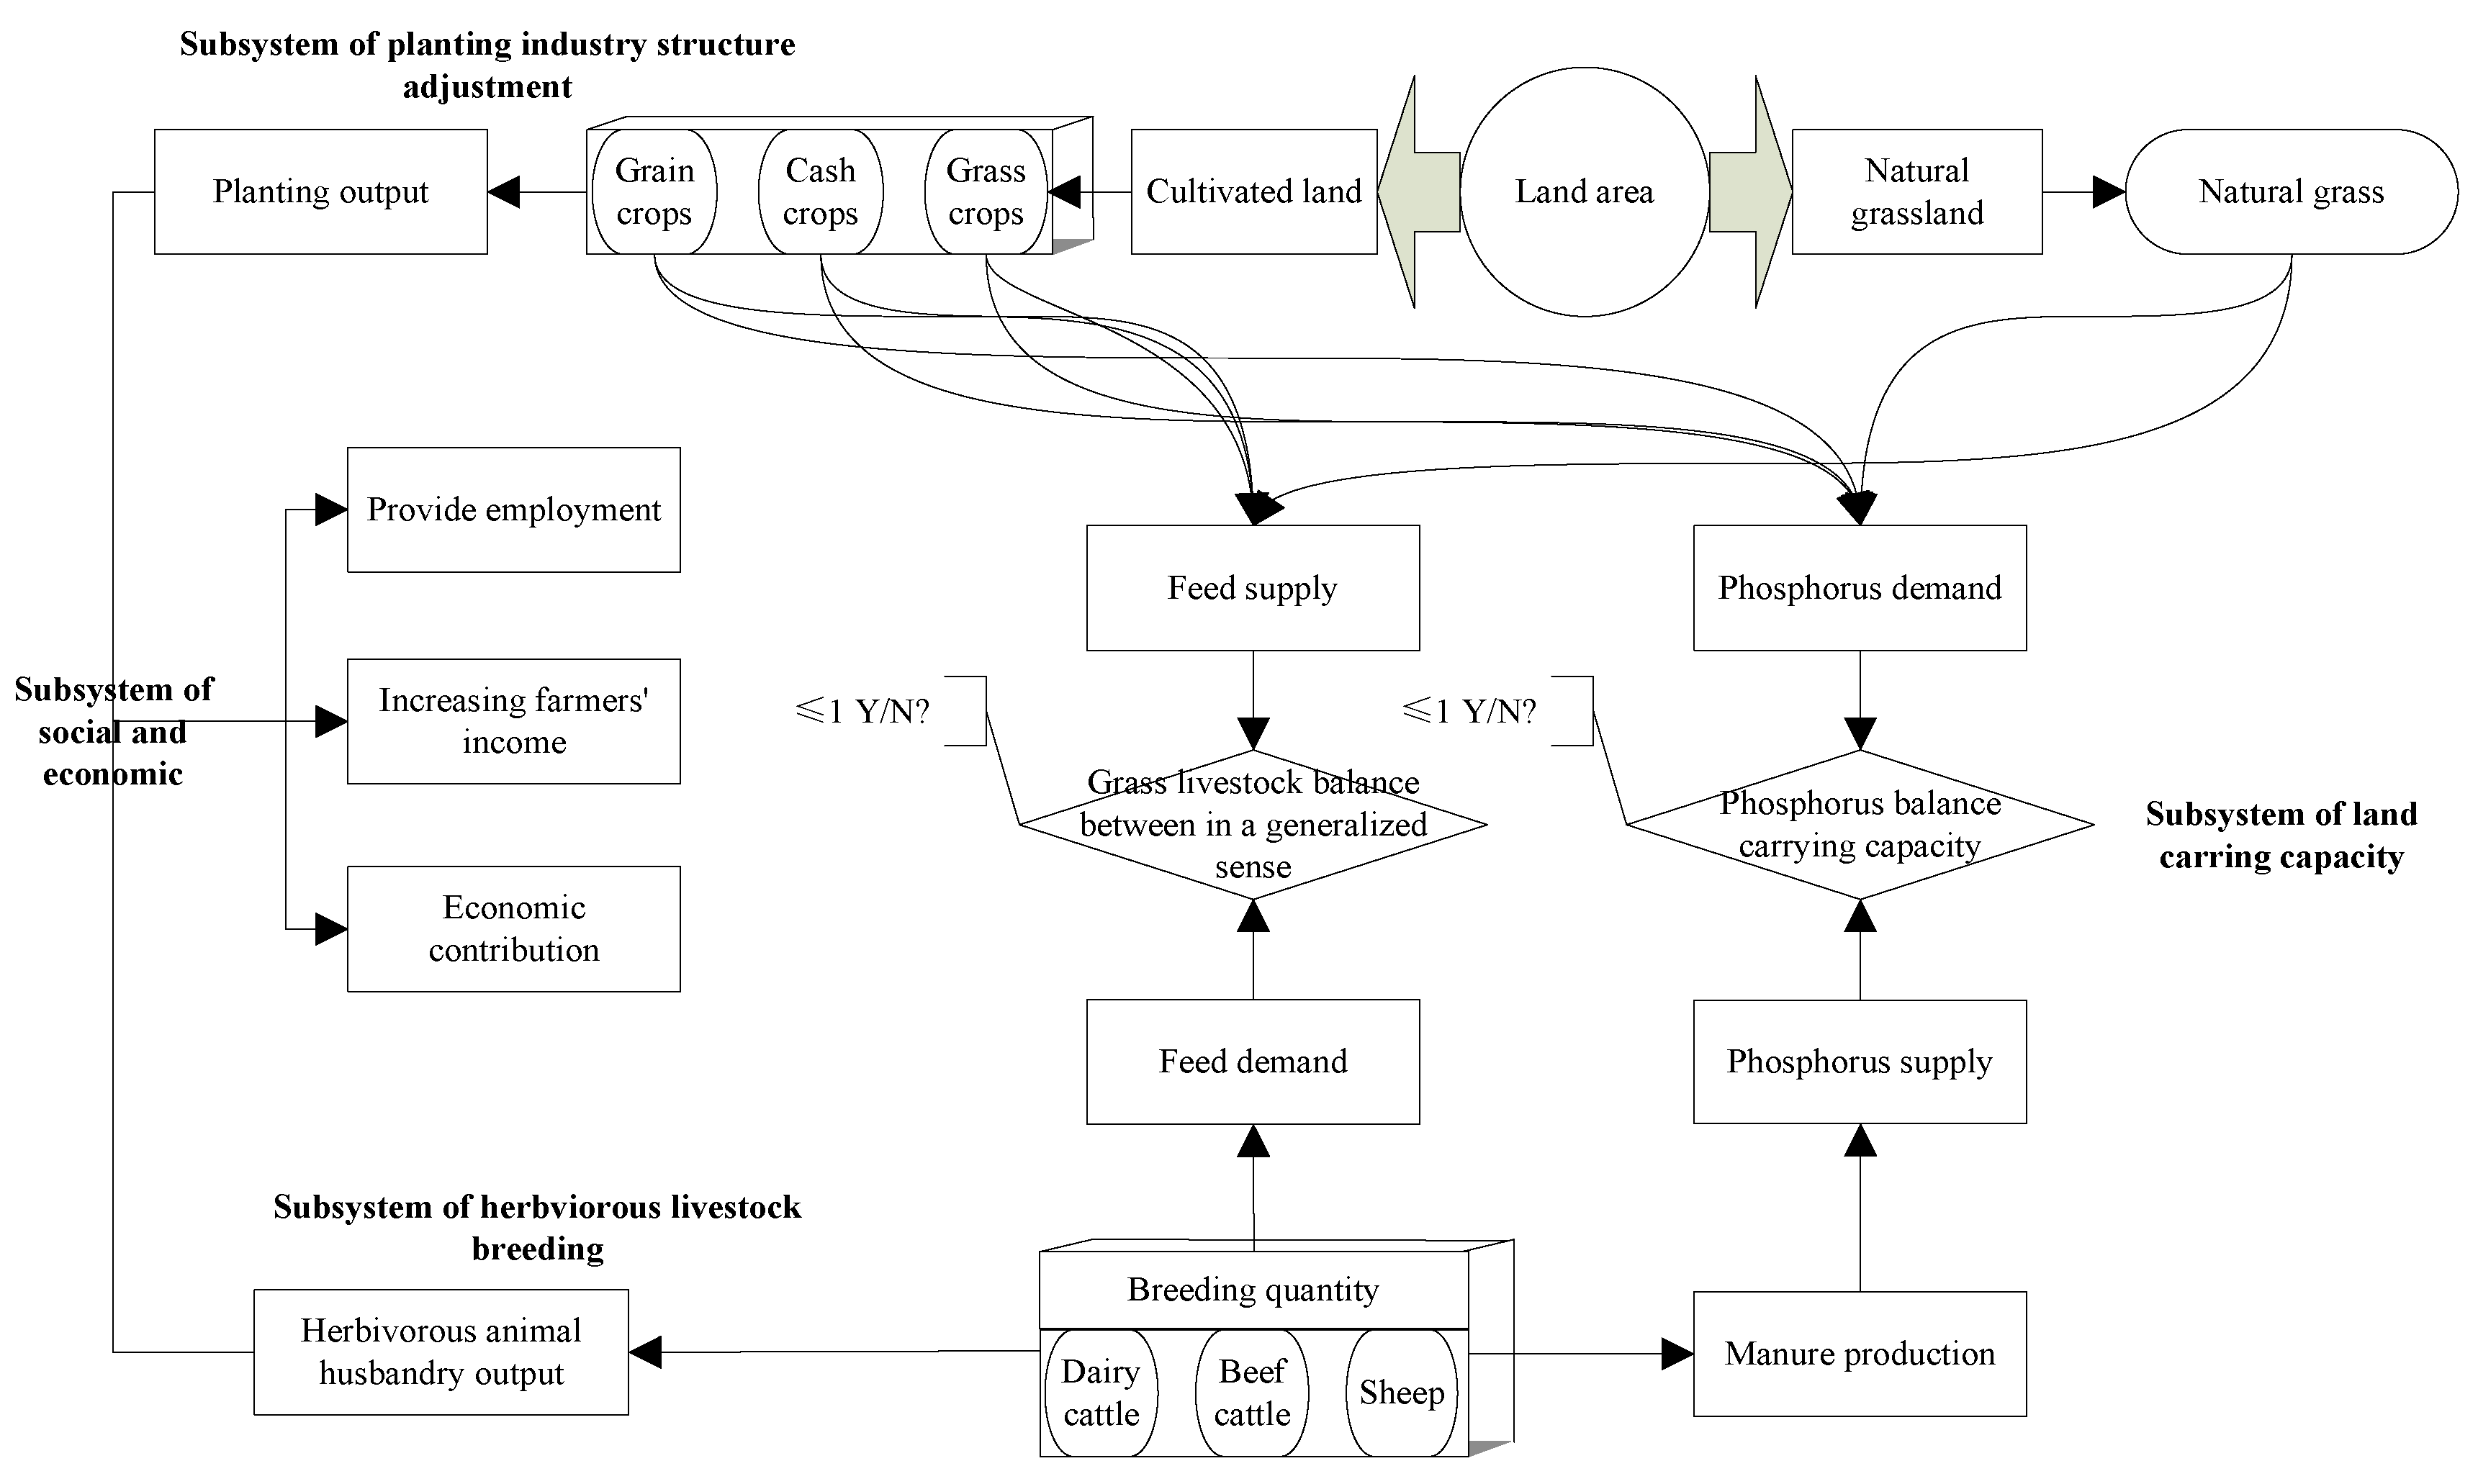
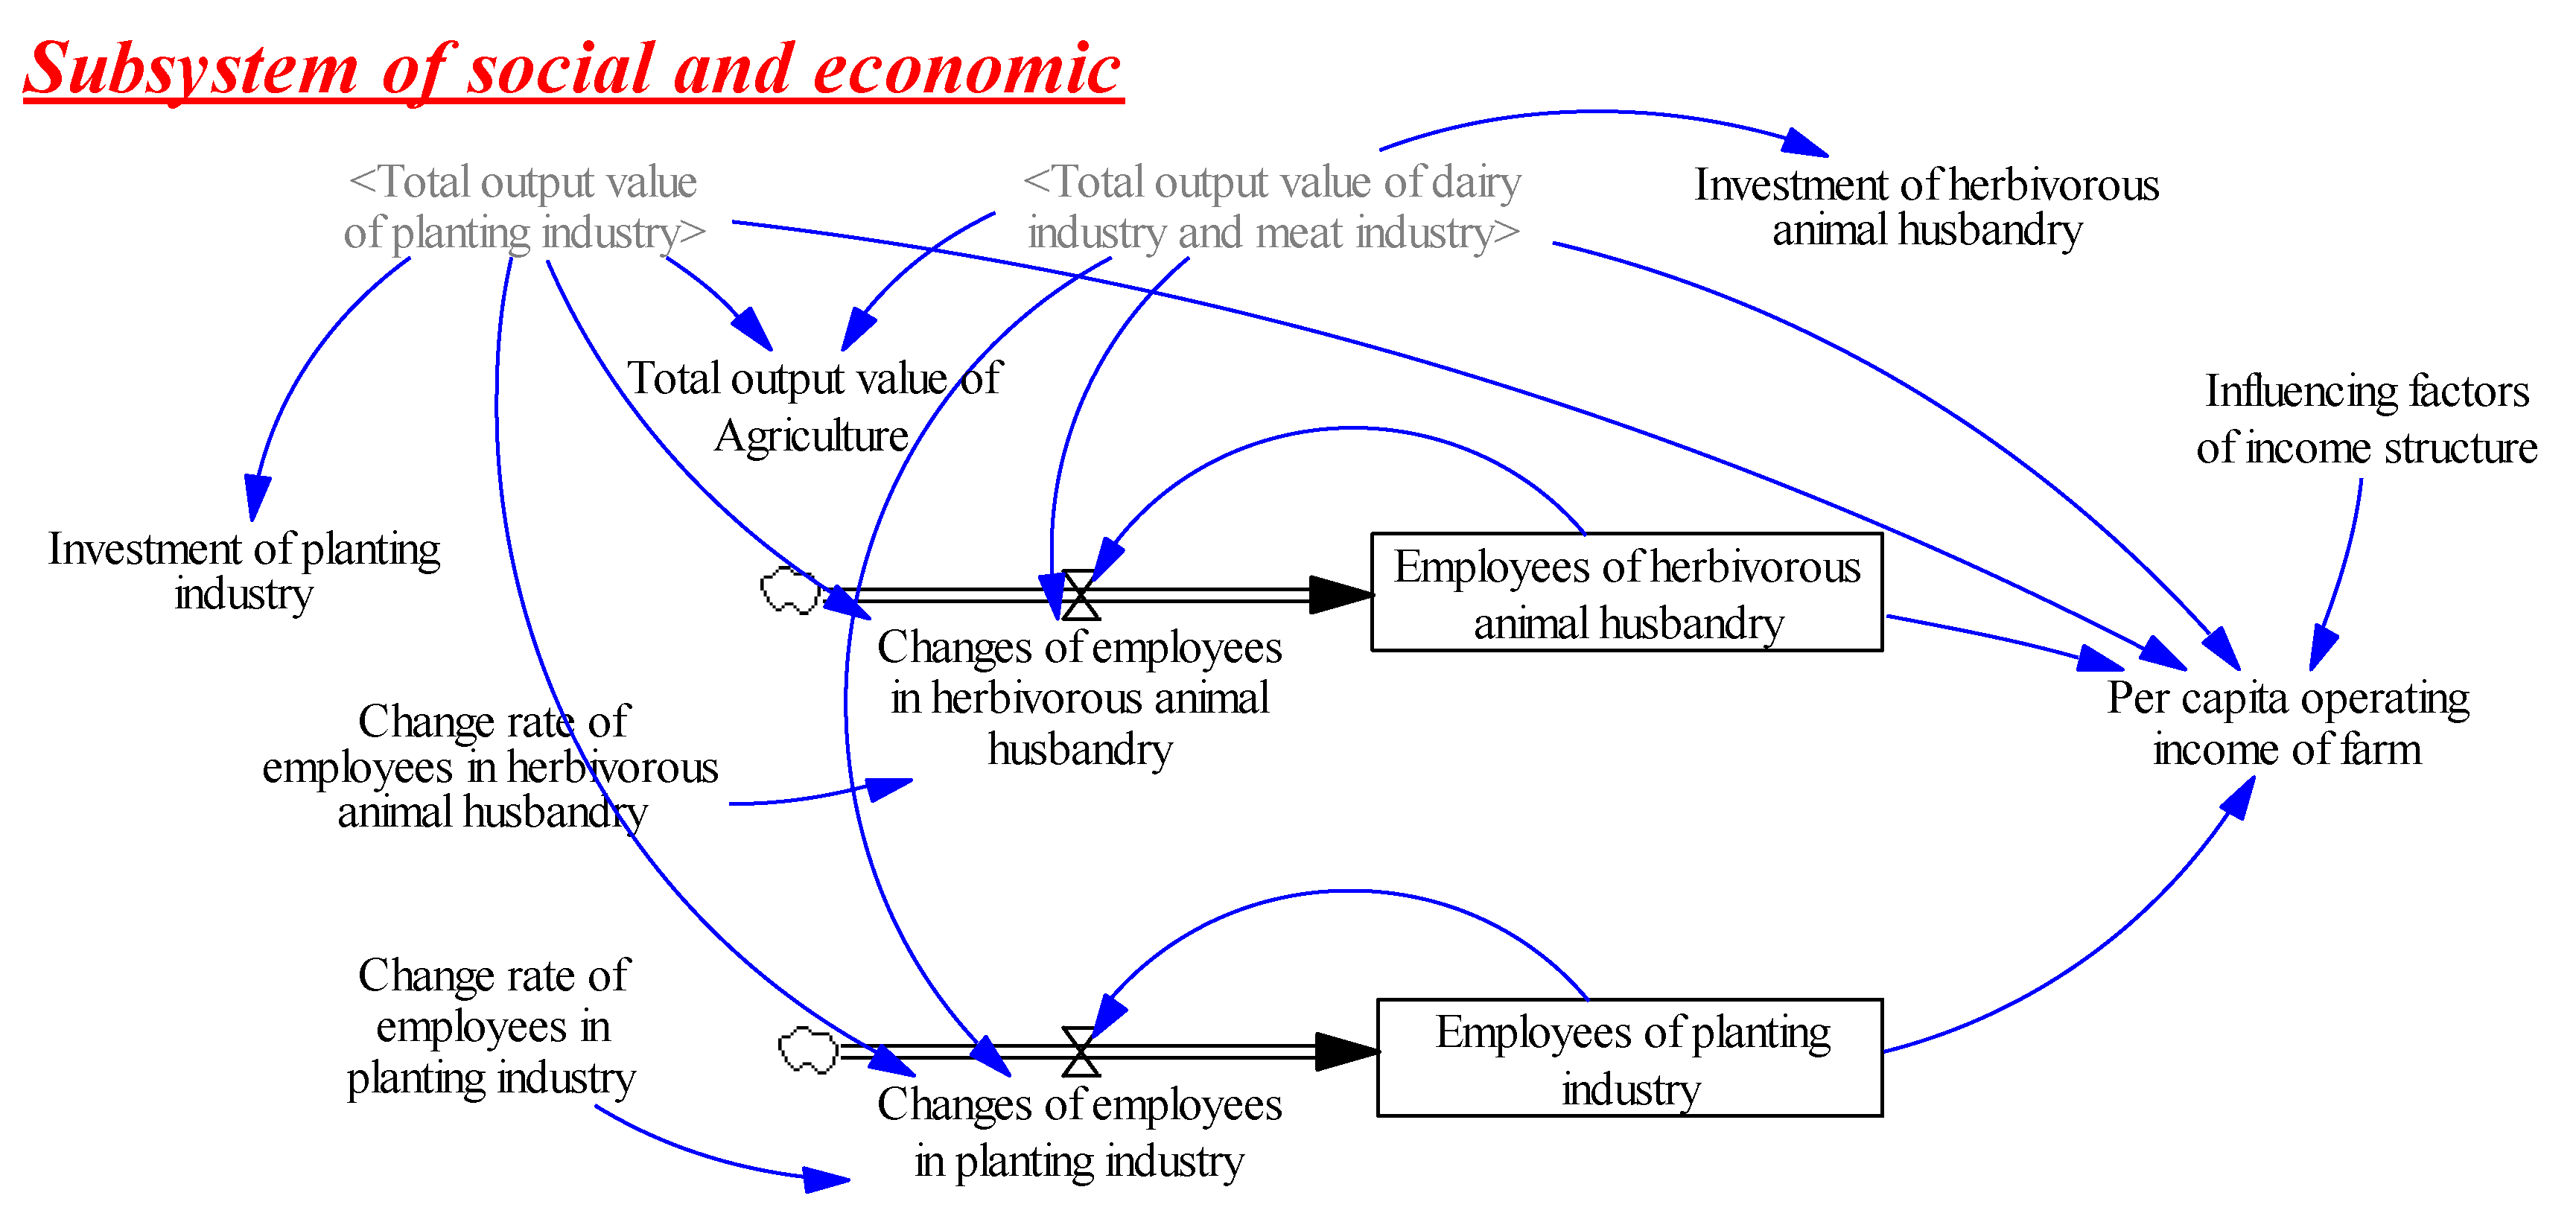
3.3.2. Subsystem Logical Relationship

The herbivorous animal husbandry development system in the agricultural area is mainly composed of the herbivorous animal breeding subsystem, the planting industry structure adjustment subsystem, the land carrying capacity subsystem, and the socio-economic subsystem. There are interrelationships between the various subsystems and the internal elements of the subsystems. The main relationship between the subsystems is shown in Figure 2.
The behavioral logic between the subsystems is to develop herbivorous animal husbandry through the herbivorous livestock breeding subsystem and to improve the “grain-crash-grass” ternary planting structure through the adjustment of the planting industry structure to cultivate grass in cultivated land, which not only guarantees the feeding of herbivorous animal husbandry. Grass demand has played a role in nutrient demand, thereby balancing the role of land carrying capacity; through the combination of agriculture and animal husbandry, supporting grass and livestock, and the combination of planting and breeding, the ecological cycle development model not only fully activates the potential of various production factors, but also improves the comprehensive benefits of production. It is also effective at ensuring the supply of grass and livestock products, the stable development of the agricultural economy, promoting farmers’ employment and increasing income, and improving the overall endogenous motivation and sustainability of development.

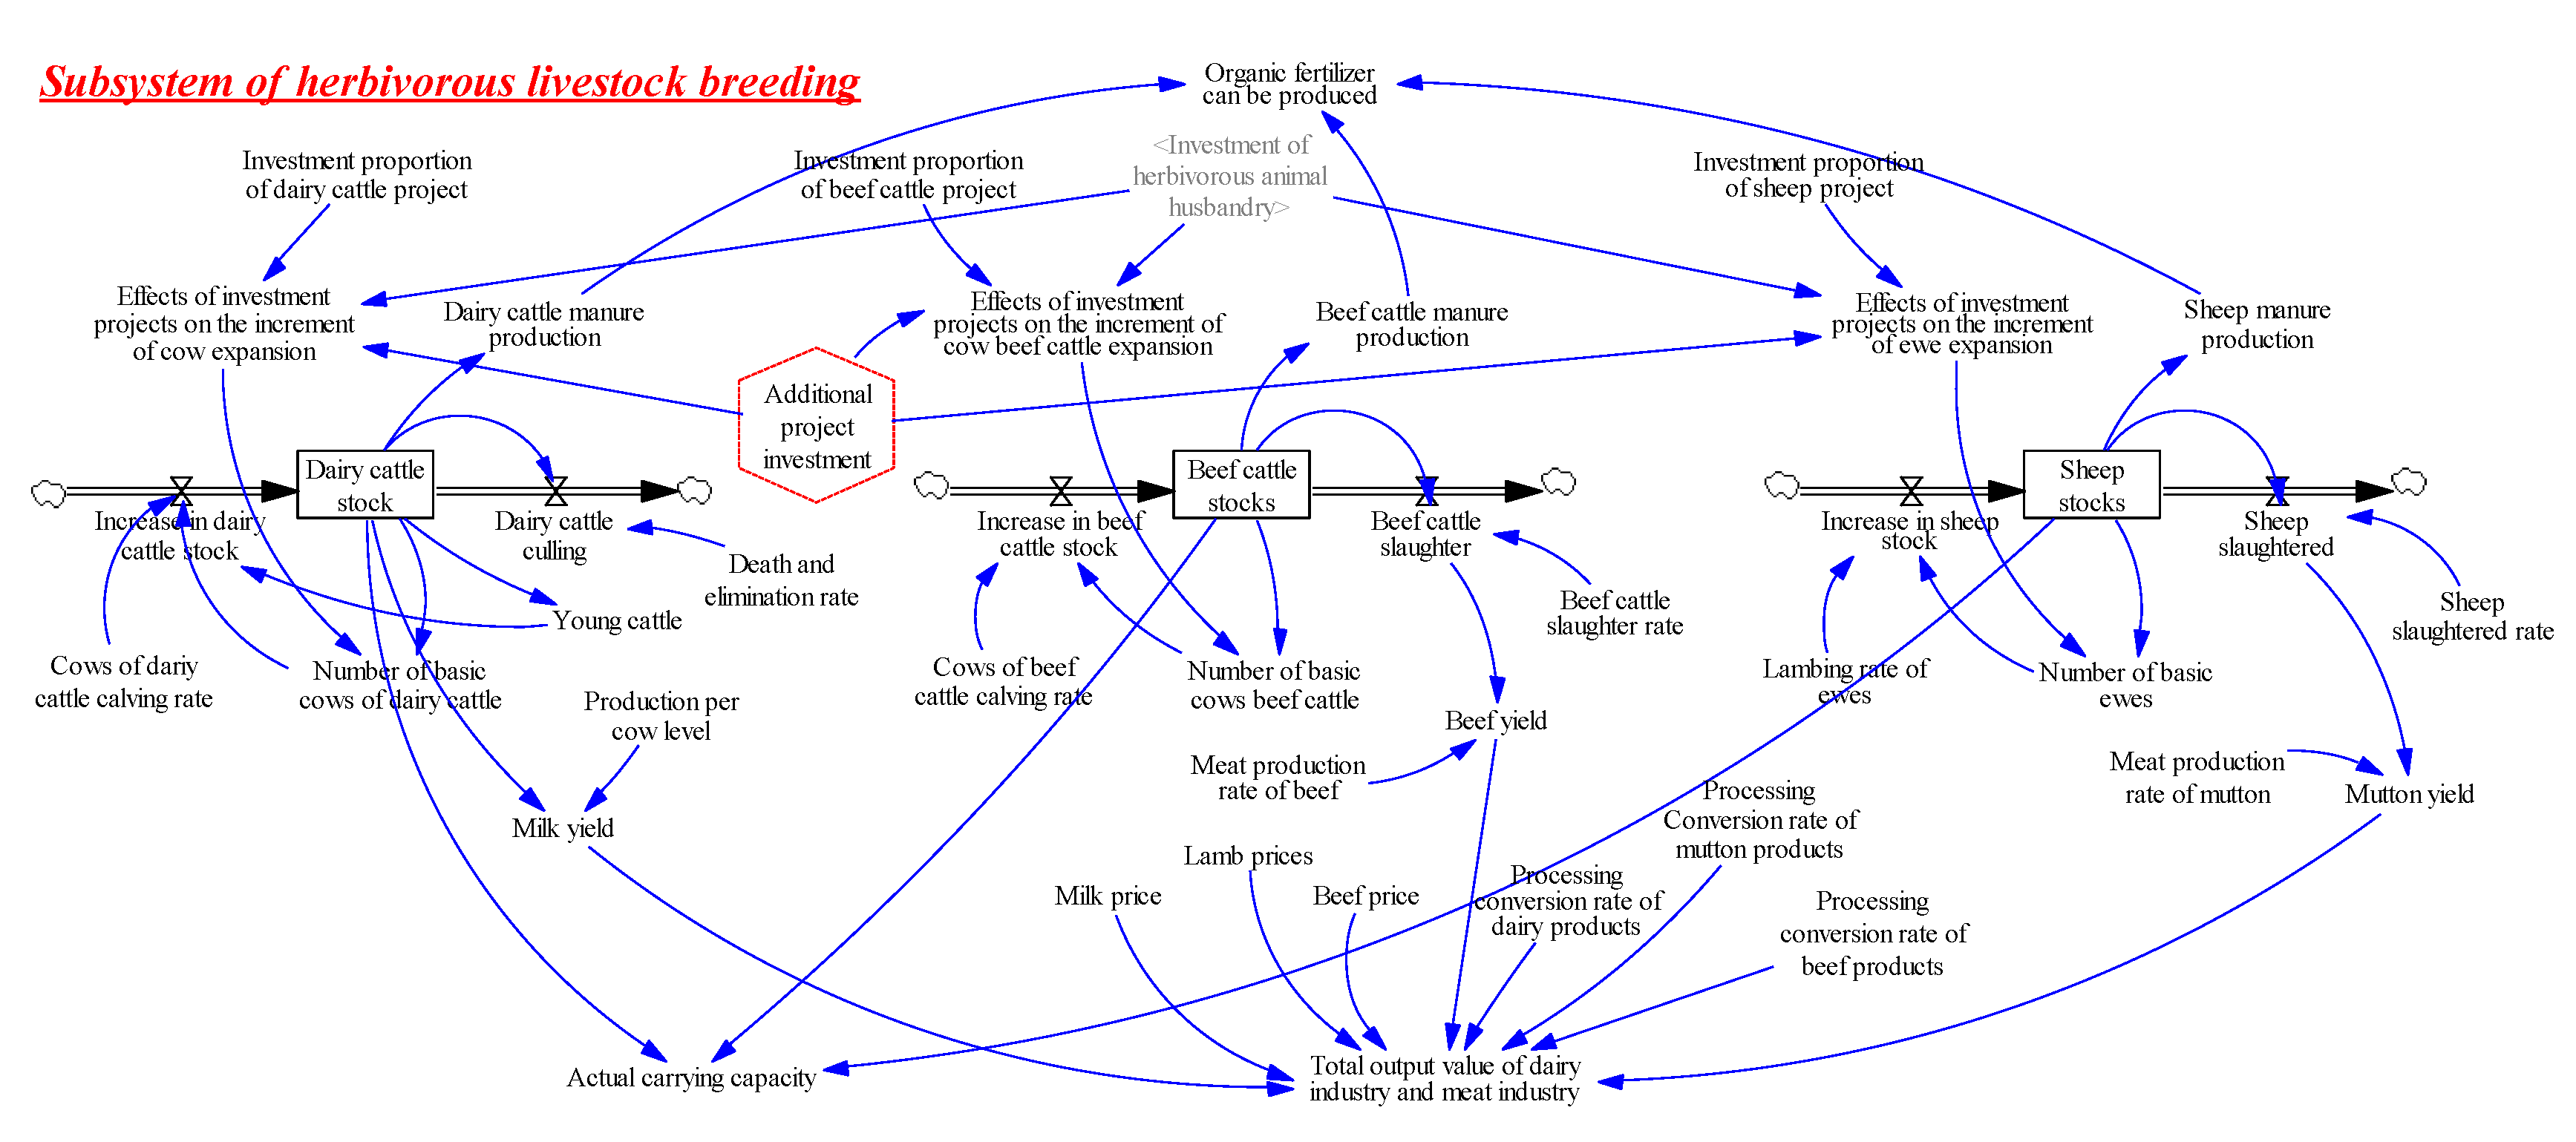
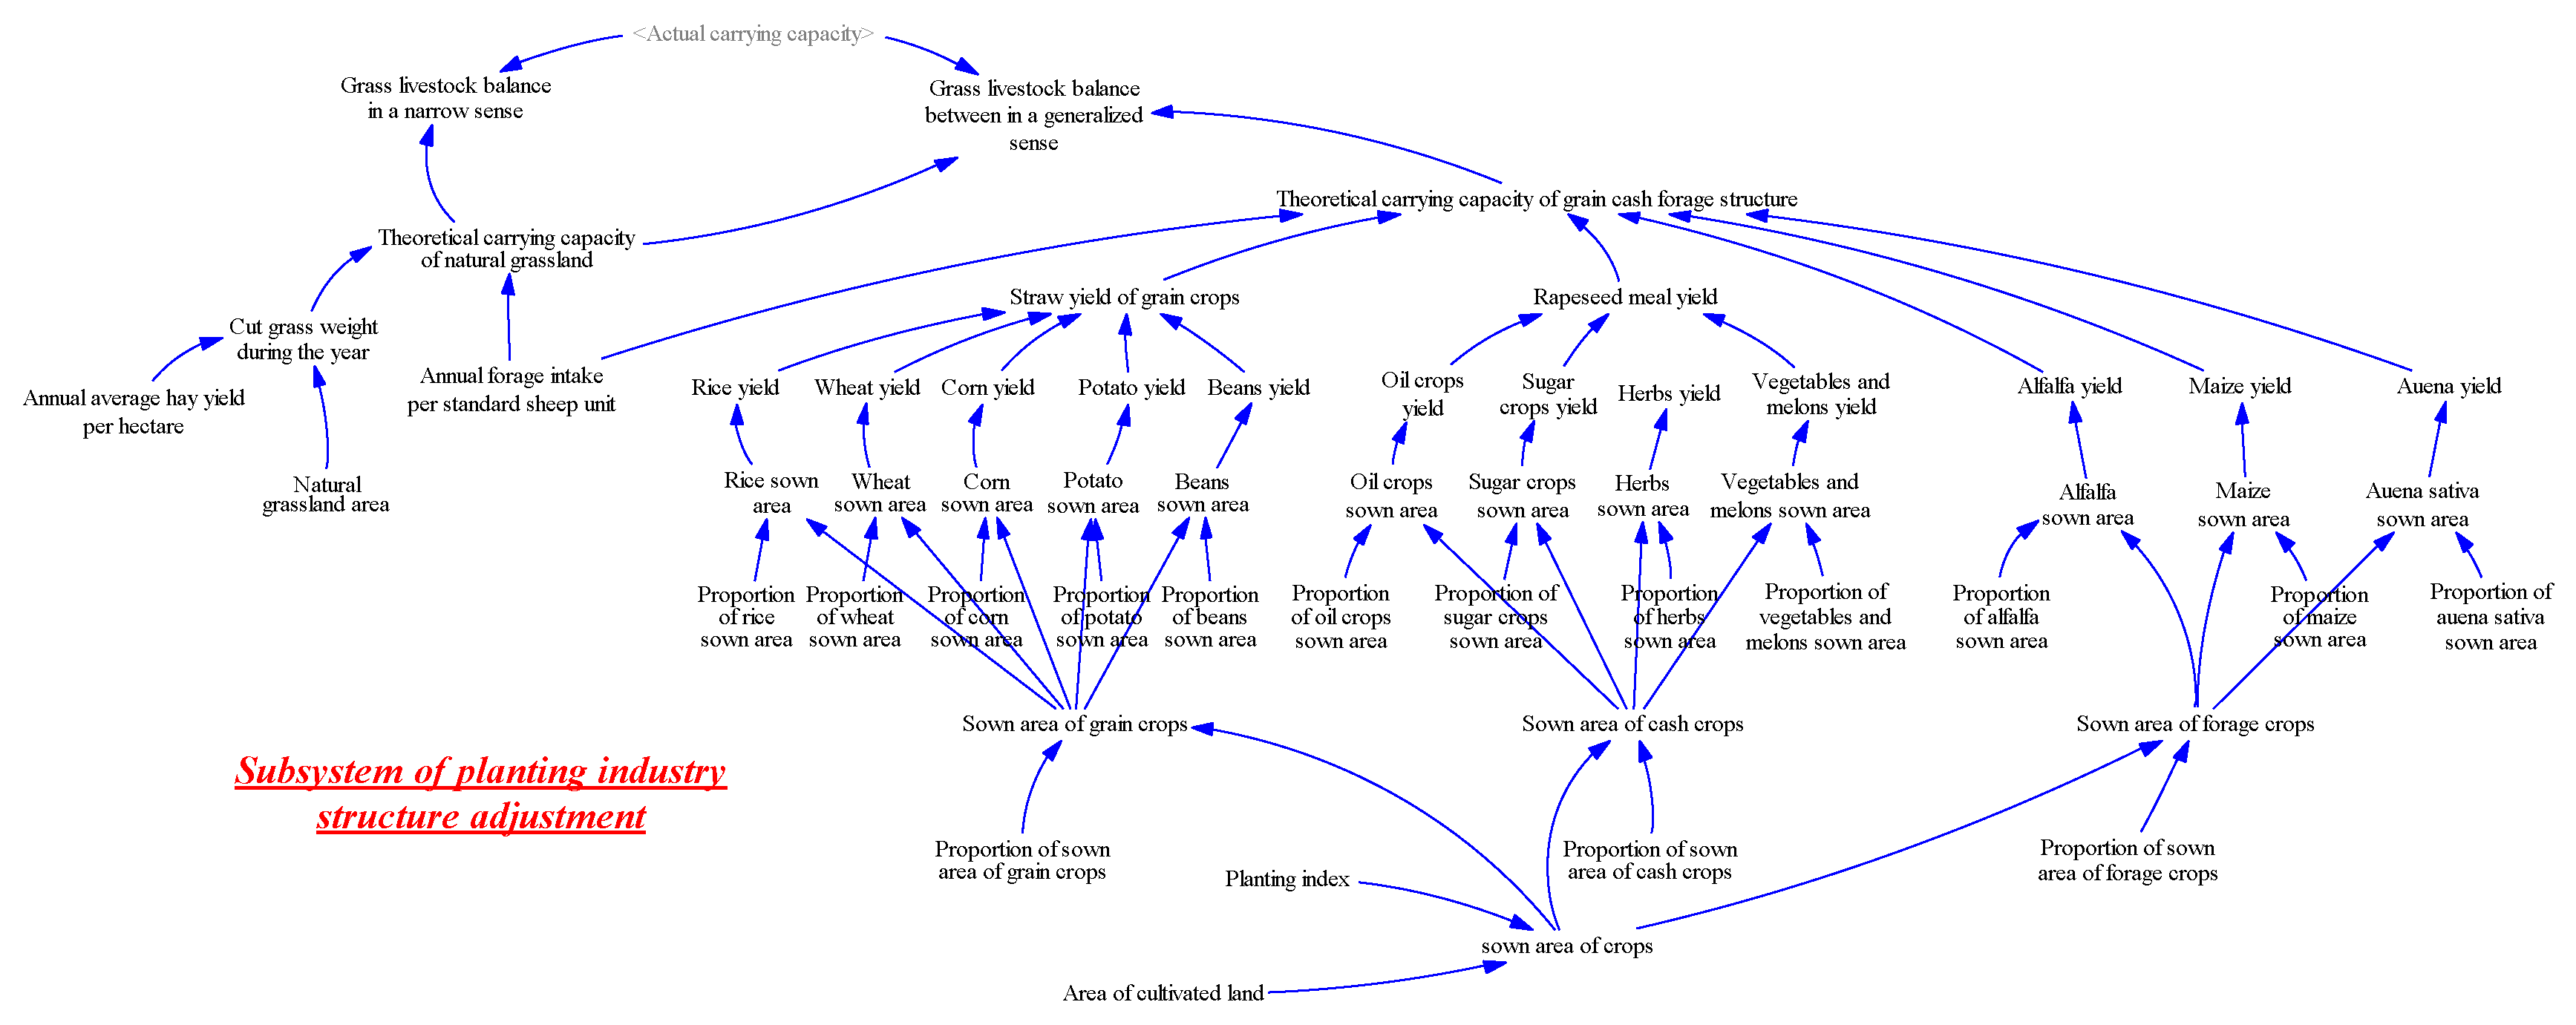
3.4. System Model Establishment

Based on the industrial development principle of "combination of planting-breeding and circular development" and the actual production characteristics of Najitun Farm, in order to further clarify the logical relationship between various elements of the system, as well as the feedback form and control law of the system, this study further distinguishes the nature of variables based on the system structural diagram and constructs a more in-depth system flow diagram by introducing level variables, rate variables, auxiliary variables, and other factors, so that it can comprehensively describe the overall picture of the system composition, behavior and element interaction mechanism. Based on the principles of representativeness, availability, and simplification, 131 variables were selected to establish the system dynamics model of energy conservation and emission reduction, including 5 level variables, 8 rate variables, 72 auxiliary variables, and 46 constants. According to the proposed model framework, the system flow diagram of the development of herbivorous animal husbandry in agricultural areas was made by VENSIM DSS 6.4e software, as shown in Figure 3, Figure 4, Figure 5 and Figure 6. Among them, Figure 3 is the herbivorous livestock breeding subsystem, which mainly describes the scale of herbivorous livestock breeding, herd structure, waste recycling, product output, and industrial output value. Figure 4 is the planting industry structure adjustment subsystem, which mainly describes the ‘grain-cash-grass’ ternary planting structure and grass support provided by grassland hay production for herbivorous animal husbandry. Figure 5 is the land carrying capacity subsystem, which mainly describes the total balance between phosphorus in herbivorous livestock manure which is not effectively collected and utilized as a nutrient supply and meeting the nutritional needs of crop growth. Figure 6 shows the socio-economic subsystem, which mainly describes the economic output, employment positions, and per capita income level brought by the development of herbivorous animal husbandry. The necessary feedback loop is formed through the connection of shadow variables between subsystems, which makes the subsystems of herbivorous livestock, planting, land carrying, and social economy form an organic whole. Based on the relationship between variables in the system model and the principle of action, the relationship between variables is expressed by a mathematical function. Limited to the length of the article, only important variables and parameter equations are listed. The initial values of key parameters are shown in Table 3 as follows:
(1)
Dairy cattle stock = INTEG (Increase in dairy cattle stock-dairy cattle culling, 444). Units: head.
(2)
Increase in dairy cattle stock = (Number of basic cows of dairy cattle + young cattle) × Cows of dairy cattle calving rate/2. Units: head.
(3)
Actual carrying capacity = (Dairy cattle stock + beef cattle stocks) × 8 + sheep stocks × 1. Units: sheep unit.
(4)
Organic fertilizer can be produced = Dairy cattle manure production/4 + sheep manure production/2 + beef cattle manure production/4. Units: ten kilotons.
(5)
Theoretical carrying capacity of grain cash grass structure = (Auena yield + alfalfa yield + rapeseed meal yield + maize yield + straw yield of grain crops) × 1000/Annual grass intake per standard sheep unit. Units: sheep unit.
(6)
Grass-livestock balance in a narrow sense = (Theoretical carrying capacity of natural grassland-actual carrying capacity)/Theoretical carrying capacity of natural grassland. Units: Dmnl.
(7)
Rapeseed meal yield = Oil crops yield × 0.6 + sugar crops yield × 0.05 + vegetables and melons yield × 1. Units: t.
(8)
Phosphorus consumption of grass crops = Auena yield × 10 × 0.8 + alfalfa yield × 10 × 0.2 + maize yield × 10 × 0.3. Units: kg.
(9)
Phosphorus emission of per unit farmland = ((Phosphorus emissions from unused faces of dairy cattle + phosphorus emissions from unused feces of beef cattle + phosphorus emissions from unused feces of sheep) × (1-Loss rate) × 1000)/(sown area of crops + natural grassland area). Units: kg/ha.
(10)
Employees of herbivorous animal husbandry = INTEG (Changes of employees in herbivorous animal husbandry, 560). Units: population.

4. Model Operation and Simulation

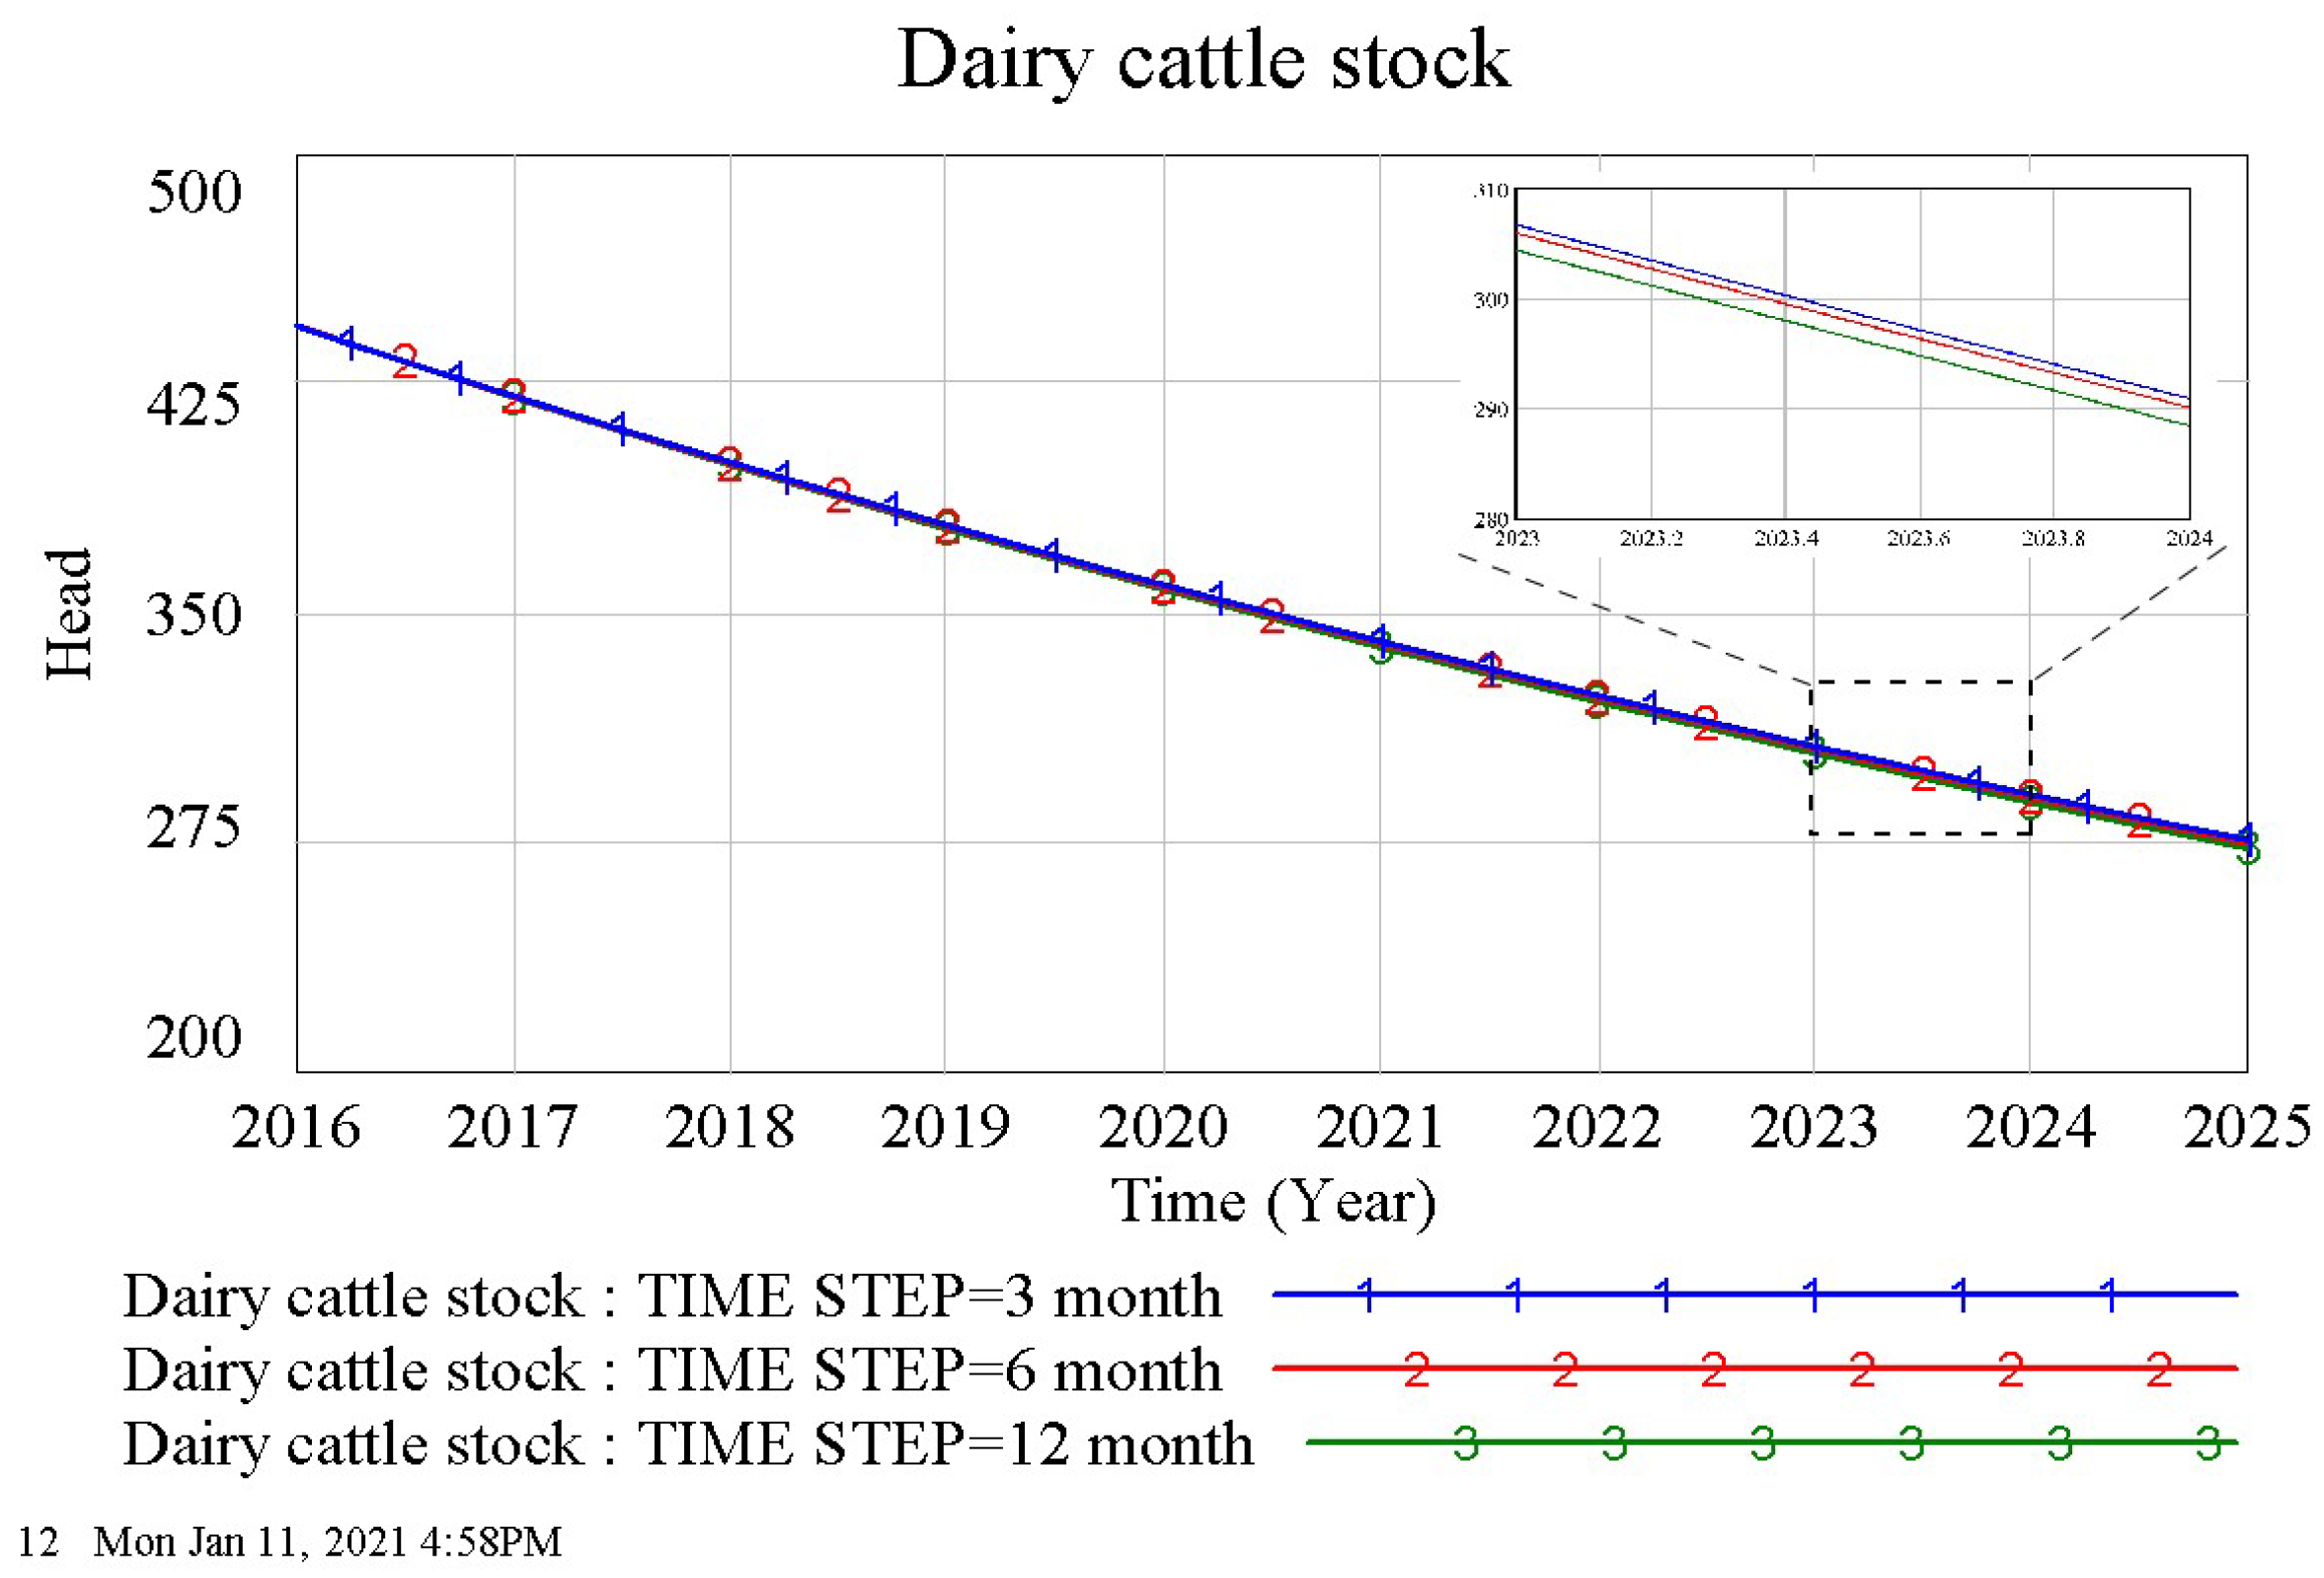
4.1. Operational Verification of System Dynamics Model

Visual inspection: mainly inspect whether the model looks similar to the actual system in appearance and whether the parameters are reliable. After inspection, the established model meets the requirements.
Run test: run the tools “Units Check” and “Check Model” in VENSIM DSS, and produce the “Units are A. O K.” and “Model is OK.”. Models passed the run test.
Historical test: substituting historical data from 2016 to 2019 into the model for simulation verification. This paper selects the dairy cow group inventory, the meat sheep group inventory, the fresh milk production, plantation industry practitioners, and herbivorous animal husbandry practitioners as the test variables from the system. The simulated value calculated by the model is compared with the historical data, and the historical test of the model is performed. The simulated TIME STEP is 1 year, the INITIAL TIME is set to 2016, and the FINAL TIME is set to 2019. The results are shown in Table 4.
According to the test results of Turner B L et al. (−5.56~16.67%) [32], Wu Y et al. (−0.01%~13.67%) [33], and Azad S M et al. (−7.63%~20.98%) [34], the average error fluctuates between −10% and 15% is acceptable [35]. As shown in Table 3, the relative error (absolute value of the error) between the historical value and the simulated value of this system model is between 0.00% and 9.91%, and the average relative error is 5.04%, of which there were 8 relative errors < 5%, 12 between 5% < relative error ≤ 10%, and 0 relative errors > 10%, and the system simulation results are consistent with the actual situation. On the whole, the fitting accuracy of the model is relatively high, and it can reflect the actual operation of the system.
Robustness test: the stability test is a necessary condition for the model to be true and reliable. Effective system model behavior should not be sensitive to changes in most parameters, mainly because the behavior pattern of the system is determined by the dominant feedback loop within the model, and the changes in parameters on the non-dominant loop will not have much impact on the system behavior. In this study, the integral error test method was used, and the dairy cattle stock was selected as the test variable. The time steps were set as 3 months (TIME STEP = 0.25), 6 months (TIME STEP = 0.5), and 12 months (TIME STEP = 1), respectively, to observe the variation trend of parameters under different time steps. It can be seen from Figure 7 that changing the simulation step size of the model, the change trend of the dairy cattle group stock almost coincides, and there is no obvious change due to the change of the parameter value; that is, the change of the parameter value does not cause the fundamental change of the model behavior, indicating that the model has certain stability.
The historical test and stability test results show that the herbivorous animal husbandry model in the agricultural area established by this research can be used to simulate the real system.

4.2. Analysis of Simulation Results

4.2.1. Scenario Setting

In order to further realize the strategic planning of Najitun Farm’s beef cattle and mutton breeding base and eastern of Greater Khingan Range milk source base, based on the simulation of the herbivorous animal husbandry development system model in the agricultural area, the initial values, parameters, equations, etc. of the model are reset. Then, simulation of the dynamic changes of key variables, such as dairy cattle, meat cattle, mutton sheep, grass-livestock balance index, planting-breeding balance index, and per capita income of farmers and herders under different scenarios. To this end, this study sets up two deployment strategies compared with the inertial development of the system, namely, strengthening and optimizing the herbivorous animal husbandry strategy and optimizing the grain-cash-grass planting industry structure strategy, and simulates the inertial development trend and two deployment strategies, respectively. The corresponding scenario settings are shown in Table 5. Scenario 1 represents the inertia development trend of the initial parameters of the model, scenario 2 represents the strategy of expanding the scale of herbivorous animal husbandry, and scenario 3 represents the strategy of optimizing the structure of the planting industry after the expansion of herbivorous animal husbandry.

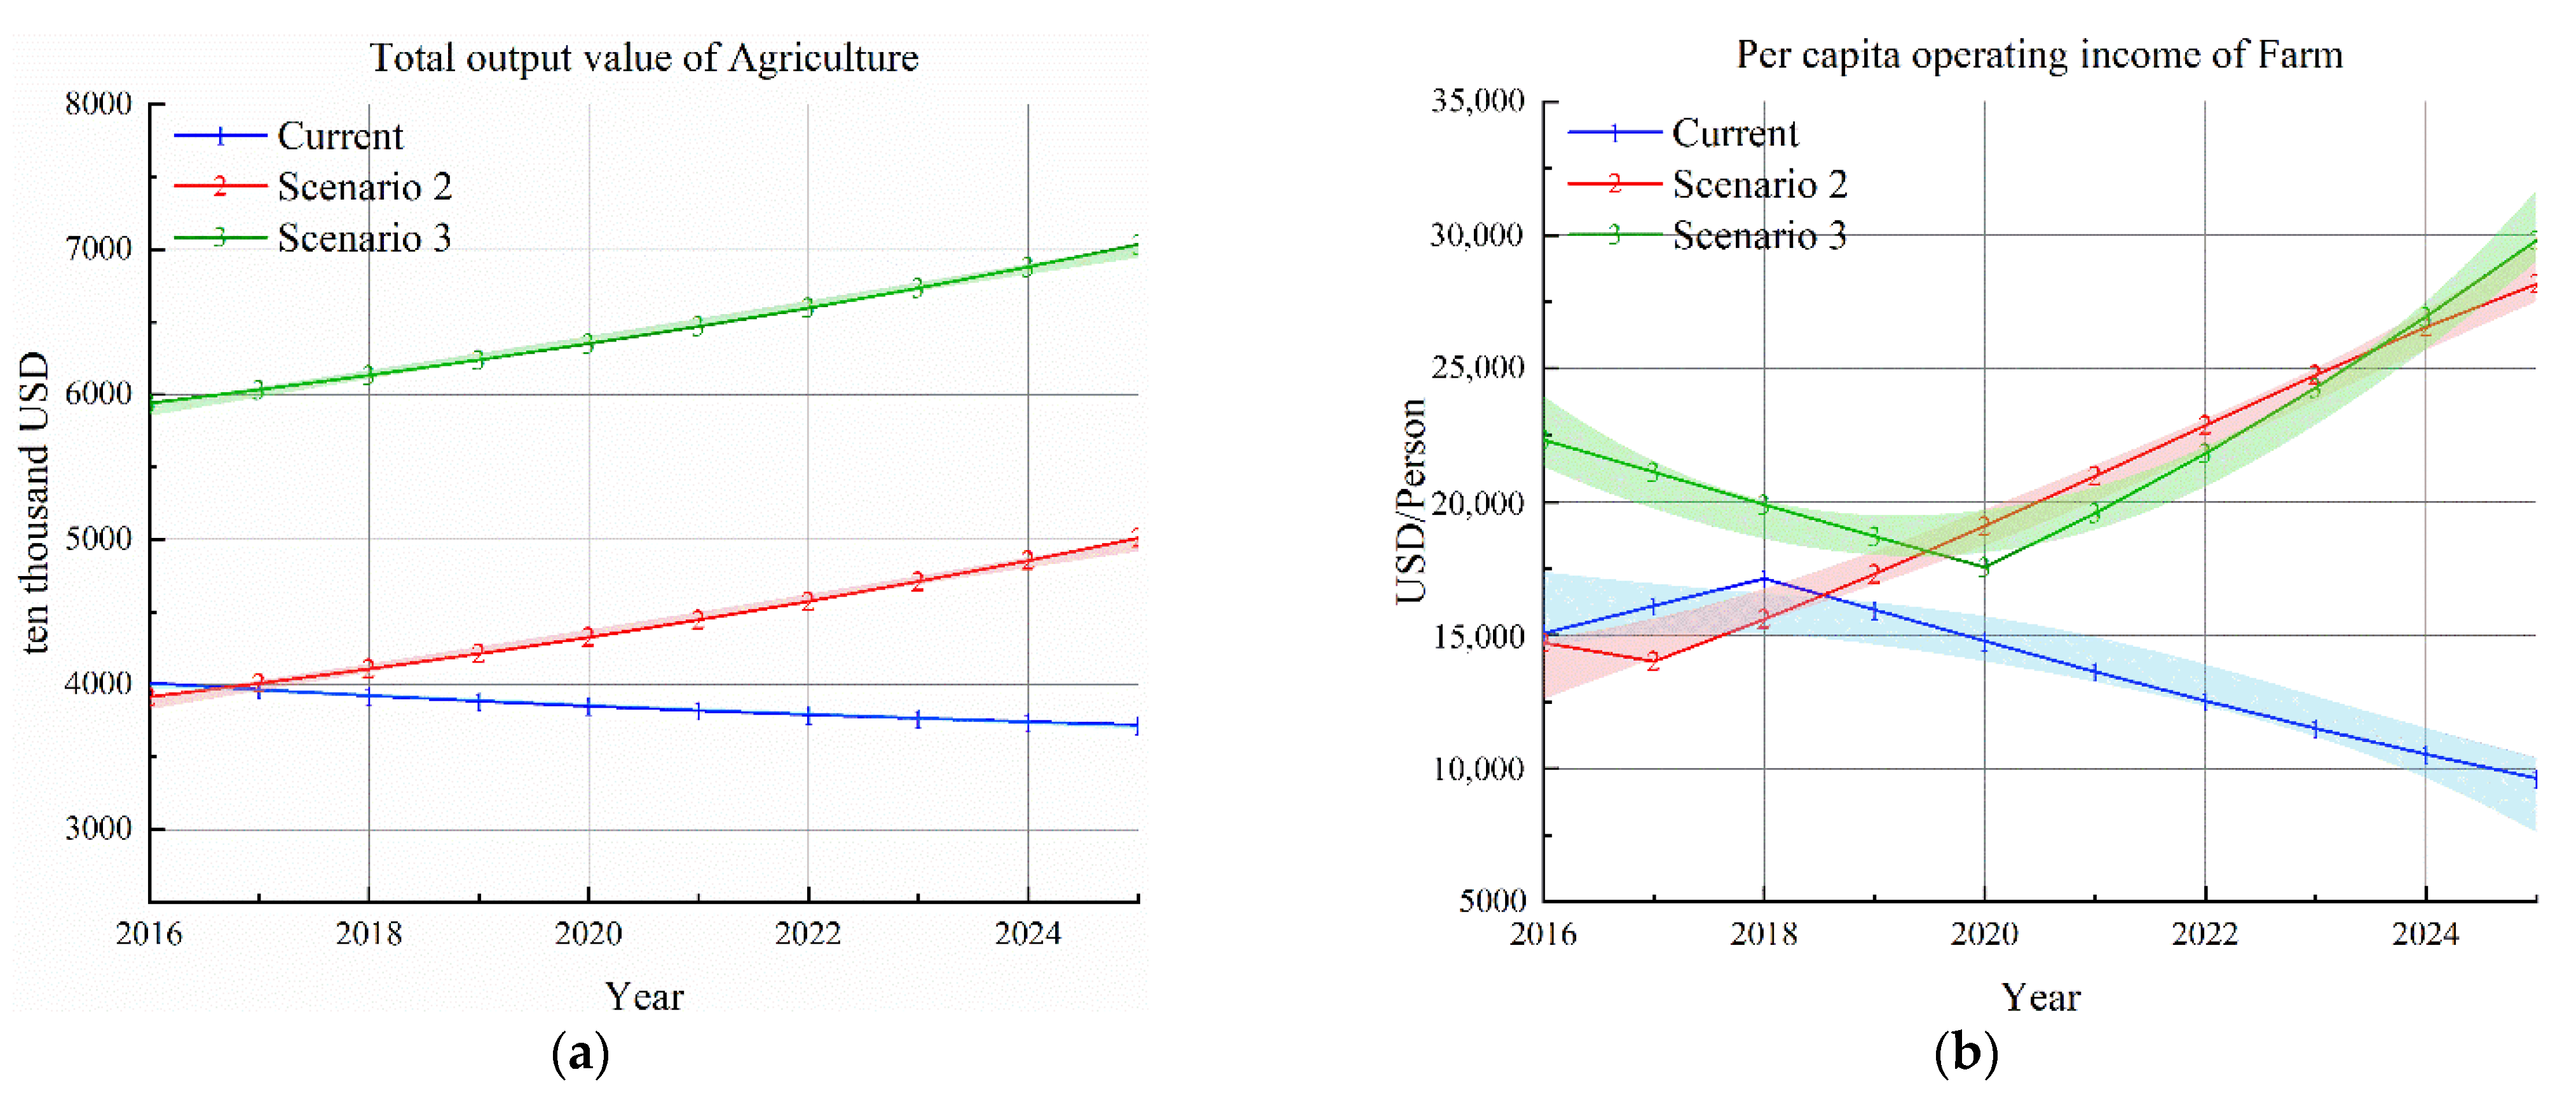
4.2.2. Simulation Result Output

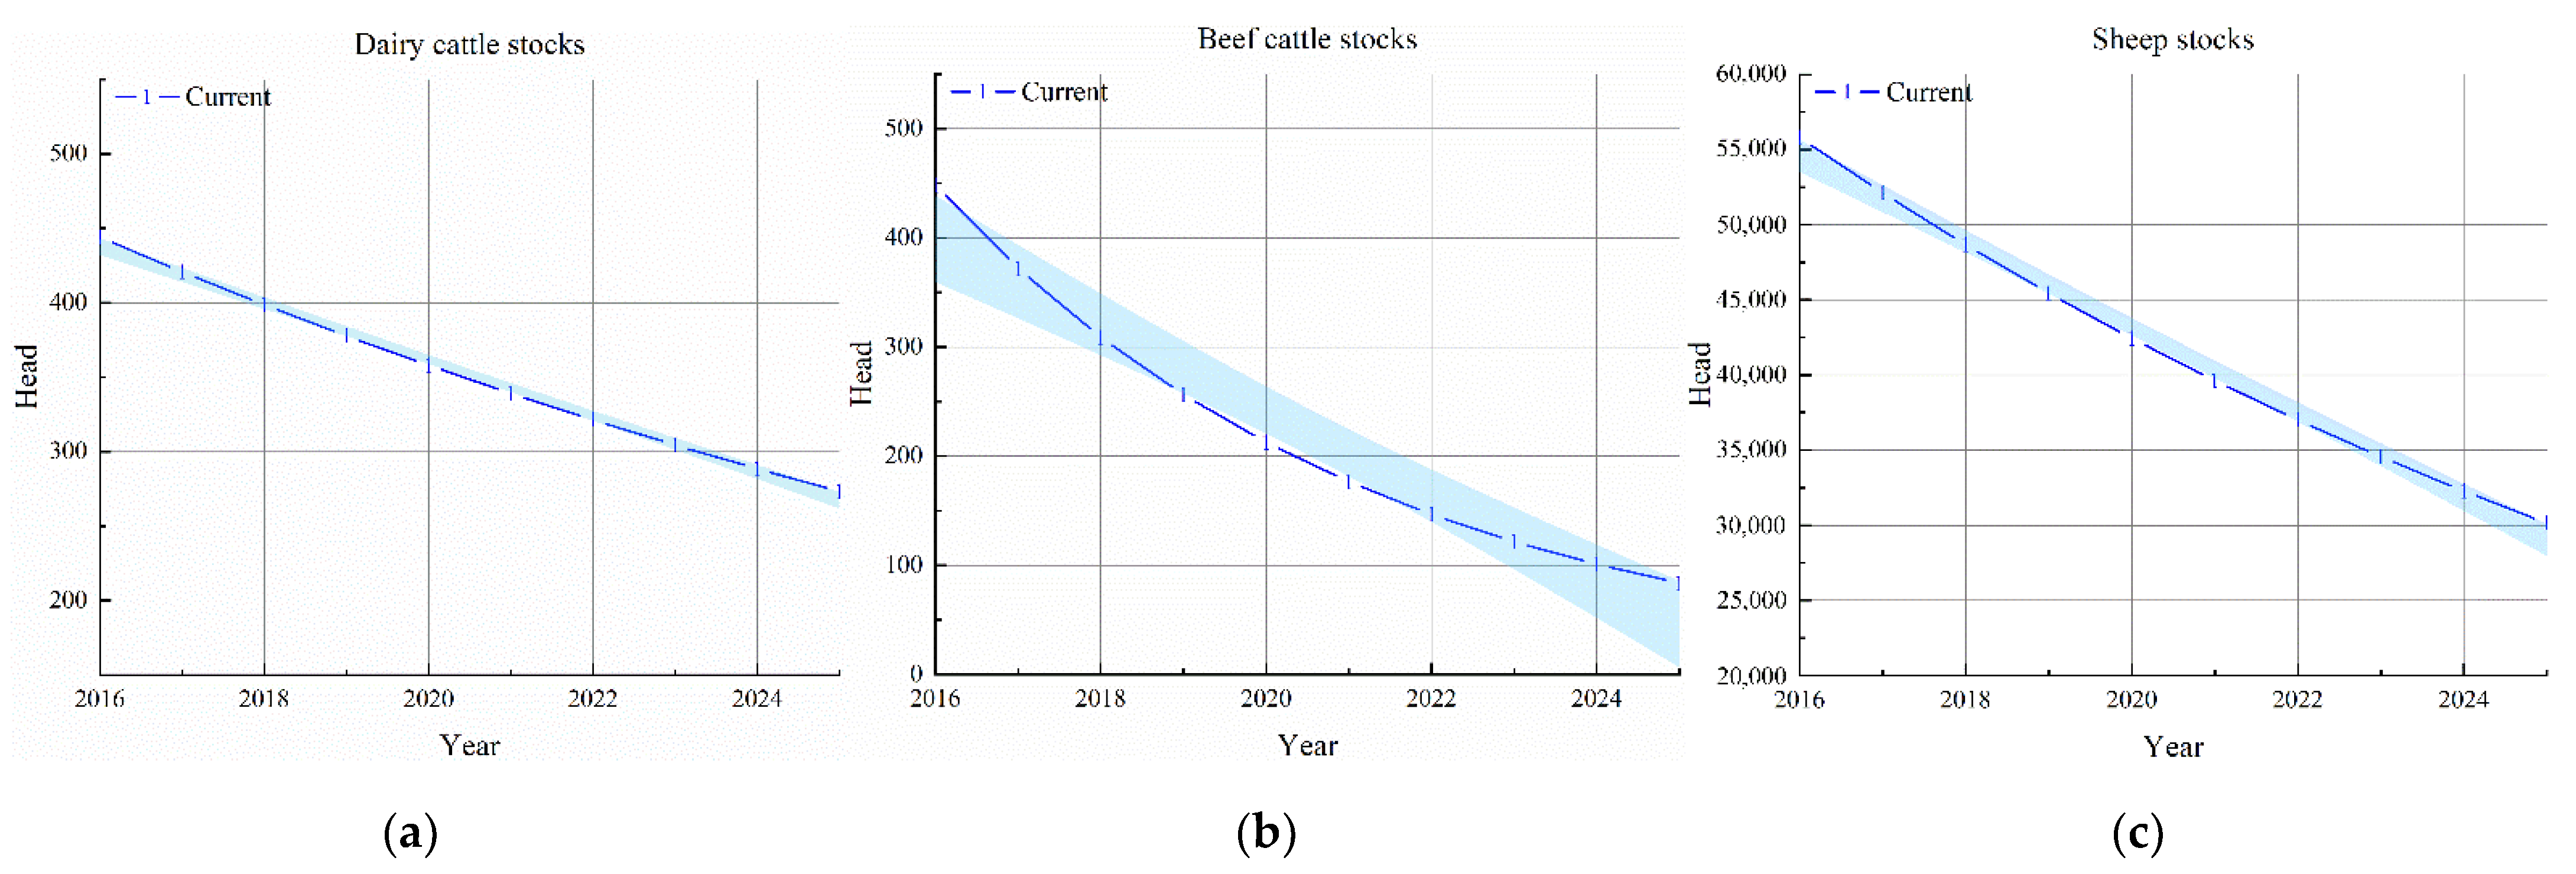
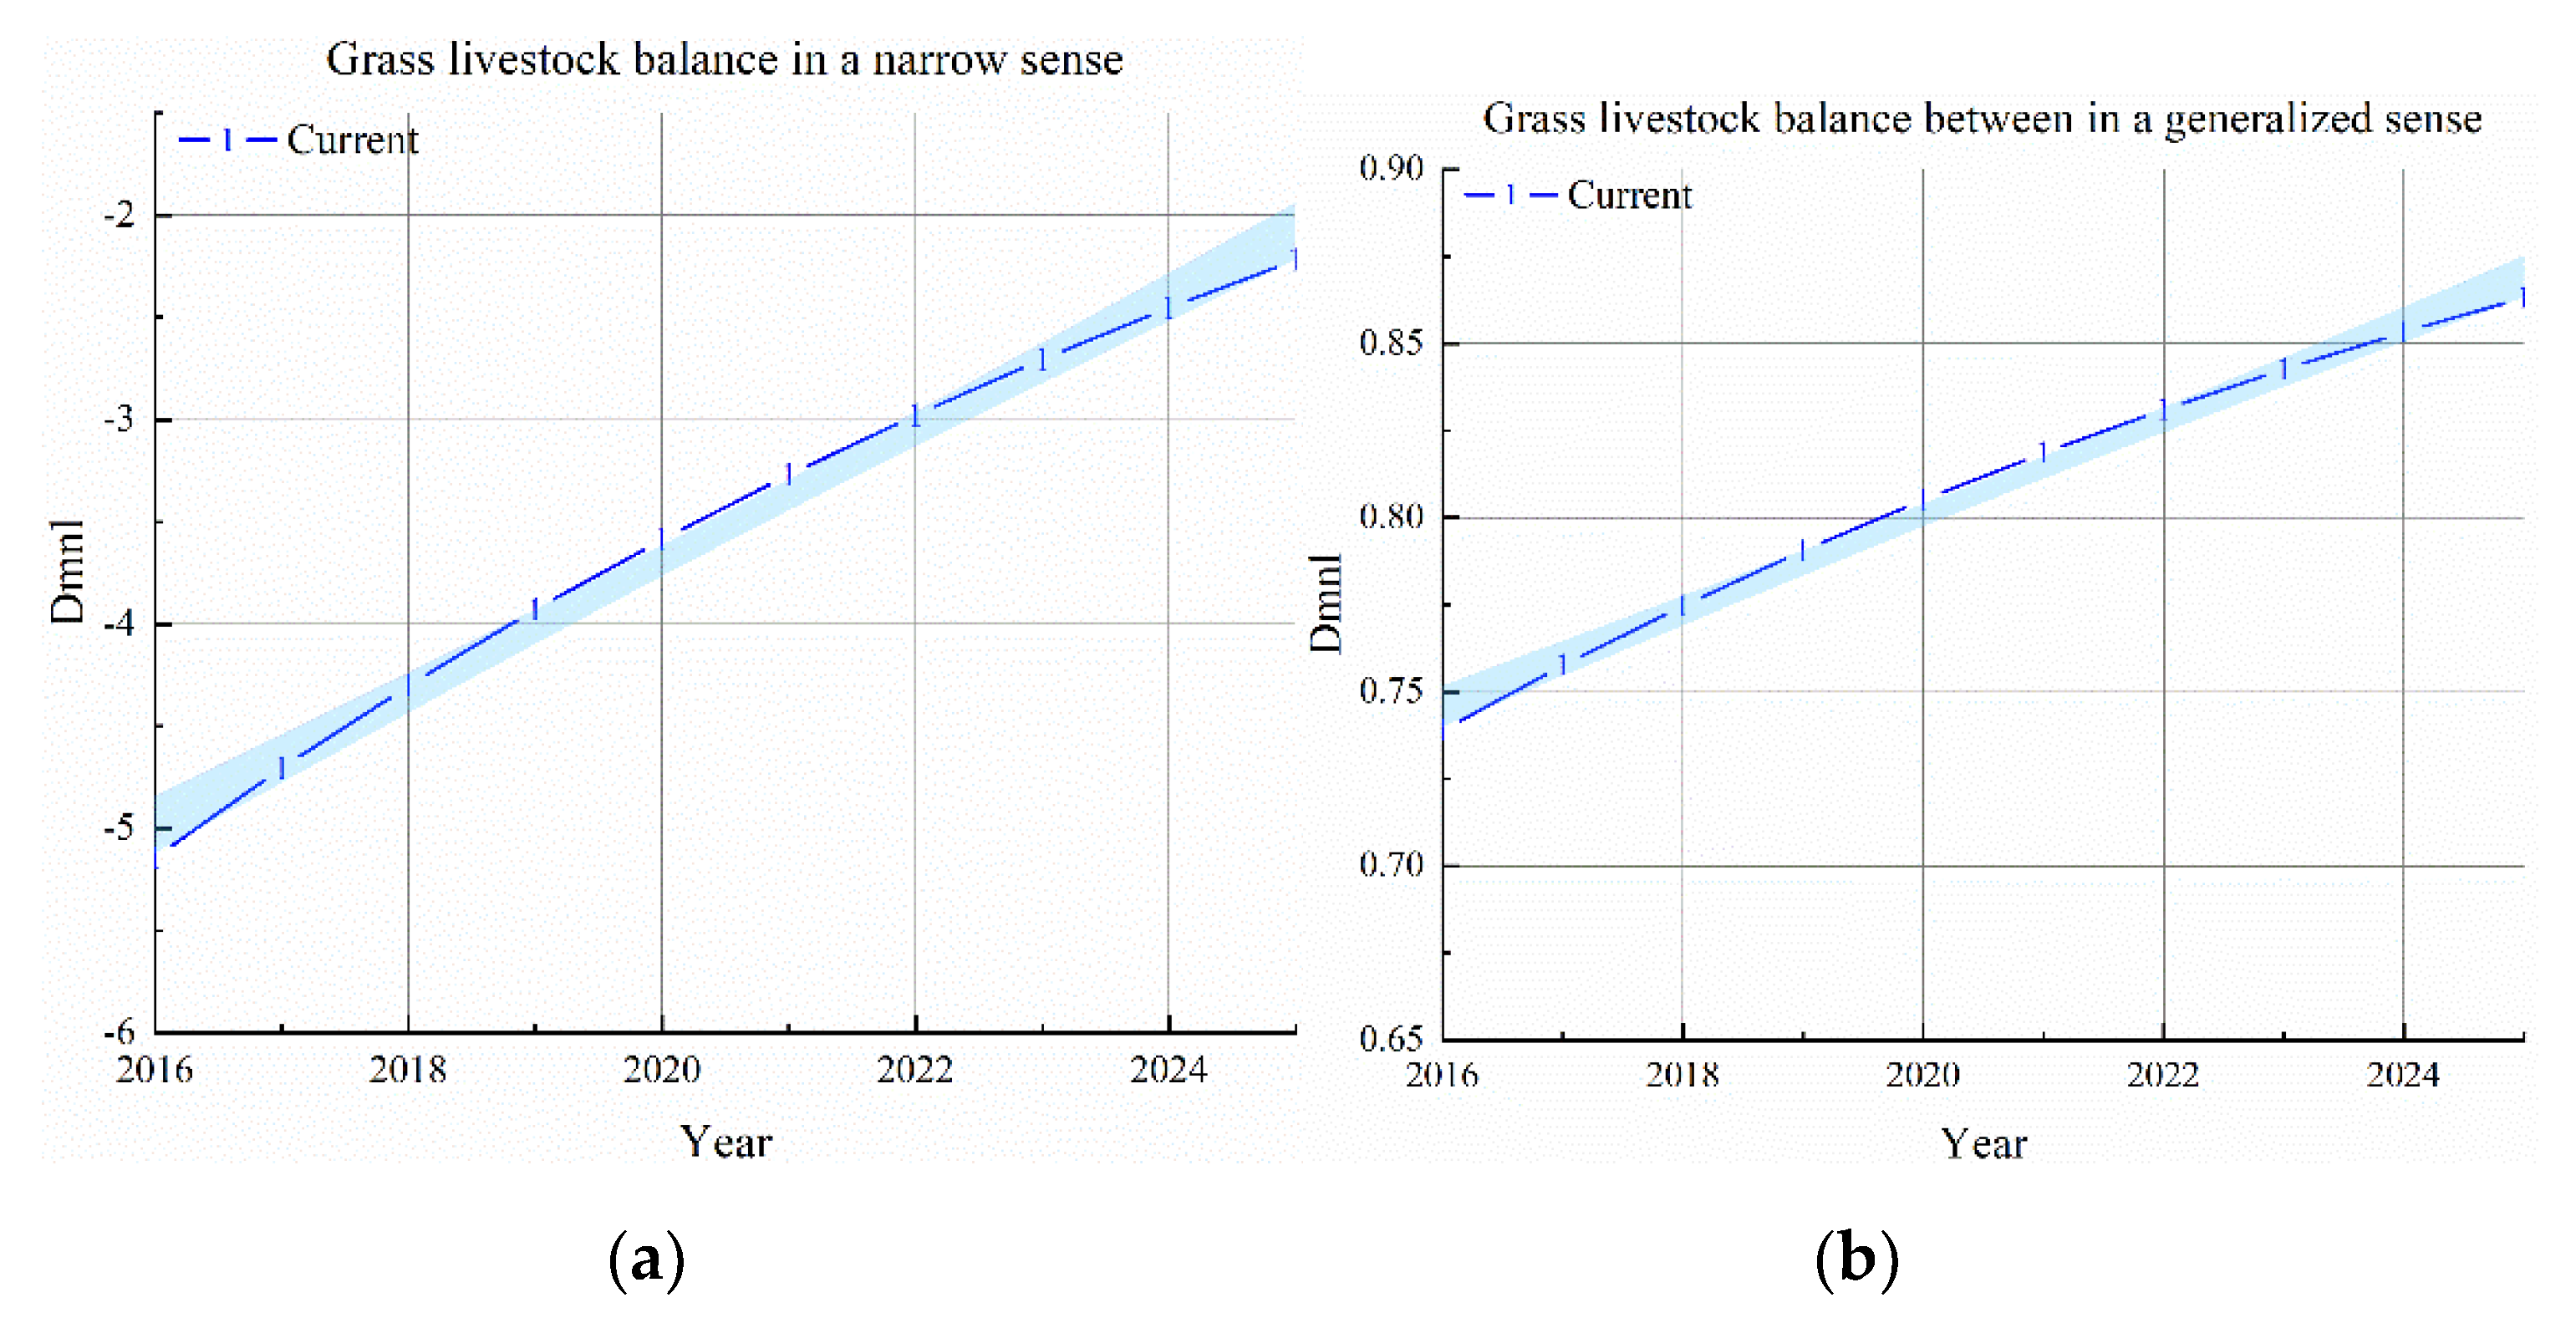
  • Scenario 1: Simulation results under system inertia
First, the development scale of herbivorous animal husbandry. Keeping the existing development strategy and the strength of the role unchanged, the simulation results of the development of the herbivorous animal husbandry of Najitun Farm under the basic scenario are obtained. The results show that the inventory of dairy cattle, beef cattle, and mutton sheep in this mode all show a downward trend (as shown in Figure 8), and the simulation results are consistent with the measured values in Table 3. Specifically, from 2016 to 2025, the stock number of dairy cattle, beef cattle, and mutton sheep dropped from 444 head, 448 head, and 5.58 thousand head to 273 head, 84 head, and 3.01 thousand head, respectively, representing a decrease of 38.45%, 81.31%, and 46.01%, respectively. According to this trend, it is difficult to achieve the development goals of increasing cattle and sheep and expanding production.
Second, in terms of grass-livestock balance. As shown in Figure 9, under system inertia, due to the overall decline in the population of herbivorous livestock but the supply of grass remains unchanged, the overall grass-livestock balance index is on the rise. However, the grass-livestock balance in a narrow sense is long-term negative, which means that the development of herbivorous animal husbandry cannot be supported by the grass provided by natural grassland alone; at the same time, the grass-livestock balance in a generalized sense is always positive and the value is getting larger, indicating due to the participation of crop by-products, adequate sources of grass for herbivorous livestock has the potential to continue to support the expansion of the herbivorous animal husbandry. Specifically, by 2025, the actual livestock carrying capacity under system inertia was about 3.30 thousand standard sheep units, and the theoretical livestock carrying capacity of the grass-livestock balance in a generalized sense was about 230.90 million standard sheep units, which could support at least seven times the breeding potential.
Third, in terms of planting and breeding balance. As shown in Figure 10, due to the decline in livestock stocks, the average phosphorus supply per unit area of land is less than the demand when the planting industry structure is fixed, and the phosphorus balance bearing is always less than 0.3, which is in a loadable state, and the carrying capacity is getting smaller and smaller, and it can be reduced to 0.13 by 2025. From the perspective of circular development, there is still huge potential for the development of herbivorous animal husbandry.
Fourth, in terms of society and economy. As shown in Figure 11, affected by the annual reduction in the scale of development of herbivorous animal husbandry, the total agricultural output value is declining year by year and is expected to drop to USD 3720.34 ten thousand (based on 2022 exchange rates) by 2025, a decrease of about 7.22% from 2016. From an income perspective, due to material delays, stable growth can still be achieved in the first two years. However, due to the scale of herbivorous animal husbandry in the later period, it is difficult to play a role in stimulating economic growth. Per capita income will show a downward trend year after year. By 2025, the per capita income was reduced to USD 9635.70 (based on 2022 exchange rates) per year, a decrease of 36.08% from 2016 and a decrease of 43.75% from the highest value in 2018.
2.
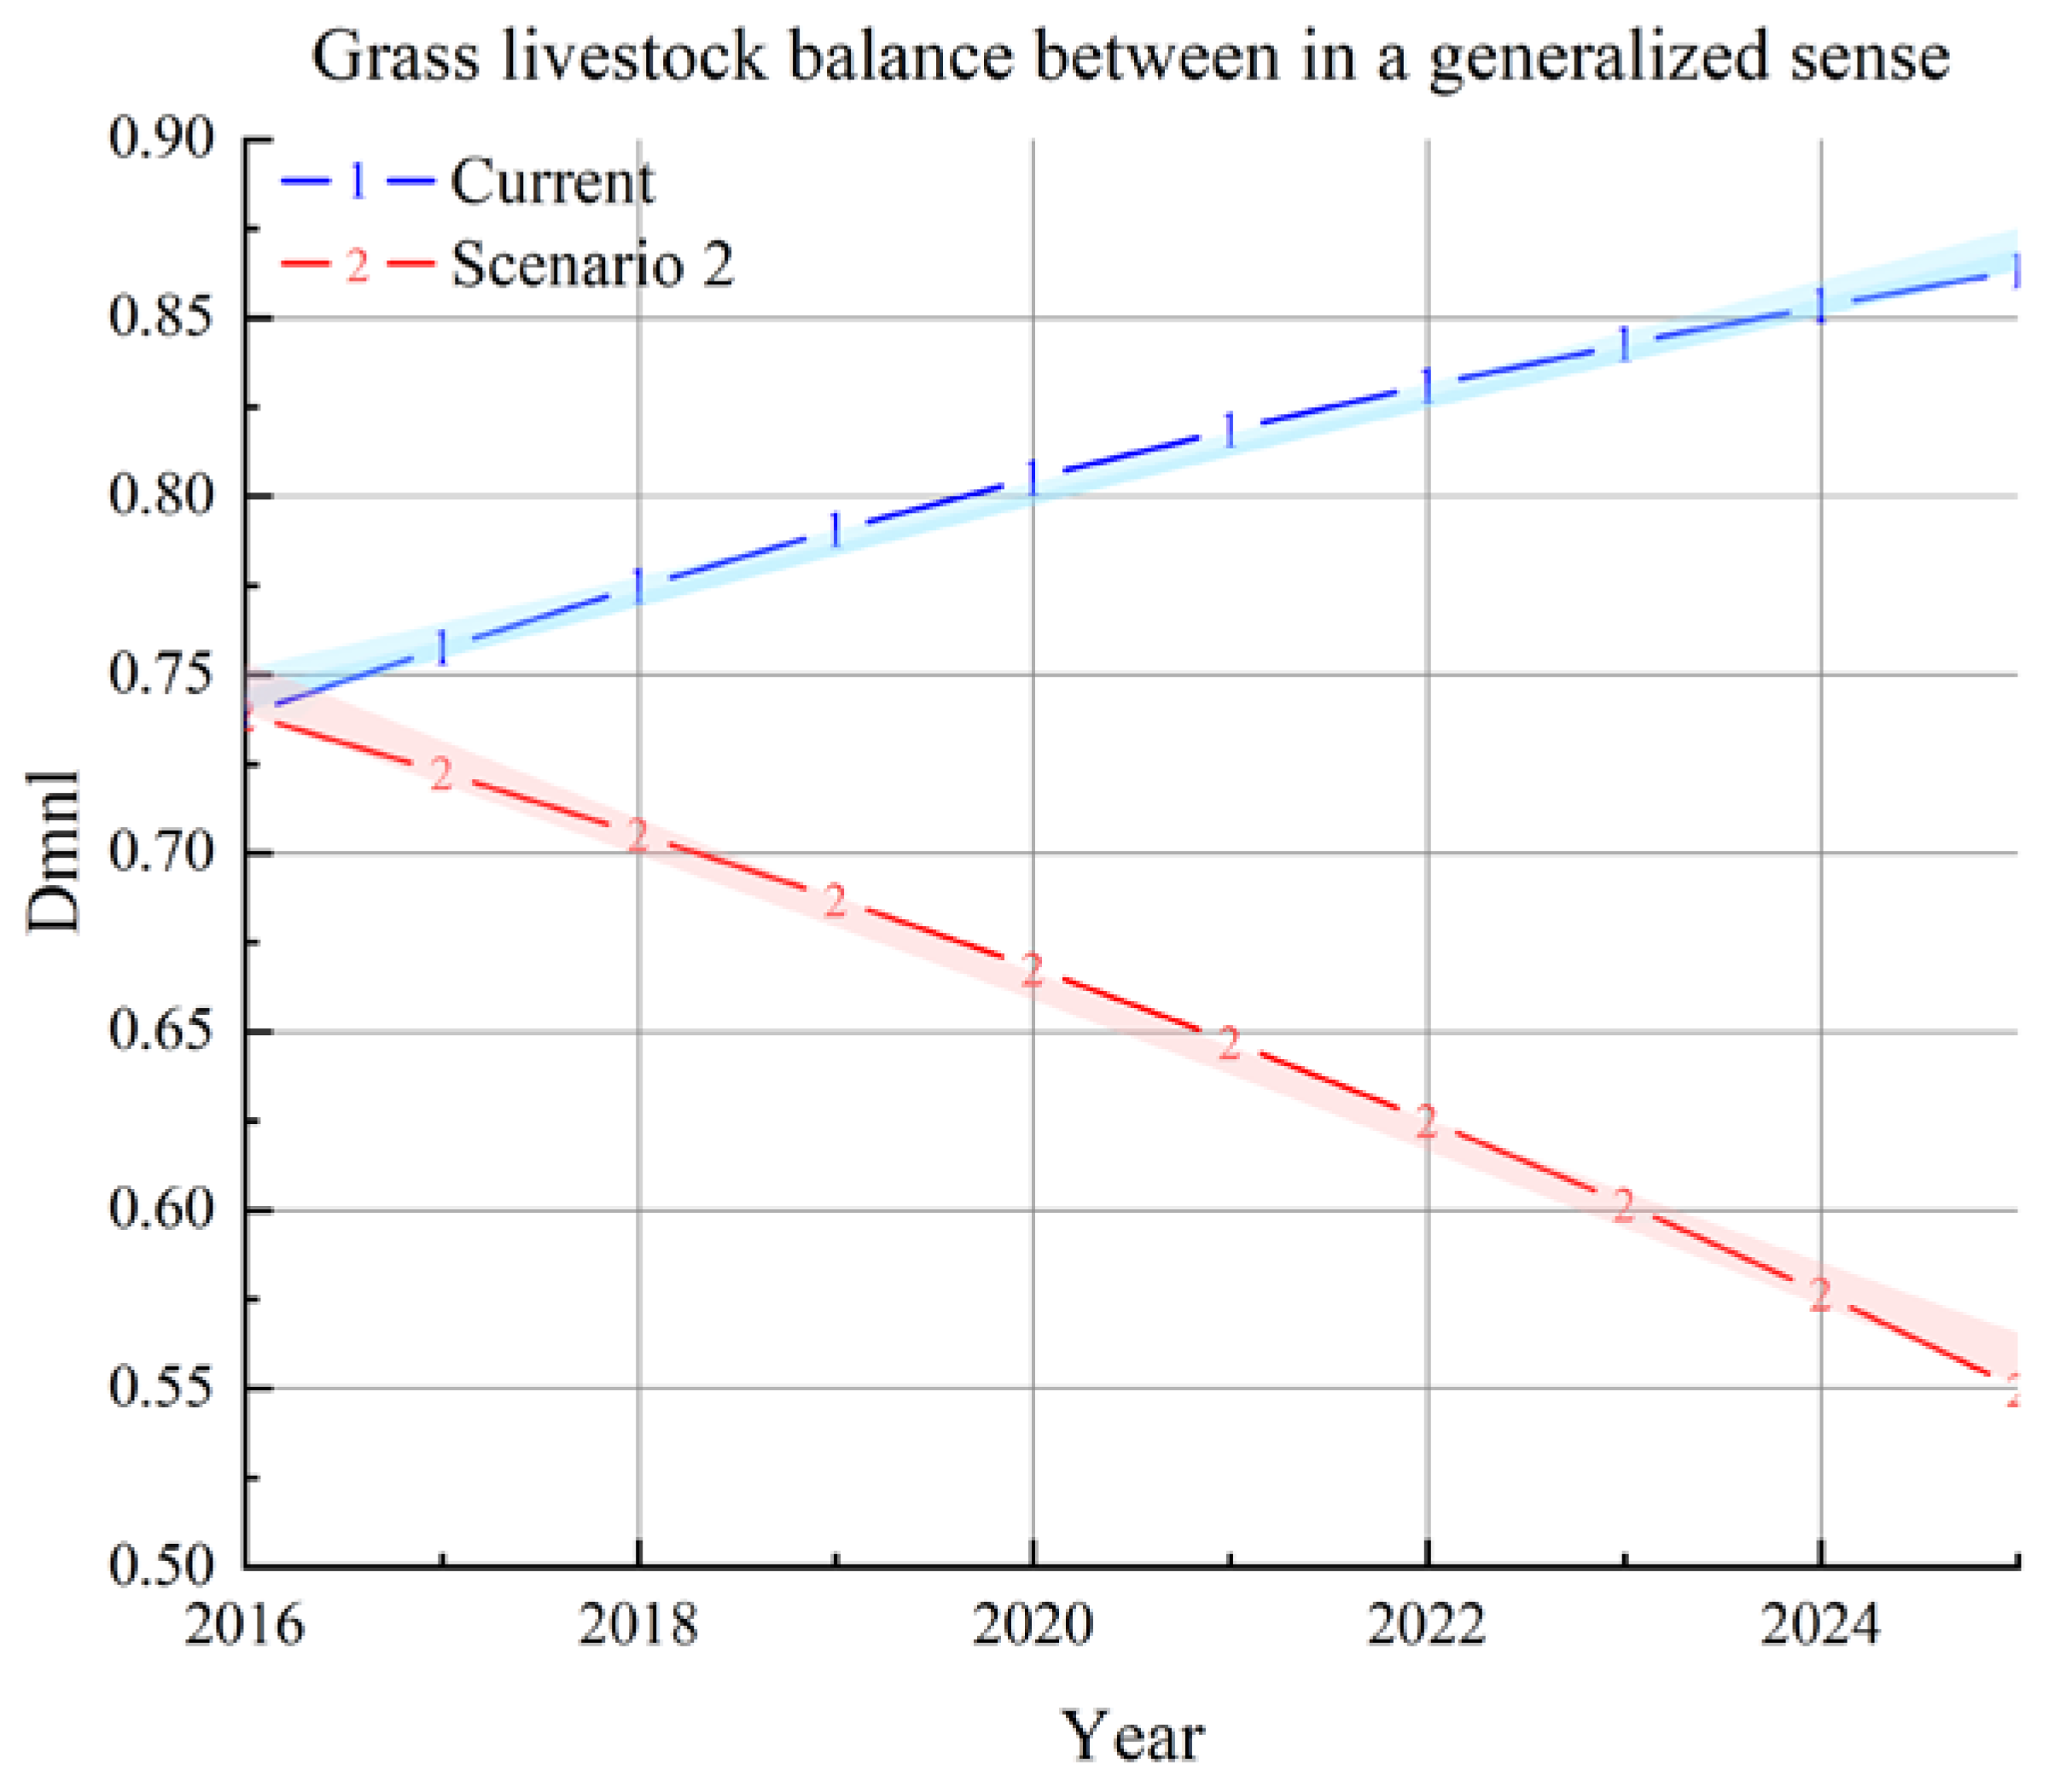
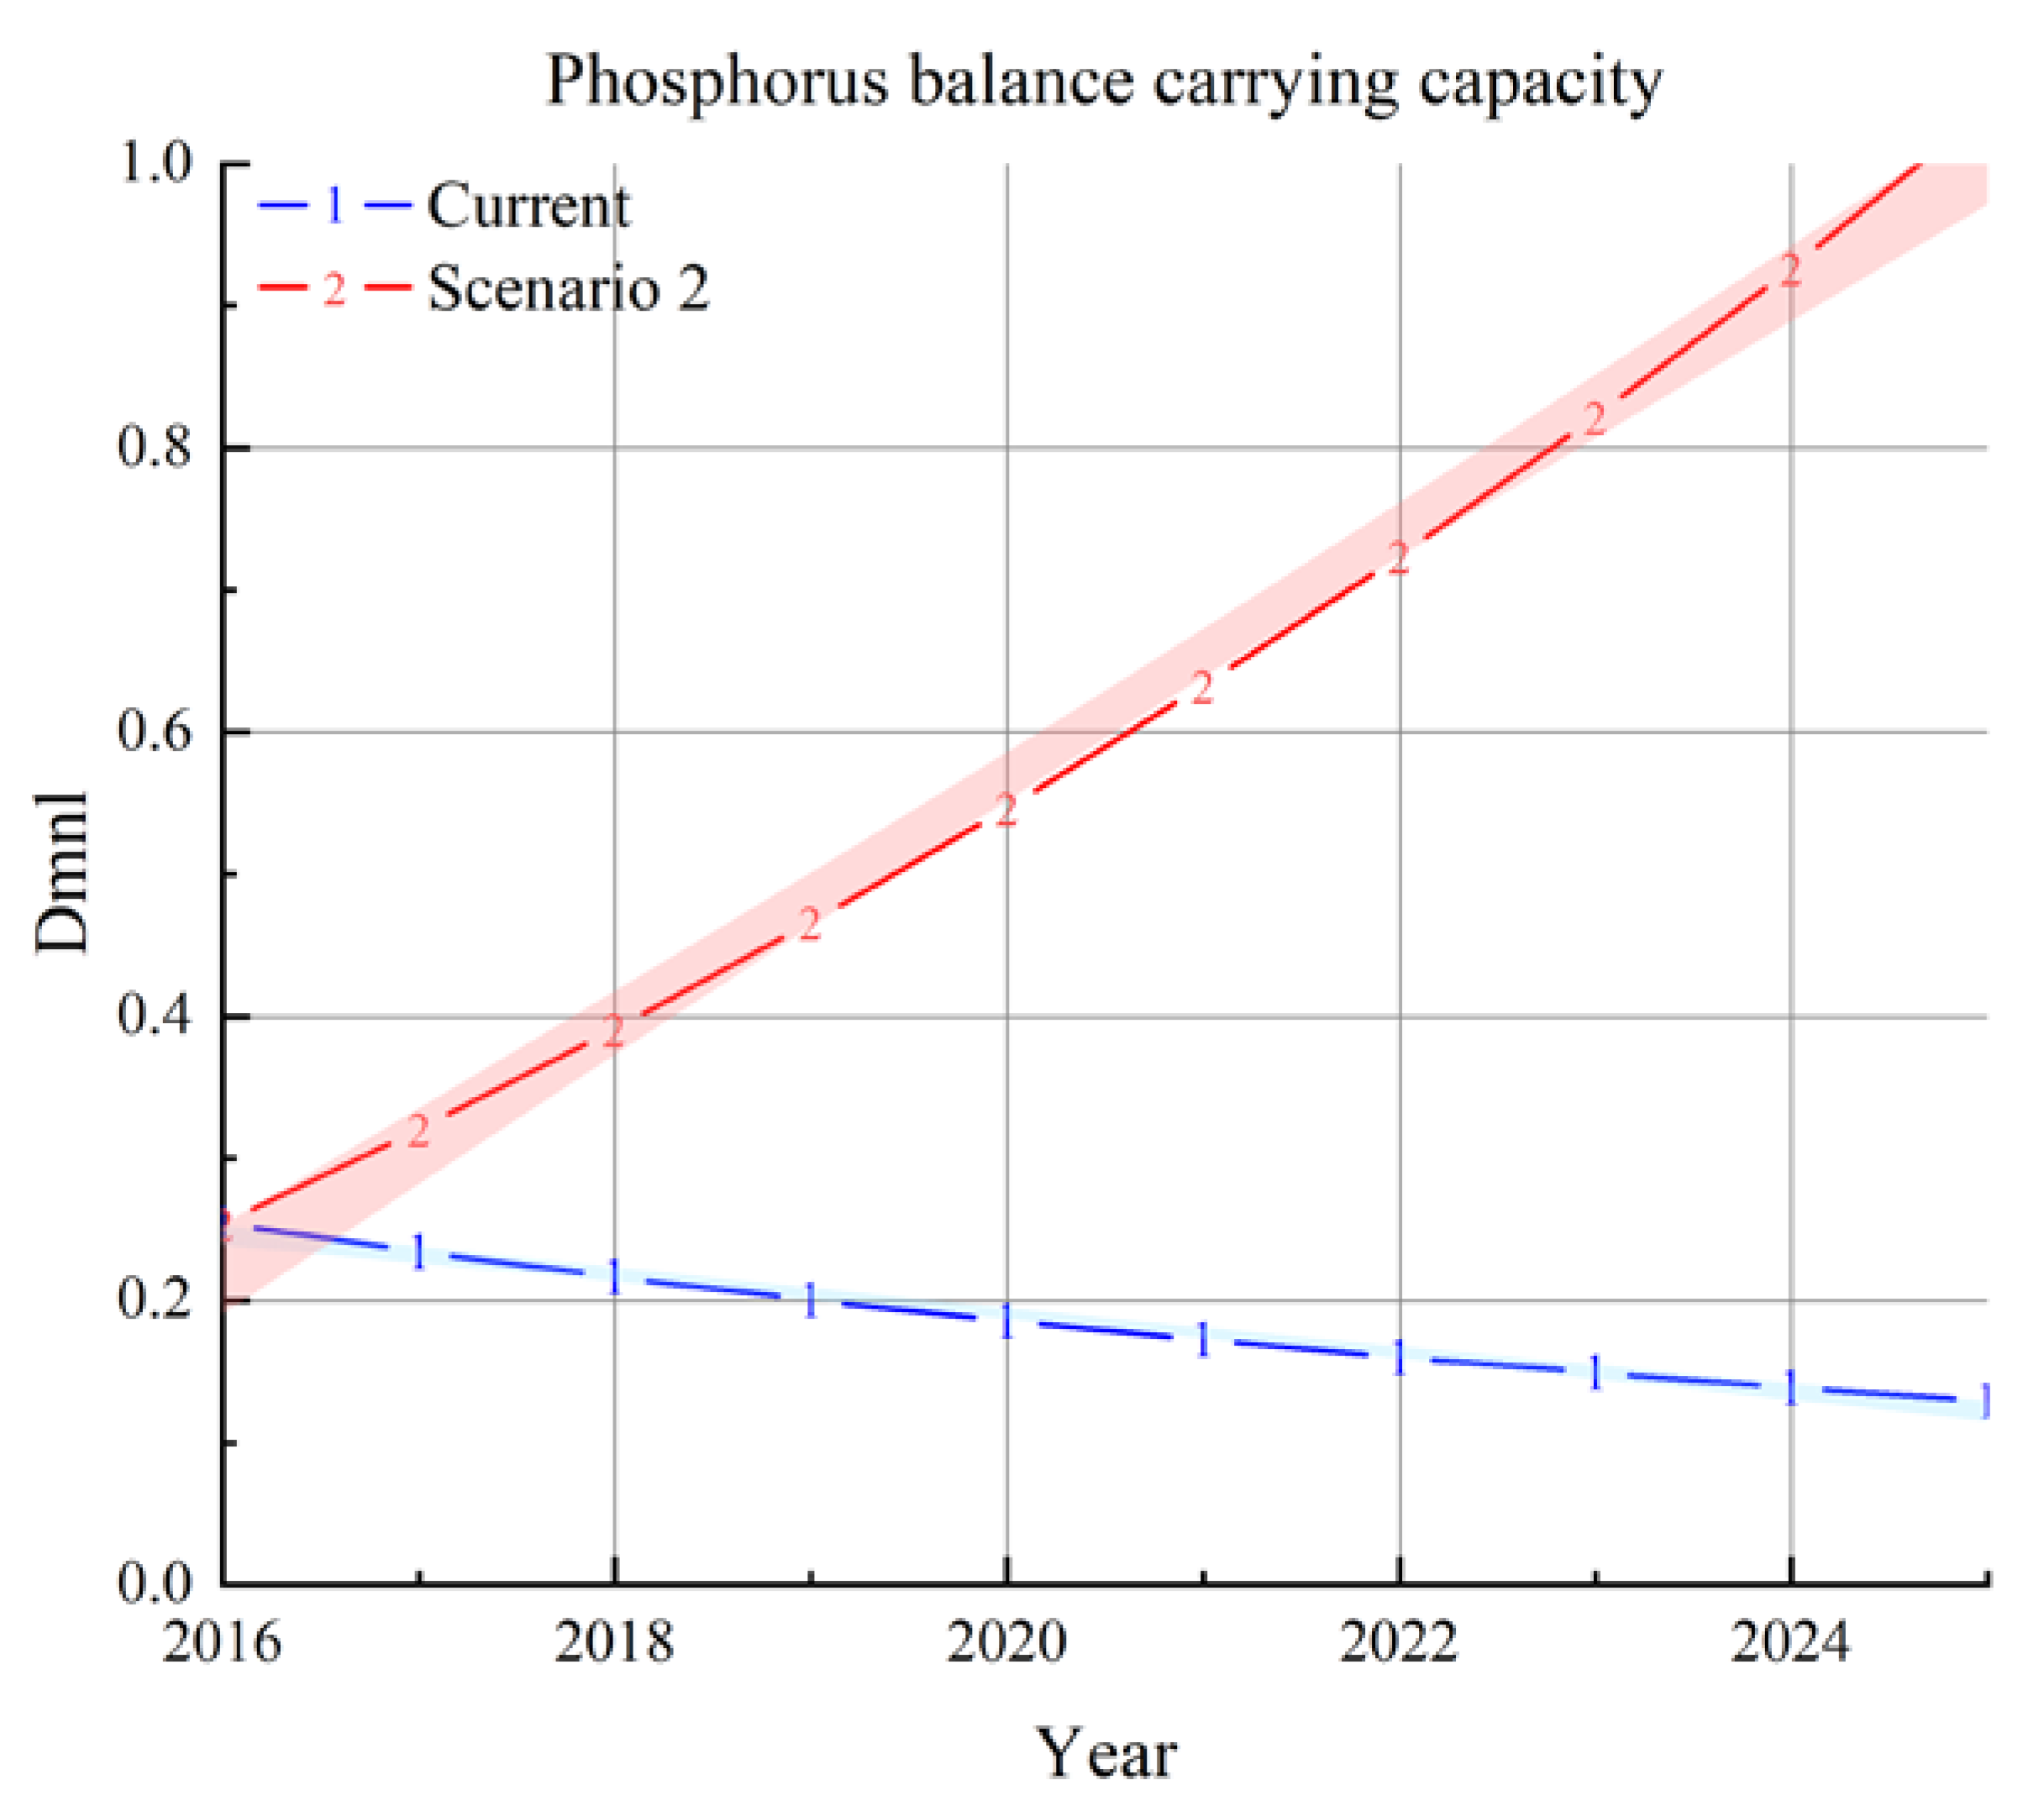
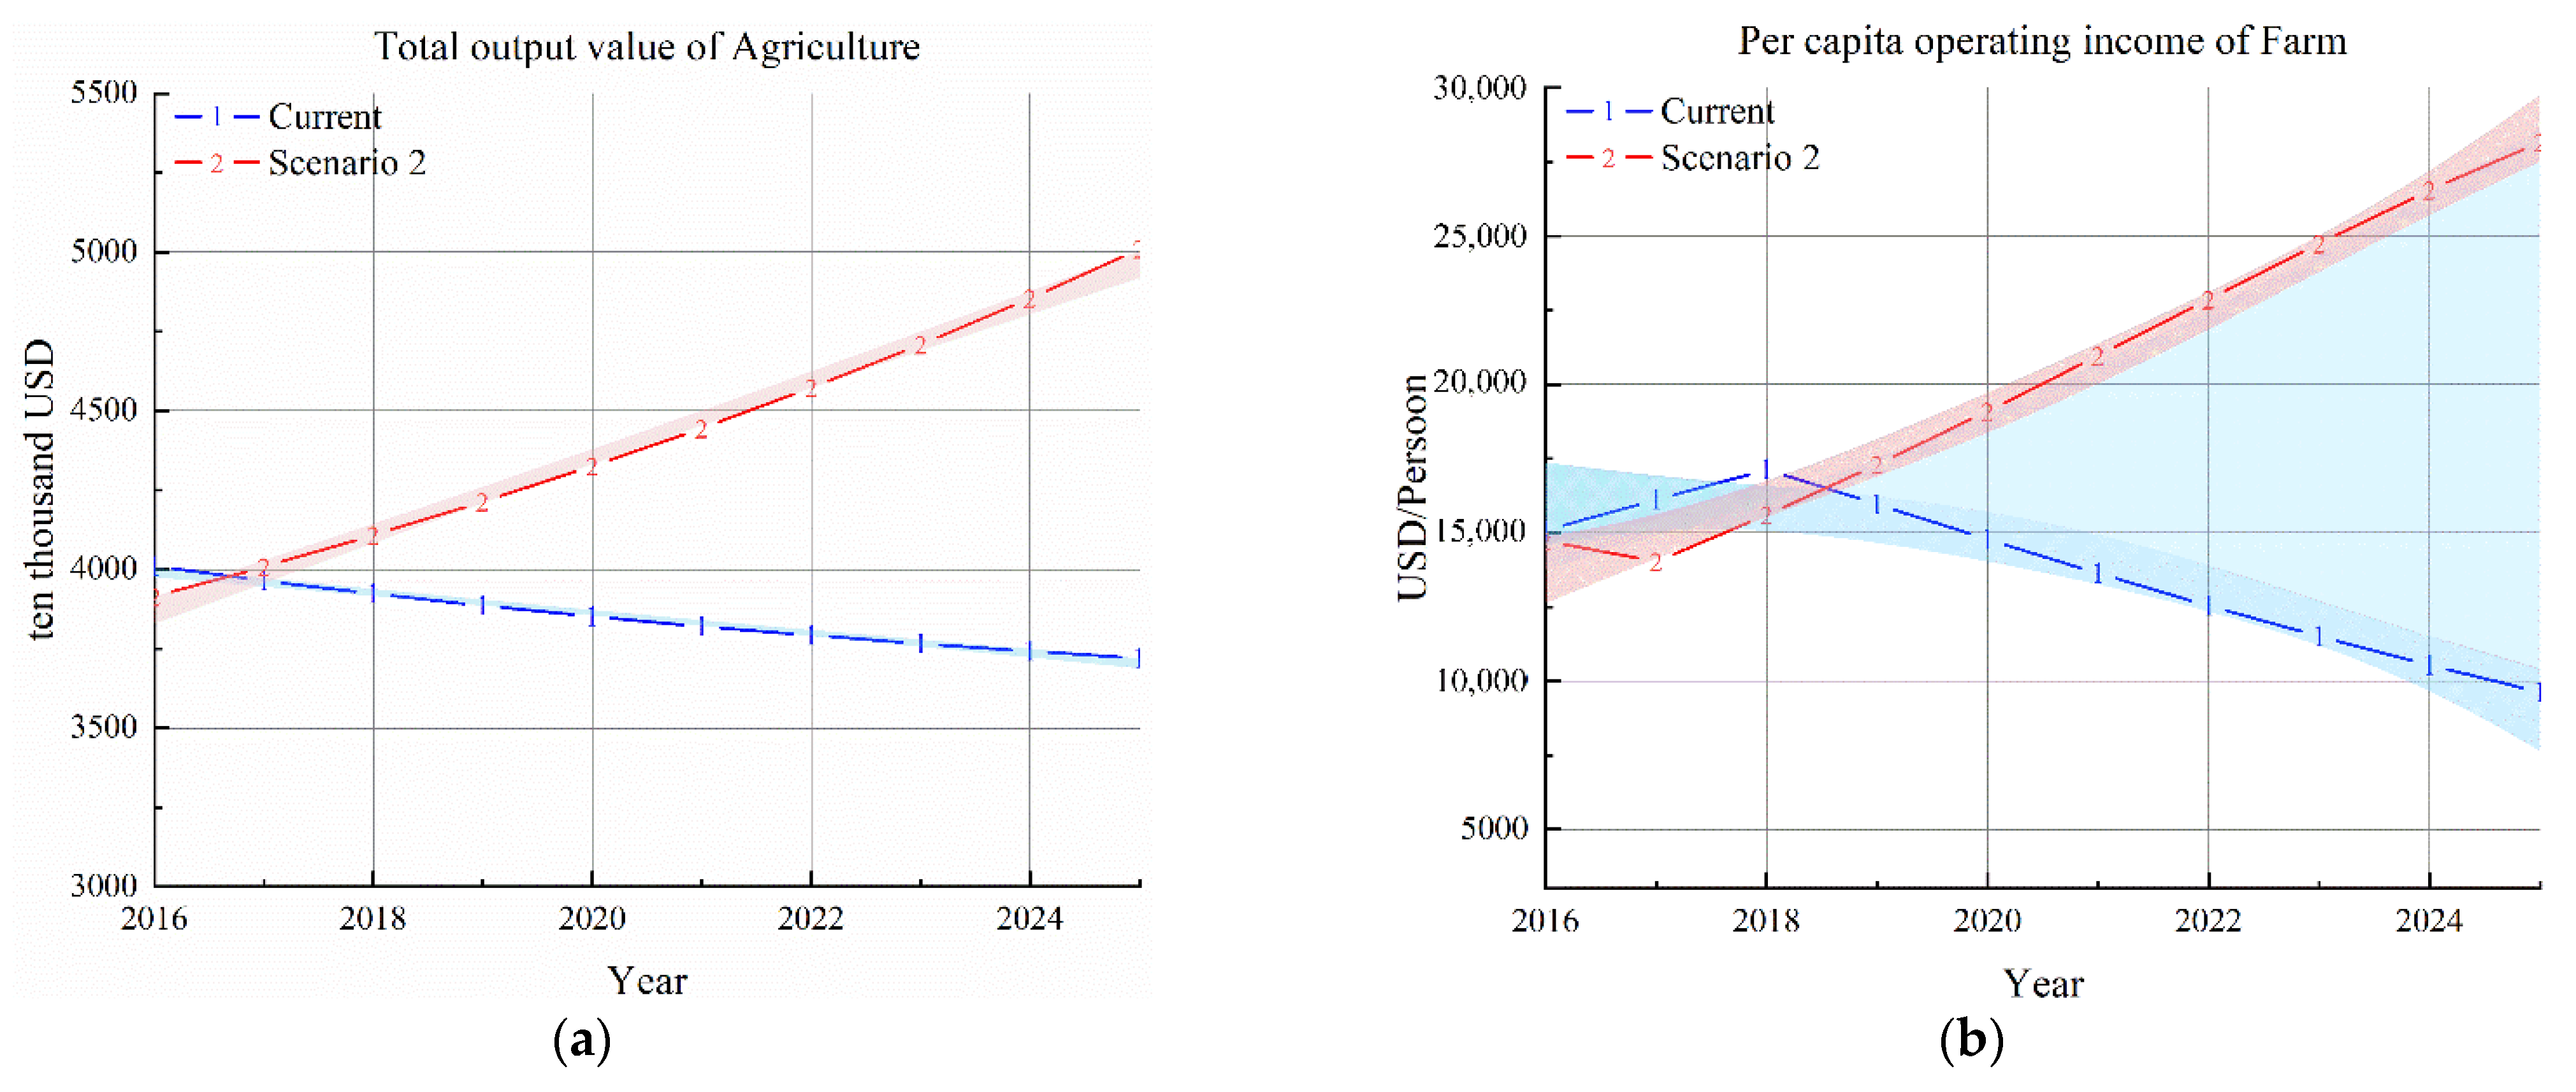
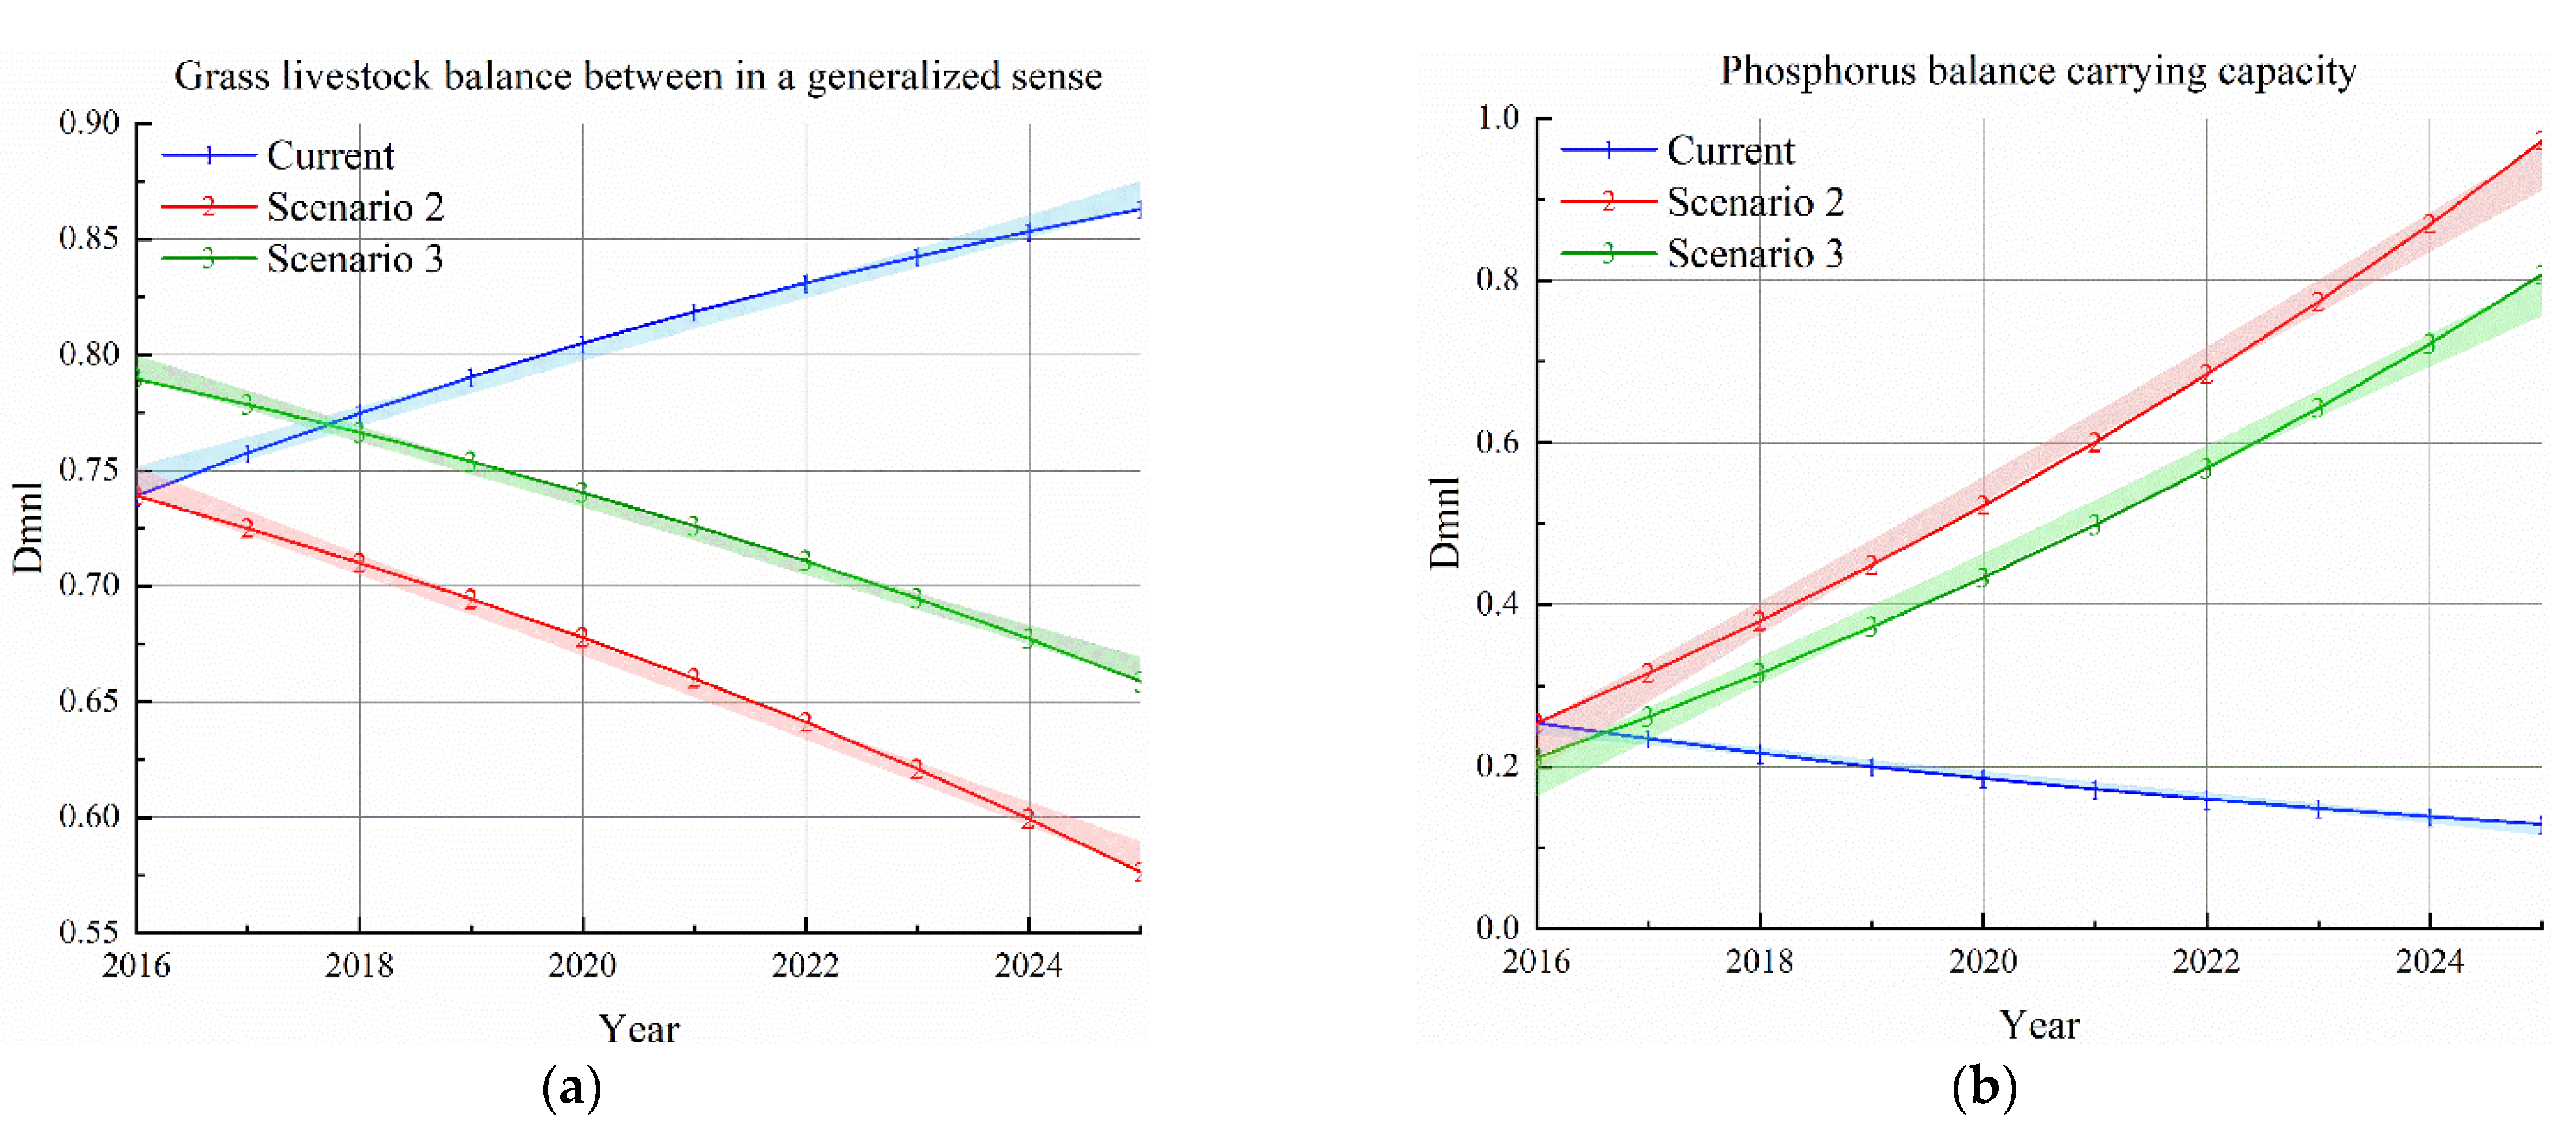
Scenario 2: Strengthen and optimize herbivorous animal husbandry
It is an important step in the optimization of the system dynamics model to find out the sensitive factors in the model that have a greater impact on the system through the system parameter sensitivity analysis. Using VENSIM DSS software, take the group stock of dairy cattle as an example to conduct Monte Carlo sensitivity analysis. The group stock of dairy cattle is essentially determined by the basic cows, and the number of basic cows is affected by two key variables, the rate of death and elimination, and additional project investment. As shown in Figure 12, the manifestation in the software is that all the results fall into the gray area (yellow + blue + green + gray). The larger the gray area, the more sensitive the variable is. In 200 simulations of the two variables that affect the rate of dead scouring and additional investment, it is found that the key factors affecting the number of basic cows of dairy cattle are more reflected in the rate of death and elimination. For additional investment projects, in the absence of additional investment, even if all of the field‘s funds are invested in dairy projects, it cannot change the trend of decline in inventory. Therefore, in terms of system optimization, according to the effectiveness of the strategy, we can give priority to the optimization and adjustment of the death and elimination rate, and for the problem of insufficient private capital, we can consider additional investment through other financing channels to meet the problem of insufficient production capacity. Similarly, according to this method, the key factors affecting the stock of other livestock can be obtained.
Under the condition that other system parameters remain unchanged, adjust the key variables of the subsystem of herbivorous livestock breeding. First of all, the rate of death and elimination of dairy cattle at this stage is about 31.25%, which is an excessively high level of death and elimination. This study visited the Department of Livestock Forestry and Grassland Operations of Hulunbeier Reclamation, and related farms found that the high rate of death was caused by the frequent occurrence of cow hoof disease and mastitis. Not only have some high-yield dairy cows been eliminated, but it has also seriously affected the production of dairy cows. The current average output of the Najitun Farm is about 3.66 t/year, while the normal Holstein dairy cow yield should be 9–12 t/year, the yield in cold regions can also reach at least 5–7 t /year. Therefore, project investment can be adjusted to strengthen the disease prevention and control system, reduce the rate of death and elimination, or else return to the normal level of 20%, and increase the yield to 7 t/year. Secondly, in the study on the stock of mutton sheep, it is found that the lambing rate is more sensitive to the stock, and the actual situation is low, with an average lambing is 0.8, but in other farms, more than one lamb has been achieved. Therefore, the minimum goal of this parameter is to achieve at least one litter and one lamb adjustment. Together with the impact of survival rate, the average lambing rate should be at least 0.9. Finally, relying on large-scale breeding bases appropriately increases the conversion rate of production areas and the added value of products. According to research, the current conversion rate of milk and meat processing is less than 1%. According to the “Hulunbuir Agricultural Reclamation “Fourteenth Five-Year” Industrial Development Strategic Plan” and the processing base of Najitun Farm, the conversion rate of milk, beef, and mutton processing should be at least 20%, 20%, and 40%, so these three coefficients will also be adjusted. With other parameters, such as dairy cattle stock, beef cattle stock, and mutton sheep stock, if there is still room for improvement, additional investment projects will be financed based on the default value of the basic female animal.
Based on adjusting the key variables such as the death rate of dairy cattle, the level of dairy cow yield, the lambing rate of meat sheep, and the conversion rate of dairy meat processing, the project investment of USD 461.91 million (based on 2022 exchange rates) was added, and taking into account the cost differences in the production process of dairy cattle, beef cattle, and meat sheep, the additional investment was allocated to the three livestock breeds in the proportion of 80%, 5%, and 15% respectively, which can just achieve the construction goal of the growth of 5000 dairy cattle in 2025. In addition, the stock of beef cattle and sheep has also achieved stable growth. As shown in Figure 13, under this business strategy, the herd stock of dairy cattle, beef cattle, and meat sheep will be 5,000, 660, and 56,900 head respectively by 2025, an increase of 1026.21%, 47.35%, and 1.92% from 2016, producing 17,500 t, 132.69 t and 523.18 t of milk, beef, and mutton.
First, the development scale of herbivorous animal husbandry. Based on adjusting the key variables, such as the rate of death and elimination of dairy cattle, the yield level of dairy cattle, the lambing rate of mutton sheep, and the conversion rate of milk meat processing, additional project investment of USD 29.35 million (based on 2022 exchange rates) was added. Taking into account the cost difference in the production process of dairy cattle, beef cattle and mutton sheep, the additional investment will be allocated to the three animal species at the proportions of 80%, 5%, and 15%, which can just achieve the goal of building a demonstration ranch with 5000 dairy cows in 2025. In addition, the stock of beef cattle and sheep has also stabilized growth. Specifically, under this business strategy, the stock of dairy cattle, beef cattle and mutton sheep will be 5000 head, 660 head, and 5.69 head, respectively, by 2025, an increase of 1026.21%, 47.35%, and 1.92%, respectively, from 2016. Producing 17,500 t, 132.69 t, and 523.18 t of milk, beef, and mutton.
Second, grass-livestock balance. As shown in Figure 14, due to the expansion of the scale of breeding, about 1.52 tons of soybean meal, vegetable meal and straw, and other agricultural and sideline resources have been developed and utilized, and the grass-livestock balance in a generalized sense index has also shown a downward trend. It will fall to 0.58 by 2025, an average annual decrease of 2.20%, but if the scale of production continues to increase, there may be a problem of insufficient supply and demand for grass sources.
Third, the combination of planting and breeding. As shown in Figure 15, the problem of land carrying pressure caused by the expansion of the breeding scale is even more severe. From the simulation results, by 2025, the phosphorus balance carrying capacity will reach 0.97, which is close to the critical value of overload. Therefore, there is an urgent need to adjust the planting industry structure, cultivate grass crops in cultivated land, and use the phosphorus-loving and phosphorus-consuming characteristics of grass crops to build an ecological land protection grassland agricultural system.
Fourth, society and economy. As shown in Figure 16, under this development strategy, herbivorous animal husbandry can achieve an output value of about 100 million, which is 5.5 times the inertia of the system; in addition, thanks to the development of herbivorous animal husbandry, the total output value of agriculture is on the rise and is expected to grow to UD 5010.53 ten thousand (based on 2022 exchange rates) by 2025, an increase of 28.00% over 2016. From the perspective of income, the per capita income is below systemic inertia in the early stage when the industrial scale has not yet formed. Then, achieved rapid growth, with the per capita income increasing to UD 28,165.96 (based on 2022 exchange rates) per year by 2025, achieving the strategic goal of per capita income exceeding USD 15,735.64 (based on 2022 exchange rates) per year during the “14th Five-Year Plan” period of Hulunbuir Agricultural Reclamation.
3.
Scenario 3: Optimize the structure of grain-cash-grass planting industry structure
On the basis of scenario 2, in accordance with the principle of “stable grain, excellent cash, expand grass”, continue to adjust the structure of the planting industry. The original planting structure of Najitun Farm is single, mainly grain crops, with the proportion of grain crops accounting for 99.59% of the total sown area and only 0.41% of cash crops, and the sown area of grass crops is very small. Planting of the experiment of Artificial Grassland by the Institute of Botany of the Chinese Academy of Sciences showed that increasing the sown area of cash crops and grass crops by 9% and 10%, respectively, could improve the overall efficiency of the planting and husbandry industry [26], and the scale of grass crops planting was configured according to the ratio of 5:3:2 for auena sativa, alfalfa, and silage maize. The results of the adjusted grass-livestock balance and planting-breeding balance are shown in Figure 17. In this scenario, the curve of grass-livestock balance index shifts upward as a whole, providing 38,200 t of grass more than scenario 2, which can provide grass sources for about 58,200 standard sheep units of herbivorous livestock; in terms of planting-breeding balance, the phosphorus carrying capacity balance curve shifts downward as a whole, which is expected to relieve 20.42% of environmental pressure than scenario 2; in addition, in order to stabilize grain crop production, grain crop yields need to be further increased. Specifically, rice yield should be increased from 7.13 t/hm2 to 8.76 t/hm2, wheat yield should be increased from 4.49 t/hm2 to 5.51 t/hm2, corn yield should be increased from 8.25 t/hm2 to 10.14 t/hm2, and soybean yield should be increased from 2.17 t/hm2 to 2.67 t/hm2.
In terms of social economic, as shown in Figure 18, under this development strategy, the economic benefits brought about by the adjustment of the planting industry structure are significant. By 2025, the total agricultural output value will be about USD 70.35 million (based on 2022 exchange rates), which is 1.89 times of the inertia of the system, which is scenario 2. A total of 1.40 times of that, of which grass crops can bring an output value of USD 4.93 million (Based on 2022 exchange rates), and the contribution rate accounts for about 7.00% of the total agricultural output. From the perspective of income, due to the reduction in the scale of grain planting, income will decrease in the short term, but it is still higher than the system inertia and the harvest level of scenario 2 as a whole. At the same time, as the planting scale of cash crops and grass crops expands, the per capita income will gradually rise. By 2025, the per capita income will be USD 29,795.10 (based on 2022 exchange rates), which is USD 1629.10 (based on 2022 exchange rates) higher than scenario 2.

5. Conclusions and Discussion

5.1. Discussion

The idea of expanding herbivorous animal husbandry from pastoral to agricultural areas under ecological constraints has been constantly proposed by society [36,37,38,39]. Related studies have confirmed the trend of a gradual shift in the focus of herbivorous animal husbandry from pastoral to agricultural areas in some countries. However, how to develop herbivorous animal husbandry in agricultural areas has been a difficult problem to overcome. In this study, we investigate the economic, social, and environmental correlations in the development of herbivorous animal husbandry in agricultural areas based on the actual production situation of Najitun Farm in Hulunbuir, China, and comparing the simulation results.
Among them, scenario 2 reveals that the main factors currently inhibiting the de-elopement of herbivorous animal husbandry in the study area are the deficit stocking of females and a high elimination rate of livestock due to epidemic diseases. Such results are consistent with relevant studies on herbivorous animal husbandry in other agricultural areas [40,41,42,43]. Therefore, it is important to implement strategies, such as policy subsidies for female animals, expanding the number of basic animals, and disease prevention. Scenario 3 reveals the strategic importance of cultivated grass as a bridge between planting and breeding. China’s current grain-change-grass strategic plan provides both a source of feed for herbivorous livestock and a nutrient balance, contributing a Chinese solution to the world.
Our study can help researchers or decision-makers to select optimization strategies and provide methodological support for agricultural structure adjustment in the new form. If used in other areas, the appropriate industrial chain and value flow can be explored according to the environmental changes.
Yet, integrative modeling is just one part of a shift towards an informed systemic discussion of herbivorous animal husbandry in agricultural areas and how best to attain it. The model also has measurement inaccuracies. The errors mainly originate from socioeconomic and climate change uncertainties, such as natural disasters, animal diseases, and economic fluctuations [44]. However, uncertainties are often difficult to control [45], so the model was not designed with random variables. It is, however, also useful for projection purposes, and its simplicity and operability are meant to provide further insight to the modeling and analysis process to both policymakers and the general public. As with any model, the hypotheses behind it are critical to its accuracy. New herbivorous animal husbandry research is being published all the time, and the model can continue to be refined and updated as both the research and policy evolves and more historical data are produced.

5.2. Conclusions

In this study, a system dynamics approach was applied to simulate and optimize the development strategy of herbivorous animal husbandry in agricultural areas, using Najitun Farm as the study area. The results of the study show that both maintaining the established industry production pattern and improving production conditions to expand the scale of industry production face problems, such as feed shortage or environmental carrying capacity. The key to solving the above problems is to cultivate grass crops in cultivated land, start with the supply–demand relationship of feed and nutrients, to realize the combination of planting-breeding and circular development. From the systemic perspective’s overall situation, optimization of the grain-cash-grass planting structure can better balance the needs of economic development, increase people’s income, food security, and ecological protection.

Author Contributions

C.H.: conceptualization, methodology, software, writing—original draft preparation and data curation. G.W.: conceptualization, methodology, writing—review and editing. H.Y.: writing—review and editing. All authors have read and agreed to the published version of the manuscript.

Funding

This study was supported by the Major Project of National Social Science Fund of China (No. 21ZDA056), the National Natural Science Foundation of China (No. 41871184) and the Science and Technology Innovation Project of Chinese Academy of Agricultural Sciences (No. 10-IAED-01-2022).

Institutional Review Board Statement

Not applicable.

Informed Consent Statement

Not applicable.

Data Availability Statement

The data presented in this study are available on request from the first author.

Conflicts of Interest

The authors declare no conflict of interest.

References

  1. Wang, G.G.; Wang, M.L.; Wang, J.M.; Yang, C.; Liu, Y.F. Characteristics and influencing factors of grass-feeding livestock breeding in China: An economic geographical perspective. J. Geogr. Sci. 2016, 26, 501–512. [Google Scholar] [CrossRef] [Green Version]
  2. Lin, H.L.; Xiong, X.Y.; Liu, Y.F.; Zhao, Y.T.; Tang, R.; Nyandwi, C. The substitution effect of grass-fed livestock products on grain-fed livestock products from the perspective of supply-side reform in China. Rangel. J. 2020, 43, 377–387. [Google Scholar] [CrossRef]
  3. Fang, J.Y.; Jing, H.C.; Zhang, W.H.; Gao, S.Q.; Duan, Z.Y.; Wang, H.S.; Zhong, J.; Pan, Q.M.; Zhao, K.; Bai, W.M.; et al. The concept of “Grass-based Livestock Husbandry” and its practice in HulunBuir, Inner Mongolia. Chin. Sci. Bull. 2018, 63, 1619–1631. (In Chinese) [Google Scholar] [CrossRef] [Green Version]
  4. Hou, X.Y.; Zhang, Y.J. Analysis on driving factors of improvement of quality and efficiency and transformation development of grasslands and animal husbandry industry. Chin. Sci. Bull. 2018, 63, 1632–1641. (In Chinese) [Google Scholar] [CrossRef] [Green Version]
  5. Rietra, R.; Heinen, M.; Oenema, O. A Review of Crop Husbandry and Soil Management Practices Using Meta-Analysis Studies: Towards Soil-Improving Cropping Systems. Land 2022, 11, 255. [Google Scholar] [CrossRef]
  6. Zhou, Z.Y.; Tian, W.M. Malcolm, B. Supply and demand estimates for feed grains in China. Agric. Econ. 2010, 39, 111–122. [Google Scholar] [CrossRef]
  7. Fang, J.Y.; Bai, Y.F.; Li, L.H.; Jiang, G.M.; Huang, J.H.; Huang, Z.Y.; Zhang, W.H.; Gao, S.Q. Scientific basis and practical ways for sustainable development of China’s pasture regions. Chin. Sci. Bull. 2016, 61, 155–164. (In Chinese) [Google Scholar]
  8. Bai, W.M.; Hou, L.Y.; Song, S.H.; Mao, X.T.; Zhang, Q.Q.; Pan, Q.M.; Zhou, Q.P.; Zhang, W.H. Optimal formula feed is a key for efficient transformation of forage to animal products in grass-based livestock husbandry. Chin. Sci. Bull. 2018, 63, 1686–1692. (In Chinese) [Google Scholar] [CrossRef] [Green Version]
  9. Liu, W.J. Strategies on Integrated Development of Agriculture-Forestry-Grass-Grazing in the Loess Plateau of China. Sci. Agric. Sin. 2012, 45, 4501–4507. (In Chinese) [Google Scholar]
  10. Huang, L.; Ning, J.; Zhu, P.; Zheng, Y.H.; Zhai, J. The conservation patterns of grassland ecosystem in response to the forage-livestock balance in North China. J. Geogr. Sci. 2021, 31, 518–534. [Google Scholar] [CrossRef]
  11. Duryee; William, B. Farming for Security. Soil Sci. 1943, 56, 67. [Google Scholar] [CrossRef]
  12. Bender, B.C. Grassland Farming. J. Dairy Sci. 1956, 39, 764–768. [Google Scholar] [CrossRef]
  13. Spedding, C.R.; Betts, J.E.; Large, R.V.; Wilson, I.A.N.; Penning, P.D. Productivity and intensive sheep stocking over a 5-year period. J. Agric. Sci. 1967, 69, 47–69. [Google Scholar] [CrossRef]
  14. Dowle, K.; Doyle, C.J.; Spedding, A.W.; Pollott, G.E. A model for evaluating grassland management decisions on beef and sheep farms in the UK. Agric. Syst. 1988, 28, 299–317. [Google Scholar] [CrossRef]
  15. Zhang, W.S.; Li, F.M.; Xiong, Y.C.; Xia, Q. Econometric analysis of the determinants of adoption of raising sheep in folds by farmers in the semiarid Loess Plateau of China. Ecol. Econ. 2012, 74, 145–152. [Google Scholar] [CrossRef]
  16. Lei, Y.D.; Zhang, H.L.; Chen, F.; Zhang, L.B. How rural land use management facilitates drought risk adaptation in a changing climate—A case study in arid northern China. Sci. Total Environ. 2016, 550, 192–199. [Google Scholar] [CrossRef]
  17. Li, F.J.; Dong, S.C.; Li, F. A system dynamics model for analyzing the eco-agriculture system with policy recommendations. Ecol. Model. 2012, 227, 34–45. [Google Scholar] [CrossRef]
  18. Tian, Z.; Ji, Y.H.; Xu, H.Q.; Qiu, H.G.; Sun, L.X.; Zhong, H.L.; Liu, J.G. The potential contribution of growing rapeseed in winter fallow fields across Yangtze River Basin to energy and food security in China. Resour. Conserv. Recycl. 2021, 164, 105159. [Google Scholar] [CrossRef]
  19. Li, X.L.; Shen, Y.Y.; Wan, L.Q. Potential Analysis and Policy Recommendations for Restructuring the Crop Farming and Developing Forage Industry in China. Eng. Sci. 2016, 18, 94–105. (In Chinese) [Google Scholar]
  20. Zhao, Z.; Bai, Y.P.; Deng, X.Z.; Chen, J.C.; Hou, J.; Li, Z.H. Changes in Livestock Grazing Efficiency Incorporating Grassland Productivity: The Case of Hulun Buir, China. Land 2020, 9, 447. [Google Scholar] [CrossRef]
  21. Unkovich, M.; Nan, Z. Problems and prospects of grassland agroecosystems in western China. Agric. Ecosyst. Environ. 2008, 124, 1–2. [Google Scholar] [CrossRef]
  22. Yang, Y.J.; Wang, K.; Liu, D.; Zhao, X.Q.; Fan, J.W. Effects of land-use conversions on the ecosystem services in the agro-pastoral ecotone of northern China. J. Clean. Prod. 2020, 249, 6710638. [Google Scholar] [CrossRef]
  23. Pollock, D.S.G.; Pitta, E. The misspecification of dynamic regression models. J. Stat. Plan. Inference 1996, 49, 223–239. [Google Scholar] [CrossRef] [Green Version]
  24. Zhai, R.X.; Liu, Y.S. Dynamic evolvement of agricultural system and typical patterns of modern agriculture in coastal China: A case of Suzhou. Chin. Geogr. Sci. 2009, 19, 249–257. [Google Scholar] [CrossRef] [Green Version]
  25. Hu, Z.M.; Zhao, Z.; Zhang, Y.; Jing, H.C.; Gao, S.Q.; Fang, J.Y. Does ‘Forage-Livestock Balance’ policy impact ecological efficiency of grasslands in China? J. Clean. Prod. 2019, 207, 343–349. [Google Scholar] [CrossRef]
  26. Kuang, W.H.; Yan, H.M.; Zhang, S.W.; Li, X.Y.; Bao, Z.Y.; Ning, J.; Zhang, P.A.; Fan, B.; Wang, S.S. Forage-livestock status in farms and ranches of ecological grass-animal husbandry construction and allocation model of grain-warp-feed in Hulunbuir Agricultural Reclamation Group. Chin. Sci. Bull. 2018, 63, 1711–1721. (In Chinese) [Google Scholar] [CrossRef] [Green Version]
  27. Li, M.J.; Li, Z.H.; Bao, Y.J.; Zhang, J.; Liu, L.; Li, Z.L. The Study on Grassland Carrying Capacity and Regulatory Approaches of Livestock-feeds Balance in Hulunbuir Grassland. Chin. J. Grassl. 2016, 38, 72–78. (In Chinese) [Google Scholar]
  28. Peng, L.H.; Bai, Y. Numerical study of regional environmental carrying capacity for livestock and poultry farming based on planting-breeding balance. J. Environ. Sci. 2013, 25, 1882–1889. [Google Scholar] [CrossRef]
  29. Truog, E. Fifty years of soil testing. In Transactions of the 7th International Congress of Soil Science; Madison, WI, USA, 1960; pp. 46–53. [Google Scholar]
  30. Li, P.C.; Han, C.J.; Shi, Z.Z.; Wang, M.L. Early warning of farmland pollution caused by livestock and poultry feces in China and analysis of gover-nance model effectiveness based on the balance between planting and breeding. J. Agro-Environ. Sci. 2020, 39, 628–637. (In Chinese) [Google Scholar]
  31. Walker, W.E.; Harremoës, P.; Rotmans, J.; van der Sluijs, J.P.; van Asselt, M.B.A.; Janssen, P.; Krayer von Krauss, M.P. Defining Uncertainty: A Conceptual Basis for Uncertainty Management in Model-Based Decision Support. Integr. Assess. 2003, 4, 5–17. [Google Scholar] [CrossRef] [Green Version]
  32. Turner, B.L.; Wuellner, M.; Nichols, T.; Gates, R.; Tedeschi, L.O.; Dunn, B.H. Development and evaluation of a system dynamics model for investigating agriculturally driven land transformation in the north central United States. Nat. Resour. Modeling 2016, 29, 179–228. [Google Scholar] [CrossRef]
  33. Wu, Y.; Li, M.; Liu, L.; Zhang, Y.; Liu, L.; Wang, L. Spatial-temporal allocation of regional land consolidation project based on landscape pattern and system dynamics. Clust. Comput. 2017, 20, 3147–3160. [Google Scholar] [CrossRef]
  34. Azad, S.M.; Khodabakhsh, P.; Roshannafas, F.; Ghodsypour, S.H. Modelling techno-sectoral innovation system A new hybrid approach for innovation motors policymaking. Kybernetes 2020, 49, 332–361. [Google Scholar] [CrossRef]
  35. Guo, L.L.; Wu, C.Y.; Yu, J.T.; Qu, Y. Dynamic simulation analysis of green growth mode in China. Syst. Eng.-Theory Pract. 2017, 37, 2119–2130. (In Chinese) [Google Scholar]
  36. Hayek, M.N.; Garrett, R.D. Nationwide shift to grass-fed beef requires larger cattle population. Environ. Res. Lett. 2018, 13, 084005. [Google Scholar] [CrossRef]
  37. Tsutsumi, M.; Ono, Y.; Ogasawara, H.; Hojito, M. Life-cycle impact assessment of organic and non-organic grass-fed beef production in Japan. J. Clean. Prod. 2018, 172, 2513–2520. [Google Scholar] [CrossRef]
  38. Teague, R.; Kreuter, U. Managing Grazing to Restore Soil Health, Ecosystem Function, and Ecosystem Services. Front. Sustain. Food Syst. 2020, 4, 534187. [Google Scholar] [CrossRef]
  39. Han, C.; Wang, G.; Zhang, Y.; Song, L.; Zhu, L. Analysis of the temporal and spatial evolution characteristics and influencing factors of China’s herbivorous animal husbandry industry. PLoS ONE 2020, 15, e0237827. [Google Scholar] [CrossRef]
  40. Oltjen, J.W.; Beckett, J.L. Role of ruminant livestock in sustainable agricultural systems. J. Anim. Sci. 1996, 74, 1406–1409. [Google Scholar] [CrossRef]
  41. Kruska, R.; Reid, R.S.; Thornton, P.K.; Henninger, N.; Kristjanson, P.M. Mapping livestock-oriented agricultural production systems for the developing world. Agric. Syst. 2003, 77, 39–63. [Google Scholar] [CrossRef]
  42. Herrero, M.; Thornton, P.K.; Notenbaert, A.M.; Wood, S.; Msangi, S.; Freeman, H.; Bossio, D.; Dixon, J.; Peters, M.; van de Steeg, J. Smart investments in sustainable food production: Revisiting mixed crop-livestock systems. Science 2010, 327, 822–825. [Google Scholar] [CrossRef] [PubMed] [Green Version]
  43. Eisler, M.C.; Lee, M.R.; Tarlton, J.F.; Martin, G.B.; Beddington, J.; Dungait, J.A.; Greathead, H.; Liu, J.; Mathew, S.; Miller, H.; et al. Agriculture: Steps to sustainable livestock. Nature 2014, 507, 32–34. [Google Scholar] [CrossRef] [PubMed] [Green Version]
  44. Donges, J.F.; Lucht, W.; Heitzig, J.; Barfuss, W.; Schlüter, M. Taxonomies for structuring models for World-Earth system analysis of the Anthropocene: Subsystems, their interactions and social-ecological feedback loops. Earth Syst. Dyn. Discuss. 2021, 12, 1115–1137. [Google Scholar] [CrossRef]
  45. Ding, Y.; Wang, L.; Li, Y.; Li, D. Model predictive control and its application in agriculture: A review. Comput. Electron. Agric. 2018, 151, 104–117. [Google Scholar] [CrossRef]
Figure 1. The location of the study area (Najitun Farm, China).
Land 11 00691 g001
Figure 2. The relationship between the subsystems of the herbivorous animal husbandry development system in the agricultural area.
Land 11 00691 g002
Figure 3. Herbivorous livestock breeding subsystem.
Land 11 00691 g003
Figure 4. Planting industry structure adjustment subsystem.
Land 11 00691 g004
Figure 5. Land carrying capacity subsystem.
Land 11 00691 g005
Figure 6. Socio-economic subsystem.
Land 11 00691 g006
Figure 7. The simulation results of the dairy cattle stock at different time steps from 2016 to 2025.
Land 11 00691 g007
Figure 8. The simulation results of the population of dairy cows, beef cattle, and mutton sheep. (a) The predicted value of dairy cattle stock; (b) the predicted value of beef cattle stock; (c) the predicted value of sheep stock. In the figure, the light-colored bands are the confidence bands corresponding to the 95% confidence intervals of the color curves, as follows, without further elaboration.
Land 11 00691 g008
Figure 9. Simulation results of the grass-livestock balance in the narrow sense and grass-livestock balance in the generalized sense. (a) Grass-livestock balance in a narrow sense; (b) grass-livestock balance in a generalized sense.
Land 11 00691 g009
Figure 10. Simulation results of phosphorus balance carrying capacity.
Land 11 00691 g010
Figure 11. Simulation results of total agricultural output value and per capita income. (a) Total output value of agriculture; (b) per capita operating income of farm.
Land 11 00691 g011
Figure 12. Monte Carlo analysis of the impact of dairy cattle death and elimination rate and additional investment on the number of basic cows. (a) Monte Carlo analysis of the impact of dairy cattle death and elimination rate; (b) Monte Carlo analysis of additional investment.
Land 11 00691 g012
Figure 13. The output of simulation results of dairy cattle, beef cattle, and mutton sheep stocks under scenario 2. (a) Dairy cattle stock; (b) beef cattle stocks; (c) sheep stocks.
Land 11 00691 g013
Figure 14. Generalized grass-livestock balance simulation result output under scenario 2.
Land 11 00691 g014
Figure 15. The output of simulation results of planting and breeding balance under scenario 2.
Land 11 00691 g015
Figure 16. Simulation results of total agricultural output value and per capita income under scenario 2. (a) Total output value of agriculture; (b) per capita operating income of farm.
Land 11 00691 g016
Figure 17. Simulation results of generalized grass-livestock balance and planting-breeding balance under scenario 3. (a) Grass-livestock balance in a generalized sense; (b) phosphorus balance carrying capacity.
Land 11 00691 g017
Figure 18. Simulation results of total agricultural output value and per capita income under scenario 3. (a) Total output value of agriculture; (b) per capita operating income of the farm.
Land 11 00691 g018
Table 1. Production of livestock and poultry feces, feeding cycle, and average phosphorus content.
ProjectFeces (kg/d)Phosphorus (kg/t)
Meat cattle29.861.18
Dairy cattle21.921.18
Note: The production and feeding cycle parameters of cattle and sheep feces come from the actual measured values of Najitun Farm; the average content of phosphorus in cattle and sheep feces refers to the recommended value of “livestock and poultry manure resource utilization technology; planting and breeding combination mode” at the National Animal Husbandry Station.
Table 2. Recommended values of phosphorus required for different plants to form 100 kg yield.
Types of CropsPhosphorus (kg)Types of CropsPhosphorus (kg)
Wheat1.000Fruits and vegetables0.089
Corn0.300Medicinal materials0.532
Paddy0.800Alfalfa0.200
Soybeans0.748Feed oats0.800
Tubers0.088Whole plant silage corn0.300
Oil0.887Natural grass0.200
Sugar0.062
Note: In the above table, the amount of phosphorus absorbed by grain crops, crash crops, and grass crops per 100 kg yield needs to be referred to as ‘Technical Guide for Measuring the Bearing Capacity of Livestock and Poultry Manure Land’.
Table 3. Initial values of key parameters of the development system model of herbivorous animal husbandry in agricultural areas.
Serial
Number
Input ParametersUnitParameter TypeInitial Value
1Herd of dairy cowsHeadLevel 444
2Number of employees in herbivorous animal husbandryPopulationLevel 560
3Number of employees in plantationPopulationLevel 6681
4Meat sheep industry processing conversion rate%Rate 10
5Dairy processing conversion rate%Rate 10
6Annual slaughter rate of mutton sheep%Rate 51.10
7The yearly death rate of dairy cows%Rate 31.20
8The annual yield rate of beef cattle%Rate 67
9The proportion of basal dams of dairy cows%Auxiliary 50
10The proportion of young dairy cattle%Auxiliary 15
111 sheep unit daily eclipsekgconstant1.8
12The technical parameters of organic fertilizer that can be produced from mutton manure%constant50
13Beef manure that can produce organic fertilizer technical parameters%constant25
14Meal yield per kilogram of rapeseed meal%constant60
15Meal yield per kilogram of beet meal%constant5
16Requirement of silage corn in the basic female year of dairy cowskg/headconstant3720
17Annual corn silage demand for beef fattening cattle (7 months)kg/headconstant3300
18Corn silage priceUSD/kg constant0.05
19Feed oat pricesUSD/kgconstant0.24
20Production value of primary milk productsUSD/tconstant527.04
Table 4. Historical test results of a system dynamic model of herbivorous animal husbandry system in agricultural areas.
VariableUnitValueYearAverage Error (%)
2016201720182019
Population
stock
of dairy cattle
HeadMV444.00460.00390.00354.004.36
HeadPV444.00420.69398.60377.68
%RE0.00%8.55%2.21%6.69%
Population
stock
of mutton sheep
HeadMV55,80857,81250,69643,8044.40
HeadPV55,80852,113.548,663.645,442.1
%RE0.00%9.86%4.01%3.74%
Fresh milk
production
tMV750.00816.00778.00740.006.71
tPV812.52769.86729.44691.15
%RE8.34%5.65%6.24%6.60%
Planting industry
practitioners
PopulationMV6681.006195.005208.005525.004.05
PopulationPV6681.006052.995484.015999.50
%RE0.00%2.29%5.30%8.59%
Herbivorous
animal husbandry
Practitioners
PopulationMV560.00590.00711.00590.005.67
PopulationPV560648.48750.9398632.2913
%RE0.00%9.91%5.62%7.17%
Note: MV, SV, and RE were measured vale, simulated value, and relative error.
Table 5. Simulation scenario settings for the development system model of herbivorous animal husbandry in agricultural areas.
Scenario NameModel Adjustment
Scenario 1: system inertiaThe original data and parameters of the model are unchanged.
Scenario 2: strengthen and optimize herbivore and livestock husbandryOn the basis of system inertia, by increasing investment and expanding the number of basic cows, the planning goal of the steady growth of 5000 dairy cattle, beef cattle, and mutton sheep stock in the whole farm is realized. In addition, by strengthening epidemic prevention and control, it reduce the death and elimination rate of livestock and improves yield.
Scenario 3: optimize the structure of grain-cash-grass planting industry structureBased on scenario 2, from the perspective of “stabilizing grain crops, optimizing cash crops and expanding grass crops”, continue to optimize the grain-cash-grass planting structure, on the one hand, ensure the supply of grass and ensure the balance of grass and livestock. On the other hand, increase the nutrient consumption of crops and realize the balance of planting and breeding through the adjustment of planting structure.
Publisher’s Note: MDPI stays neutral with regard to jurisdictional claims in published maps and institutional affiliations.

